Review

Scanning Probe Microscope-Based Fluid Dispensing

by
Murali Krishna Ghatkesar
1,*,†,
Hector Hugo Perez Garza
1,†,
Friedjof Heuck
2,† and
Urs Staufer
1
1
Precision and Microsystems Engineering, Delft University of Technology, Mekelweg 2, 2628 CD Delft, The Netherlands
2
Robert Bosch GmbH, Robert Bosch Platz 1, 70839 Gerlingen-Schillerhoehe, Germany
*
Author to whom correspondence should be addressed.
These authors contributed equally to this work.
Micromachines 2014, 5(4), 954-1001; https://doi.org/10.3390/mi5040954
Submission received: 26 July 2014 / Revised: 23 September 2014 / Accepted: 1 October 2014 / Published: 30 October 2014

Abstract

:
Advances in micro and nano fabrication technologies have enabled fabrication of smaller and more sensitive devices for applications not only in solid-state physics but also in medicine and biology. The demand for devices that can precisely transport material, specifically fluids are continuously increasing. Therefore, integration of various technologies with numerous functionalities in one single device is important. Scanning probe microscope (SPM) is one such device that has evolved from atomic force microscope for imaging to a variety of microscopes by integrating different physical and chemical mechanisms. In this article, we review a particular class of SPM devices that are suited for fluid dispensing. We review their fabrication methods, fluid-pumping mechanisms, real-time monitoring of dispensing, physics of dispensing, and droplet characterization. Some of the examples where these probes have already been applied are also described. Finally, we conclude with an outlook and future scope for these devices where femtolitre or smaller volumes of liquid handling are needed.

Graphical Abstract

1. Introduction

Atomic scale movement of matter was demonstrated by manipulating single atoms at low temperature in ultra-high vacuum using a scanning tunneling microscope (STM) tip (e.g., quantum corrals) [1]. It was done by picking, pulling or shifting the atoms on the surface and placing them in the desired location. The latest creative manipulation was the generation of world’s “smallest” movie, entitled “A boy and his atom” [2]. If such a controlled manipulation could be achieved with liquids by selectively aspirating and dispensing at sub-femtolitre level (corresponding to sub micron features), it would have a variety of applications in surface patterning, localized growth, surface modification, manipulating contents of single cells, picking contents from single cells and bottom-up fabrication of devices, to mention a few.
Various tools are available for handling fluids at different volume range (Figure 1). A micropipette, the ubiquitous fluid-handling tool, can manipulate liquids at desired locations. It works on the principle of partial vacuum being created inside the tip with a mechanical piston. This pressure difference enables to aspirate a well-defined volume of liquid. The aspirated liquid can be transported and released at a desired location. Typically, with a manually operated laboratory micropipettes millilitre (10−3 L; mL) to microlitre (10−6 L; μL) volumes of liquid can be handled. Below this range, it becomes more elaborate. Syringe pumps with precision stepper motors allow expanding the range to the femtolitre (10−15 L; fL) domain. They can dispense and withdraw liquids. For very fast dispensing of droplets, inkjet printing techniques are used [3,4]. These popular techniques were originally developed for printing ink on a paper [5]. Lately, it is also being used to print polymers [6], functional devices [7,8], in biology to print/spot DNA microarrays [9], protein microarrays [10] and cells [11,12]. In this technique, the liquid is squeezed out of a nozzle by applying a pressure wave using, e.g., piezoelectric actuators on the flexible tube that carries the liquid to the nozzle. The pressure wave is applied very close to the nozzle at frequencies in the range of 1 Hz to 100 kHz [3]. Other methods include electrostatic inkjet and thermal inkjet [13]. Inkjetting is a non-contact technique and can only be used for dispensing. To dispense fL to zeptolitre (10−21 L; zL) volumes, electrospray technique can be applied. In this technique, a high electric potential is used to create a strong electric field at the tip of the glass capillary from where an electrically conducting liquid is ejected. The forces balanced between the applied electric field trying to pull the liquid out of the capillary and the surface tension of the liquid trying to keep the liquid inside the capillary produce a cone of fluid at the capillary tip, which is referred to as Taylor cone [14,15]. This cone becomes unstable when the electrical field is increased such that the length of the cone reaches 1.9 times its equatorial diameter. The highly charged droplets will then get radially ejected due to coulomb repulsion. This spray of uncontrolled tiny charged droplets is deposited on the substrate. In a controlled form, electrostatic autofocussing was used to dispense less than fL volumes of liquid [16]. Electrospraying is also a non-contact technique and only suited for dispensing. A review of non-contact printing is given elsewhere [13]. For controlled dispensing of small volumes of attolitre (10−18 L; aL) to zL volumes, scanning probe microscope (SPM) based techniques can be used. In this review article, we discuss this particular technique in detail. This includes the steps for fabricating the device, its working principle and important characteristics, as well as the methods of handling the fluids and the physics involved in dispensing such small amount of volumes. We conclude by describing some of the applications where these devices have already been used and discuss the outlook for this class of SPM probes.
Figure 1. Various dispensing techniques and their respective droplet diameter and volume range that can be obtained.
Micromachines 05 00954 g001

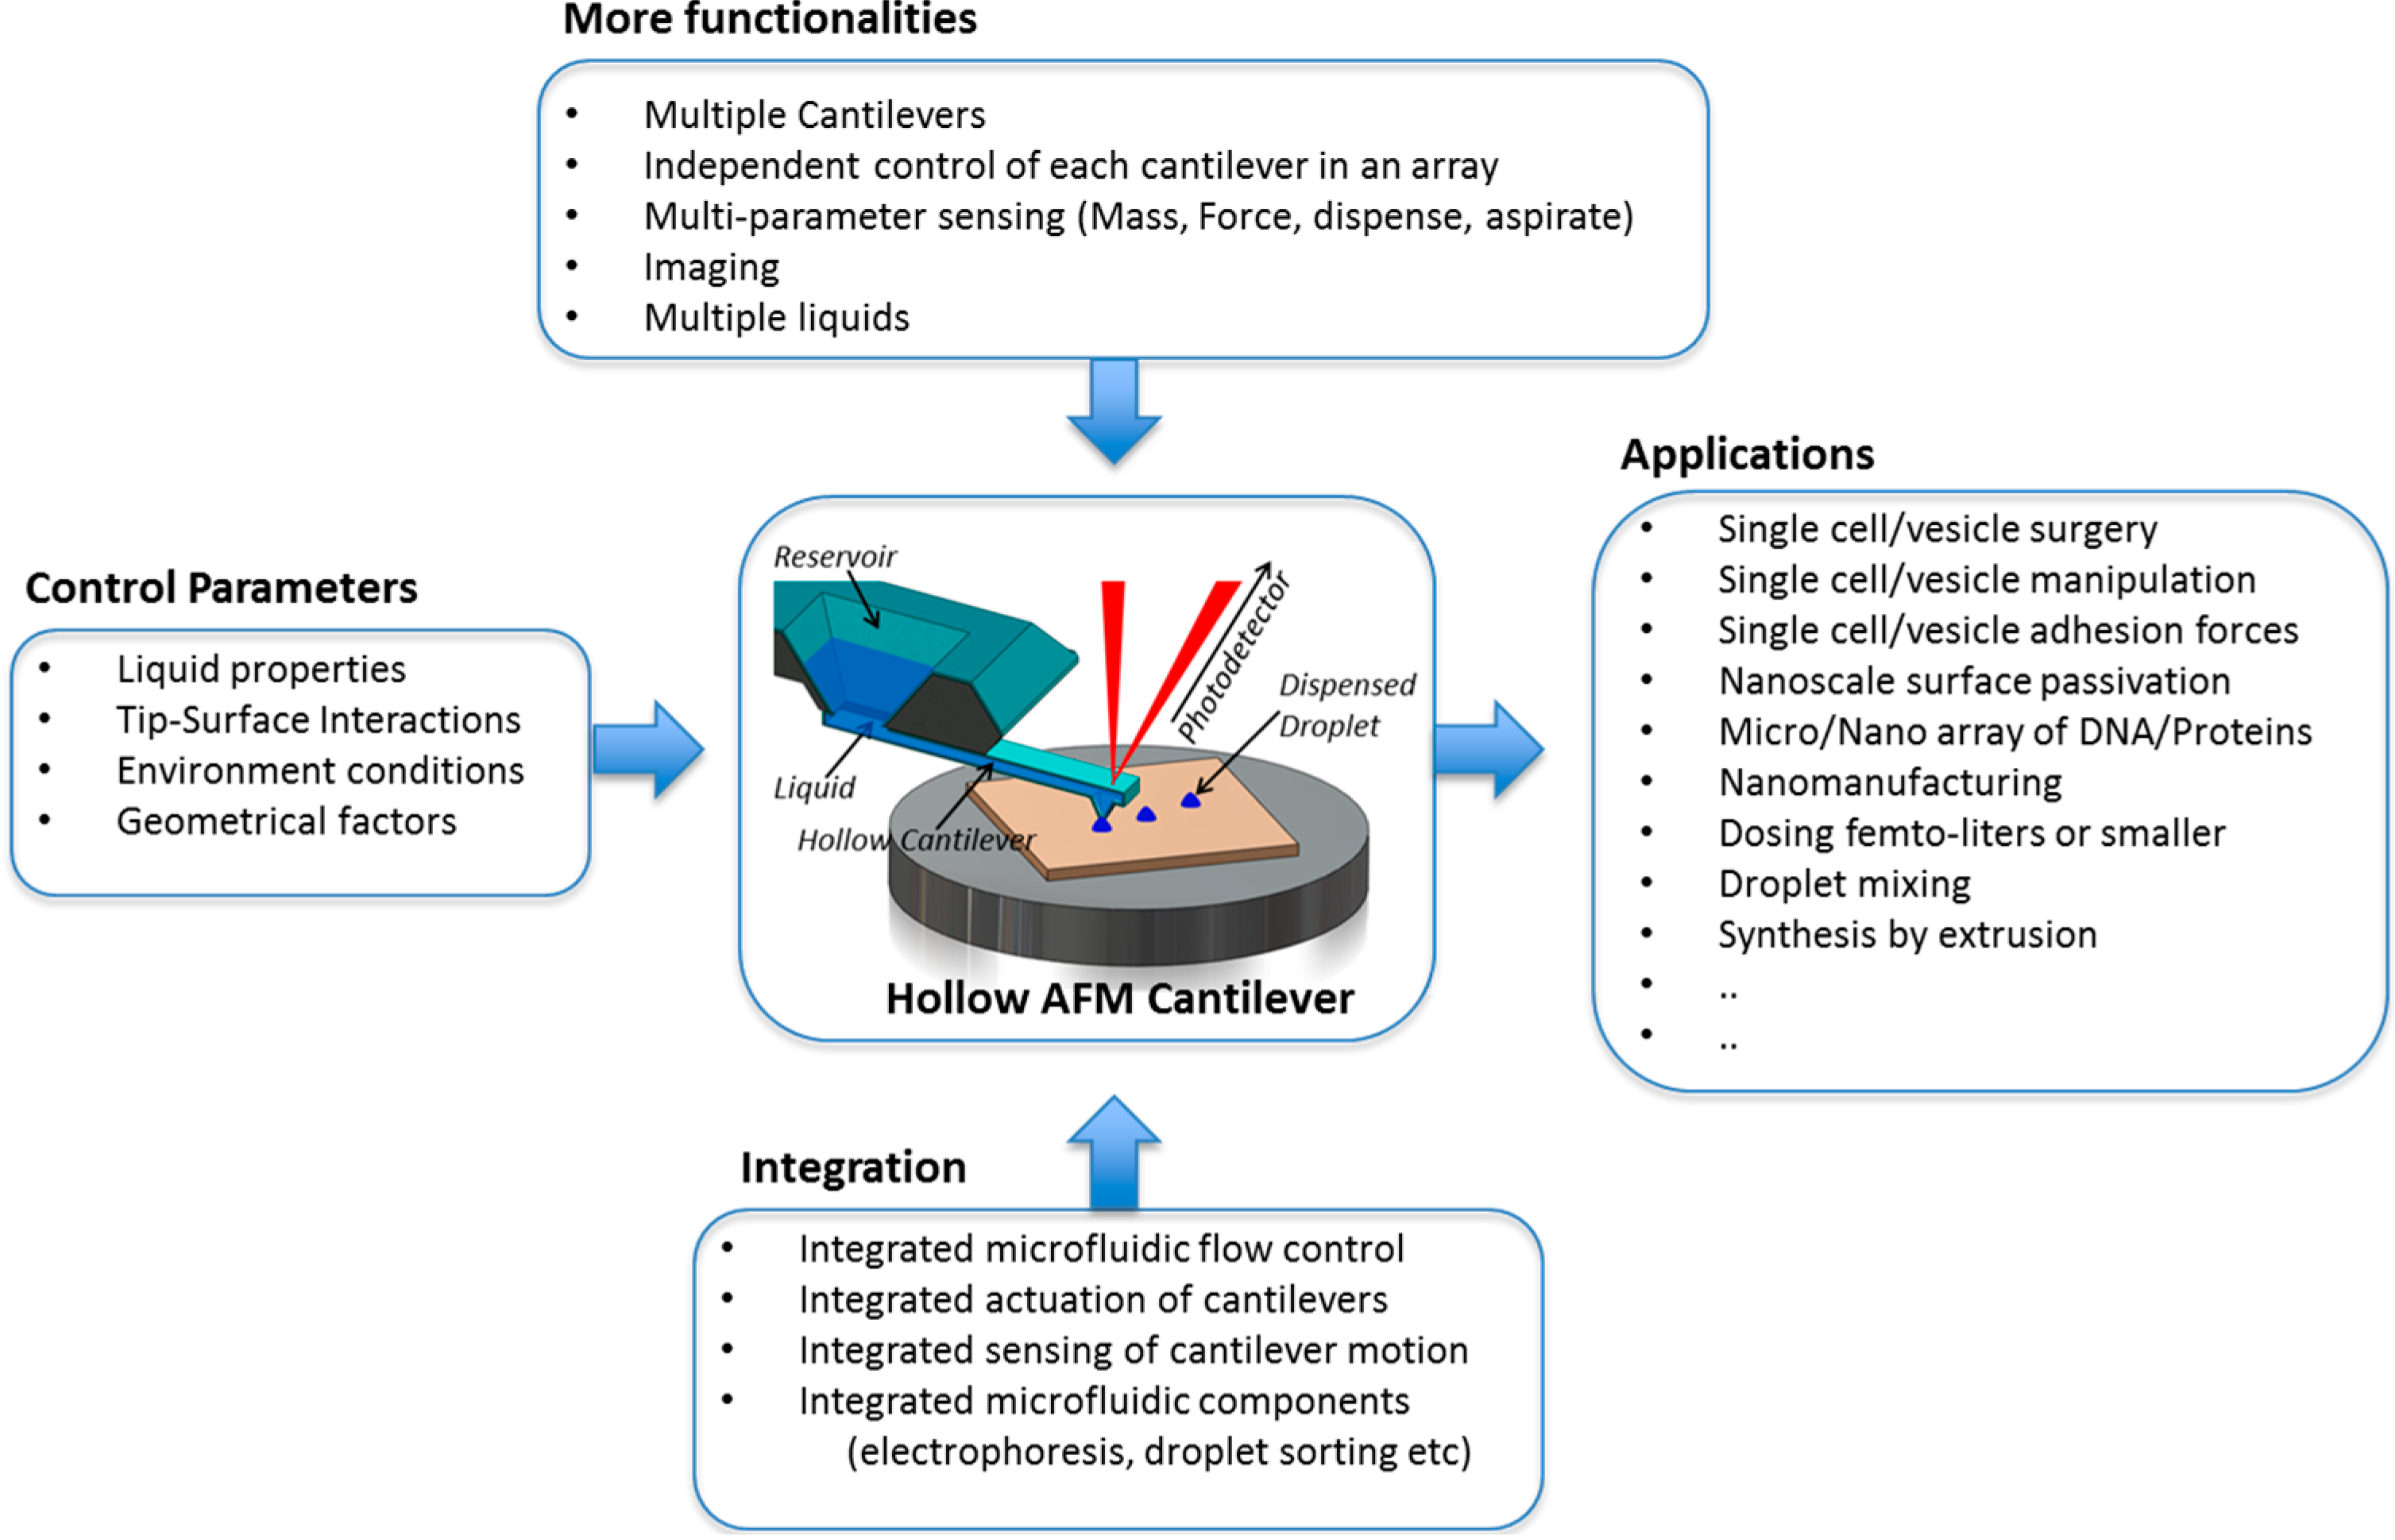
2. Extending the Abilities of AFM for Fluid Manipulation

The atomic force microscope (AFM) enables to reveal and investigate the features down to the atomic level [17], due to its atomically sharp tip, precise and high resolution motion. The AFM is not only used for high precision imaging, but considerable research activities are also aimed at exploiting the AFM for nanofabrication by mechanically, thermally and/or electrochemically modifying the surface [18]. Especially, extending the AFM with the ability to dispense as well as aspirate liquids opens up plenty of new possibilities for surface engineering. The concept is based on chemically or biologically modifying the surface in a highly localized and precise manner. This enables the AFM as an SPM-based tool for fluid manipulation.
Dispensing liquids locally with AFM is affected by different parameters: (a) a cantilever with sharp tip to precisely place the liquid; (b) the microfluidic handling system; (c) the fluid or “ink” consisting of the desired content mixed/dissolved in a carrier liquid; (d) the substrate surface where dispensing is done; (e) surrounding medium (air or liquid) and (f) the local micro environment (temperature, humidity and pressure).
The evolution of various AFM cantilever based fluid manipulations system are classified in Table 1 and subsequently discussed. It started by simple dipping and writing technique called Dip Pen Nanolithography (DPN) technique using commercially available AFM probes. To increase the reproducibility and on-chip liquid storage capability, Nanoscale Dispensing (NADIS), Nanofountain Probe (NFProbe) and Scanning Ion Pipette (SIP) devices were developed. A variety of experiments like dispensing biomolecules, inorganic substances and even manipulation of single cell were performed to prove their capabilities [19,20,21]. The challenges arise in simultaneously controlling multiple parameters (mentioned above) affecting the dispensing process.
In addition to AFM-based devices, there are also other nanoscale fluid handling systems like Nanofountain Pen (NFPen), Scanning ion conductance microscope (SICM) and Bioplume that are classified in Table 2 and discussed subsequently. Other microfluidic devices like scanning electrochemical cell microscopy (SECCM) and microfluidic Probe (MFP) were also developed. The details of these devices are not discussed in this review.
Table 1. Different types of scanning probe microscope (SPM) based nanoscale fluid handling Probes.
SPM Based DispensingSchematicWorking Principle
(a) Dip Pen Nanolithography (DPN) [20] Micromachines 05 00954 i002AFM tip is dip-coated with the ink which is then transferred via water meniscus formed between tip and substrate.
Micromachines 05 00954 i001
(b) Nanoscale Dispensing (NADIS) [22] Micromachines 05 00954 i004An aperture outlet hole is milled into the hollow tip apex. The ink is placed as a large droplet into the hollow tip which serves as reservoir.
Micromachines 05 00954 i003
(c) Nanofountain Probe (NFProbe) [23] Micromachines 05 00954 i006A continuous supply of ink to the tip is achieved by on-chip reservoir and a capillary connection between them. Liquid is dispensed through a volcano-like tip.
Micromachines 05 00954 i005
(d) Scanning Ion Pipette (SIP) [24,25] Micromachines 05 00954 i008On-chip reservoir connected to the tip through a hollow cantilever; continuous supply of ink. Liquid is dispensed through an aperture near the hollow tip.
Micromachines 05 00954 i007
Table 2. Other fluid handling nanoscale probes.
Dispensing ProbeSchematicWorking Principle
(a) Nanofountain pen (NFPen) (Nanonics) [26] Micromachines 05 00954 i010Glass capillaries pulled into cantilevers [26]. Works similar to NFP and SIP.
Micromachines 05 00954 i009
(b) Scanning Ion Conductance Microscope (SICM) [27,28] Micromachines 05 00954 i012Made of glass capillary and operated in physiological buffer. Pipette sample distance is controlled by maintaining constant ion current.
Micromachines 05 00954 i011
(c) Bioplume (Bioforce Nanosciences) [29] Micromachines 05 00954 i014The cantilever has an open fluidic channel and liquid transfer is achieved by direct contact of the tip and surface. Piezoresistive sensor is integrated to control theplacement.
Micromachines 05 00954 i013

2.1. Different Types of Probes

Different types of fluid handling probes were implemented by various research groups.

2.1.1. Dip Pen Nanolithography (DPN)

Deposition of organic molecules by the tip of the scanning probe microscope was first reported in 1995 [30]. Subsequently, in 1999 a systematic study of this process with controlled deposition was reported. The process was called dip pen nanolithography for the first time (Table 1, item a) [31]. It was similar to the ancient way of writing with a quill by repeated dipping it into a pot of ink. When dipped, the tip is coated with a thin layer of the ink. Upon contact of the sharp tip with the substrate, the molecules start to diffuse from this point-contact to the surface through a water meniscus, forming a small spot of monolayer of molecules [32]. This enabled to print very well defined spots and lines. Features as small as 15 nm diameter dots at a spacing of 5 nm were demonstrated. These dots were formed by dispensing 16-mercaptohexadecanoic acid solution on a single crystal gold substrate [33]. The formation of the ink layer on the tip, the loss of ink layer thickness due to the evaporation of the solvent, diffusion of ink on both (tip and sample) surfaces and the meniscus formation between tip and substrate were crucial parameters for the smallest feature size and the printing speed. Therefore, DPN was performed in environment-controlled (humidity, temperature and airflow) chambers. The technique was applied to form patterns of variety of materials like DNA [34,35], peptides, proteins [36,37,38,39,40], viruses [41,42], bacteria [43], metal nanoparticle precursors [44], magnetic nanoparticles [45], silanes [46,47], polymers [48], solid-state features using sol-precursors [49] on conductors, semiconductors, and insulating substrates. In principle, DPN can be extended to pattern any material virtually on any substrate if there is a driving force for the molecules to move from tip to the substrate [50]. To increase the throughput, a massively parallel DPN pen arrays of 55,000 cantilevers with a pen spacing of 90 μm and 20 μm in x and y directions respectively in a 1 cm2 area were fabricated. This enabled to print 450,000,000 sub-100 nm features in 30 min [51]. To decrease the device cost of the high throughput parallel pen arrays, soft elastomeric tip arrays made of PDMS were fabricated enabling polymer pen lithography. Arrays with as many as 11 million pyramid-shaped pens with a writing resolution of 90 nm were demonstrated [52]. The resolution was further improved by fabricating silicon hard-tips mounted onto an elastomeric backing. This hard-tip, soft-spring lithography technique could create any chosen patterns of sub-50 nm resolution over centimeter scale areas [53]. The drawback of the array DPN technique is that individual tips were not addressed. Also, once the ink adsorbed on the DPN tip surface is exhausted, the tip needed to be re-inked and re-positioned on the sample to continue the printing process. Furthermore, they do not have the capability to aspirate and dispense on-demand. The only control parameter is the humidity, which in-turn controls the water-meniscus between the tip and the substrate defining the minimum writing dimensions. The evolution of DPN technique is shown in Figure 2.
Figure 2. The evolution of Dip Pen Nanolithography (DPN). Reprinted with permission from [54].
Micromachines 05 00954 g002

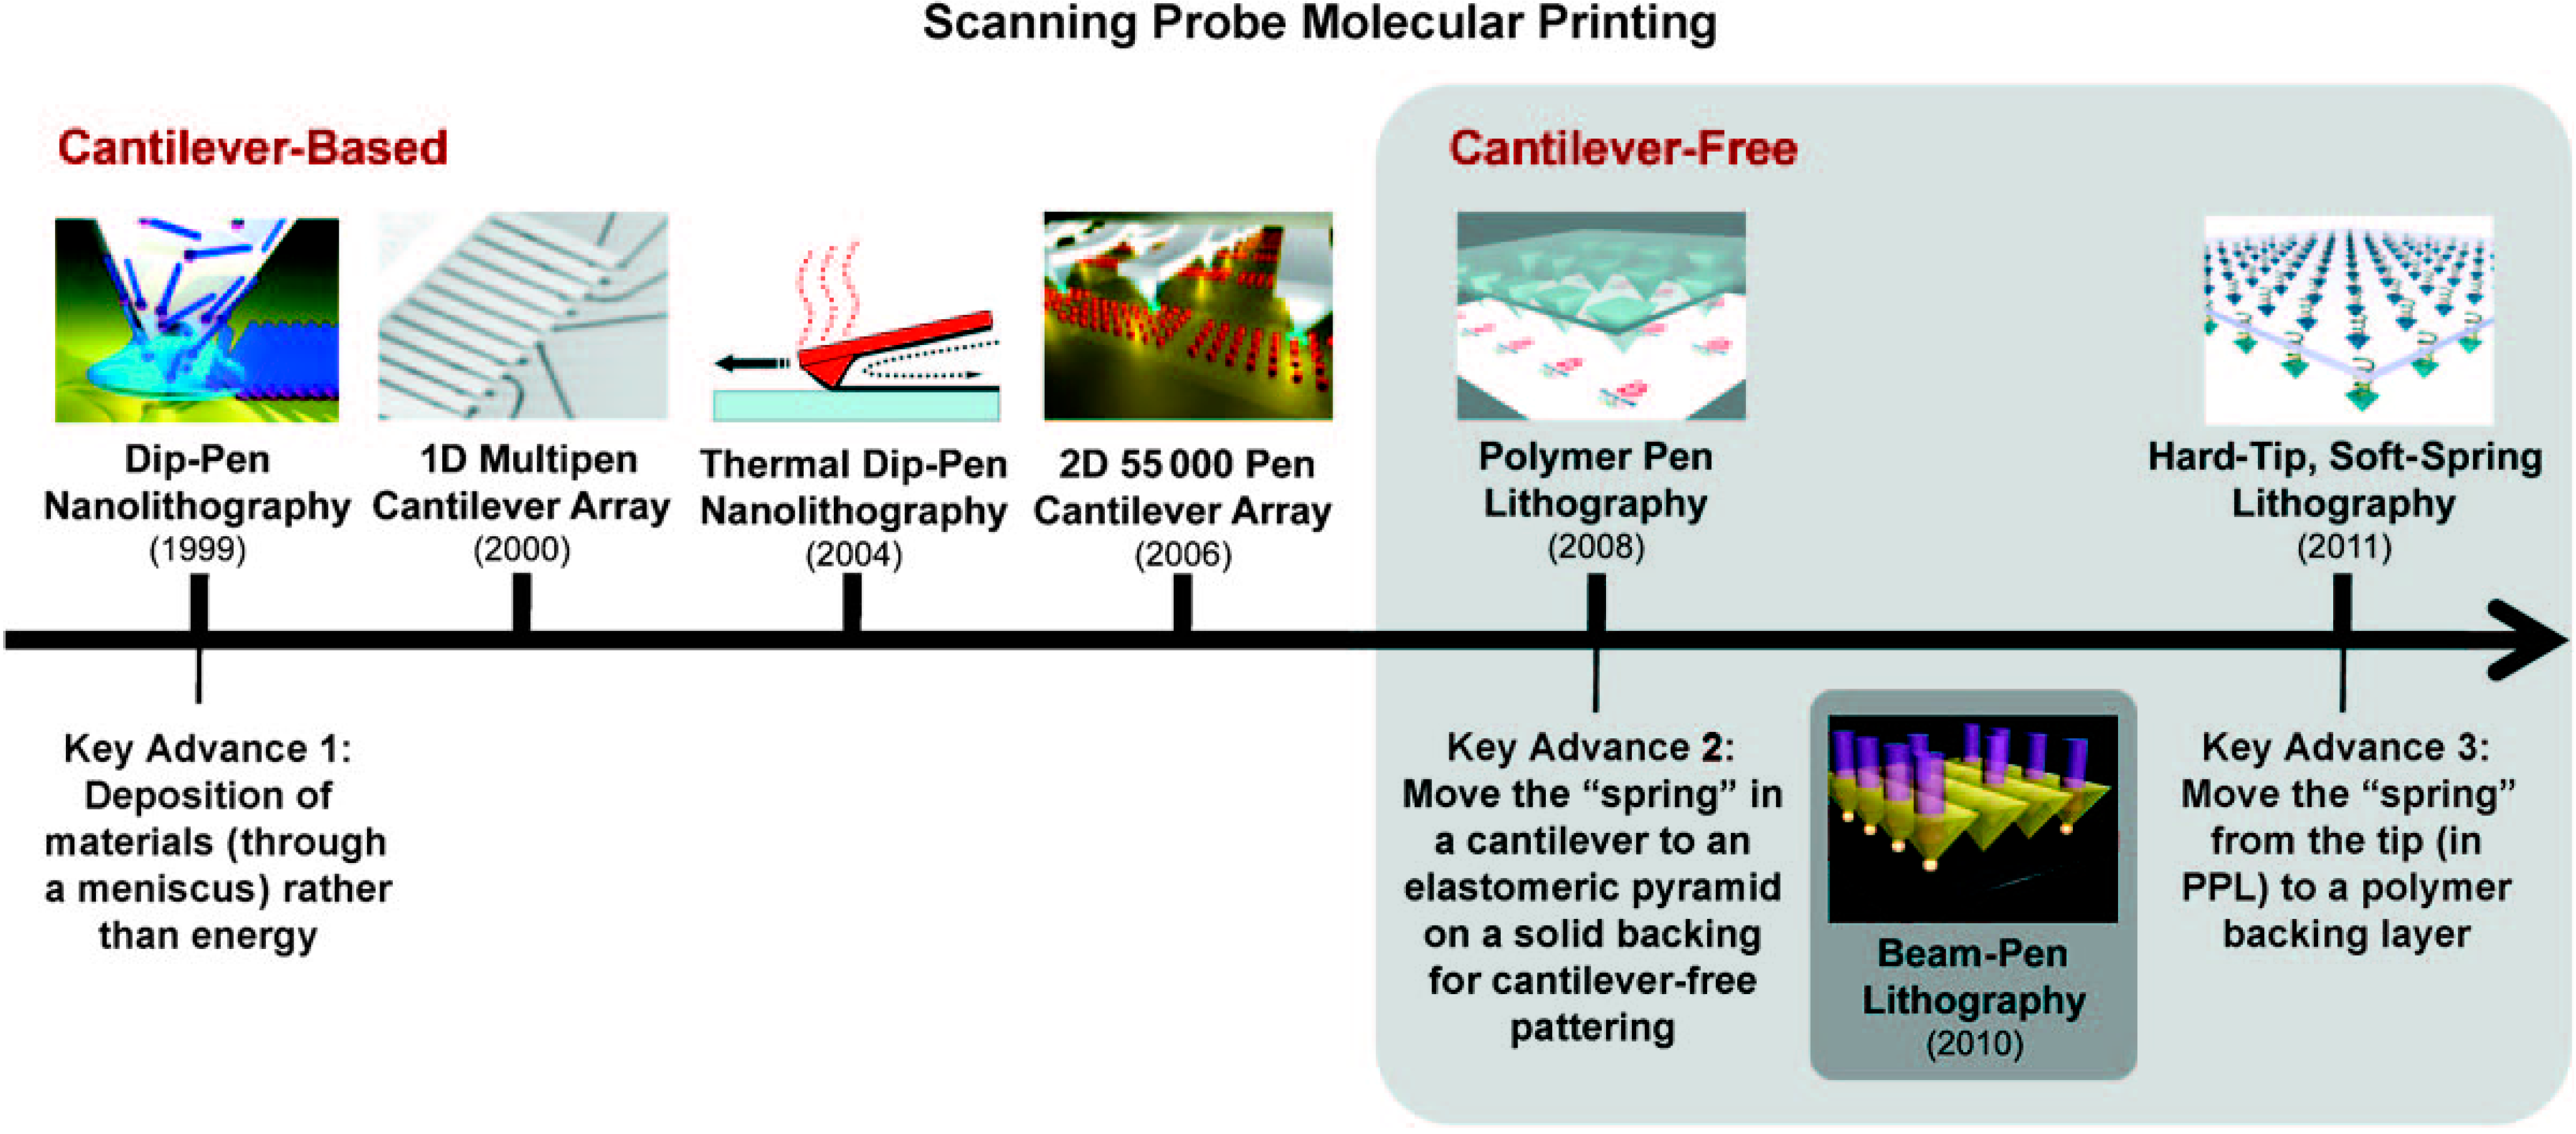
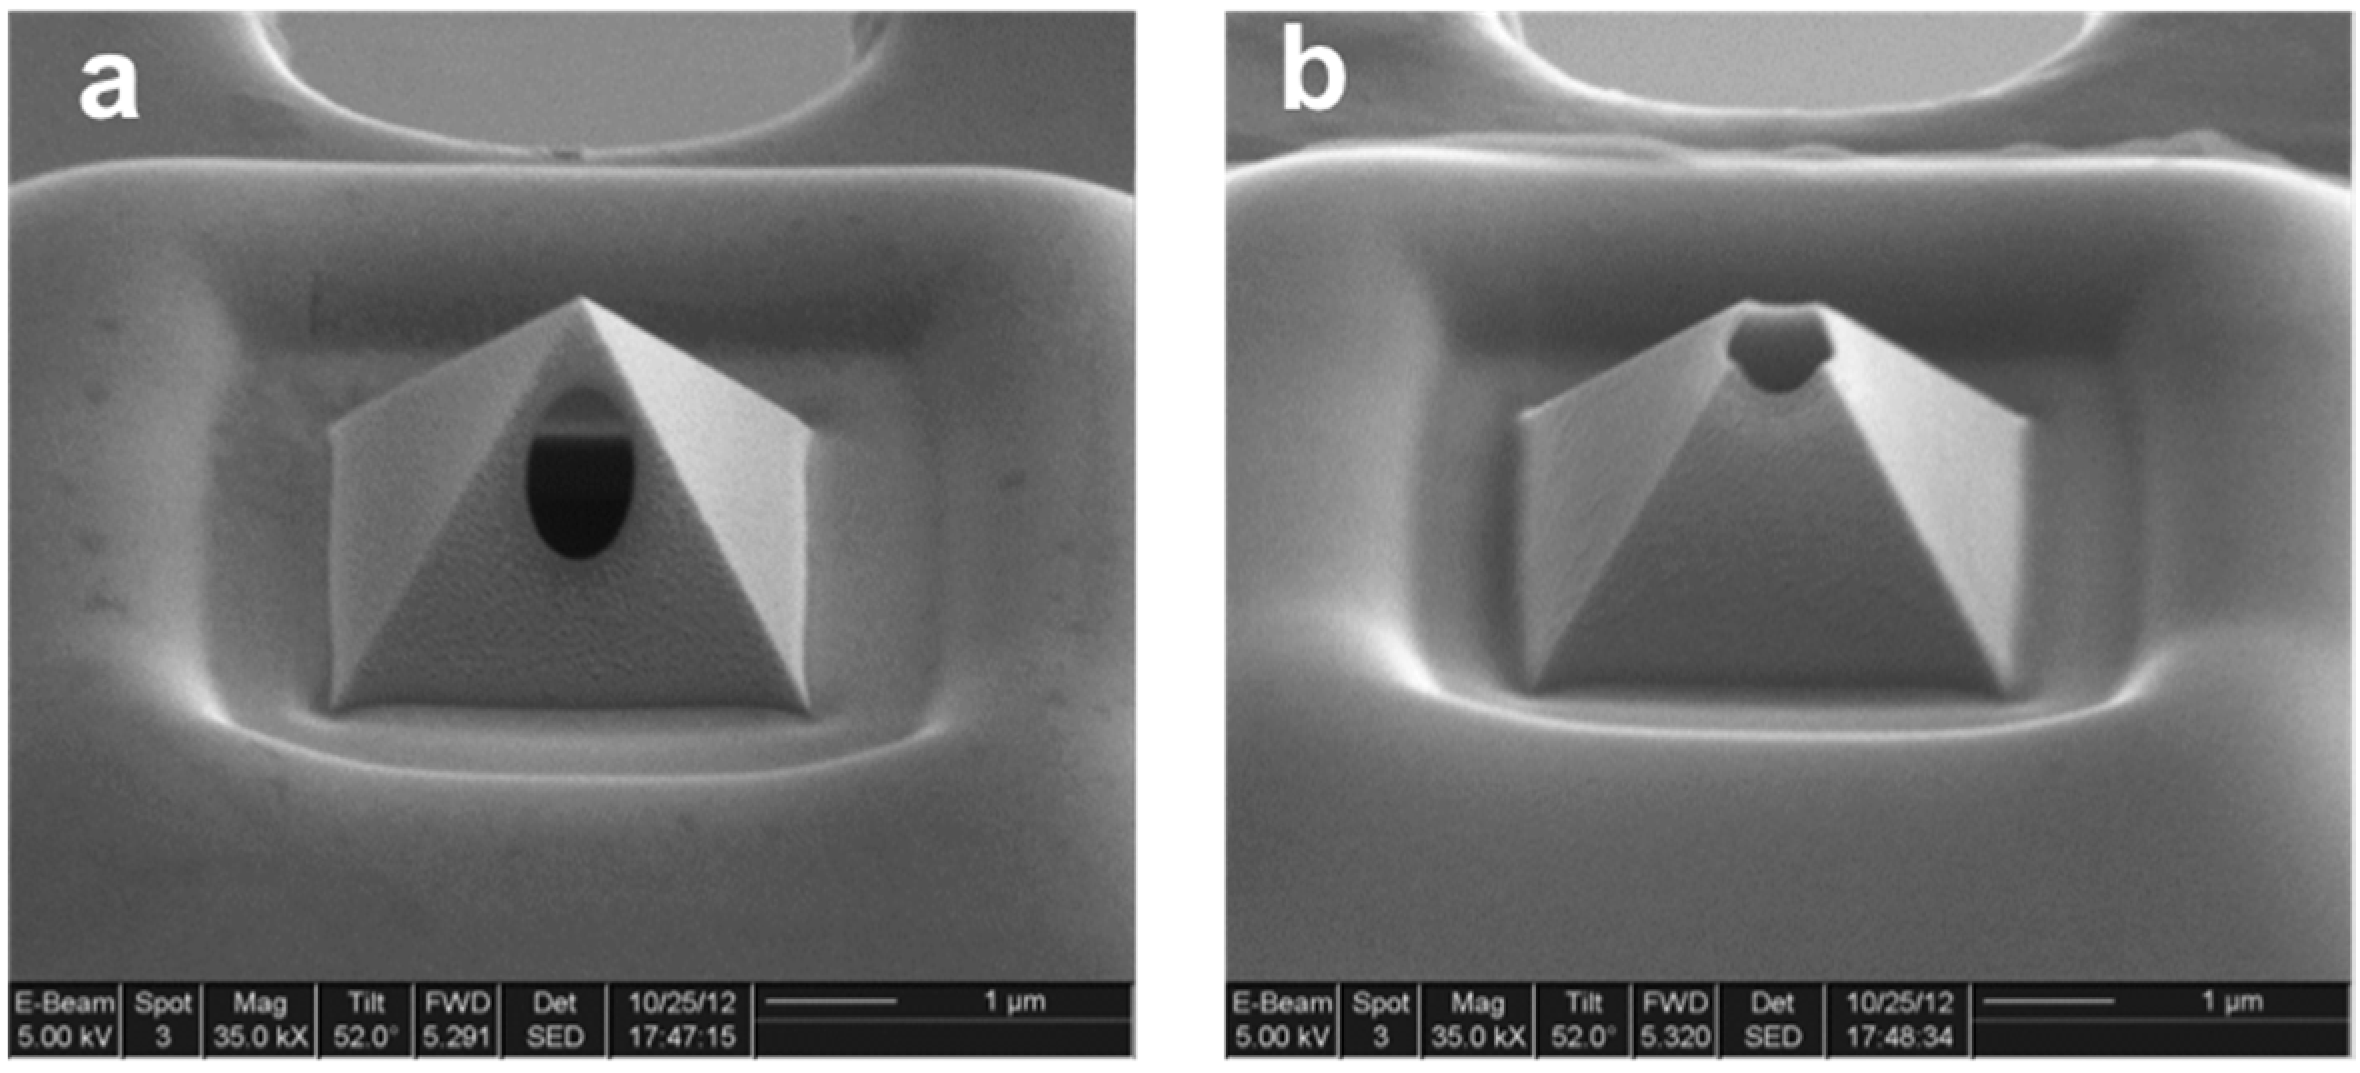
2.1.2. Nanoscale Dispensing (NADIS)

In the NADIS technique, a hollow tip to be used as a reservoir has been fabricated for increasing the storage of liquid on the cantilever (Table 1, item b). An aperture outlet hole was milled at the tip apex for dispensing [22]. The ink was placed as a droplet inside the hollow tip. The capillary forces held the liquid. Once the tip touched the sample surface, a meniscus was shaped around the outlet hole. Receding the tip from the sample surface broke the meniscus and left a droplet of ink behind. Like in the DPN technique, the environmental conditions were controlled. Less volatile inks were used to prevent evaporation, especially, from the large ink-air interface at the hollow tip. The evaporation of the solvent had also a strong influence on the dimensions of the meniscus around the aperture hole. Furthermore, the printing conditions changed over time due to evaporation of the ink’s solvent. This resulted in an increasing concentration of dissolved dispensing molecules. Writing experiments were performed with glycerol on a polished silicon wafer with a native silicon dioxide layer on top. Ink volumes of 40 aL were dispensed in 0.5 s. A single filling of the NADIS probe was able to dispense more than 1000 of such droplets [55,56].
The hollow probe tip, which was used as an ink reservoir, allowed extended writing times compared to DPN technique. The principle of liquid transport from the aperture to the substrate was still via water meniscus.
An additional technique for transporting liquid from the aperture to the substrate could be performed with these probes. Liquid droplets could be ejected or sprayed to the substrate by applying an electric field between reservoir and substrate. Without any water meniscus involved in this process, atto to zeptolitre volume droplets were deposited by varying the duration time, amplitude, and polarity of the applied voltage [57]. Similar to DPN, the major limitation of this method is the lack of liquid aspiration capability.

2.1.3. Nano Fountain Probe (NFProbe)

A mechanism that continuously supplies liquid through a fluidic connection from a large reservoir via a hollow cantilever to an outlet hole in the tip is used in this method (Table 1, item c) [23,58]. In order to maintain the high-resolution writing capabilities, the sharp tip was kept as a point-contact and was surrounded by the capillary outlet forming a volcano-like tip. The continuous flow of liquid was maintained by the on-chip reservoir and the molecules diffused to the substrate through the tip via a water meniscus. Apart from the ink diffusion from the tip to the substrate, condensation and re-condensation of the ink occurred in close vicinity of the capillary outlet. NFProbes were also operated in environmentally controlled chamber similar to DPN and NADIS. Patterns were written with a resolution of 40 nm. For controlled dispensing of the fluid, a membrane pump near the tip was integrated on the chip. By pushing the volcano-tip against the surface, the membrane deflects allowing fluid to reach the tip [59,60]. Dispensing was also done by applying an electric field between the liquid and the substrate resulting in an electrophoretic or electro-osmotic type of deposition [61]. An array of 12 cantilevers, fed by two on-chip reservoirs was manufactured for increasing writing speed and the diversity of ink. One of the main challenges of operating cantilever arrays was to precisely control the tip-sample distance for each tip. In the experiments reported, only one of the cantilevers was monitored by the feedback system of the AFM. The remaining cantilevers were expected to interact with the sample surface in the same manner. Writing tests were performed with an ink consisting of 16-mercaptohexadecanoicacid dissolved in acetonitrile. A line with a width of 78 nm was reliably printed with a speed of 15 μm/min [62].

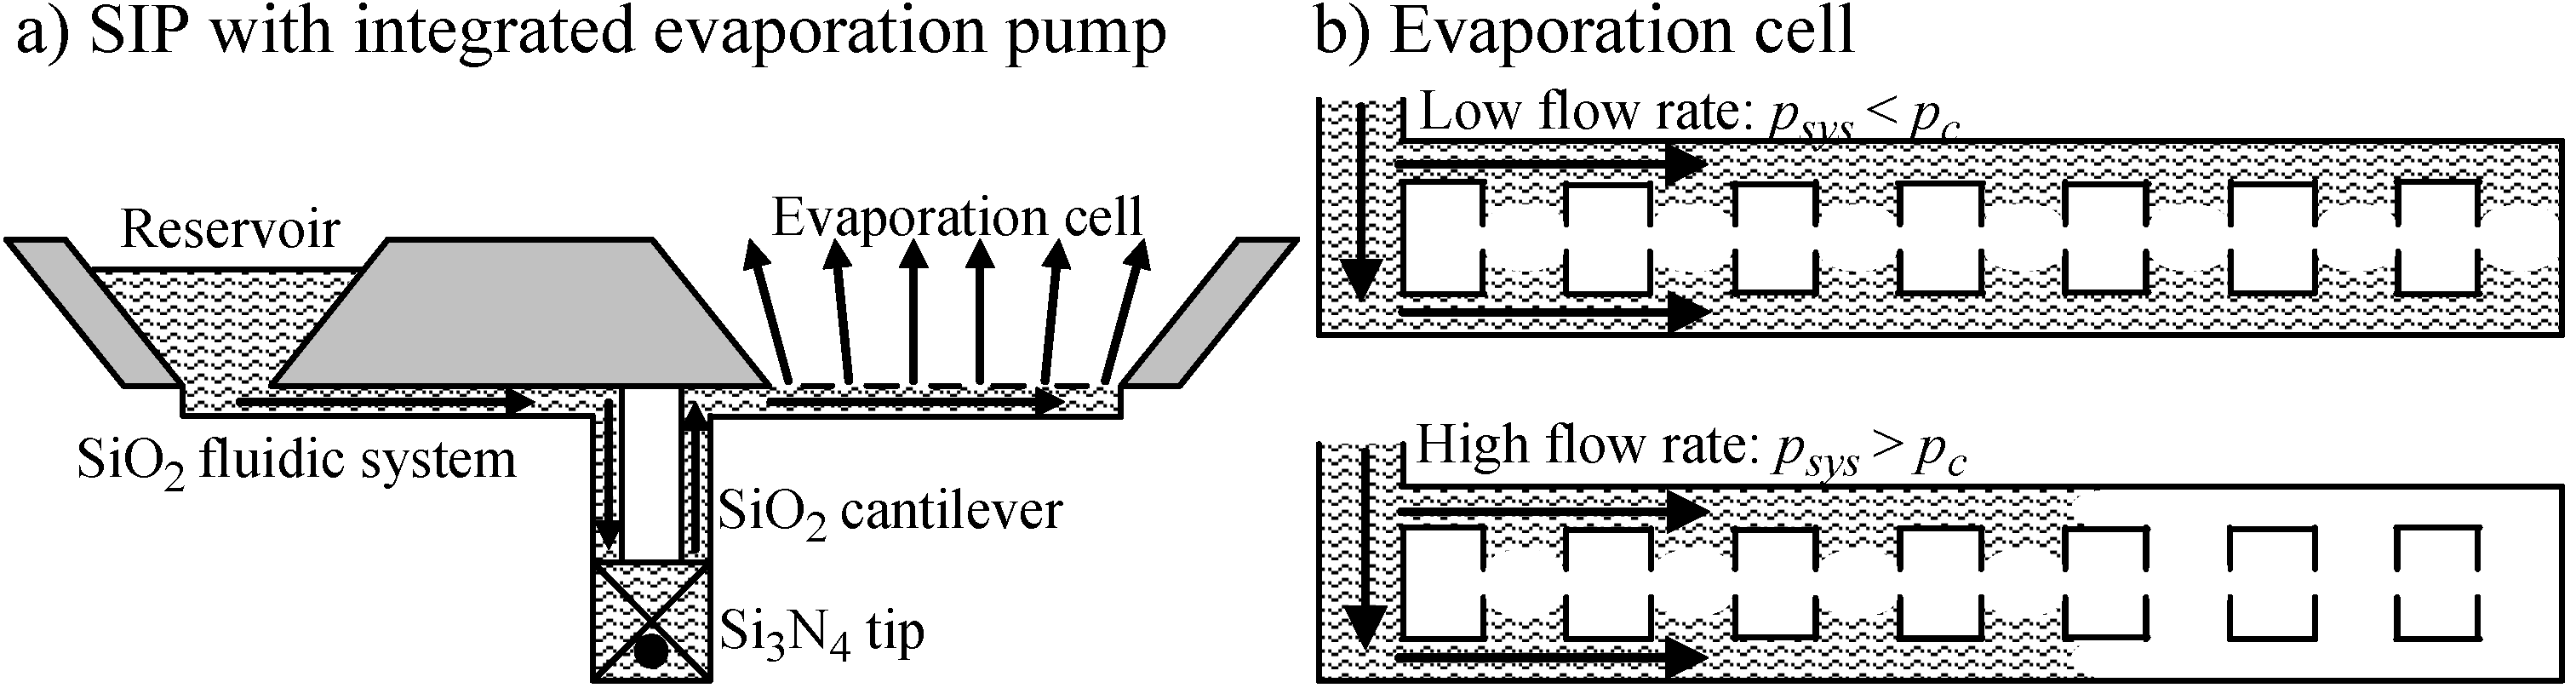
2.1.4. Scanning Ion Pipette (SIP)

Comparable to the NFProbe technique, the SIP improved the NADIS technique for continuous printing. In contrast to NFProbe, the SIP devices were made of hollow silicon dioxide capillaries and cantilever (Table 1, item d) [24]. The tip pyramid was made of silicon nitride ensuring hardness and hence the tip shape even after multiple dispensing cycles. Focused ion beam (FIB) milling was used to make the aperture on the tip for dispensing. The advantage of using FIB milling was that the aperture could be made on the apex—forming the tips with opening on the apex like in NADIS, or in close vicinity to the tip apex like NFProbe. Similar type of device entirely made of silicon nitride was also reported [63,64]. Writing experiments were also performed in water to avoid evaporation. This idea could be further improved by dispensing in a non-miscible surrounding liquid, for example, water-based inks in an oil-based surrounding liquid. This would result in a well-defined smaller ink meniscus shape for high-resolution printing. Spots of streptavidin in HEPES (4-(2-hydroxyethyl)-1-piperazineethanesulfonic acid) buffer were printed on a functionalized surface with a copolymer of polylysine and polyethylenglycol. The resulting spot diameter was 3 μm, using an aperture hole of 1 μm. The dispensing was initiated by applying an external pressure pulse of about 2 mbar for 2–3 s [65]. Furthermore, to show the versatility and applicability of the SIP, experiments were performed to selectively introduce a fluorescent dye into a cell [25]. The latest advancement is the demonstration of non-contact printing [66] and the self-sensing capability of the device, obtained by integrating gold piezoresistors [67]. Another type of transparent cantilever was made by silicon rich nitride. It had less tensile stress compared to silicon nitride and higher stiffness than silicon dioxide [68]. The SIP device can dispense and aspirate like a pipette, along with weighing liquids and imaging surfaces [69].

2.1.5. Nano Fountain Pen (NFPen)

Without using any microfabrication techniques, glass can be pulled to make fine glass capillaries that can be used to dispense/aspirate liquids (Table 2, item a). Glass capillary with an outer diameter of 10 nm and a nozzle of 3 nm was shaped into a L-type cantilever, with 12 microns of short-length and 300 microns of long-length. With gold coating on the capillary, the cantilevered NFPen was used as a regular AFM probe. They have resonance frequencies of several hundred kilo-hertz and force constants of tens of N/m to tenths of N/m. Fountain pen nanochemistry was first demonstrated by etching a 16 μm long, 1.5 μm wide, and 200 nm deep trench in a chrome layer within 40 s at room temperature [26]. Electrophoretic protein printing [70], printing of protein array [71,72], deposition of single walled carbon nanotube [73], polymer lenses [74], molecularly imprinted microstructures [75,76] were also demonstrated using this technique. One of the challenges of this technique is the reproducibility in making the pens and their arrays for high throughput applications.

2.1.6. Scanning Ion Conductance Microscope (SICM)

In this technique, a fine glass pipette (nanometer aperture) probe filled with a contact reference electrode and an electrolyte solution scanned a substrate surface. The second reference electrode is in the bulk solution (Table 2, item b) [77]. The ion-conductance through the nanopipette between these two electrodes in the electrolyte solution is measured when the opening of the pipette is in close proximity to the substrate surface. The ion-conductance value is used as a feedback signal to maintain a constant separation between the tip and the surface to obtain the image of the surface [78]. In the other operating mode, tip position is modulated perpendicular to the surface, and the resulting alternating current is used as the feedback signal. A spatial resolution ranging between 2 nm and 3 nm was demonstrated using a 13 nm nozzle nanopipette and the imaging membrane proteins in a living cell [79]. It was operated in various modes to improve the speed and resolution of imaging [80]. These devices can be used, e.g., in order to tightly aspirate a biological cell and monitor the flow of ions through the membrane—a technique known as patch clamping. A variation of the device with two separate channels inside the same nanopipette is also demonstrated [81]. This is referred to as scanning electrochemical cell microscopy (SECCM). It allows simultaneous recording of electrochemical conductance as well as topographical visualization of surfaces and interfaces [82,83,84,85,86]. A scaled-up version of this type of multifunctional probe called Microfluidic Probe (MFP) is also reported [87]. Major limitation of this technique is that the nanopipette has to be a charge sensitive surface like glass and the liquid has to be electrically conducting.

2.1.7. Bioplume

Bioplume is a cantilever-based dispensing device with integrated piezoresistors. The design of the device was inspired by geometrical features located on the nib of a fountain pen (Table 2, item c). It has a reservoir and a long open split channel at the tip for fluid flow from reservoir to the substrate. The channel in the center of the cantilever with an electrode embedded is used as a path for fluid flow from the reservoir to the dispensing tip. The electrode allowed electrowetting and electrochemistry of the liquid inside the channel. This was achieved by applying an electric potential between the fluids and the substrate. The electrode was slightly receded inwards near the cantilever tip to avoid its direct contact with the substrate. The length, width, and thickness of the beam were 1500, 120, and 5 μm respectively; the length and width of the fluid channel were 200 and 4 μm respectively; the length and width of the reservoir were 200 and 24 μm, respectively. The cantilever had a spring constant of 103 N/m. The droplets were deposited by simply touching the substrate. The size of the droplet was dependent on the time of contact and the wetting properties. Typically, droplet diameters ranging from 1 to 100 μm at the rate of about 10 drops/s were deposited. The self-sensing piezoresistors were made out of p-doped silicon with a resistivity of 4.1 × 10⁻³ ohm-cm and a resistance of 5.7 kiloohms [29,88,89]. With an applied voltage range of 0 to 210 V, droplets of 5 to 40 μm diameters with volumes 20 fL to 14 pL were deposited [90]. The deposition of polymers, biological solutions, and metal particles were also demonstrated [91,92]. The aspiration of liquid by electrowetting was possible with this device [93].
The major drawback of the technique was that it used an open fluid channel. The liquid tended to evaporate and change the concentration before deposition.

2.2. Comparison of Important Characteristics of Various Probes

Depending on the type of application and the technical constraints a particular probe is suitable. The important characteristics related to material, fluids, dispensing and their respective advantages and disadvantages of the probes mentioned in Section 2.1 are compared in Table 3.
Table 3. Comparison of various characteristics of fluid handling SPMs.
SPM-Based ToolDPNNADISNFProbeBioplumeSIPNFPenSICM
Cantilever MaterialSiSi3N4 Tip; Si/SiO2/Si3N4 CantileverSi3N4SiSiO2/ Si3N4QuartzQuartz
DimensionsL = 125 μmL = 145–620 μmL = 300–500 μmL = 1500 μmL = 155 μmL = 300 μmNozzle Diameter = 10 nm
W = 30 μmW = 110 μmW = 20 μmW = 120 μmW = 6.4 μmDiacapillary = 12 μm
T = 4 μmT = 7–8 μmT = 1.5 μmT = 5 μm LT = 4.9 μmTip_Height = 12 μm
Tip_height = 10–15 μm W_Channel = 5 μmL_Channel = 200 μmW_Channel = 3.7 μmNozzle Dia = 0.1–0.5 μm
T_Channel = 0.5 μmW_Channel =4 μmT_Channel = 2.2 μm
Tip_Height = 4 μmL_Reservoir = 200 μmNozzle_Dia =0.1–1 μm
W_Reservoir = 24 μm
TypeContactContactContactContactContact and Non-contactContactNon-contact
Droplet Diameter~15 nm (Alkanethiols on Gold)~70 nm (Glycerol/water mix on hydrophobic Surface)~40 nm (Alkanethiols on Gold)~ 8 μm (Glycerol/water mix on hydrophobic Si)~ 100 nm (Diethylcarbonate on Hydrophobic Silicon surface)~1 μm (Proteins on epoxy coated glass)NA
Droplet Volume~10 zL~100 zL~100 zL~ 0.5 pL~ 100 zL~ 100 aLNA
EnvironmentHigh humidity (33% to 57%)Atmospheric conditionsAtmospheric conditionsAtmospheric conditions (but high boiling point liquid added)Atmospheric conditions and liquidAtmospheric Conditions and liquidLiquid
Stored volumeNone20 pL (on-cantilever)~19 nL (on-chip reservoir)~28 pL (on-cantilever)~19 nL (on-chip reservoir)~34 pL (inside capillary)None
Possible liquidsOrganic, biologicalOrganic, biologicalOrganic, biologicalOrganic, biologicalOrganic, biologicalOrganic, biologicalOrganic, biological
Substrate restrictionFlatFlatFlatFlatFlatFlatFlat
Read-out methodOpticalOpticalOpticalPiezoresistiveOptical or PiezoresistiveOpticalIon-conductance
Pumping mechanismNoneNoneExternal means/on-chipNoneEvaporation based, Electro-osmotic, pressure basedExternalNone
AdvantageCheap, Simple, Massive parallelizationElectrowetting, ParallelParallel, Controlled dispense and Continuous flowParallel, Disposable, Electrowetting, Dispense and AspirateImaging Capability, parallel, Transparent, Disposable, Controlled dispense and AspirateSimple fabrication, DispenseImaging Capability, Transparent, Evaporation controlled, Parallel, Disposable.
DisadvantagePremature evaporation, no aspiration capability, less control on dispensingPremature evaporation, liquid contamination, laborious alignment, without imaging capabilityPremature evaporation, laborious alignment, without imaging capability, non transparent systemPremature evaporation, exposed to liquid contamination, without imaging capability, big sizeLimited viscosity, laborious alignment (without piezoresistors)Irreproducible, fabrication cannot be scaledLimited viscosity

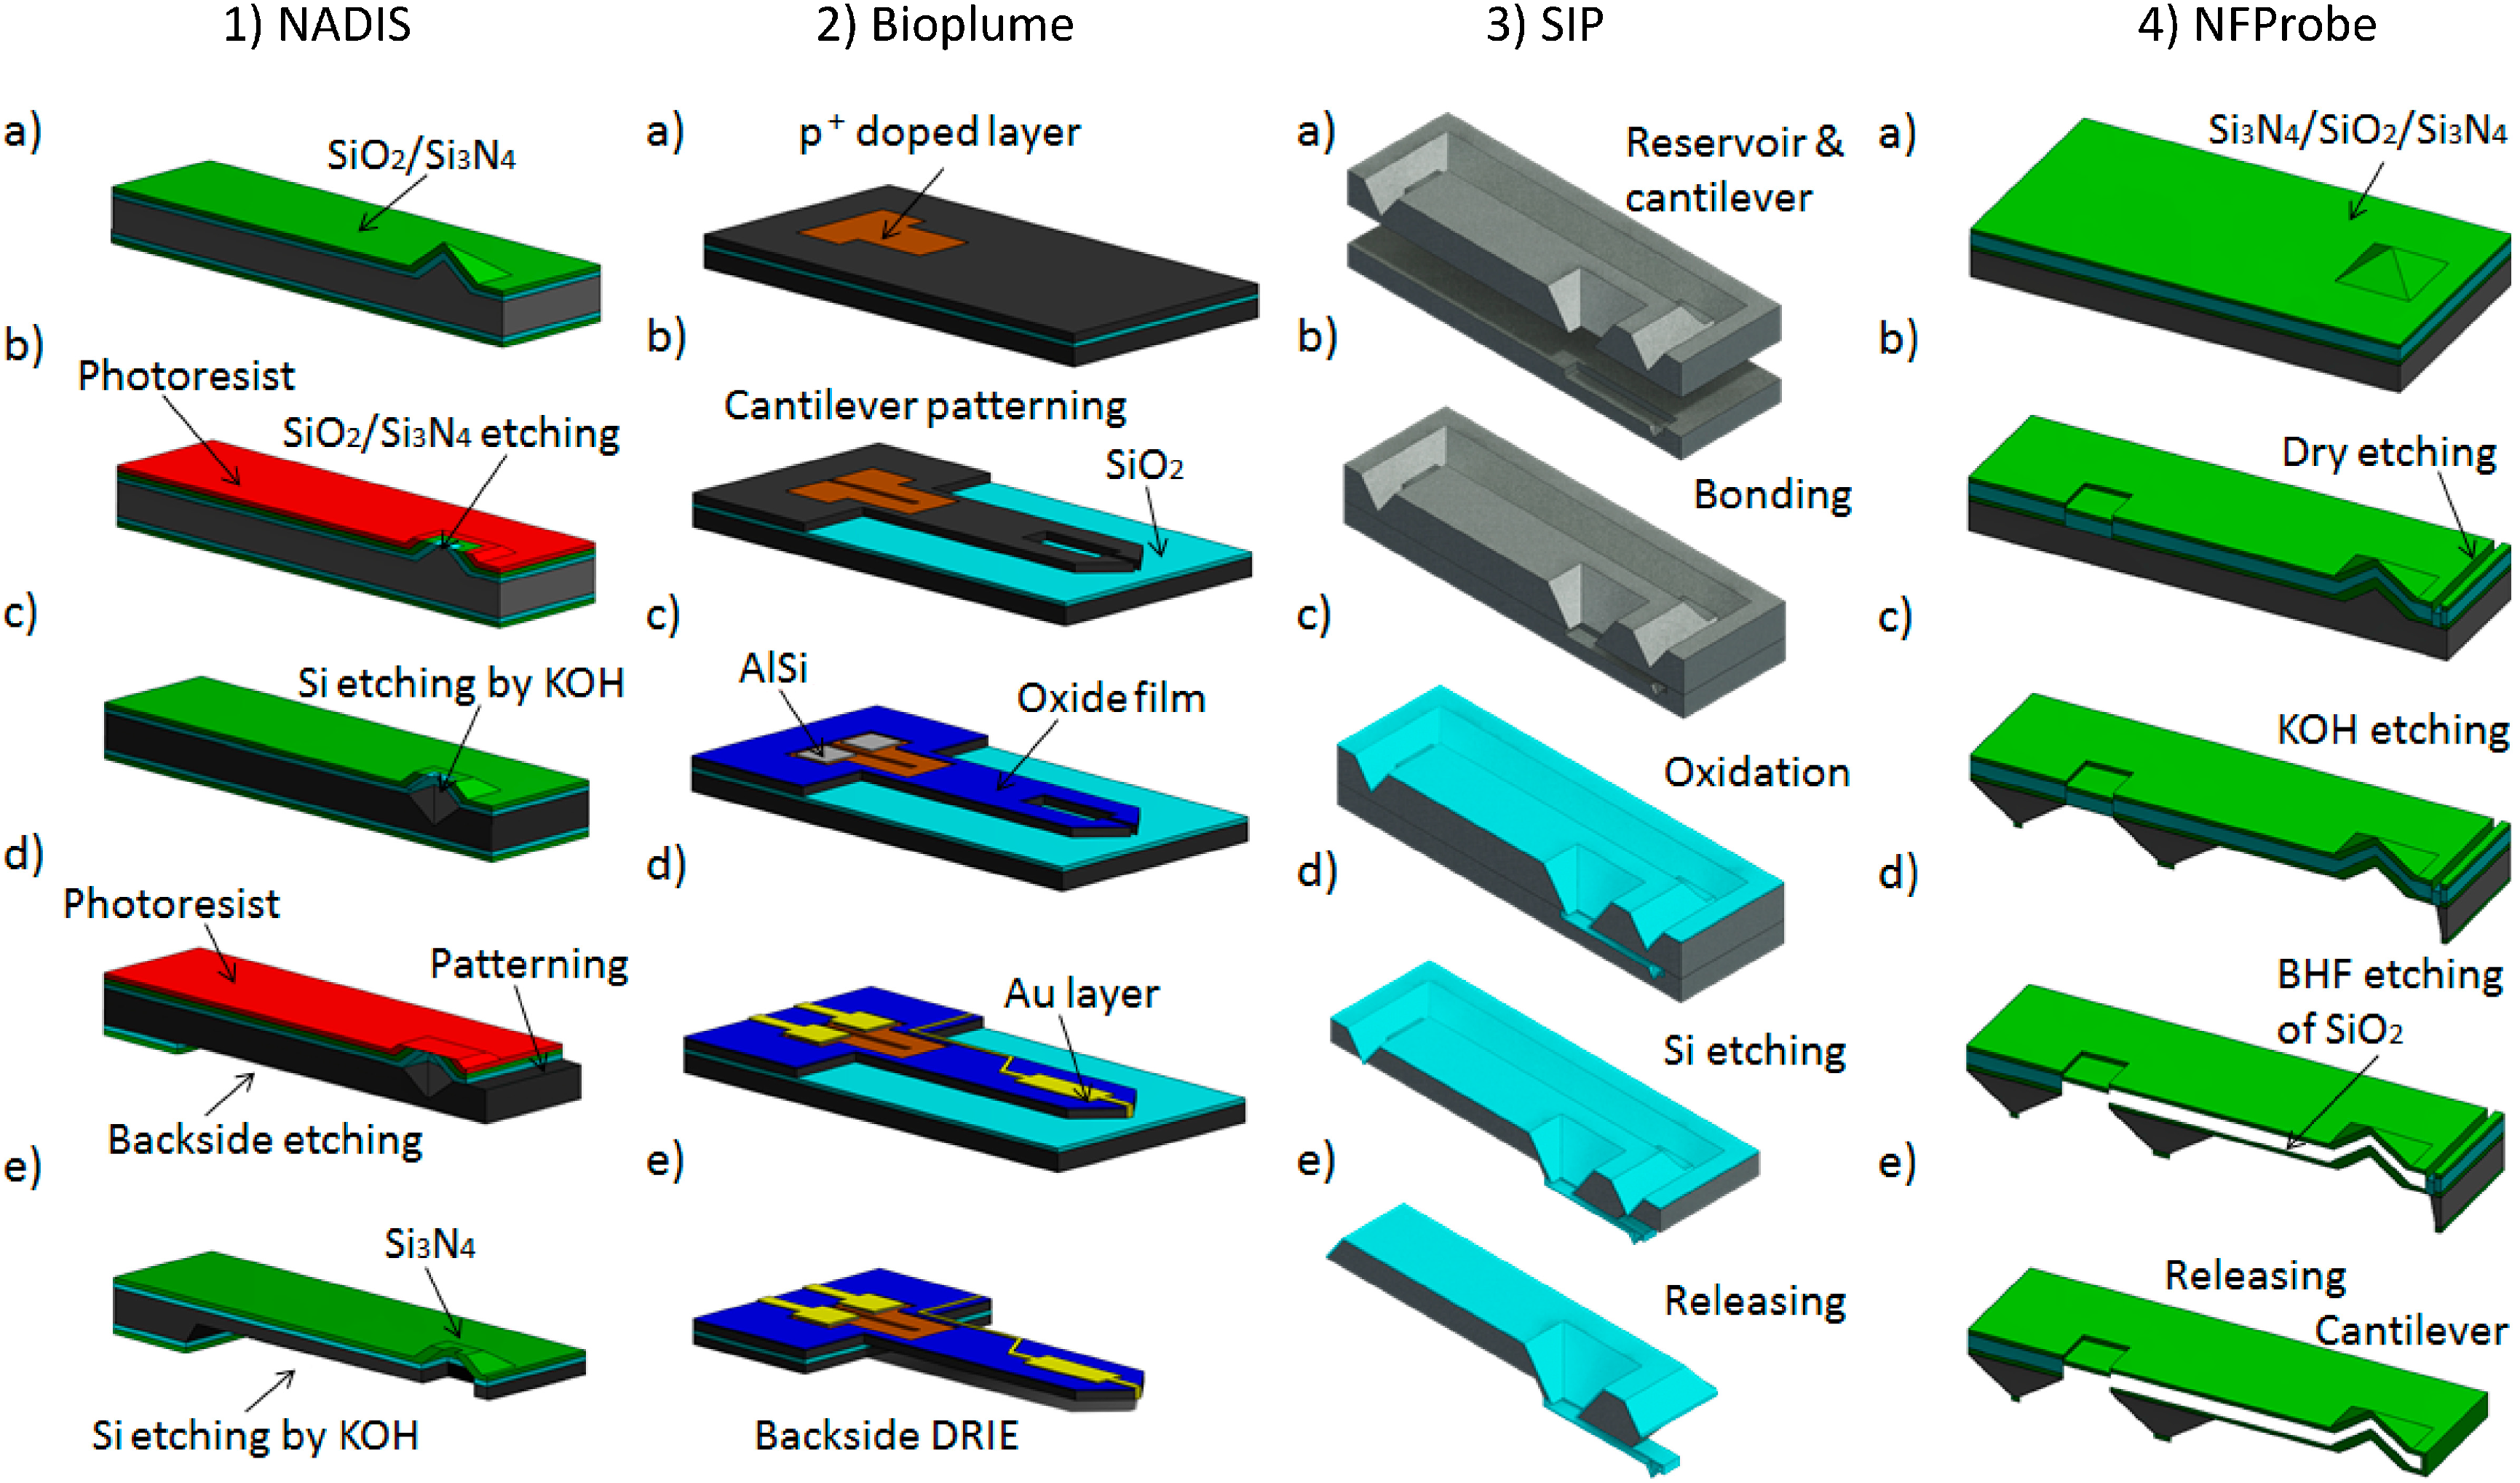
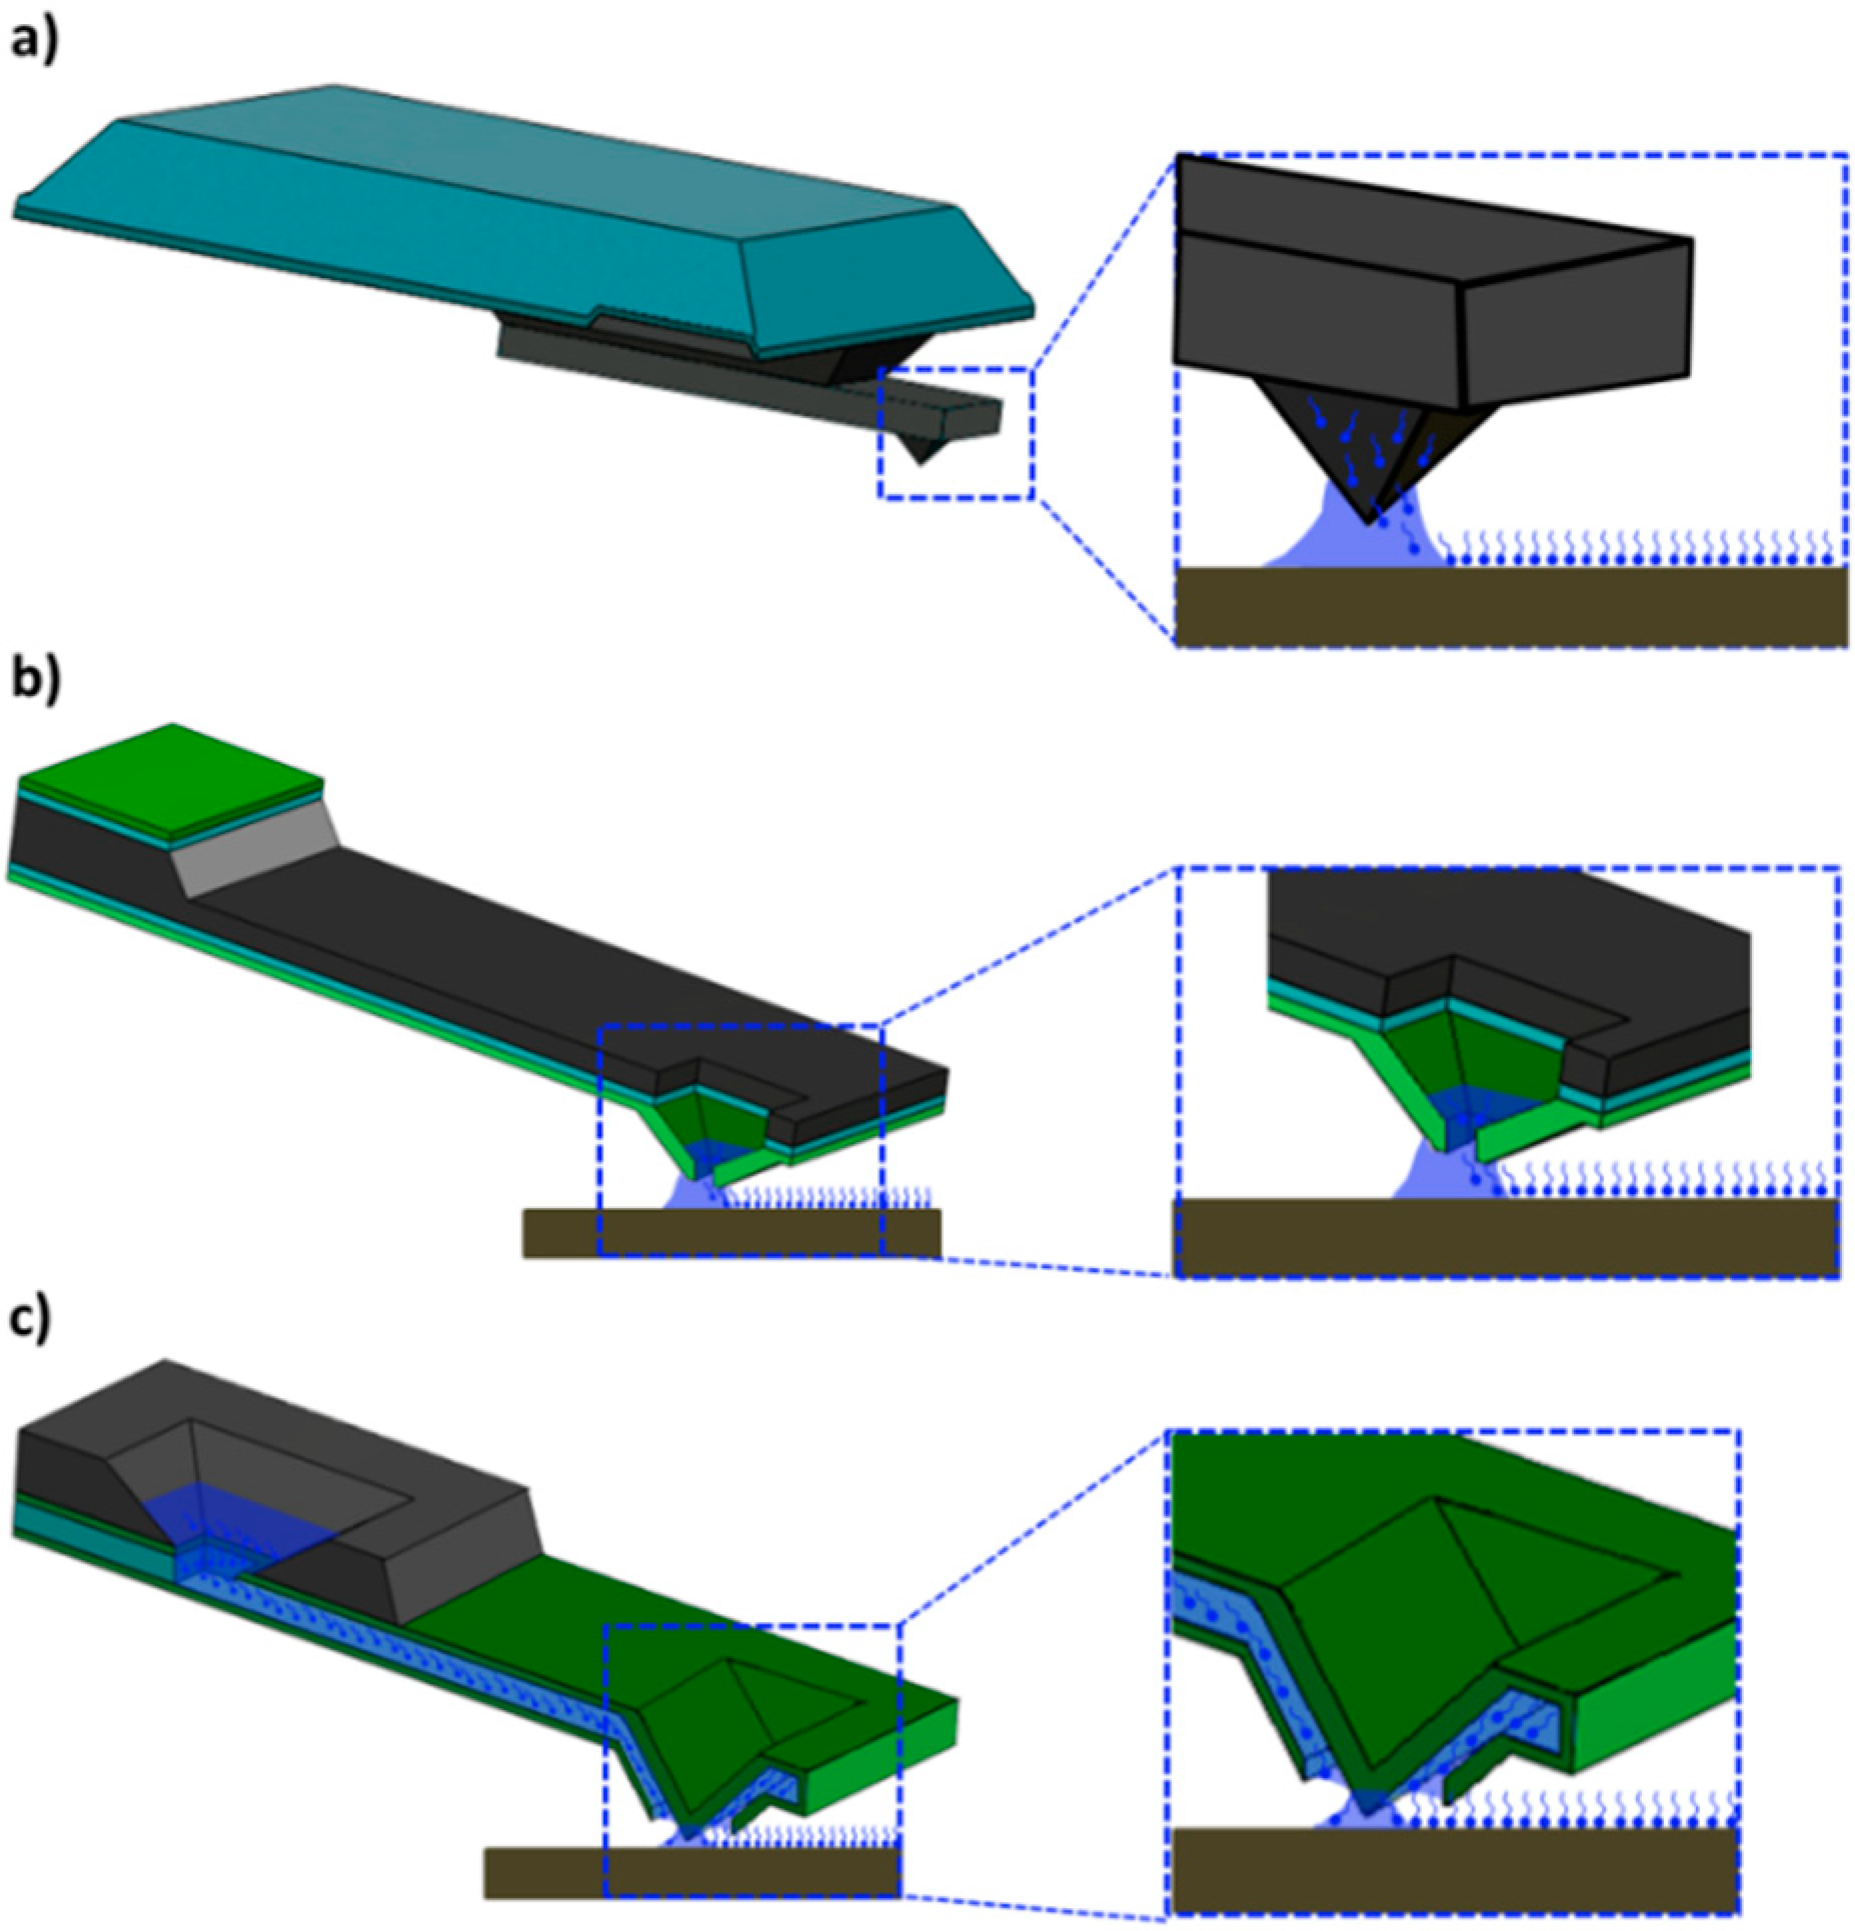
2.3. Microfabrication Steps of Various Liquid Dispensing Devices

For DPN, commercially available cantilevers can be bought and for NFPen and SICM, the glass pipettes are heated and pulled to obtain small apertures needed. For all the other techniques, the devices are not commercially available and hence we describe their fabrication steps in Figure 3.
Figure 3. The microfabrication process steps for (1) Nanoscale Dispensor (NADIS), (2) Bioplume, (3) Scanning Ion Pipette (SIP), and (4) Nano Fountain Probe (NFProbe) are shown in separate columns. The details of the steps from (ae) for each device are described in the text.
Micromachines 05 00954 g003

2.3.1. Nanoscale Dispenser [56]

The microfabrication of the NADIS was based on a molding process, combined with anisotropic KOH silicon etching. It begins with a photoresist masking for creating the tip by photolithography on a silicon wafer that was previously thermally oxidized. The wafer was etched by reactive ion etching (RIE) to remove the unprotected SiO2 layer, and the remaining photoresist was stripped-away. Then the wafer was etched in KOH solution. The etching followed the (1,1,1) planes of the silicon, forming a pyramid below the SiO2 layer that was eventually removed. Once the pyramid was formed, the wafer was again thermally oxidized (oxide thickness of ~50 nm) and a low stress low-pressure chemical vapor deposition (LPCVD) silicon nitride (Si3N4) layer of 1 μm was deposited (see Figure 3, Column 1a), which created a mold of the oxidized pyramid. A spin-coated thick layer of photoresist left the apex of the newly formed uncovered tip and the resist was patterned through photolithography to define the cantilever shape. RIE was then used to open the nitride and dioxide layers that were uncovered by the resist. As a result, the tip apex was etched without any lithography step as shown in Figure 3, Column 1b. After stripping the resist, the wafer was dipped in the buffered hydrofluoric acid (BHF) oxide etch, which transferred the opening in the Si3N4 layer into the underlying SiO2 layer. Therefore, the silicon core of the tip was etched by dipping the wafer once again in KOH (see Figure 3, Column 1c). Photolithography on the backside of the wafer was employed to open a window in Si3N4 and SiO2 layers over the future cantilever area by means of RIE (see Figure 3, Column 1d). This allowed the formation of a membrane in KOH underneath the cantilever. A subsequent photolithography and RIE step were used to pattern the front side Si3N4 layer in order to define the cantilever. Finally, the cantilever was released and the hole underneath the tip was finalized by KOH etching as shown in Figure 3, Column 1e.

2.3.2. Bioplume [93]

The fabrication of the Bioplume was based on standard micromachining techniques. The process begins with an n-type silicon-on-insulator (SOI) wafer, with a 1 μm thick buried oxide layer and a 50 μm thick top silicon layer. The first step consisted in creating the piezoresistor in the bulk silicon (Figure 3, Column 2a). In order to optimize its sensitivity, the cantilever was patterned along the crystal axes, for which the longitudinal coefficient is maximum, i.e., along the (1,1,0) direction in the case of a p-silicon piezoresistor. The localization of the piezoresistive layer at the anchored edge of the cantilevers was accomplished by using SiO2 as a masking layer. Therefore, 300 nm of SiO2 was thermally grown and patterned with a photolithographic step. After removing the oxide masking layer in BHF, the cantilever shape was created by deep reactive ion etching (DRIE) of the top Si layer (Figure 3, Column 2b). The final shape of the piezoresistor was achieved with this anisotropic dry-etch process. The channel and the reservoir were also fabricated during this step. A 200 nm thick plasma-enhanced chemical vapor deposition (PECVD) oxide layer was deposited to protect the piezoresistors and to electrically insulate the bulk silicon from the metal lines to be patterned. Contact holes were opened, and a 200 nm-thick AlSi layer was sputtered and patterned in order to obtain electrical contacts for the resistors (Figure 3, Column 2c). After the shape of the cantilever was delineated, the electrodes required inside the channel for the electro-assisted methods were fabricated (Figure 3, Column 2d). The connecting metal lines and bonding pads were fabricated along with the metallic electrodes by metal lift-off technique. Finally, the cantilevers were released by DRIE-etching the backside of the silicon wafer, followed by RIE of the buried SiO2 layer (Figure 3, Column 2e).

2.3.3. Scanning Ion Pipette [24]

The fabrication of the SIP was based on obtaining closed, partially freestanding capillaries. The design steps are covered over two wafers: one containing the fluid reservoir and the other one patterned with the fluidic system (namely the cantilever and the tip). To begin with, a 300 nm thick thermal SiO2 layer was grown on a double-side-polished 300 μm thick Si wafer. The cavity for the tip was outlined by RIE into the SiO2. Subsequently, the pyramidal pit for the mold of the tip was etched by KOH in the Si wafer. Then the deposition of LPCVD Si3N4 of 200 nm was done to form the tip inside the tip mold. As a last step, patterns with 5 μm deep trenches were etched with DRIE to define the fluidic system and the cantilever. In the other wafer, fluid reservoir was patterned. Once again, the process begins with a 300nm thick thermal SiO2 layer and a subsequent 150 nm thick LPCVD Si3N4 layer grown on a double-side-polished 300 μm thick Si wafer. The handling part of the chip, as well as the fluid reservoirs were then outlined by RIE through the Si3N4 and SiO2 layers, stopping at the Si surface. The cavities for the edges/borders of the chip’s handling part and the reservoir were etched in a KOH solution through the entire wafer thickness. The cross-section view of the two resulting wafers is shown in Figure 3, Column 3a. Subsequently, both wafers were cleaned and activated in a standard radio corporation of America (RCA) solution followed by a thermal fuse bonding process (Figure 3, Column 3b). Prior to the bond process, the wafers were aligned in such a way, that the trenches of the fluidic system in one wafer were connected through the fluid reservoir in the opposite wafer. The wafers were pressed together with 0.6 MPa pressure. The resulting wafer sandwich was thermally oxidized to grow a SiO2 thickness of 1.5 μm (see Figure 3, Column 3c). The oxidized wafer stack was then etched in KOH solution from the fluidic-system-wafer into the opposite wafer (Figure 3, Column 3d). The KOH etching was stopped once it was optically confirmed that the cantilever had been fully released. At this point, the individual chips were released from the wafer (Figure 3, Column 3e). Finally, the aperture in the tip was milled with FIB, in order to connect the on-chip reservoir to the Si3N4 tip.

2.3.4. Nano Fountain Probe [94]

The fabrication of the microfluidic nanofountain probe started with the manufacturing of the tip precursors through anisotropic KOH etching oxidation sharpening and oxide removal. When the wafer containing the pyramidal tips was ready, LPCVD Si3N4 was deposited (Figure 3, Column 4a). The nitride layer was patterned with photolithography in order to define the reservoir. It was followed by the deposition of a SiO2 sacrificial layer and Si3N4 layer to form the top wall of the microfluidic channel. Photolithography was once again performed to delineate the channels. An under-etching of SiO2 was necessary to create the channel lumen. Subsequently, an oxidation step was performed to close the channel sides. Furthermore, lithography and dry etching were performed on topside for delineating the cantilevers as shown in Figure 3, Column 4b. This was followed by backside lithography for defining the reservoir and chip boundaries (Figure 3, Column 4c), and KOH etching; during the nitride-etching step, the tips protruded from the photoresist and started getting etched. The oxide was exposed to wet chemical etching for connecting the volcano-tip with the microchannels and releasing the cantilevers and chip (Figure 3, Column 4d). Finally, the chip was released.

2.4. Comparing Microfabrication Processes of NADIS, Bioplume, SIP and NFProbe

The development of these four devices requires a careful analysis to define the pros and cons of their fabrication. Among these ones, NADIS has the advantage of having, in principle, the simplest and fastest fabrication, as it requires fewer photolithography steps. However, one should pay special attention to the timing of the last KOH etching step (Figure 3, Column 1e) because over-etching the Si would completely destroy the device. The fabrication of NADIS results in a cantilever whose aperture is directly connected to a small fluid reservoir near the cantilever tip, and therefore only a limited amount of volume could be stored. The fabrication of the NFP and the SIP, on the other hand, results in an inner channel that increases the amount of liquid volume that can be stored for dispensing. However, fabricating the NFP is a simpler process, it does not involve wafer bonding in comparison to the SIP (Figure 3, Column 3b). Wafer bonding is a very delicate step that requires major attention on the surface roughness on the bonding side of the both wafers. Therefore, it is crucial to protect the polished surface from damages during the etching steps. Nonetheless, fabricating the channels via wafer bonding, as done for the SIP, gives more flexibility in deciding the ideal cross section for the fluidic channels. In the case of the NFP, the fluidic channel dimensions are limited, because the size of the channel and particularly the height is defined by the limited thickness of the SiO2 layer obtained after the wet oxidation step (Figure 3, Column 4a). This is then removed in BHF, resulting in a hollow cantilever made of Si3N4. Achieving a thickness of the thermal oxide higher than 1.5 μm is possible but difficult and extremely slow. Additionally, the hollow cantilevers fabricated for NFP are typically made of only Si3N4. Other materials, like SiO2, are possible, but this could considerably increase their fabrication complexity. The fabrication process of the SIP, however, allows the cantilever to be made of SiO2 or Si3N4 without changing the steps. The advantage of cantilever made of oxide is that, it will be transparent and typically more hydrophilic than nitride. The tip is still made of nitride that is a harder material than oxide, reducing the wear and ideal for AFM-imaging purposes. Moreover, the SIP, unlike NADIS and NFP, has the advantage of choosing the aperture not to be created during the main fabrication process, thus increasing the flexibility for the user to decide the exact size and position. However, the drawback is that, each device has to be individually milled with FIB, which makes the process very slow. Finally, Bioplume could be the most tedious for fabrication as doping and metallization steps are required. Also, the process is more expensive and slower to accomplish. The fabrication results in a cantilever with open channels, which exposes the liquid to contamination and premature evaporation. The major advantage of Bioplume is that it is a doped silicon piezoresistive self-sening fluidic device. However, SIP with all the microfabrication advantages with fluidic system has also been demonstrated to have self-sensing property by metal piezoresistors [68].

3. Handling of Fluids within the Probes

The SPM-based fluid handling devices have evolved from simple dipping and writing to on-chip fluid reservoirs for a continuous supply of the liquid sample. For a controlled flow of liquid from the reservoir to the tip, various pumping techniques were developed. In this section, we review the pumping techniques based on liquid evaporation [95], thermal energy [96], electro-osmosis [97], pressure [25] and syringe pump [69]. Pumping becomes even more significant for dispensing in liquid environment due to the absence of capillary forces. For dispensing in air, once the liquid has reached the tip, capillary forces between the substrate surface and the dispensing liquid dominate the dispensing process. Better control of dispensing, understanding the physics involved in this dispensing process and real-time monitoring of dispensing are important. After the droplet is dispensed, the lifetime of the dispensed droplet is influenced by the surrounding droplet environment conditions like temperature and humidity. Different imaging techniques are used to confirm the dispensed droplets. All these aspects will be discussed in this section.

3.1. Loading of the Fluid

In DPN technique, the cantilever tip was inked with the molecules to be dispensed. External reservoirs of liquids were kept very close to the cantilever for quick and easy access when dipping the tip into them. However, this method of dipping gave an uncontrolled loading of the tip, leading to irreproducible deposition results. Depositing defined amount of droplets on the tip by inkjet spotting solved this problem [98]. The time spent during inking the tip was dead time for the spotting process.
For the devices where an electric field was applied to the tip, i.e., Bioplume, electro-active loading was used. A DC voltage applied between the liquid to be loaded and the electrode on the cantilever resulted in liquid flow into the cantilever. Such method was also used to aspirate liquids [90].
All other probes discussed in this review have fluid storage reservoir connected directly to the aperture at the tip from where the dispensing happens. The hydrophilic nature of the channels allows self-filling of the cantilevers with ink due to capillarity once a tiny droplet is loaded in the reservoir. However, if the cantilevers are left in the air after fabrication, even surfaces like silicon-dioxide or silicon-nitride become slightly hydrophobic. This happens due to the physisorption of hydrocarbons present in the air inside the hollow cantilever surface. This could be, momentarily solved by cleaning in oxygen plasma or piranha-solution, which makes these channels hydrophilic again. The channels would become hydrophobic again within few minutes when left in the air. If that happens, the liquid has to be driven into the channel using pumps. Furthermore, pumping of liquid is also needed if the hollow cantilevers are used for aspirating liquids or when operated in a liquid environment.

3.2. Pumping Mechanisms

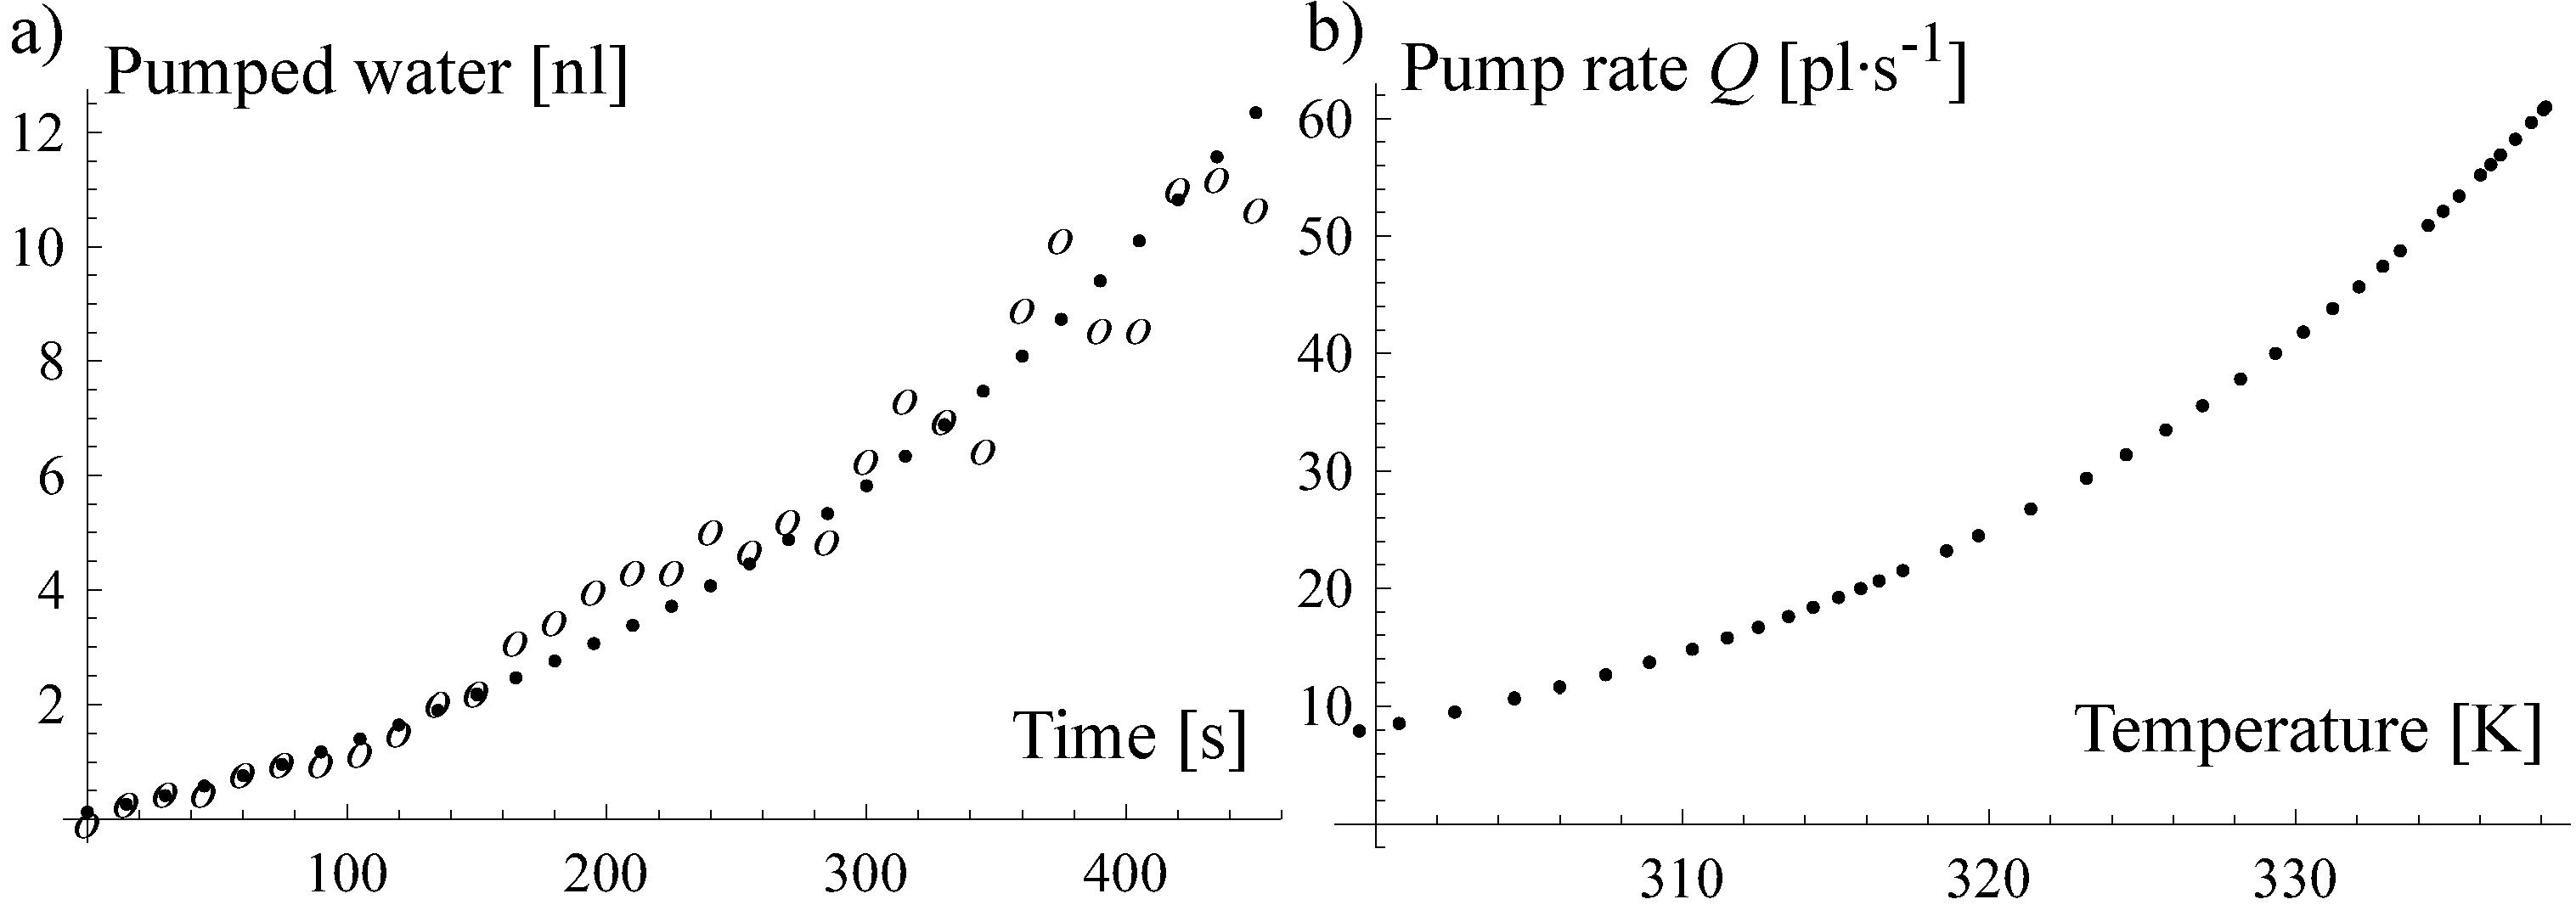
3.2.1. Evaporation Pump

Evaporation-induced pumping represents a straightforward implementation of a micropump into an SPM-based nanopipette. The implementation of such a pump does not require any additional fabrication steps. Only the geometry of the capillary outlet area needs to be increased to enhance the evaporation thus inducing pumping. The working principle of an evaporation induced pump integrated in a SIP is exemplarily explained in Figure 4a [95]. A water-based solution was filled into the inlet (reservoir). Capillary forces instantaneously filled the hydrophilic SiO2 fluidic system and the hollow cantilever. Once the fluid has reached the specially shaped capillary outlet (the evaporation cell), it started evaporating. The evaporation cell is designed such that the capillary is spread into a manifold of top open capillaries. This increased the liquid air surface area, and hence, increased the evaporation. The capillary pressure kept the evaporation cell capillaries wet, and thereby, replaced autonomously the evaporation loss by drawing additional water through the capillaries. The increase of the evaporation area at the outlet results in an increased pumping flow, which also increases the pressure drop between inlet and outlet. As a result, two different flow regimes were considered as sketched in Figure 4b. In the low flow regime, the pressure drop between inlet and outlet is lower than the capillary pressure of the top open channels in the evaporation cell. Hence, all capillaries remained wet and the flow was determined by evaporation rate only. In the high flow regime, the pressure drop between the inlet and outlet, induced by the hydraulic resistance of the fluidic system and the high flow rate, exceeded the capillary pressure of the top opened capillaries. Hence, the evaporation cell was only partially filled and the capillary pressure in the outlet limited the flow rate.
The pump rate (Q) of such an evaporation-based pump was experimentally verified (Figure 5). The fluidic part of the SIP consisted of two capillaries arranged in series. Each capillary had a cross section of 2.25 μm × 3.75 μm and a length of 2.1 mm between the inlet and the outlet. These capillaries were connected to the evaporation cell, which ended in a manifold of 48 top-open capillaries. The geometry of the evaporation cell had the shape of an inverted truncated pyramid with a bottom plane of 30 μm × 480 μm and a height of 390 μm. The sidewalls were inclined with the KOH specific angle of 54.7°. The evaporation-based pump was designed to operate in the low flow regime, where the capillary pressure pc dominates the pressure drop psys over the fluidic system.
Fluorescent-labeled microspheres were used for the experiments to determine the flow rate. Instead of measuring their velocity in the capillaries, their accumulation in the evaporation cell was observed. Each of the microspheres represents a certain water volume defined by the concentration. Hence, the accumulation is a measure for the pump rate. In order to study the dependence of Q with temperature T, the temperature at the water-air interface was increased with time during the experiment.
The pumped water volume according to the accumulation of microspheres is shown in Figure 5a represented by open circles. The non-linear increase of flow rate was due to the deliberate increase of temperature during the experiment. Merging this graph together with the measured temperature finally yields the temperature dependency of the pump rate as shown in Figure 5b. With the present setup, a pump rate ranging from 7 pL/s at 23 °C up to 53 pL/s at 65 °C was achieved [99].
Figure 4. (a) Sketch of a SIP with an integrated micropump. Evaporating water-induced suction flow inside the SPM-chip. (b) Different filling levels of the evaporation cell (with open capillaries). This depends on flow-induced pressure drop over the fluidic system psys and capillary pressure pc at the water-air interface inside the evaporation cell [99].
Micromachines 05 00954 g004
Figure 5. (a) Pumped water with an increasing pump rate by increasing the temperature (experimental data, open circles o; fitted model, dots). (b) Dependency of the pump rate Q on the temperature T. Reprinted with permission from [99].
Micromachines 05 00954 g005

3.2.2. Thermal Pump

If the channels are hydrophobic, sufficient pressure needs to be generated to flow the liquid to the nozzle for dispensing. To address this difficulty, a cartridge-like system with liquid stored in a closed volume of on-chip reservoir with integrated heater was developed [96]. A thin PDMS lid was bonded to a chip already loaded with liquid as shown in the Figure 6. This formed a well-sealed nanopipetting cartridge, which helped avoid sample contamination and evaporation. A thin conducting wire was embedded into the reservoir. An electric current heated the wire, the heat energy was transferred to the liquid, which generated a pressure, pushing the liquid into the hydrophobic microchannel to reach the nozzle at the tip.
Figure 6. (a) A wire was embedded within the polydimethylsiloxane (PDMS) lid; (b) it was placed on top of the chip resulting in a soft-lid with an integrated thermal pump, allowing the free loop to be located inside the reservoir, such that an over-pressure could be created simply by passing current and heating the wire; (c) cross-section view of the schematic picture with wire embedded inside the reservoir; and (d) photograph of the integrated thermal pump on the chip. Reprinted with permission from [96].
Micromachines 05 00954 g006
The reservoir shown in Figure 7a was filled with fluorescent liquid. The hydrophobic capillary leading to the tip did not fill (Figure 7a). The pressure generated by heating the wire overcame this counter-acting capillary pressure (Figure 7b).
Due to the small dimensions of the fluidic channel, the flow was completely laminar with very low Reynolds number. Moreover, the flow was dominated by the interaction between the fluid and the walls of the microchannel rather than by bulk effects. The hydrophilicity or hydrophobicity of the surface was determined by the contact angle (θ) value. The net capillary force on the circumferential meniscus in the microchannel can be approximated by using:
F c a p = C * γ c o s θ = 2 ( w + h ) γ c o s θ
where C is the circumference of the meniscus, w and h are the geometrical size in width and height of the rectangular channel respectively, γ is the interfacial surface tension between air and liquid (γ = 72.8 mN/m for water at room temperature), and θ is the contact angle of the liquid on the channel surface. For liquid flow in microchannels, this effect is represented as capillary pressure difference (ΔPcap) and given by:
Δ P c a p = N e t   F o r c e A r e a = 2 ( w + h ) γ c o s θ w h = 2 γ c o s θ ( 1 w + 1 h )
The transparent cantilever allowed the real-time visualization of the advancing meniscus (Figure 7b). Using a current of around 300 mA for heating the thermal pump was sufficient to evaporate liquid inside the reservoir, causing a high enough pressure to overcome the resistance of the capillary pressure, which was estimated to be 87 kPa (0.87 bar) for a contact angle of 140°. The advancing speed of the meniscus had a value of up to ~2.4 μm/s corresponding to a pumping speed of about 19.5 fL/s. From the changes in the mechanical resonance of the nanopipette the volume of a typical dispensed droplet was estimated to be 30 fL [96].
Figure 7. (a) The on-chip reservoir filled with fluorescent liquid with connected hydrophobic channels; (b) These Figures show the advancement of the air-liquid meniscus inside the capillary as function of time. The pressure generated by the pump overcame the capillary pressure in the hydrophobic channels, allowing fluidic motion; (c) Resonance frequency shift due to decrease in the effective mass of the cantilever as droplets were dispensed until the cantilever was empty. Reprinted with permission from [97].
Micromachines 05 00954 g007

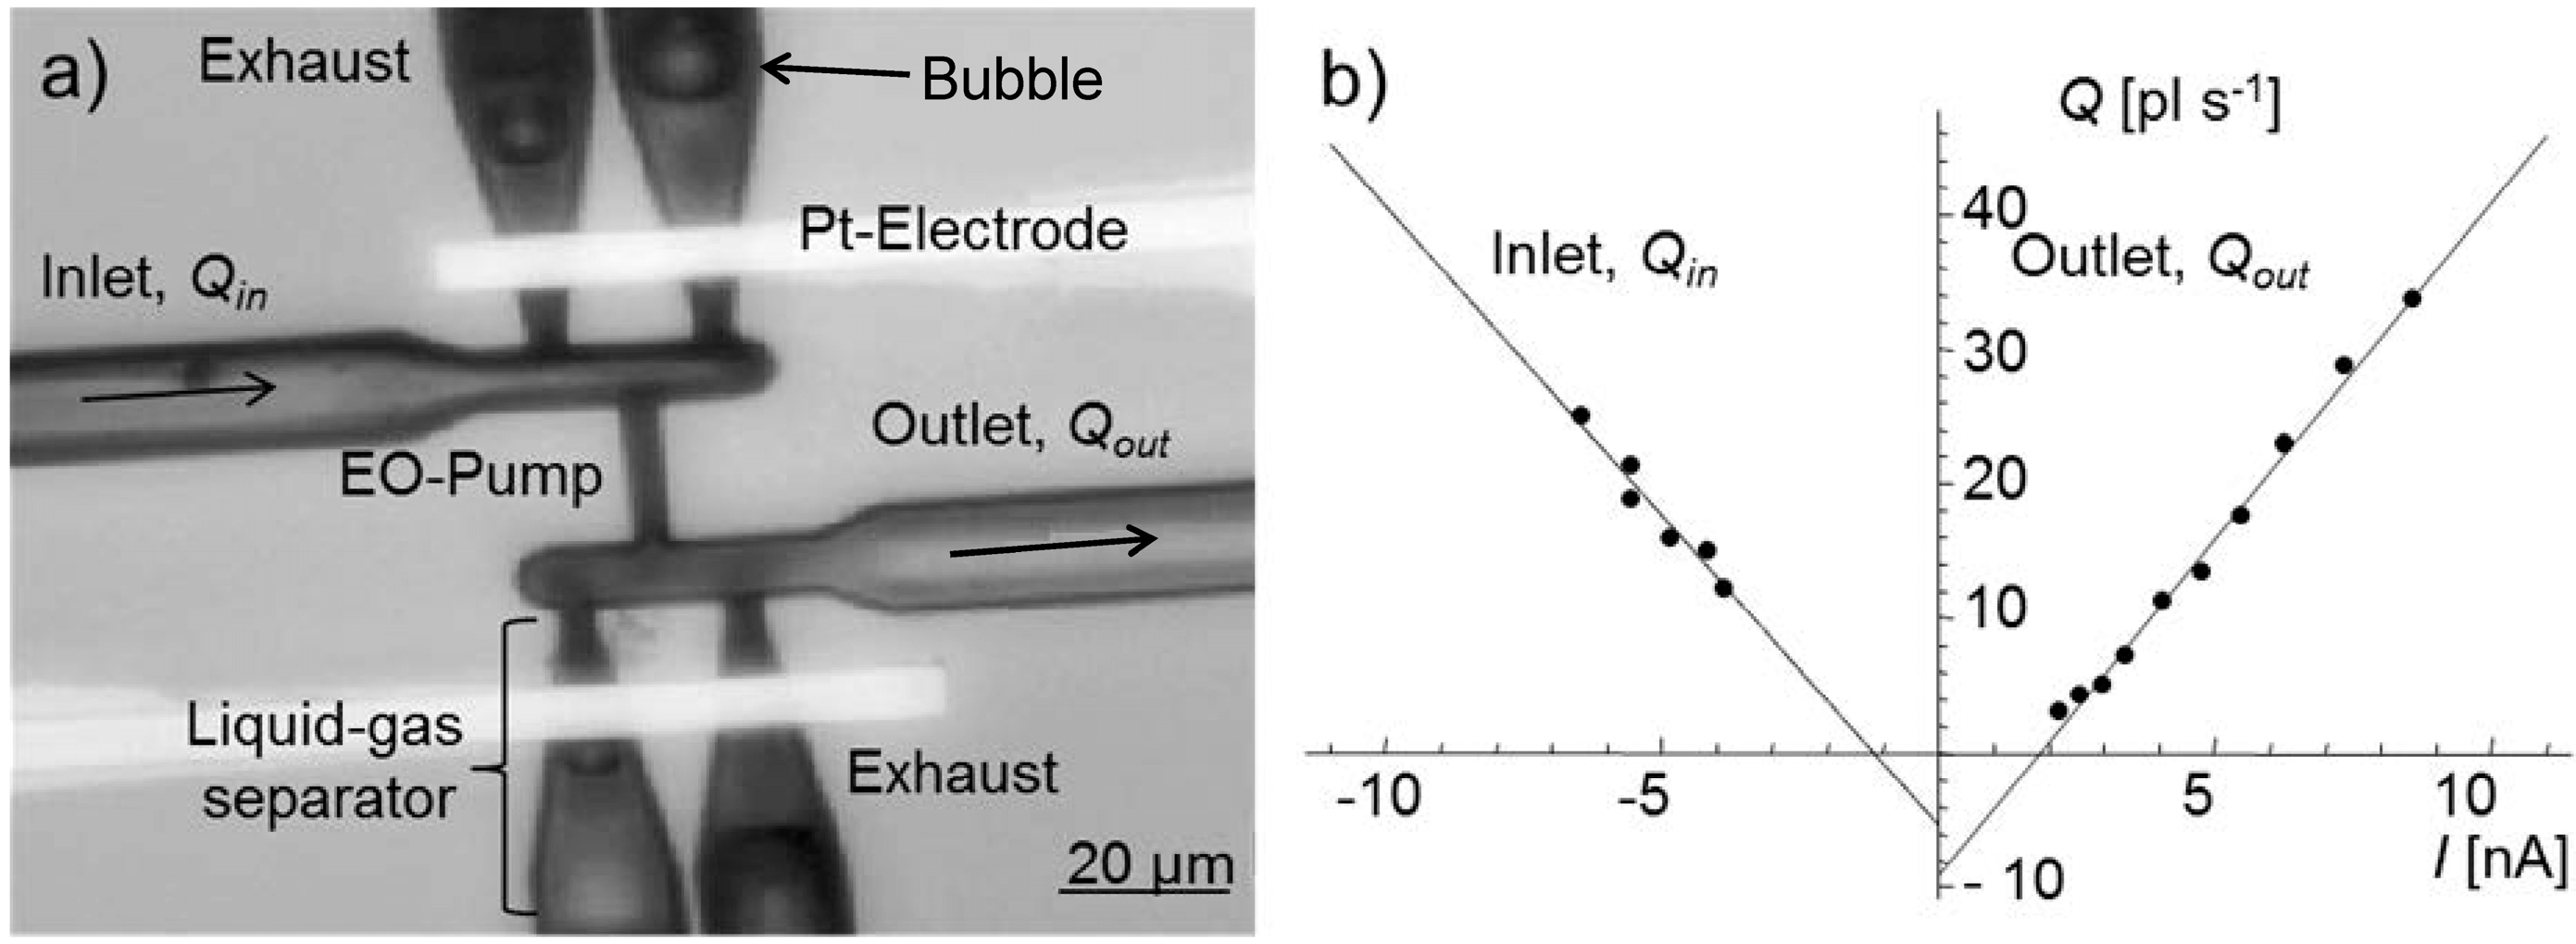
3.2.3. Electro-osmotic Pump

Electro-osmostic (EO) pumping [97] exploits the interaction of an electric field with an ion containing liquid. EO requires an electrically charged capillary surface. Ions in the solution are attracted to at the capillary surface. A certain amount of these ions is only loosely bound and can be moved by applying an electric field parallel to the capillary surface. These ions drag bulk of the solution resulting in electro-osmotic flow. This phenomenon can be especially exploited in the microfluidic domain to pump liquids, because capillaries have an advantageous surface to volume ratio. Due to the required ionic interaction between liquid and capillary surface, the range of solutions is limited to mainly water based solutions with low ionic concentrations.
A key challenge in implementing EO pumps into SIP type of devices is integration of the electrical connection into the solution. Furthermore, having electrodes inside the solution initiates electrolysis of the liquid resulting in gas formation. These gases emerge as bubbles and may block the conductive path between the electrodes and, thus, inhibit a further actuation of the pump. Entering of the electrolyzed gases into the fluidic system must be avoided. The possible solution for an EO pump based on Platinum electrodes was presented [97]. The emerging gas bubbles were removed in a novel gas-liquid separator and by special tapering of the capillary sidewalls at the electrode. They were guided away to an exhaust capillary. The specially tapered sidewalls of the capillary present the gas bubbles from interrupting the electrical path between the electrodes within the EO pump which would stop the pumping. A microscope image of such a pump configuration is shown in Figure 8a). The investigated EO pump consisted of capillaries with a diameter in the range of 10 μm to 1.5 μm. The total footprint of the pump was less than 100 μm × 100 μm.
Flow experiments with this type of EO pump were performed. The Figure 8b shows the measurement as a function of the electrical current. The inflow Qin and outflow Qout of the pump were measured. Four contributions to the measured flow can be distinguished. At zero current, the median of the Qin and Qout represents the evaporation-induced flow through the exhaust capillaries. The difference between Qin and Qout was caused by hydrostatic pressure (height difference between the level of the inlet and outlet for the liquid). Due to a slight misalignment of the electrodes within the EO pump, the slopes of the electroosmotic-induced flow for Qin and Qout were slightly different. For deionized water, an EO pumping characteristic of 5 pL·s−1·nA−1 was determined which equals a pump rate of 50 pL/s at an actuation voltage of 5 V.
Electrolysis is omitted by using electrodes like Ag/AgCl. They have the advantage that during pumping, the electrochemical reaction transforms Ag into AgCl and vice versa, rather than electrolyzing the liquid. Furthermore, these Ag/AgCl electrodes are the most common and well understood electrodes for biological and electrochemical measurements [100]. As a disadvantage, this oxidation of Ag or AgCl leads to an altering and the consummation of the electrodes during pumping, and they need to be regenerated by changing the pumping direction. Ag electrodes can be electroless deposited into the capillaries of the SIP [101] and further partially transformed into Ag/AgCl based on an oxidation with ferric chloride (FeCl3). First experiments using polymeric capillaries with 65 μm channels a flow rate of 0.12 nL·s−1·V−1 was obtained [102].
Figure 8. (a) Image of an electroosmotic pump with Pt electrodes. The gas bubbles, emerging due to the electrolysis of water, are guided away from the pump by a novel liquid gas separator [97]; (b) Electroosmotic flow measurements. Next to the electroosmotic-induced flow into the pump (Qin) and out of the pump (Qout), the evaporation induced flow via the exhaust capillaries (median at zero current) and the hydrostatic induced flow (difference Qin and Qout at zero current) can be deduced. Reprinted with permission from [99].
Micromachines 05 00954 g008

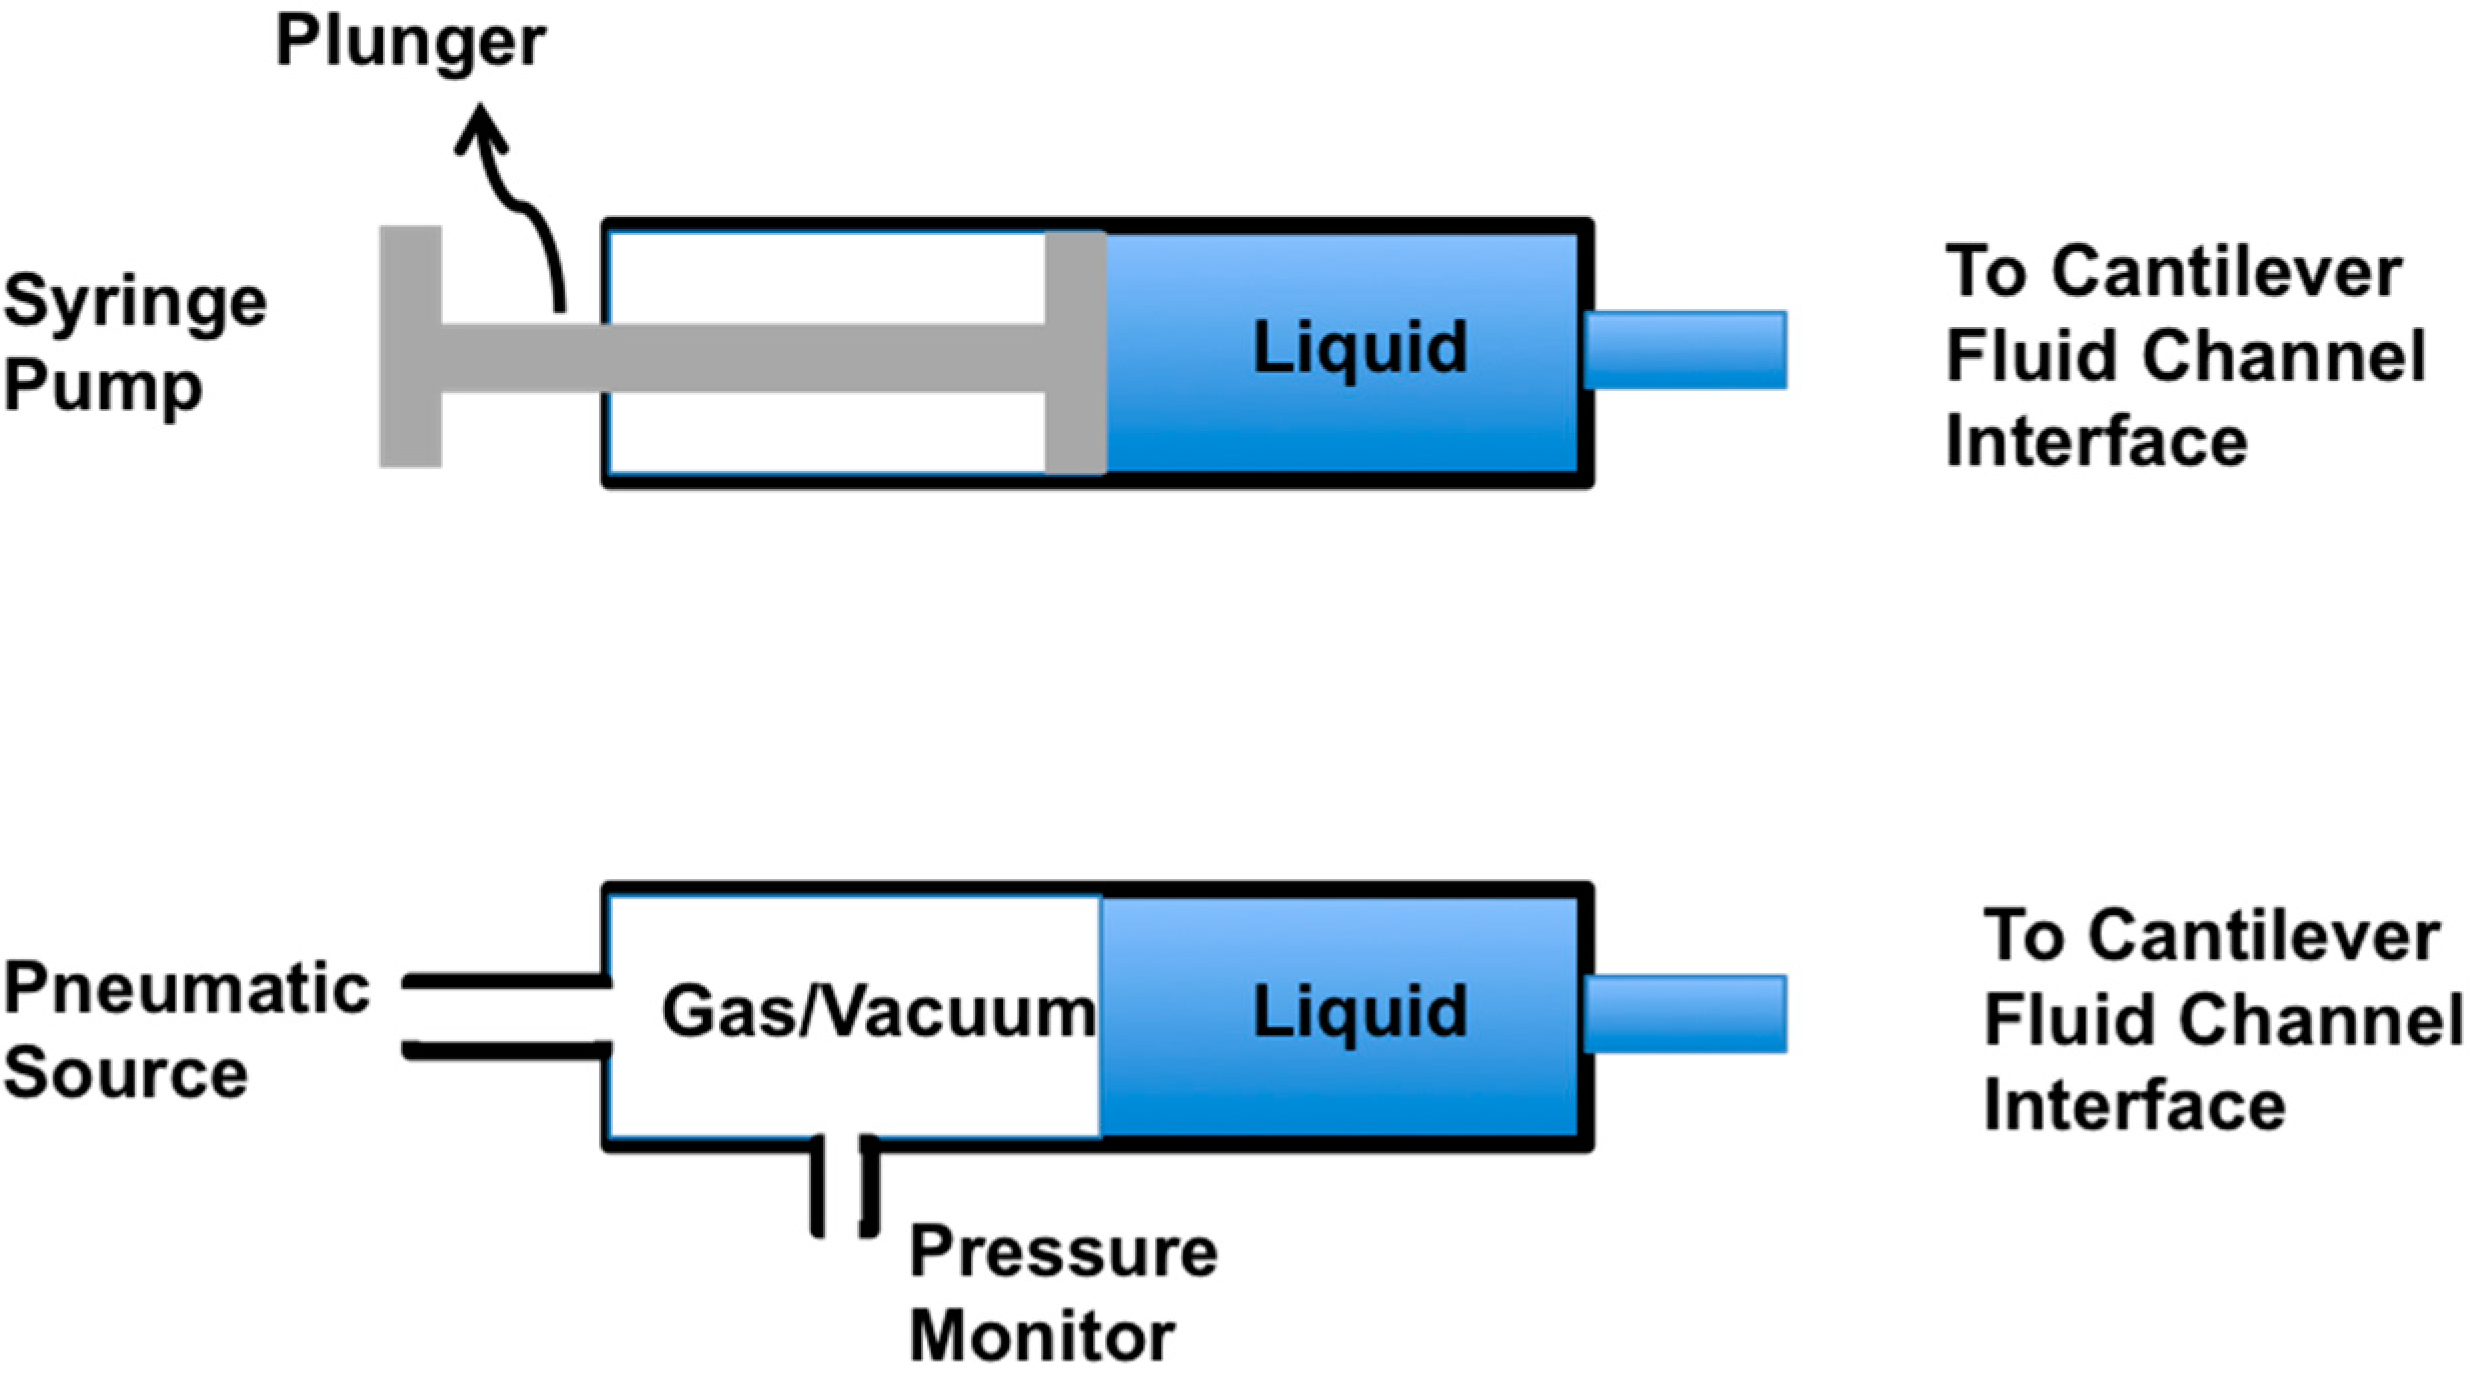
3.2.4. Syringe Pump or Pneumatic Pump

The most common way of pumping fluids in microchannels is either by using a syringe pump (constant volume) or pneumatic pumps (constant pressure) as shown in Figure 9 [103]. In contrast to previously described techniques that are on-chip solutions, these pumping techniques need bulky external peripherals. Presently, the state-of-the-art syringe pumps can reach pL/min flow rates. Precision small angle stepper motors are used to reach such low values. Despite such capability, they suffer from oscillation in the flow due to stepping action and slow response at low flow rate. This is attributed to mechanical compliance of syringes, tubing and chips. It can take seconds or even minutes to stabilize. In the pneumatic pumps, the pressure inside the fluidic channel is controlled instead of flow rate. A pulse-free flow, fast response time (tens of milliseconds) can be achieved with this technique. The flow rate has to be calibrated for applied pressure for every given channel dimensions. In the electrical analogy [104], syringe pump is similar to a current source, the pneumatic source is similar to a voltage source and the flow rate is similar to current.
Figure 9. Syringe-based pumping and pressure-based pumping.
Micromachines 05 00954 g009

3.3. Fluid Dispensing

The simplest way to dispense fluids using cantilevered probes is by touching the cantilever loaded with liquid at the desired location on the substrate. The surface energy of the substrate and the surface tension of the liquid define the amount of fluid dispensed. In the following section, all the parameters involved in dispensing the liquid are discussed.

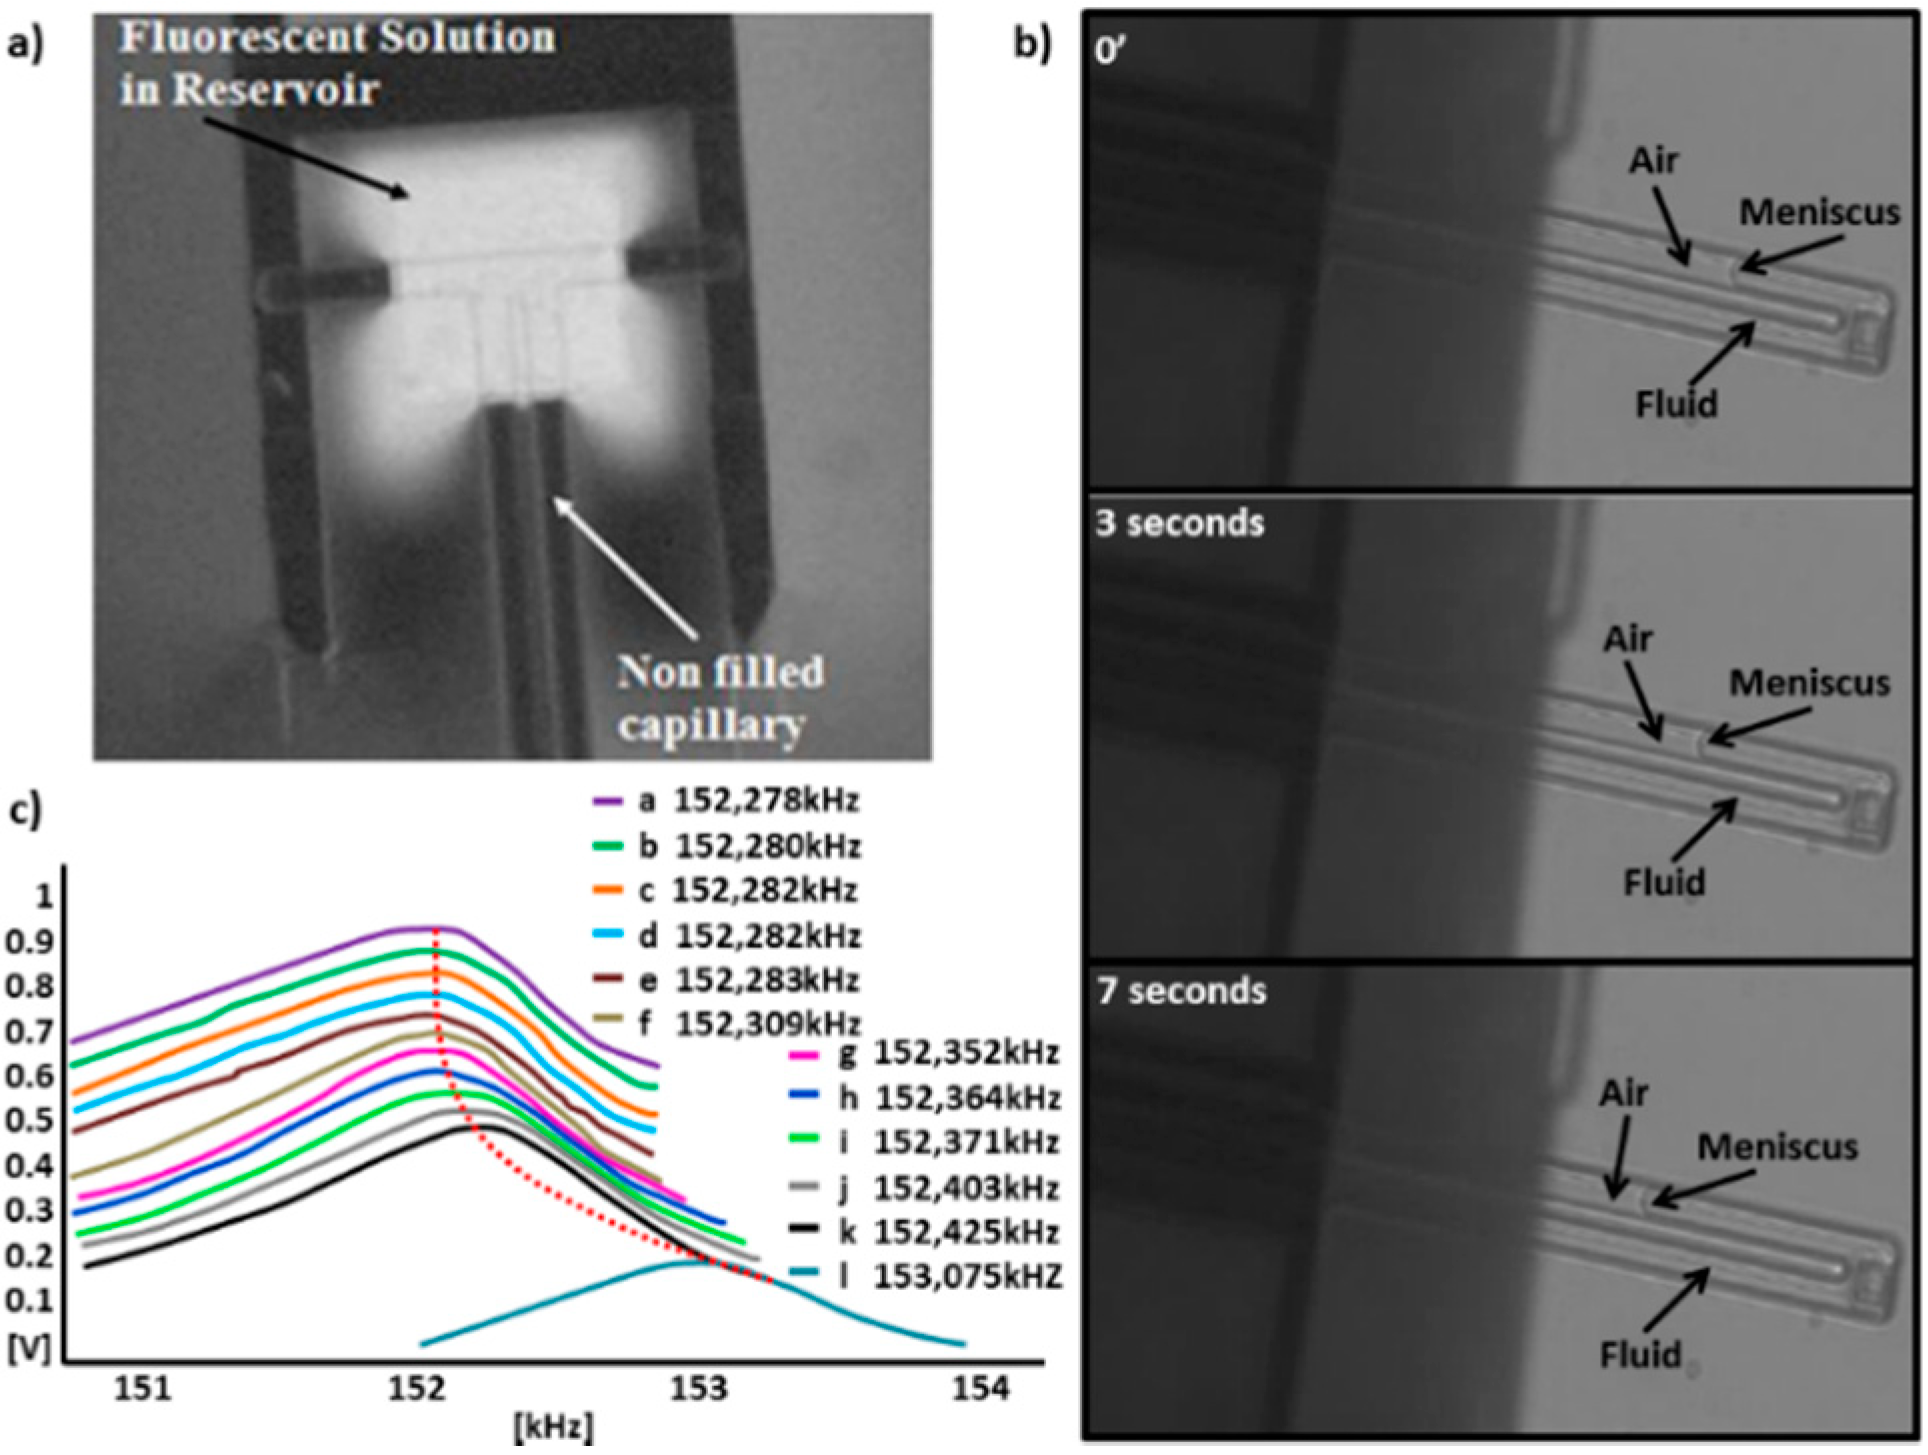
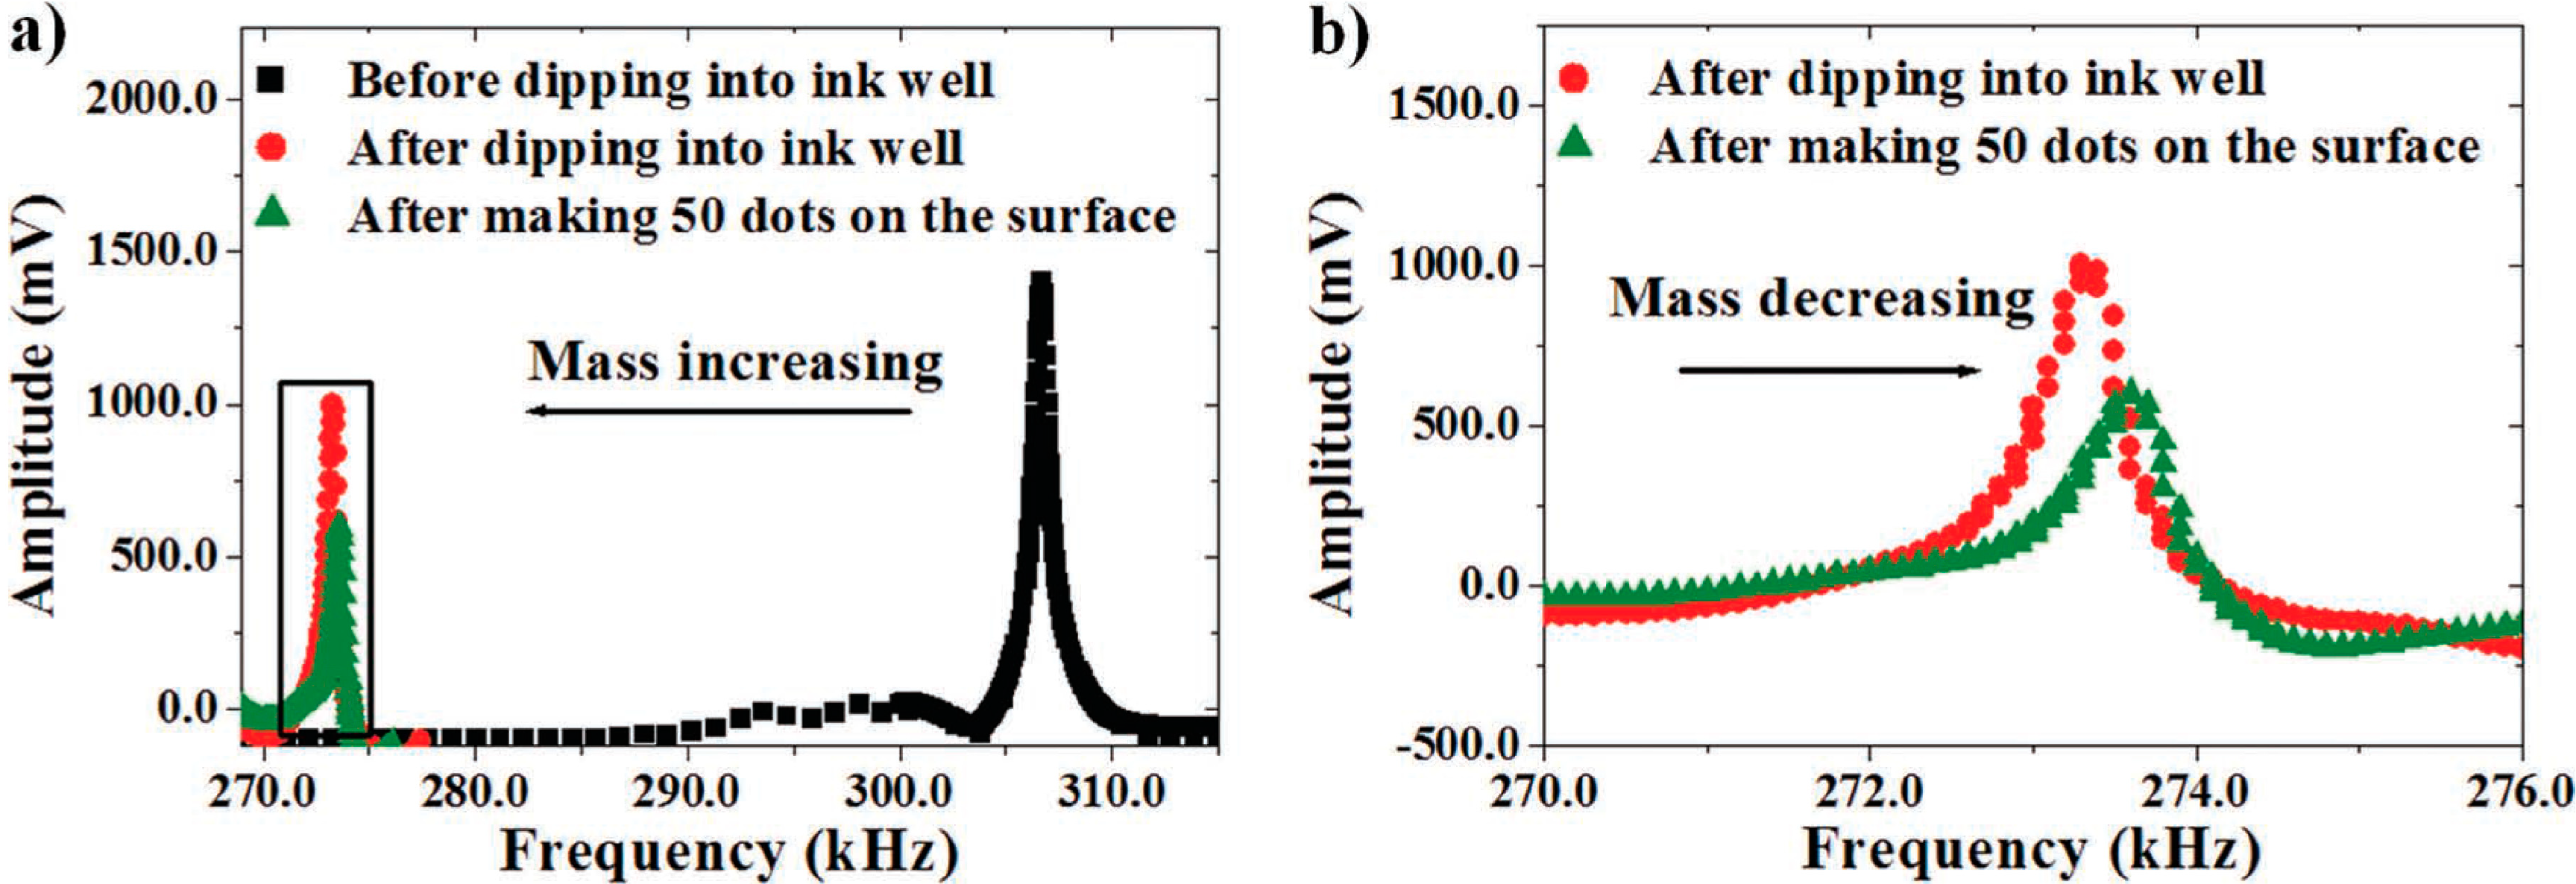
3.3.1. Monitoring of Fluid Handling

The fluid handling constitutes, monitoring fluid loading inside the cantilever and droplet dispensing on the substrate. The dynamic and static behavior of the cantilever are analyzed to obtain these parameters.

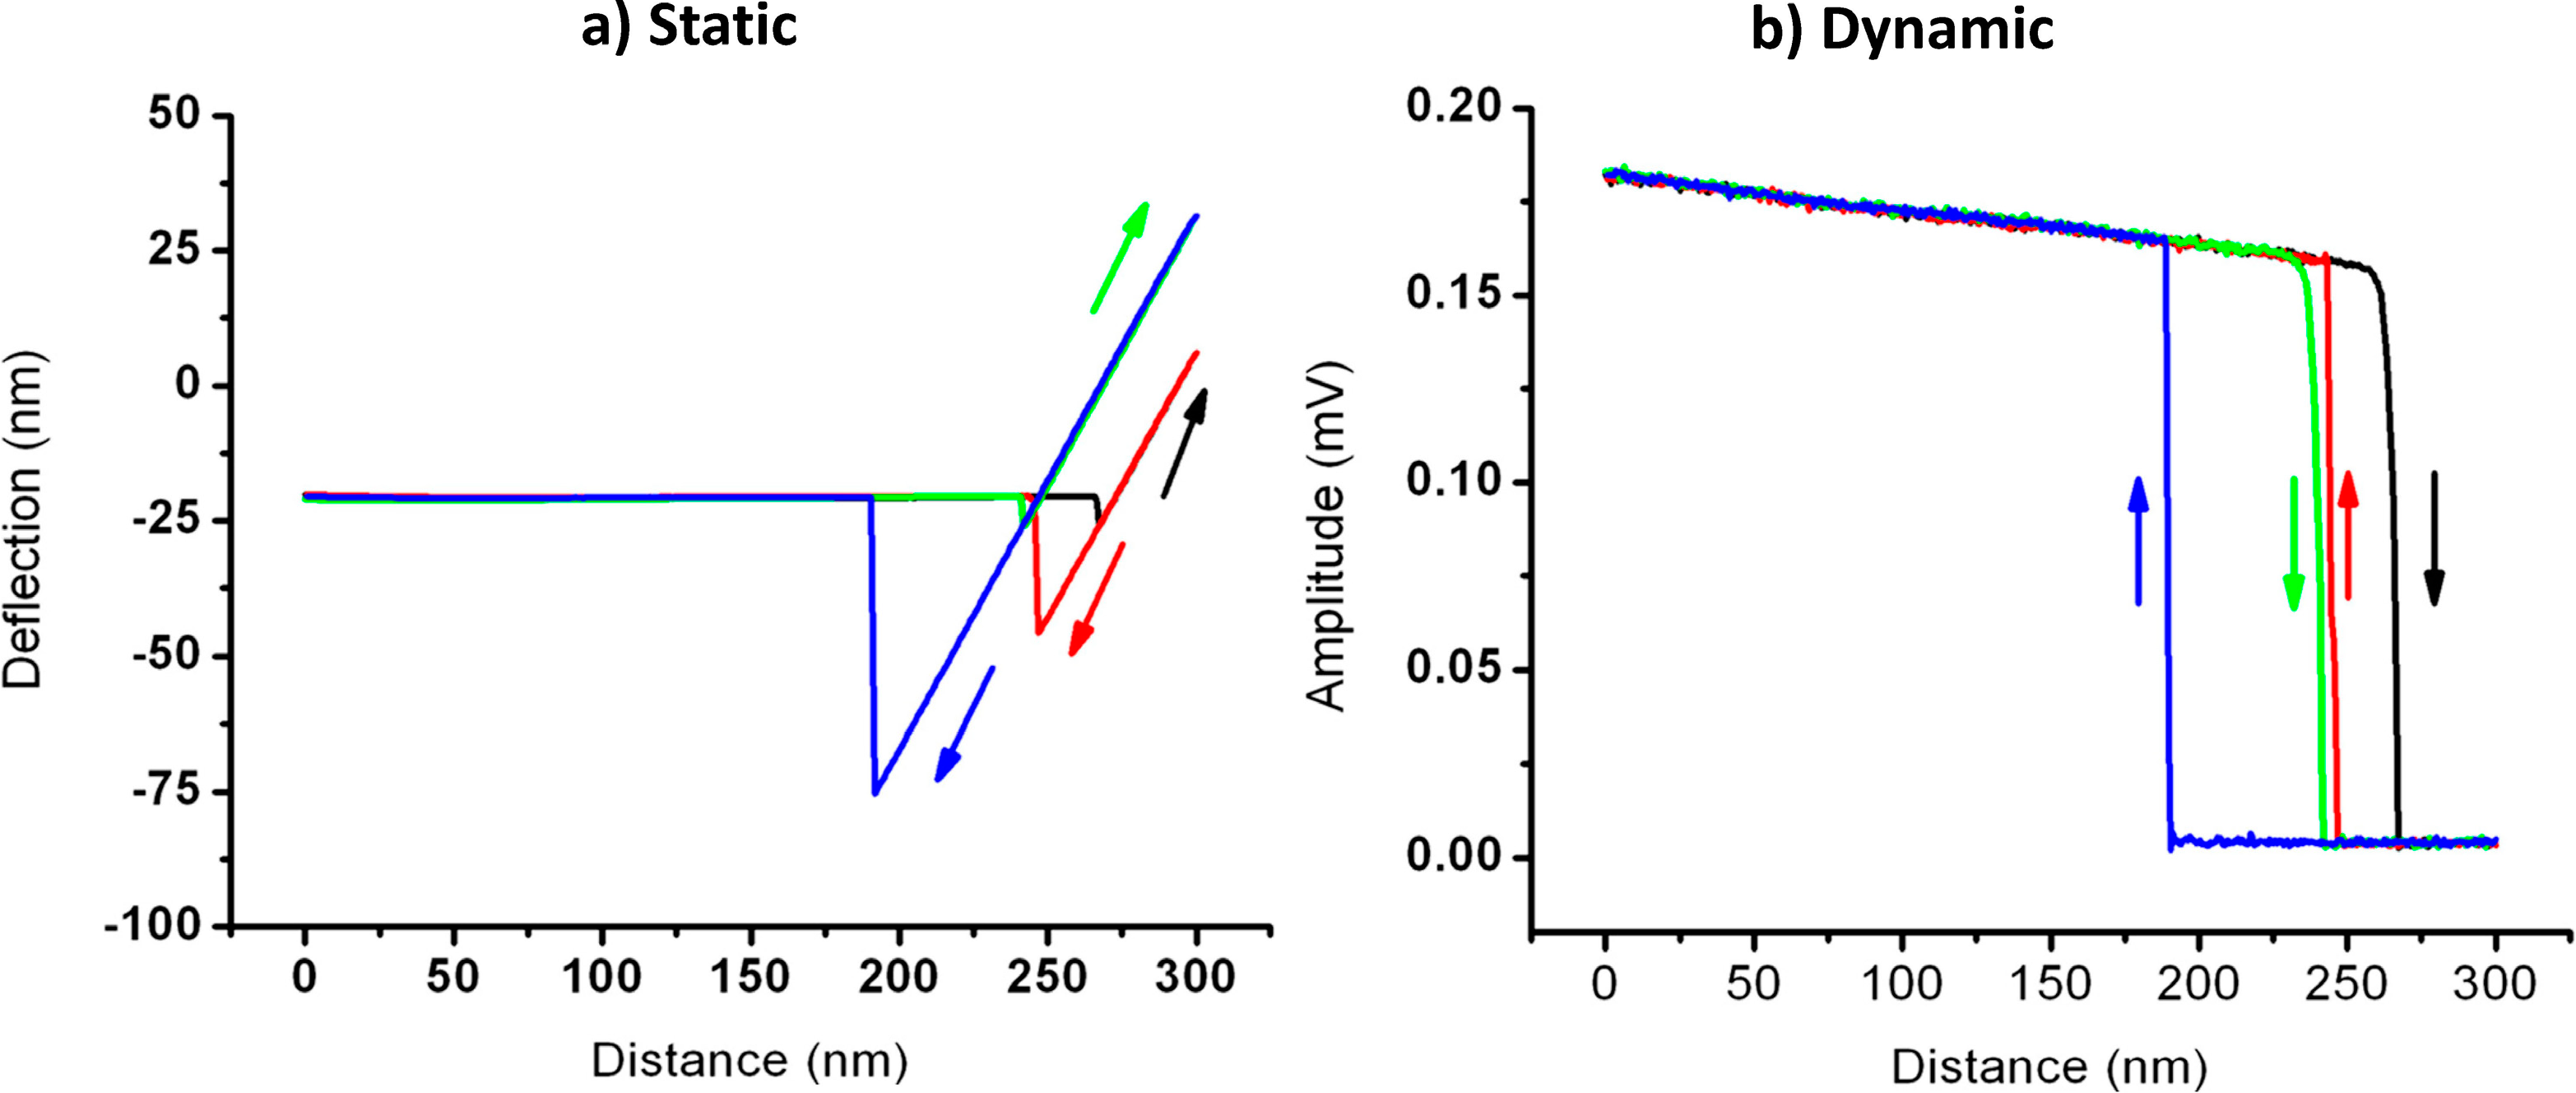
Dynamic Mode for Cantilever Filling and Droplet Dispensing:

The loading of the cantilever with fluid can be measured by monitoring the change in the effective mass of the cantilever. This is obtained by measuring shift in the resonance frequency of the cantilever. For DPN or NADIS type cantilevers, since only the tip of the cantilever is loaded, it is similar to a point-mass loaded cantilever. The mass addition is given by the equation:
Δ m = 2 M f Δ f
where, Δm is the mass of the droplet added to the cantilever, M is the effective mass of the cantilever before mass loading, f is the resonance frequency before mass loading and Δf is the shift in resonance frequency after the sample droplet is added. The resonance frequency decreases, when mass is added. The loaded cantilever is used for dispensing droplets on the chosen substrate. The resonance frequency shift for every drop that is dispensed can be measured if the resonance curve has a quality factor to resolve the difference in resonance frequency before and after dispensing a droplet. Using a DPN cantilever of mass 11.3 ng and a fundamental resonance frequency of 306.7 kHz, a solution containing 1 mol % of fluorescently labeled DOPC phospholipids was picked and dispensed. A mass of 2.3 pg at 65% relative humidity (RH) and 1.5 pg at 50% RH was measured for each dispensed droplet by monitoring the change in resonance frequency after dispensing of each droplet [105] (Figure 10).
Figure 10. (a) Decrease in the resonance frequency of the cantilever before and after dipping in the solution (black squares to red circles). Increase in the resonance frequency after dispensing 50 droplets (red circles to green triangles). (b) Closer view of the increase in the frequency after a mass equivalent of 50 dots is released from the cantilever. Reprinted with permission from [105].
Micromachines 05 00954 g010
For NADIS cantilever with 300 nm wide aperture, droplets ranging from sub-micrometer to 5 μm were deposited with masses ranging from 20 pg to 0.2 pg with the corresponding volumes between 15 fL and 150 aL. A separate quad beam resonator was used to measure the dispensed mass [106].
For a hollow-cantilevered beam like NFProbe, NFPen or SIP, the same equation holds to measure the amount of liquid loaded into the cantilever. However, the distributed mass should be considered instead of a point mass and the change in the spring constant is neglected. Most importantly, the energy dissipation (quality factor) remains constant for empty and filled cantilever [107] (which is in contrast to the cantilever vibrating in liquid [108]). Unlike in DPN and NADIS technique, where the effective mass of the cantilever decreases after every droplet dispensed, the fluid in the reservoir immediately replaces the lost mass of the cantilever. This makes impossible to determine the mass of the dispensed droplet from the resonance frequency of the cantilever. Therefore in these types of devices, resonance frequency can be used only to determine empty or filled cantilever and not dispensed droplet mass. However, from the data of dispensed droplet dimensions and density of the liquid, the dispensed droplet mass can be determined indirectly.

Simultaneous Static and Dynamic Mode for Droplet Dispensing:

In the static mode, the force experienced by the cantilever tip upon contact with the substrate surface, is measured by cantilever deflection as a function of z-scan (deflection-distance or force-distance curves). In addition, if the cantilever is set to resonate, the amplitude of the resonance frequency can also be monitored simultaneously along with the deflection (the average position of the resonating cantilever). This approach and retract curves are shown in Figure 11.
For an empty cantilever, during approach when it is a few nanometers away from the surface, capillary condensation happens between the tip and the substrate due to atmospheric humidity. This phenomenon snaps the cantilever to the substrate. This is shown as a kink in the black approach curve in Figure 11a. Once in contact with the substrate, the deflection of the cantilever will continuously increase as it gets pushed against the substrate. During retraction, shown by the red curve, the capillary forces of the meniscus hold the cantilever in contact for a longer z distance compared to snap-in distance before it snap-off from the surface. If the cantilever spring constant is measured, the area between the snap-in and snap-off position gives the amount of work needed to pull the cantilever away from the surface.
When the cantilever is filled, the liquid reaches the tip aperture and is held in equilibrium inside the cantilever due to surface tension. During approach, shown by the green curve, the cantilever again gets snapped to the surface due to capillary condensation. But, in this situation, the liquid inside the cantilever near the tip aperture gets coalesced with the capillary bridge, breaking the liquid equilibrium inside the cantilever and establishing a path for the fluid inside the cantilever to flow. The surface energy of the substrate pulls the liquid out of the cantilever causing dispensing of the liquid till a new equilibrium between surface tension of the liquid and surface energy of the substrate is reached. During retraction, the cantilever is held for even longer distance of vertical displacement than when the cantilever was empty because of the stronger capillary force of the dispensed droplet, shown by the blue curve.
In the dynamic mode, the amplitude of the resonance frequency remains constant when the cantilever is far away from the surface during approach, shown by the black curve in Figure 11b. When the cantilever touches the surface, the amplitude of resonance frequency becomes zero because the cantilever doesn’t oscillate anymore. It regains its amplitude during retraction, shown by the red curve at a different distance again due to the capillary forces. The distance between the snap-in and snap-off will increase when a droplet is dispensed by liquid-filled cantilever, shown by green and blue curve.
Figure 11. Simultaneous measurement of static and dynamic mode. (a) The static deflection of the cantilever and (b) amplitude of the resonance frequency plotted as a function of tip distance from the substrate. Black and red curves represent data for empty cantilever, while green and blue curves represent the data for liquid-filled cantilever. Reprinted with permission from [96].
Micromachines 05 00954 g011

3.3.2. Physics of Dispensing

The various parameters that influence the droplet size are given below. These parameters are intrinsically related. Controlling all the parameters at the same time is quite complex. Some of them are discussed in detailed in this section. They are clustered into four categories:
  • Liquid properties: Reynolds Number, Surface tension, Capillary forces, Viscosity, Laplace pressure, and Concentration.
  • Tip-Surface Interactions: Bond Number, Capillary Length, Adhesion mechanism, Molecular transport mechanism, Contact angle, Contact time, Number of contacts on the same spot and Withdrawal speed of the tip.
  • Environment Conditions: Humidity, Temperature and Evaporation rate.
  • Geometrical properties: Shape of the tip, Nozzle size and Nozzle position.

Reynolds Number:

The physical behavior of the liquid inside a microfluidic channel is defined by this number. It is defined as the ratio of the inertial forces to the viscous forces [109,110]:
R e = 2 R h ρ υ μ
where, Rh is the hydraulic radius (typically radius of the fluid channel), ρ is the fluid density, v is the mean fluid velocity, and μ is the dynamic viscosity. A value of Re = 2000 is the empirical limit between laminar (Re < 2000) and turbulent (Re > 2000) fluid flow. If the channels are rectangular, then Rh is defined as 2A/P, where A is the cross-sectional area and P is the perimeter. For all the channeled SPM-based dispensing devices Re < 1, making the flow profiles always laminar.

Bond Number and Capillary Length:

When the characteristic height of the liquid meniscus in a liquid bridge between the surface and the tip is quite smaller than the capillary length λ C = γ ρ g (where, γ is the surface stress, ρ is the liquid density, and g is the acceleration due to gravity) the effect of the hydrostatic pressure due to the gravity (Ph = ρgh) can be neglected. This is also expressed in terms of bond number Bo [111], which is a dimensionless number and a ratio of the gravitational forces to the surface tension forces ( B o = ρ g L 2 γ ), where ρ is the density of the liquid, L is the characteristic length of a capillary surface (height or radius of a droplet or radius of a channel) and g is the acceleration due to gravity. For Bo < 1, surface stress forces dominates and for Bo > 1, surface effects are neglected. For a dispensed droplet (sessile drop) in the spherical cap shape, the largest dimension is the base of the droplet, which is smaller than the capillary length. For SPM based dispensing, for a droplet of 1 micron diameter Bo << 1 for which the gravity effects can be neglected. The capillary length of water is 2.7 mm and the channel dimensions of the cantilever are in the microns range; therefore, the effect of gravity for the fluid flow inside the hollow channels can also be neglected.

Adhesion Mechanism:

The behavior of the cantilever tip with the substrate during dispensing and not dispensing of a droplet is described in Section 3.3.1 (Figure 11). When a tip comes in contact with the substrate, there exist capillary attractive forces within the contact area leading to adhesion of the tip to the substrate. From the behavior of deflection-distance curves, the strength of the adhesion forces can be measured. For an uncoated silicon tip, capillary adhesive forces were observed to be present even at 0% humidity (dry nitrogen environment) [112] (Figure 12). The meniscus disappeared only in the ultra high vacuum (UHV) environment. For a tip coated with hydrophilic molecules, the capillary adhesive forces increase with humidity, whereas, for tip coated with hydrophobic molecules, the adhesive forces were decreased with humidity. Furthermore, the adhesion mechanism for the hydrophobic tip is more due to the intermolecular interaction between the molecules on the tip and the substrate than the capillary forces due to water meniscus. A ring-like pit pattern was formed on a NaCl substrate at 20% RH with a tip coated with hydrophobic molecules. This happened because the hydrophobic molecules on the tip displaced the water layer on the substrate and formed a meniscus on the tip edges. Dispensing of biomacromolecules like DNA and proteins require sufficient amount of humidity forming a meniscus between the tip and the substrate indicating that the capillary forces are responsible for the adhesion of the cantilever to the substrate [112].
Figure 12. Force distance curves measured for a bare silicon tip as a function of chamber humidity content varying from 22% relative humidity (RH) to ultra high vacuum (UHV). The difference in the adhesion force between atoms (can be estimated by JKR theory [113]) in UHV conditions and capillary forces at 22% RH is quite significant. Reprinted with permission from [112].
Micromachines 05 00954 g012

Molecular Transport Mechanism:

Once the cantilever is in contact with the substrate by capillary adhesion, the molecules get transported from the tip to the substrate (Figure 13).
In DPN, when the tip comes in very close proximity of the substrate a nanoscale water bridge in the form of meniscus is formed between tip and substrate. The meniscus formation is either due to the capillary condensation from the environment or the coalescence of already existing water layers present on both the surfaces. If the cantilever tip is coated with hydrophilic molecules or amphiphilic molecules, they use this water meniscus to get transported from the tip to the substrate. The final droplet size obtained depends on (1) ink dissolution into the meniscus; (2) ink diffusion through the meniscus; (3) ink adsorption onto the surface of the substrate; (4) outward ink diffusion along substrate surface; and (5) binding of the ink to the substrate. But the question arises, how do the hydrophobic ink molecules that are insoluble in water would be transferred to the substrate surface. What would be the role of the meniscus for transfer of the ink molecules and their subsequent diffusion on the substrate?
Sheehan and Whitman [114] have proved that it was possible to deposit hydrophobic molecules even at 0% humidity, concluding that meniscus is not needed for depositing the molecules. When the tip came very close to the surface, the molecules diffused from the tip surface to the substrate surface. In fact, a tip with hydrophobic molecules treated with different solvents resulted in different writing dynamics. The transfer is controlled by the chemical nature of the physisorbed molecules on the tip. The spot size depends on the surface diffusion of the ink molecules chemisorbed on the substrate surface. Two models were developed to describe this ink diffusion. One assumes tip as a source of molecules with constant flux [32] and the other as constant concentration [114]. These models explain the time dependent growth of the spot size. At higher humidity conditions, the meniscus acts slightly detrimental for hydrophobic molecules by decrease in spot size. To further understand the role of water meniscus, experiments were performed to see the water meniscus formation between the tip and NaCl substrate. The idea was that capillary condensation of water between the tip and the water would generate a pit in NaCl substrate. Interestingly, it was observed that pits were formed in the NaCl even at 0% humidity condition indicating that water meniscus does exist and has influence on the spot size. Pits were formed even for hydrophobic tips [112,115]. Therefore, the question still remains, what is the exact role of the meniscus in dispensing hydrophobic molecules in DPN? However, it can be concluded that the deposition always happens in the presence of water meniscus, the magnitude of the effect depends on the solubility of the ink molecules in the meniscus [116].
Figure 13. Dispensing mechanism for different probes. (a) DPN with diffusive molecular dispensing; (b) Tips with nozzle (Nanoscale Dispensing (NADIS), Scanning Ion Pipette (SIP), Nanofountain Pen (NFPen), Bioplume) perform non-diffusive liquid dispensing; (c) NFProbe also performs diffusive molecular dispensing with liquid source very close to the tip [117].
Micromachines 05 00954 g013
In the techniques with a nozzle on the tip (NADIS, SIP, NFPen, Bioplume), the liquid flows from the nozzle to the substrate till equilibrium between surface energy at the substrate contact and energy due to Laplace pressure in the liquid bridge is reached. For a hydrophilic tip and hydrophilic substrate (like SiO2 surface), the entire NADIS tip reservoir was emptied during droplet dispensing. By treating the surface with hydrophobic amine, the droplets were controlled based on the contact time. The aperture size on the tip had no influence on the droplet size. This indicates that surface energy has a greater role to play on the droplet size [118]. The dispensed droplet size does not dependent on how long the tip is in contact after the equilibrium has reached. Therefore, this lead to the conclusion that the liquid transfer is a non-diffusion process, completely in contrast to the mechanism involved in DPN [118], especially for the alkanethiol molecules on gold substrate.
With volcano tip and liquid source at the very close proximity of the tip, the dispensing mechanism of NFProbe is still molecular transport similar to DPN.

Shape of the Tip:

Usually, sharper the geometric shape of the tip, smaller the droplet obtained. The pyramidal silicon nitride tips are usually around 10 nm at its sharpest point (Figure 14). Typically, the shape of the tip is pyramidal. This is a result of wet etching of Si along (111) plane. Techniques like DPN, SIP, NADIS use this pyramid-shape tip (Figure 14a,b). The NFProbe has a volcano-type tip (Figure 13c) and the other bio-probes have needle-shaped tip (Figure 14c) [119]. The advantage of volcano-type tip is that the liquid inside the cantilever will not be in direct contact with the substrate but it will be close enough to keep the required humidity of vapors near the droplet. Whereas the sharp tip helps in the biological applications for probing into samples like cells without making big incisions.
Figure 14. Different tip shapes of the dispensing cantilevers. (a) Pyramidal tip used in DPN, NADIS, and SIP; (b) the zoomed-in view of the tip; and (c) a hollow sharp needle-like tip. Reprinted with permission from [119].
Micromachines 05 00954 g014

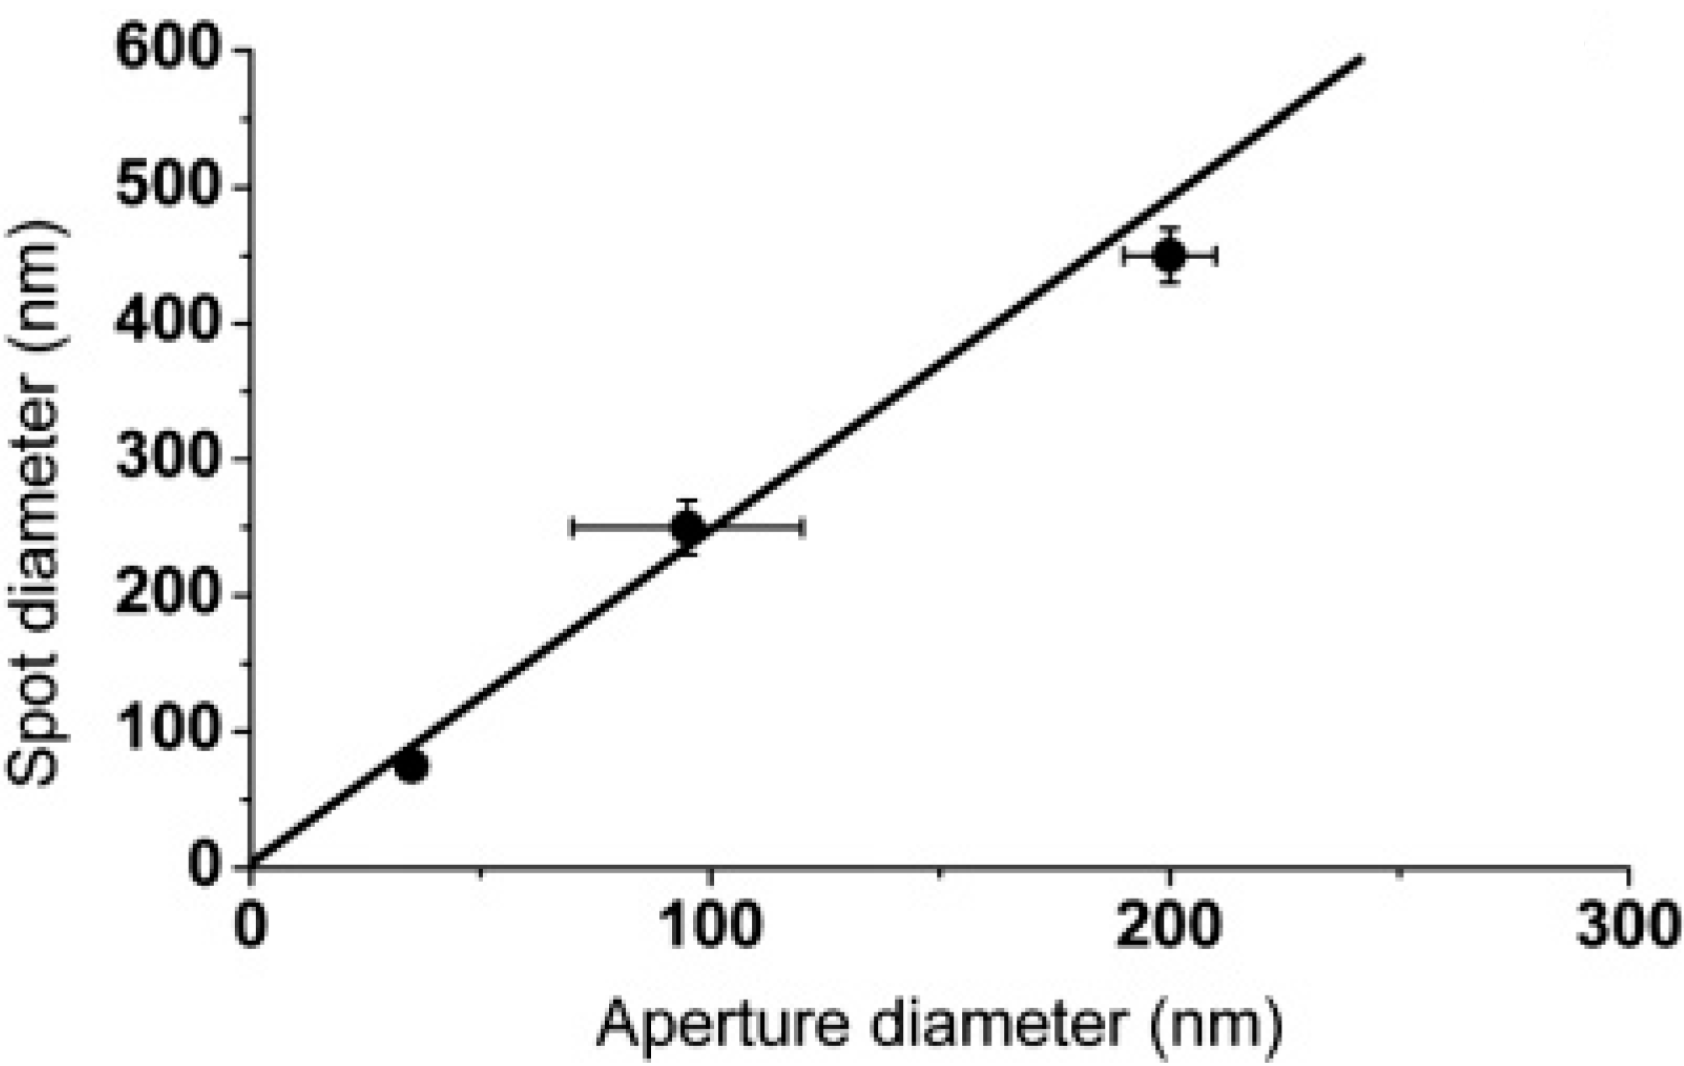
Aperture Size and Position:

For hollow cantilevers with on-chip reservoirs, an aperture has to be created on the cantilever tip for fluid dispensing. For SIP or NADIS devices where aperture is made at the end using FIB milling, the aperture size and position can be controlled. If the aperture is made on the tip, the size of the droplet is proportional to the size of the aperture (see Figure 15). The aperture can also be made on the wall of the tip, keeping the sharp tip intact. The sharp tip helps both to keep the droplet size smaller and achieve high-resolution imaging. An example of a tip with the aperture on the tip wall and one with the aperture on the apex are shown in Figure 16a and Figure 16b, respectively.
Figure 15. The spot sizes obtained for various aperture diameters deposited by a hydrophobic tip on a hydrophobic amine substrate surface with various aperture diameters made on the tip apex (NADIS). Reprinted with permission from [118].
Micromachines 05 00954 g015
Figure 16. (a) Nozzle on the wall of the pyramid, keeping the tip sharpness for imaging; and (b) nozzle on the tip apex for direct transfer of liquid to the substrate.
Micromachines 05 00954 g016

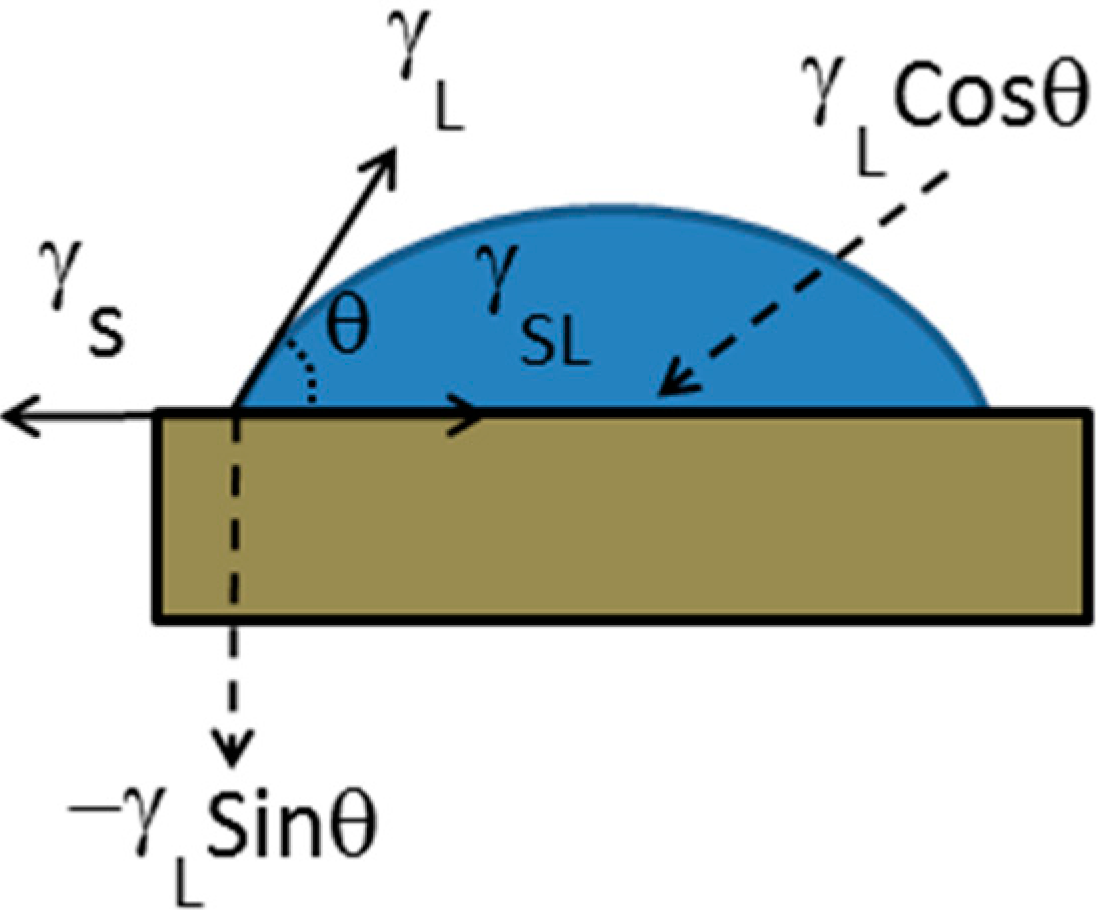
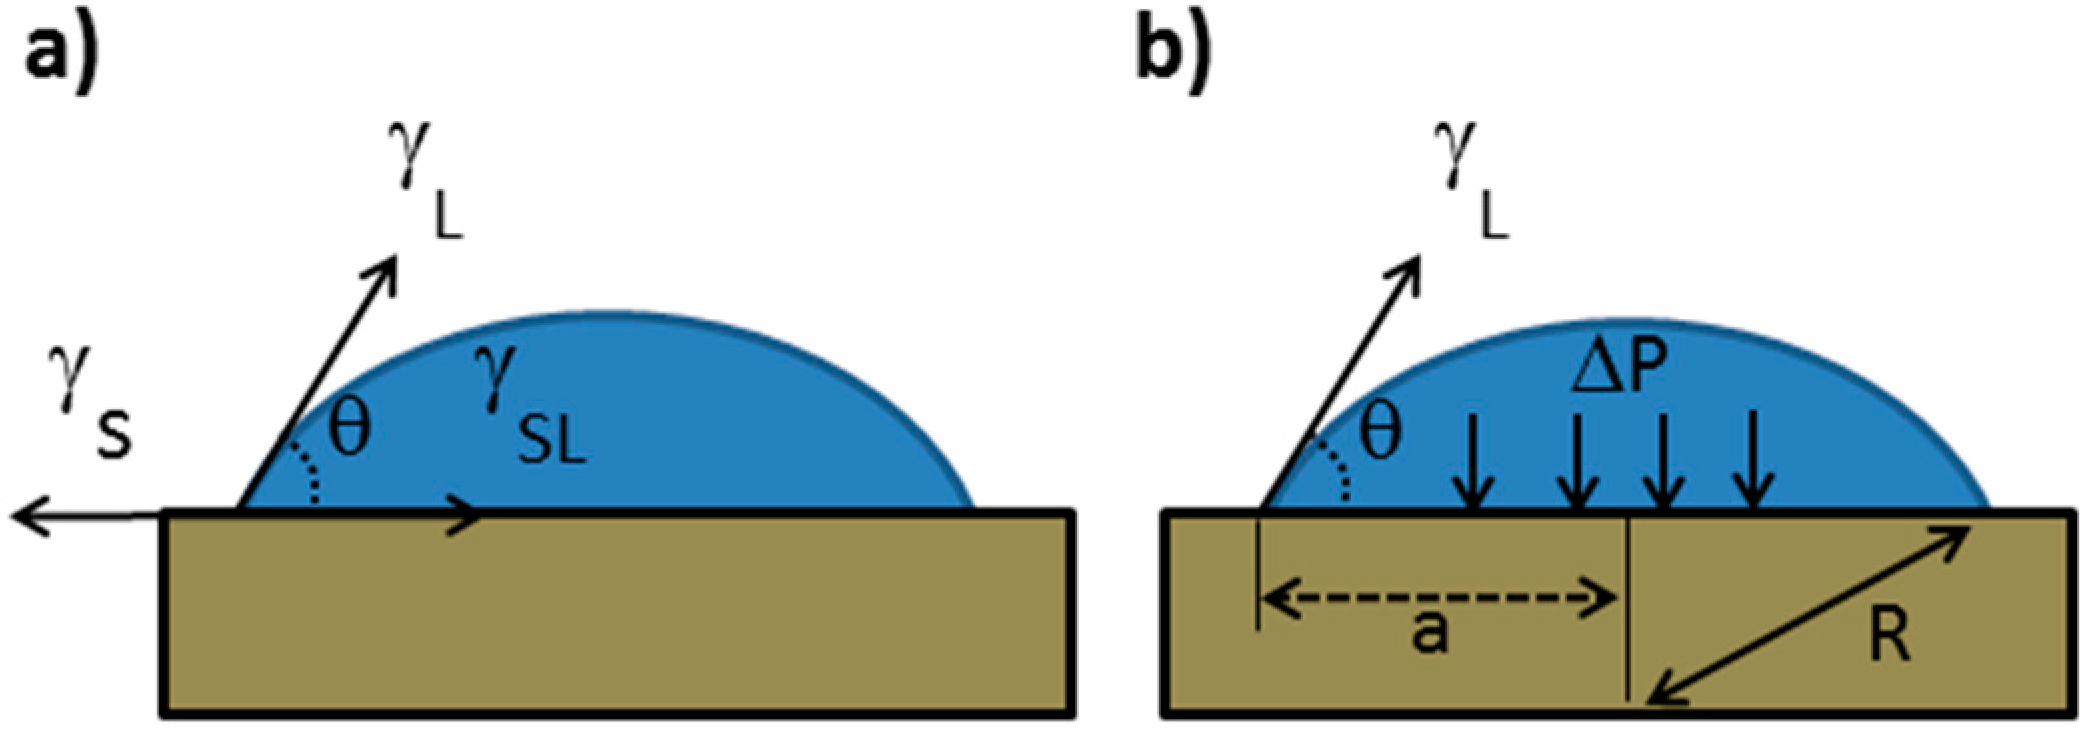
Contact Angle on the Substrate:

The contact angle is one of the crucial parameters for dispensing in a non-liquid, non-mixable environment. It is extremely difficult to handle and control. It is sensitive to a monolayer of molecules on the substrate. The contact angle is given by the Young’s condition. It can be viewed in a vector form (Figure 17) [120]:
γ S = γ S L + γ L c o s θ
The vectors γ S , γ S L and γ L are the surface tension (surface energy) values referring to solid-vapor, solid-liquid and liquid-vapor interfaces respectively and θ is the contact angle of the droplet with the substrate. These forces acting at the triple line per length gives the droplet its shape.
Figure 17. Various surface tension vectors acting on a droplet with a contact angle θ.
Micromachines 05 00954 g017

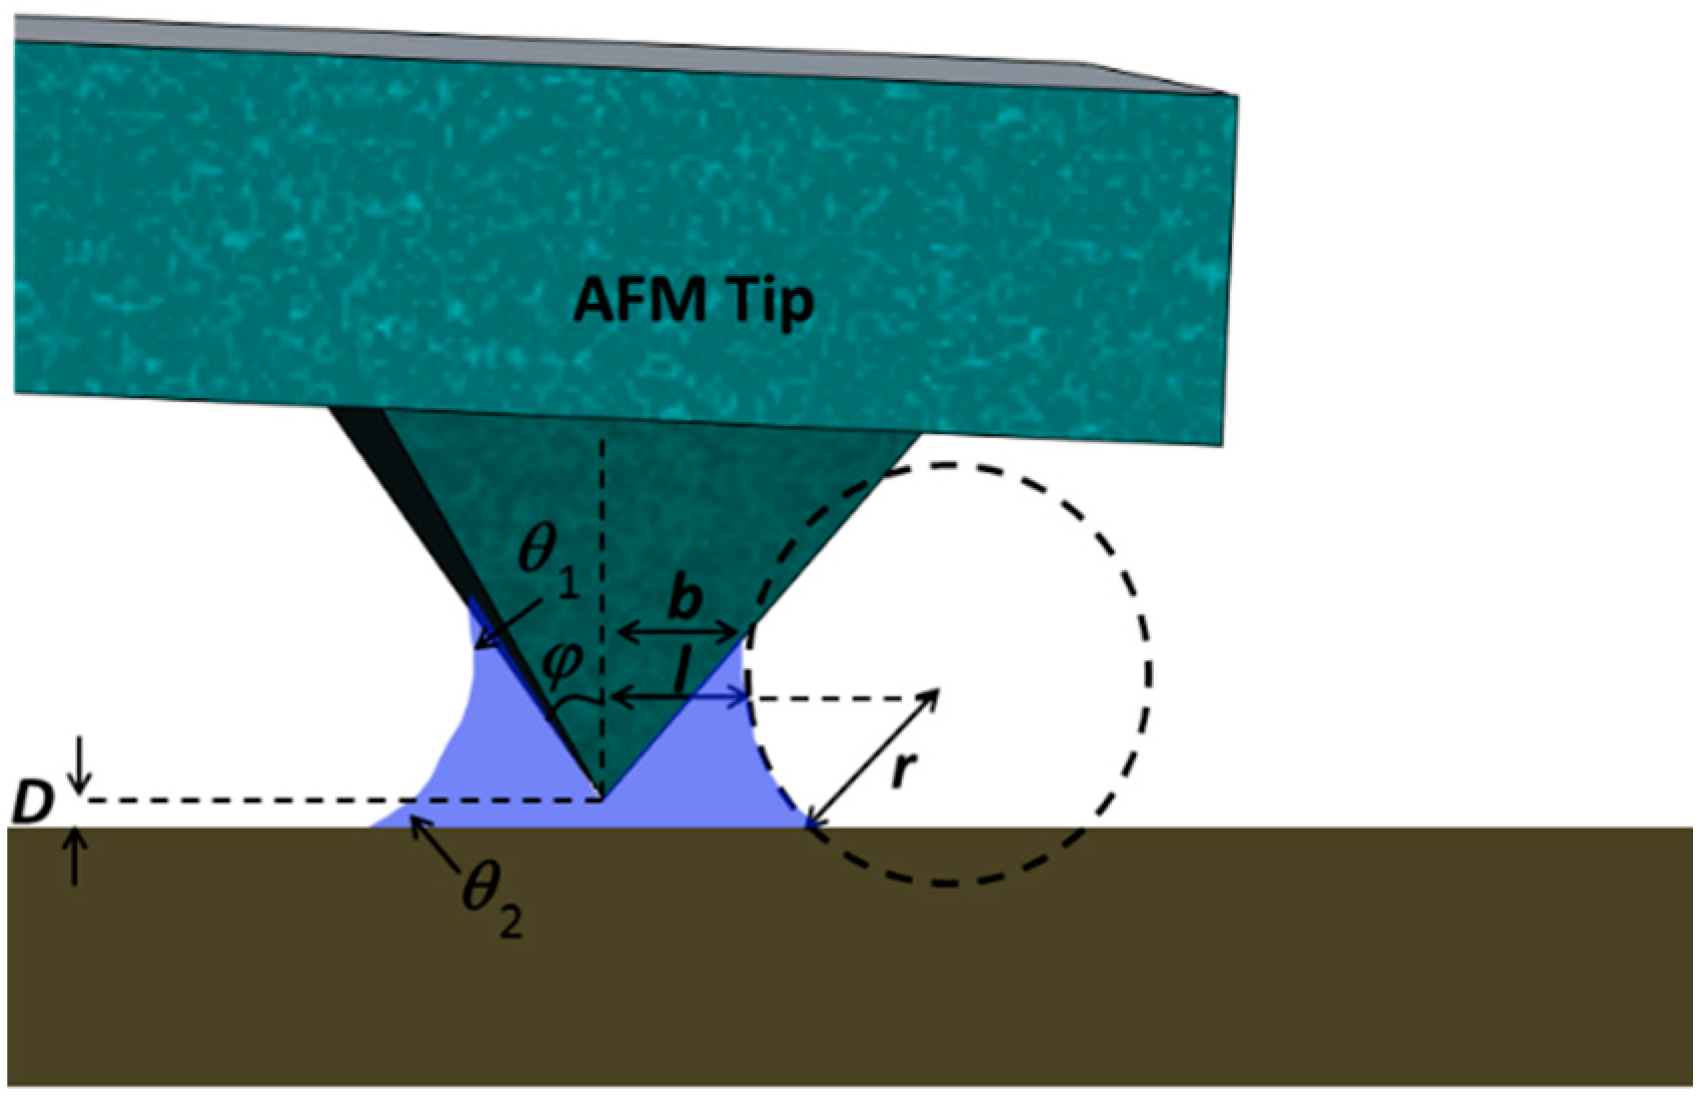
Laplace Pressure and Capillary Force:

There are two instances where Laplace pressure is important in the context of liquid dispensing using cantilevers. First, during the fluid flow inside the hollow cantilever (already discussed during thermal pumping section) and the second, during dispensing of the droplet. In this section, we discuss the Laplace pressure in the liquid bridge meniscus formed during dispensing of the droplet. Young, Laplace and Kelvin equations determine the capillary forces established due to the capillary bridge between the tip and the substrate. The size of the capillary bridge depends on the humidity, geometry and the chemistry of the surface.
The Young-Laplace equation equates the pressure difference between two phases and the curvature of the surface:
Δ p = γ ( 1 l + 1 r )
where Δp is the Laplace pressure, γ is the interfacial surface tension, l and r are principal radii of curvature, also referred to as azimuthal and meridional radii of curvature respectively, or simply radii of curvature of two normal sections of meniscus perpendicular to each other.
For a flat water surface in thermodynamic equilibrium, if partial vapor pressure is same as saturated vapor pressure then evaporation is same as condensation. Then the relative humidity ( R h = P v P s a t = 1 ) , where Pv is partial vapor pressure and Psat is saturated vapor pressure. For a convex meniscus obtained due to capillary condensation, the equilibrium occurs at ( P v P s a t > 1 ) . In other words, due to the curvature, the thin water layer can be in thermodynamic equilibrium with undersaturated vapor pressure ( P v P s a t < 1 ) . This happens because of the adhesion force between water molecules and tip surface closer to the substrate surface. It results in higher pressure for the water layer next to the interface, P = P 0 + Π d , where Π d is called disjoining pressure [121,122]. For a thin liquid layer closer to the surface, the evaporation/condensation equilibrium will be shifted towards condensation. The exact value of ( P v P s a t ) is given by Kelvin equation [123]:
1 R k = 1 l + 1 r = R T l o g ( P V / P s a t ) γ V
Δ p = R T l o g ( P V / P s a t ) V
where, Rk is Kelvin radius, V is the molar volume, T is the absolute temperature, and R is the gas constant. Rk remains constant at any given point of the meniscus, while l and r will change. ΔP gives the pressure inside the capillary bridge.
For water with γ =72.8 mN/m Equations (7) and (8) can be written as [123],
R k ( n m ) = 0.54 l o g ( P V / P s a t )
Δ p ( M P a ) = 134.8   l o g ( P V / P s a t )
For 50% RH, Rk = −0.8 nm, ΔP = −93 MPa.
The azimuthal radius l and meridional radius r are perpendicular to each other and are shown in the Figure 18. The first one is considered as positive because the radius lies inside the liquid meniscus and the second one is considered negative, because it is concave and the radius lies outside the liquid meniscus. The Laplace pressure is given by Δ p = γ ( 1 l 1 r ) . The pressure inside the capillary bridge is lower than outside than that of outside the bridge. This leads to a force of F = π l 2 Δ p , responsible for pulling them together. The other force is the surface tension acting over the perimeter of the meniscus (usually, the surface tension is only a small percentage of the force due to capillary pressure) [123]. Therefore, the total capillary force is given by [123,124,125,126],
F c a p = π b 2 Δ p + 2 π b γ s i n Θ 2
F c a p = π b 2 γ ( 1 l 1 r ) + 2 π b γ cos ( φ Θ 1 )
where,
r = b t a n φ + D sin ( φ Θ 1 ) + c o s Θ 2
l = b r [ 1 c o s ( φ Θ 1 )
Figure 18. Schematic of a liquid bridge responsible for the capillary force between the tip and the substrate.
Micromachines 05 00954 g018
For DPN, the capillary force depends on the size of the liquid bridge which in-turn depends on the humidity. For dispensing by NADIS, apart from capillary bridge obtained by the capillary condensation, there is a source of liquid attached to the bridge. Due to this, the capillary force measurements obtained from the force-distance curves were different for 200 nm aperture and 35 nm aperture. For 200 nm aperture, the dispensing was due to constant pressure. The volume did not remain constant but the droplet was fed by the reservoir during retraction. It is believed that the liquid could flow into the capillary bridge so that hydrostatic equilibrium is established between the meniscus and the reservoir. This was no longer true for 35 nm aperture. The dispensing volume remained constant. The droplet was no longer fed by the reservoir. As the capillary force term has two components; one due to the Laplace force and the other due to the surface tension force along the contact line, it was concluded that in the larger aperture, the capillary force was dominated by the surface tension force only and the Laplace force was negligible, whereas for smaller aperture, both of them contributed. This was corroborated by the maximum of the normal force due to 35 nm aperture being twice that of 200 nm aperture [127].

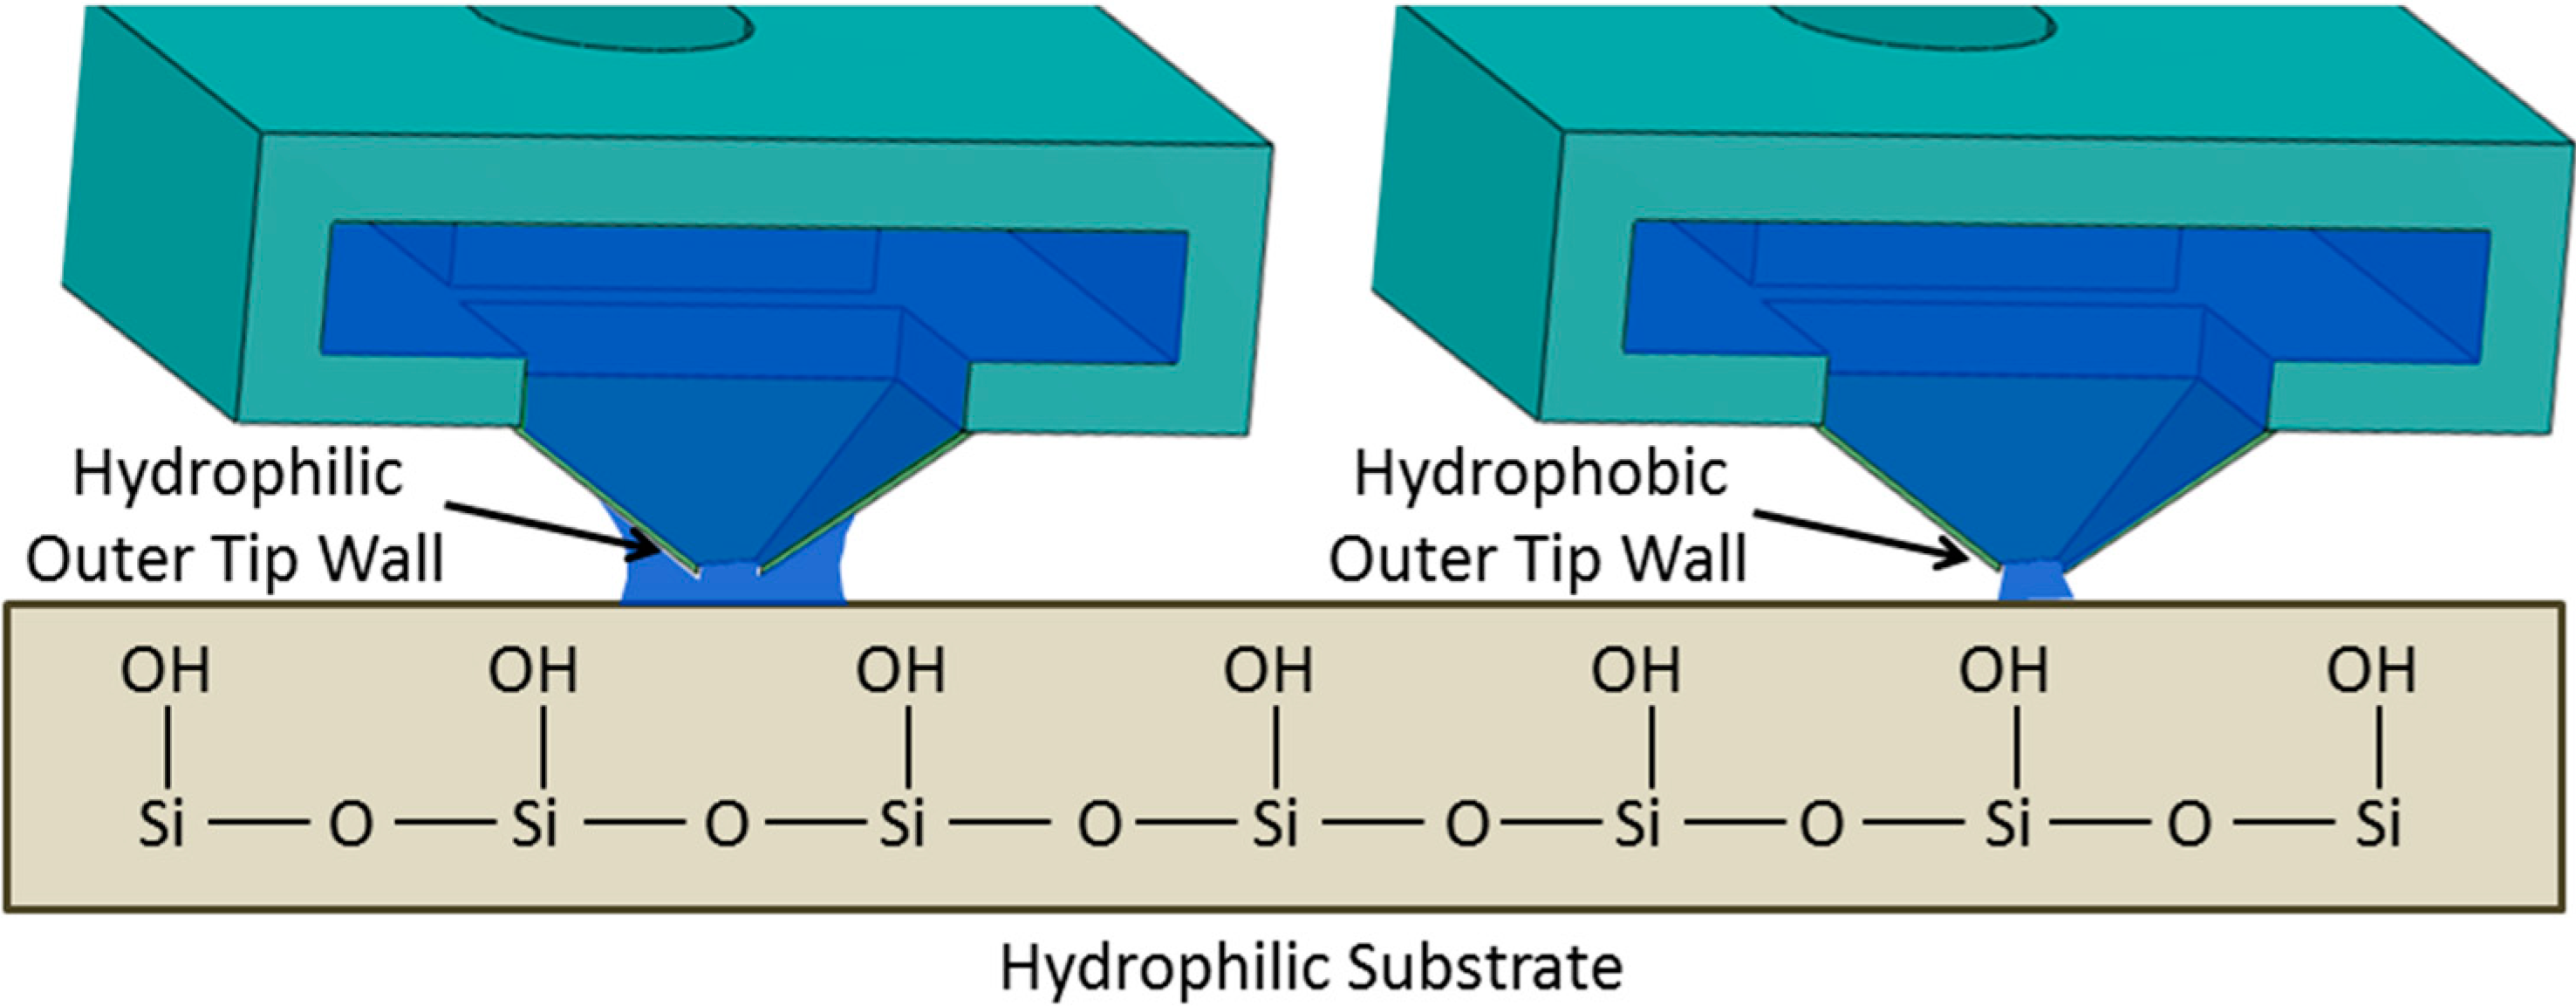
Contact Angle on the Outer Tip Wall:
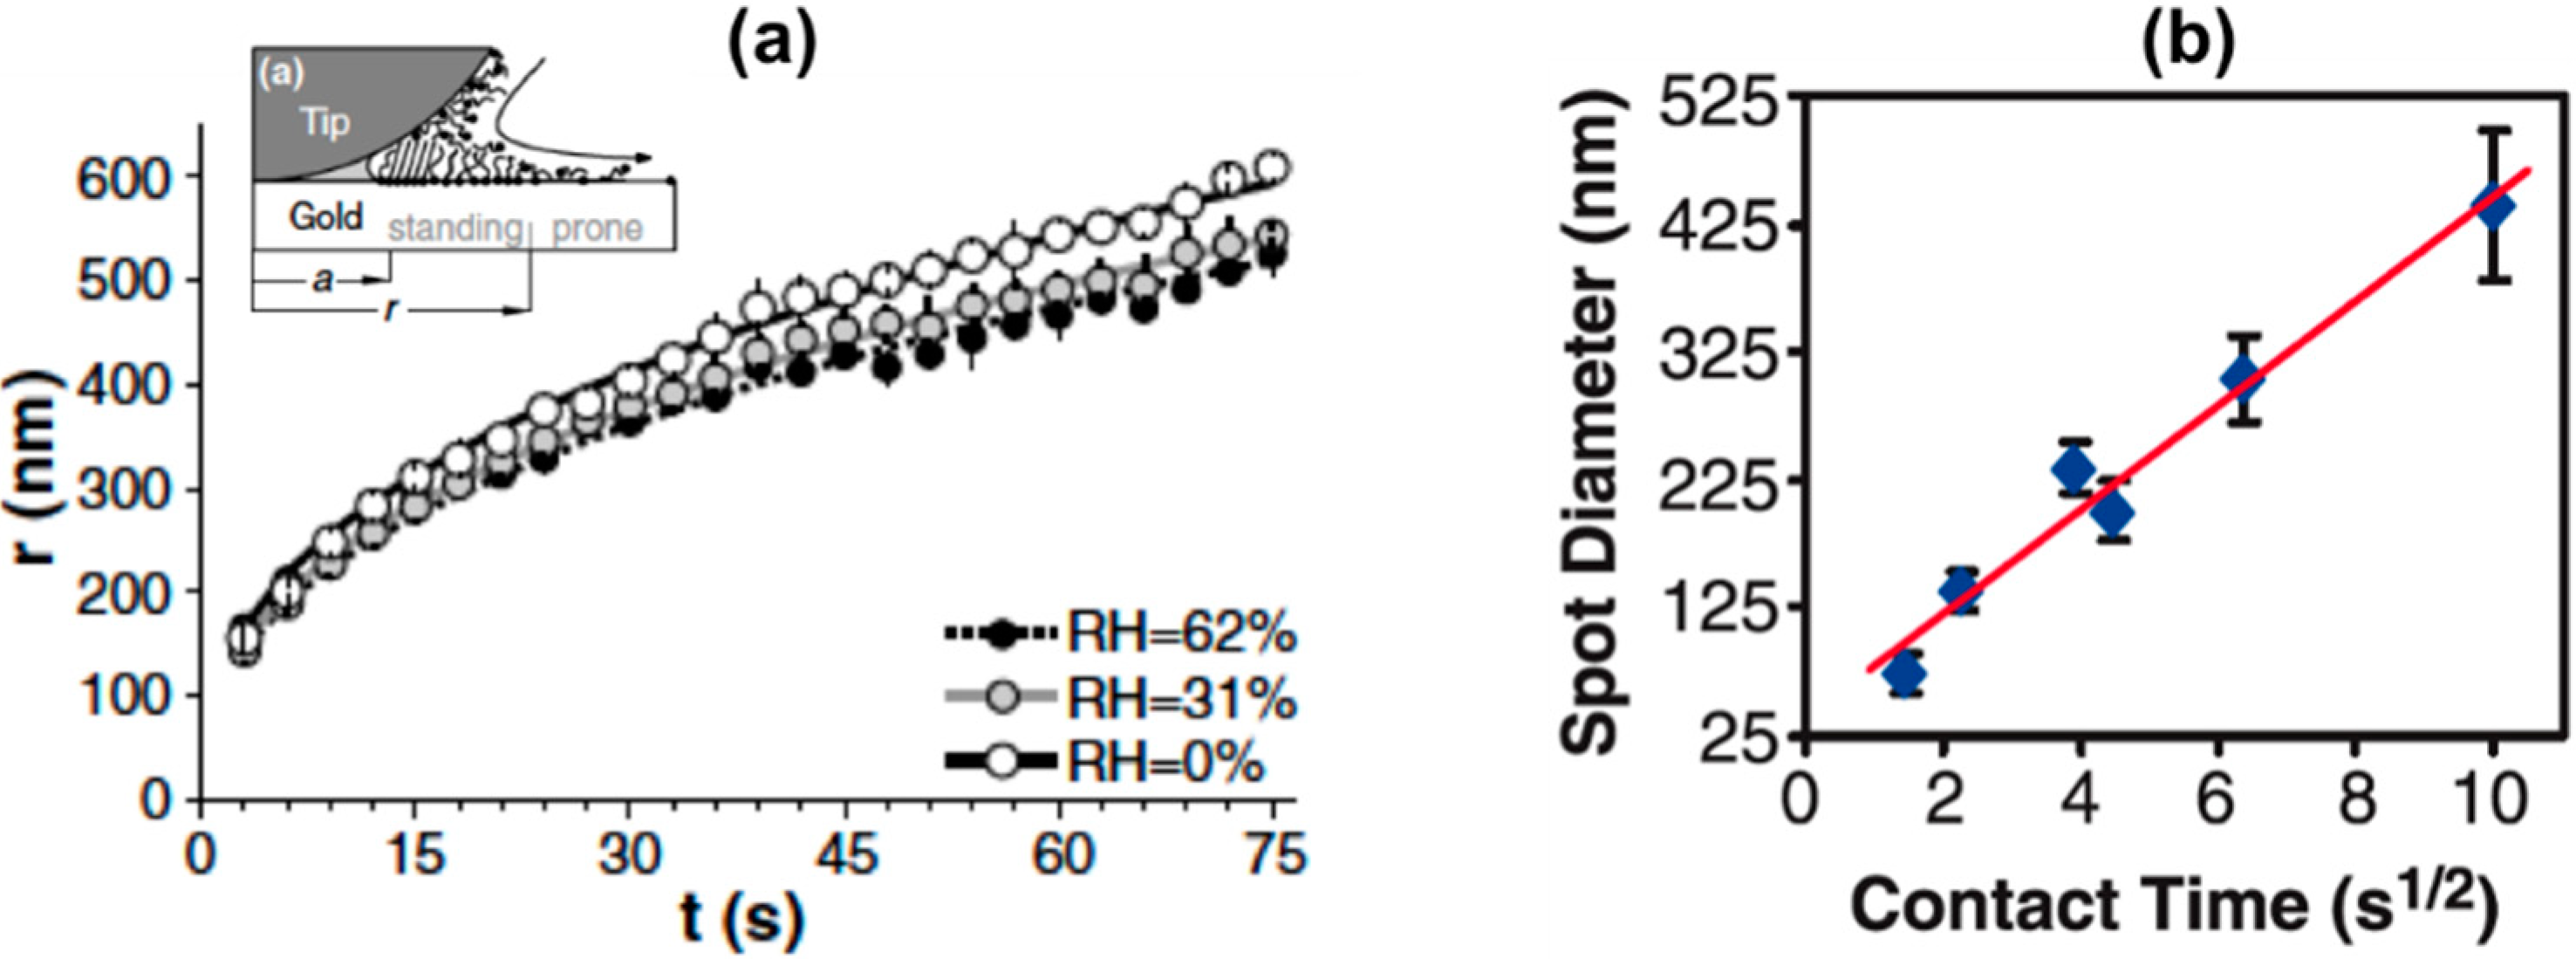
If a loaded tip is brought in contact with a hydrophilic substrate, the liquid will start to spread out due to the small contact angle on the substrate. Retracting the tip quickly before reaching the equilibrium between the substrate surface energy and surface tension of the fluid inside the meniscus will stop such a spreading. Furthermore, if the tip possesses a hydrophilic outside wall the liquid spreads on the tip wall increasing the dispensing spot diameter much beyond the aperture size as shown in Figure 19 [56].
To prevent the wetting of the outer tip wall on hydrophilic substrate surfaces, the cantilever tips deposited with gold are chemically treated to form hydrophobic (e.g., Hexadecanethiol) outer tip wall. This prevents the wetting of the outer tip wall, and allows the deposition of smaller droplets compared to the ones obtained with a hydrophilic tip on a hydrophilic substrate.
Figure 19. The amount of dispensed liquid on a hydrophilic substrate is large when the tip is hydrophilic (left panel) and small when the tip is hydrophobic (right panel).
Micromachines 05 00954 g019

Contact Time:

If the tip is retracted before the equilibrium between the substrate surface energy and surface tension of the fluid is reached, then smaller droplets will be dispensed. Therefore, shorter or longer contact times could lead to smaller or bigger dispensed droplets, respectively. If the tip is brought in contact several times on the same spot before the equilibrium is reached, then the amount of transferred liquid would also increase. These two effects (contact time and the number of contacts) can be potentially investigated by analyzing the diameters or the heights of the droplets. In this case, the contact time refers to the time during which the tip remains immobile, as the z-scanner is moving. For further investigation on the influence of the contact time and number of contacts on the amount of dispensed liquid, one can think of measuring the droplet height by getting successive deflection-distance curves on the same spot.
In DPN, the spot size of hydrophobic molecules increases with time even after 60 s of contact time indicating its molecular diffusion mechanism [128] (Figure 20). In NADIS, the droplet size reaches saturation within one second after equilibrium is reached (as shown in Figure 6 in reference [129]). This is because, DPN uses diffusive dispensing mechanism and NADIS uses non-diffusive dispensing mechanism.
Figure 20. Using DPN, (a) The spot size of hydrophobic alkanethiol molecules obtained with the contact time on gold substrate at various relative humidity conditions (reprinted with permission from [114]); (b) The spot sizes obtained for DNA molecules on gold substrate. Reprinted with permission from [34]. The spreading regime was characterized with a behavior of spot radius r ~ t1/2.
Micromachines 05 00954 g020

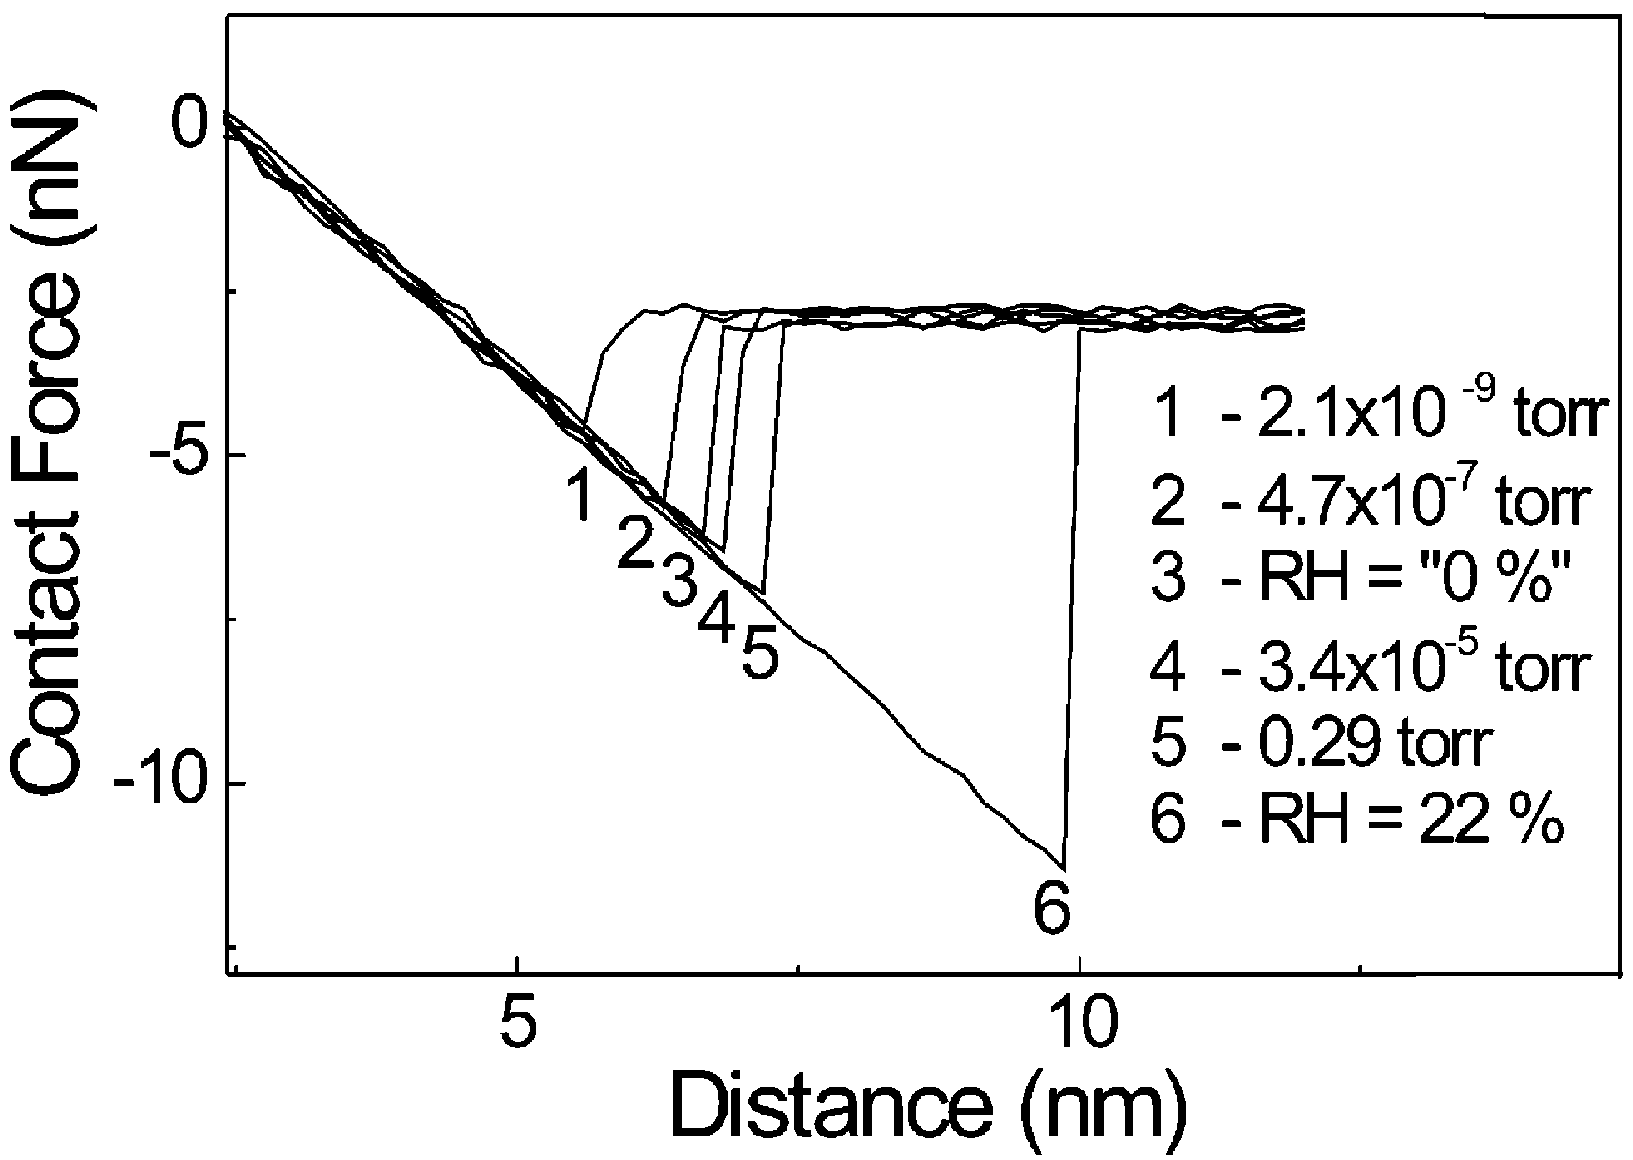
Humidity of Environment:

The capillary condensation of nanoscale water bridge formation between the tip and the substrate surface depends on the RH. The meniscus size is estimated from the Kelvin equation (7) [130]. The formation of meniscus at 98% RH condition is shown in Figure 21. The meniscus size defines the size of the spot on the substrate. It increases with the increase in RH [116]. As mentioned earlier in the section of Adhesion Mechanism, in an experiment to observe the meniscus formation by pits in NaCl substrate, it was confirmed that meniscus was formed even at 0% humidity condition in dry nitrogen environment [112]. It was absent only in vacuum. For hydrophilic molecules on the DPN tip, the spot size increased with humidity, whereas, it decreased for hydrophobic molecules [115].
Figure 21. Electron microscope image of meniscus at an AFM probe tip. The radius of meniscus was observed to be 200 nm at 98% RH. Reprinted with permission from [130].
Micromachines 05 00954 g021

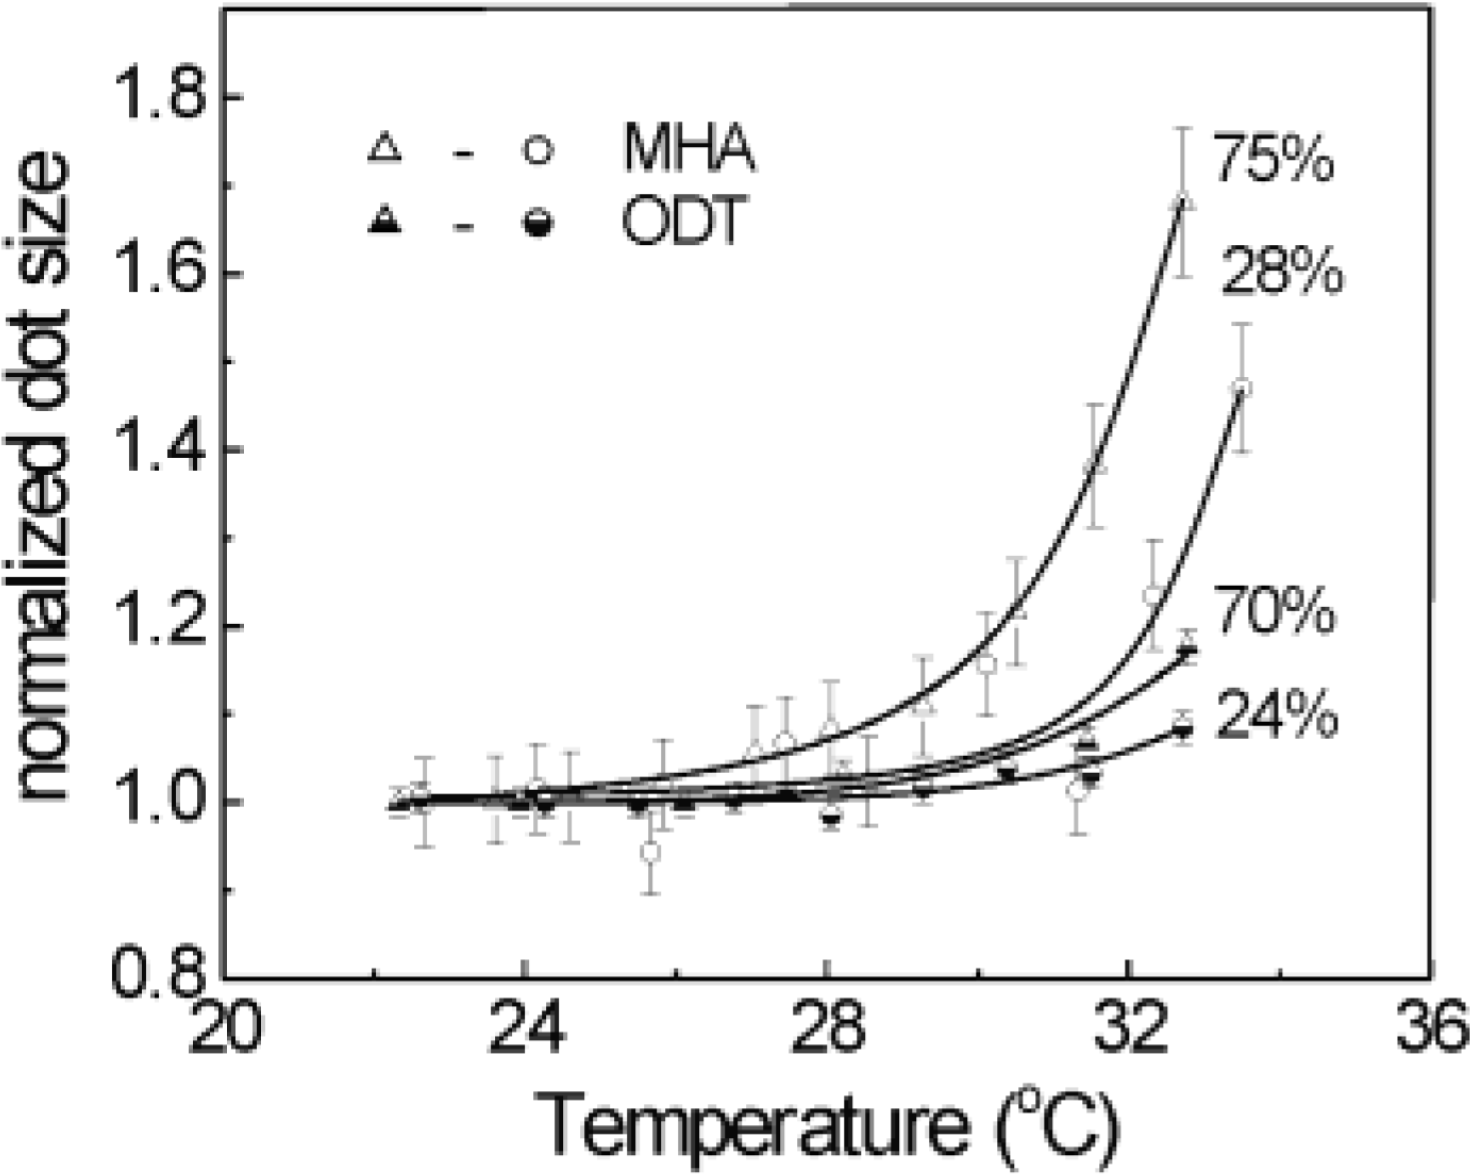
Effect of Temperature:

The effect of temperature on the spot size was more pronounced than humidity (Figure 22). The growth rate increased exponentially with the temperature both for the hydrophobic and hydrophilic molecules. The hydrophobic molecules get less influenced compared to the hydrophilic molecules for temperature changes. As the molecule dissolution in the liquid bridge between the tip and the substrate increased with temperature, the number of solvated molecules taking part in the transport process has also increased [131].
Figure 22. The effect of temperature on the droplet size for hydrophilic (MHA) and hydrophobic (ODT) molecules on a DPN at different % of RH levels is shown. Reprinted with permission from [115].
Micromachines 05 00954 g022

3.3.3. Droplet Characterization

Spherical Cap:

The volume of the dispensed droplet can be calculated by measuring geometrical dimensions of the droplet. The dominant force influencing the droplet shape is the surface tension. The mean surface curvature is thus constant over the entire droplet and the shape can then be approximated to a spherical cap. The volume V of a spherical cap is given by:
V = π h 6 ( 3 e 2 4 + h 2 )
where e is the diameter of the droplet base and h is the droplet height. The height can be determined from the snap-off position of the deflection-distance curves during droplet dispensing by properly accounting for the droplet shape. The height and diameter of the droplet can be obtained by imaging the droplet in the non-contact mode immediately (in a humidity chamber, before evaporation of the droplet begins) after dispensing. The tip radius artefacts (broken tip, adhered particles), if any, on the measurements obtained should be accounted.
The diameter of the droplet is obtained by measuring the contact angle of the liquid and using the expression (16). The contact angle does not change (until gravity of the droplet becomes significant) with droplet size for the same substrate conditions. Therefore, contact angle measurements can be performed separately and the value can be used for the droplets dispensed by the cantilever. However, care should be taken about the hysteresis caused by the surface contamination.
h = 1 4 e θ

Meniscus Bridge Break-Up Distance:

The volume (V) of the droplet can also be calculated from the meniscus bridge break-up distance (h) obtained from distance—displacement (force—distance) curve [132]. For geometry of a spherical tip and a flat substrate, the following relationship holds good [133].
h = ( 1 + θ 4 ) V 1 3 2 ( 1 + θ 4 ) V 2 3 5 R
where, θ is the contact angle near the tip and the substrate and R is the tip radius. For hydrophilic surfaces, and small water bridges θ 0 , the volume of the meniscus bridge is approximately equal to cube power of snap-off distance (h3) [134].

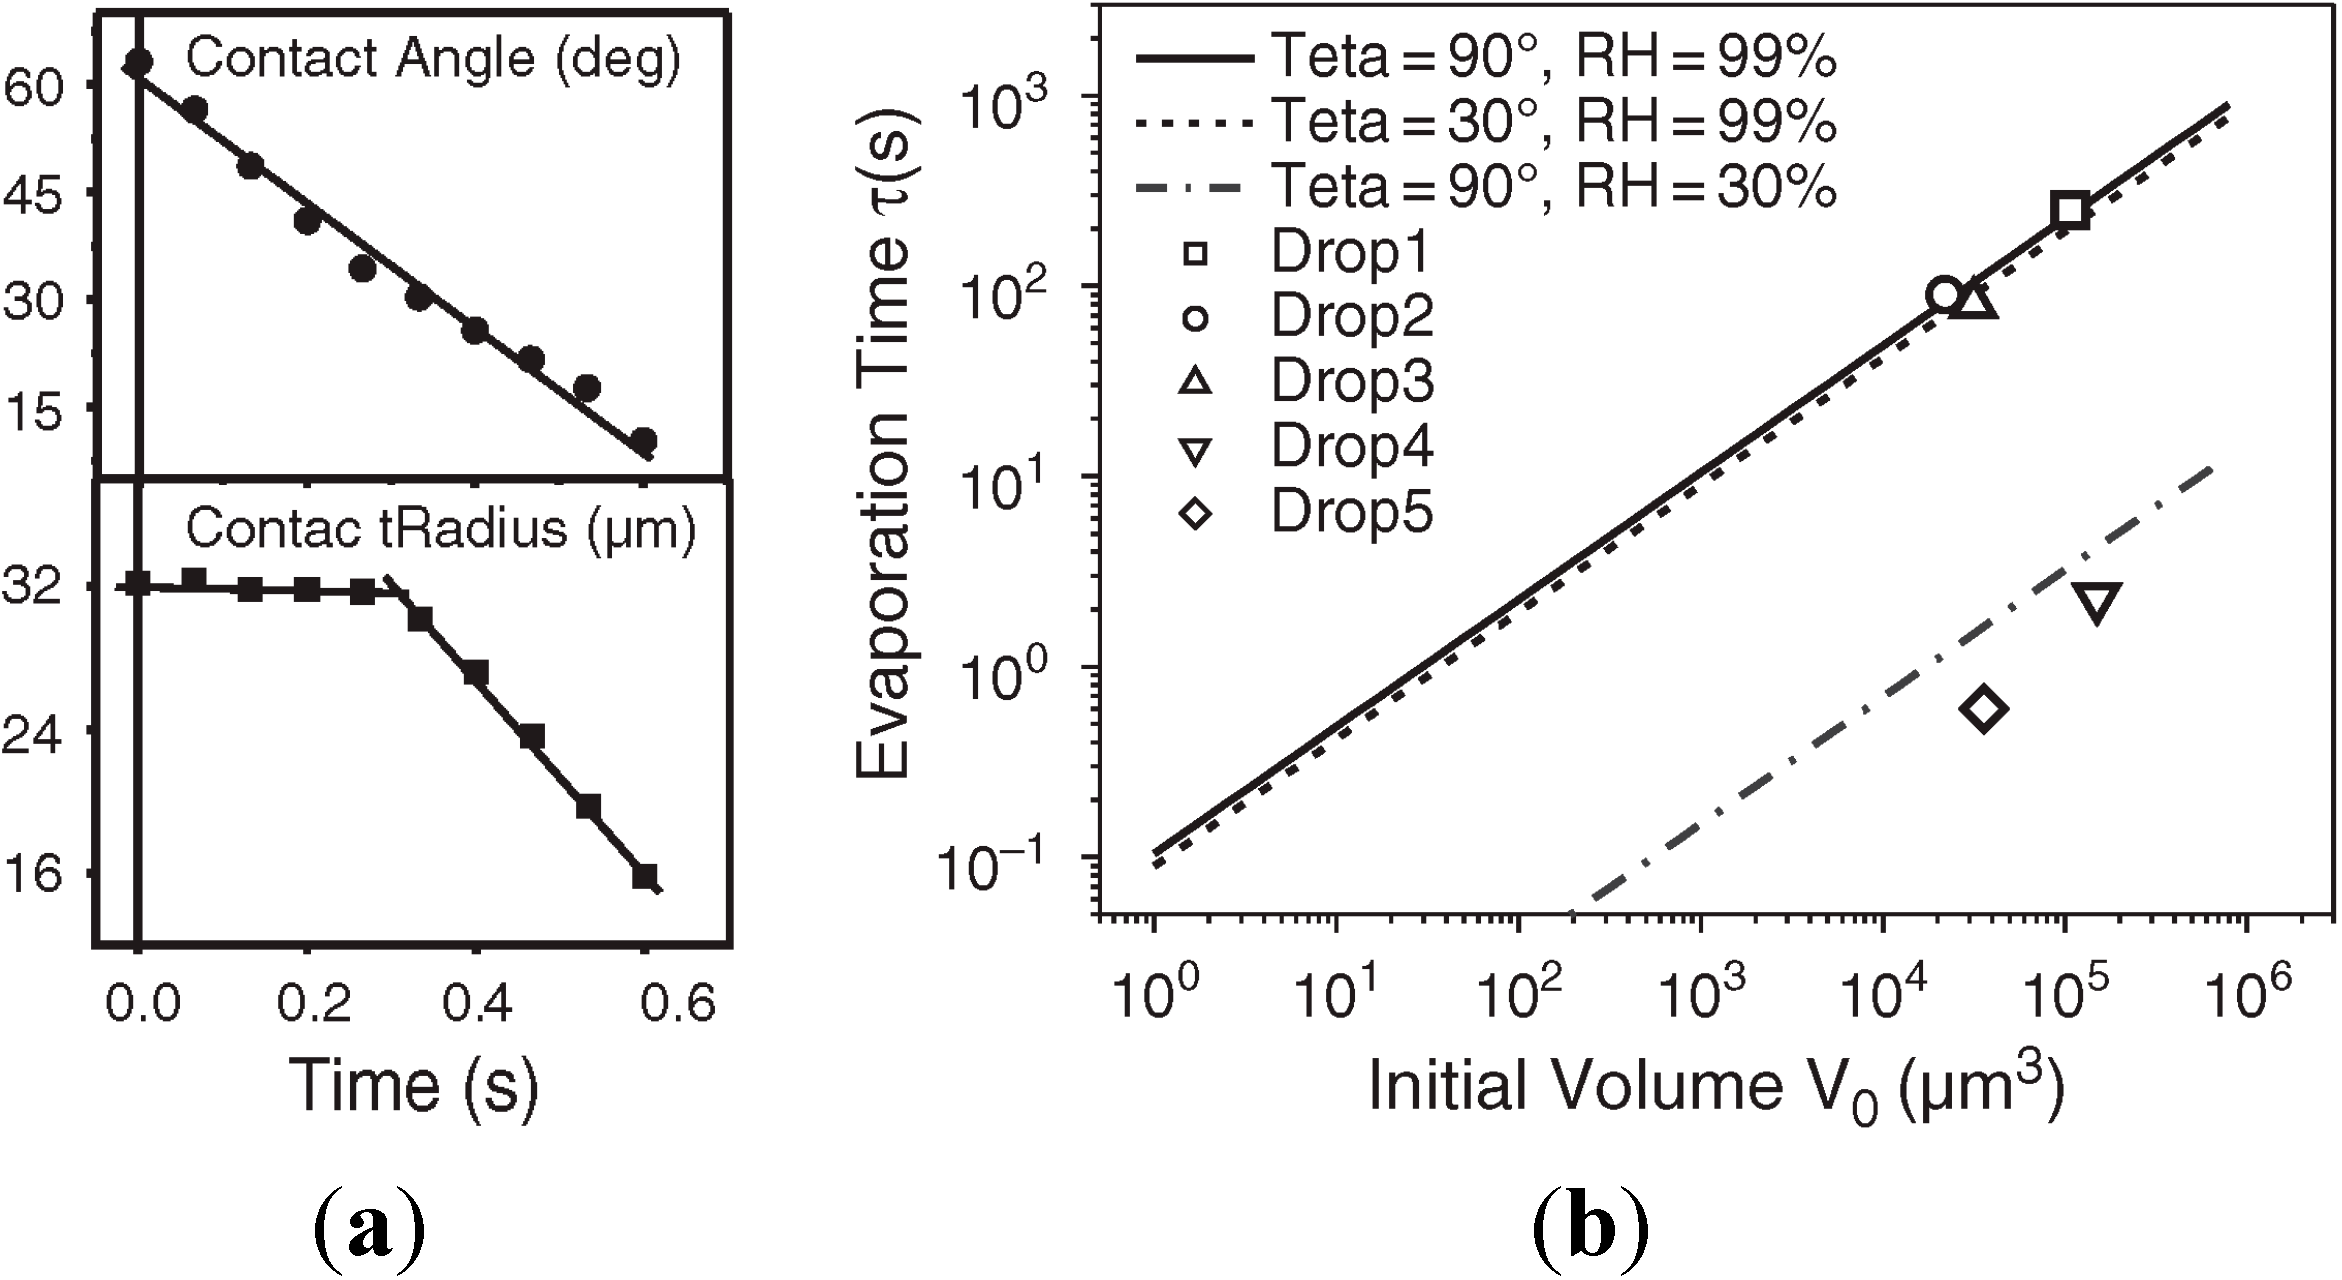
3.3.4. Droplet evaporation rate

The shape of the droplet is not influenced by the gravity if it is less than 2 mm in diameter. For our case, as the droplets are in the order of micron or less, effect of gravity is neglected. The droplets have higher vapor pressure than planar liquids as quantified by Kelvin. Thus vapor pressure increases with decreasing droplet size (Figure 23). There are two evaporation regimes during the droplet evaporation: in the beginning, the evaporation happens in the constant contact radius mode and later, decreases linearly with time (Figure 24) [135]. For a 100% saturated vapor pressure, the evaporation time of the droplet is given by:
τ = 1 2 π V L O D k B T P 0 V m λ f
where, VLO is the initial drop volume, D is the diffusion constant of the vapor molecules in the gas, kB is the Boltzmann constant, T is the absolute temperature, P0 is the vapor pressure, Vm is the molecular volume in the liquid phase, λ = 2 γ V m k b T , and f = 0.5(0.00008957 + 0.6333θ + 0.116θ2 – 0.0887θ3 + 0.01033θ4). While for a 99% saturated pressure the evaporation time of the droplet is given by:
τ = 1 4 ( 3 π ) 2 / 3 ( V L O ) 2 / 3 D k B T β 1 / 3 P 0 V m x f
where, β = (2 + cos θ)(1 + cos θ)2 and x = 1 − RH. The evaporation time increase is proportional to (VLO)2/3 at 99% humidity, and to VLO at 100% humidity [136,137].
Figure 23. (a) Sessile droplet in equilibrium; (b) laplace pressure acting downwards on the droplet and the surface tension component γLsinθ acting perpendicular to the substrate [135].
Micromachines 05 00954 g023
Figure 24. (a) Evaporation of a water droplet of 32 microns radius on a silicon surface with time at 25 °C, 30% RH, contact angle of 63° and surface tension of 72 mN/m, the contact angle is in the top panel and the contact radius is in the bottom; (b) Evaporation time with initial volume for different contact angles and RH [135].
Micromachines 05 00954 g024

3.3.5. Imaging the Dispensed Droplets

To visualize the dispensed droplets usually optical techniques including fluorescence methods are routinely used. However, to image droplet diameters of 1 micron or less, scanning electron microscope or various modes of atomic force microscope are used.

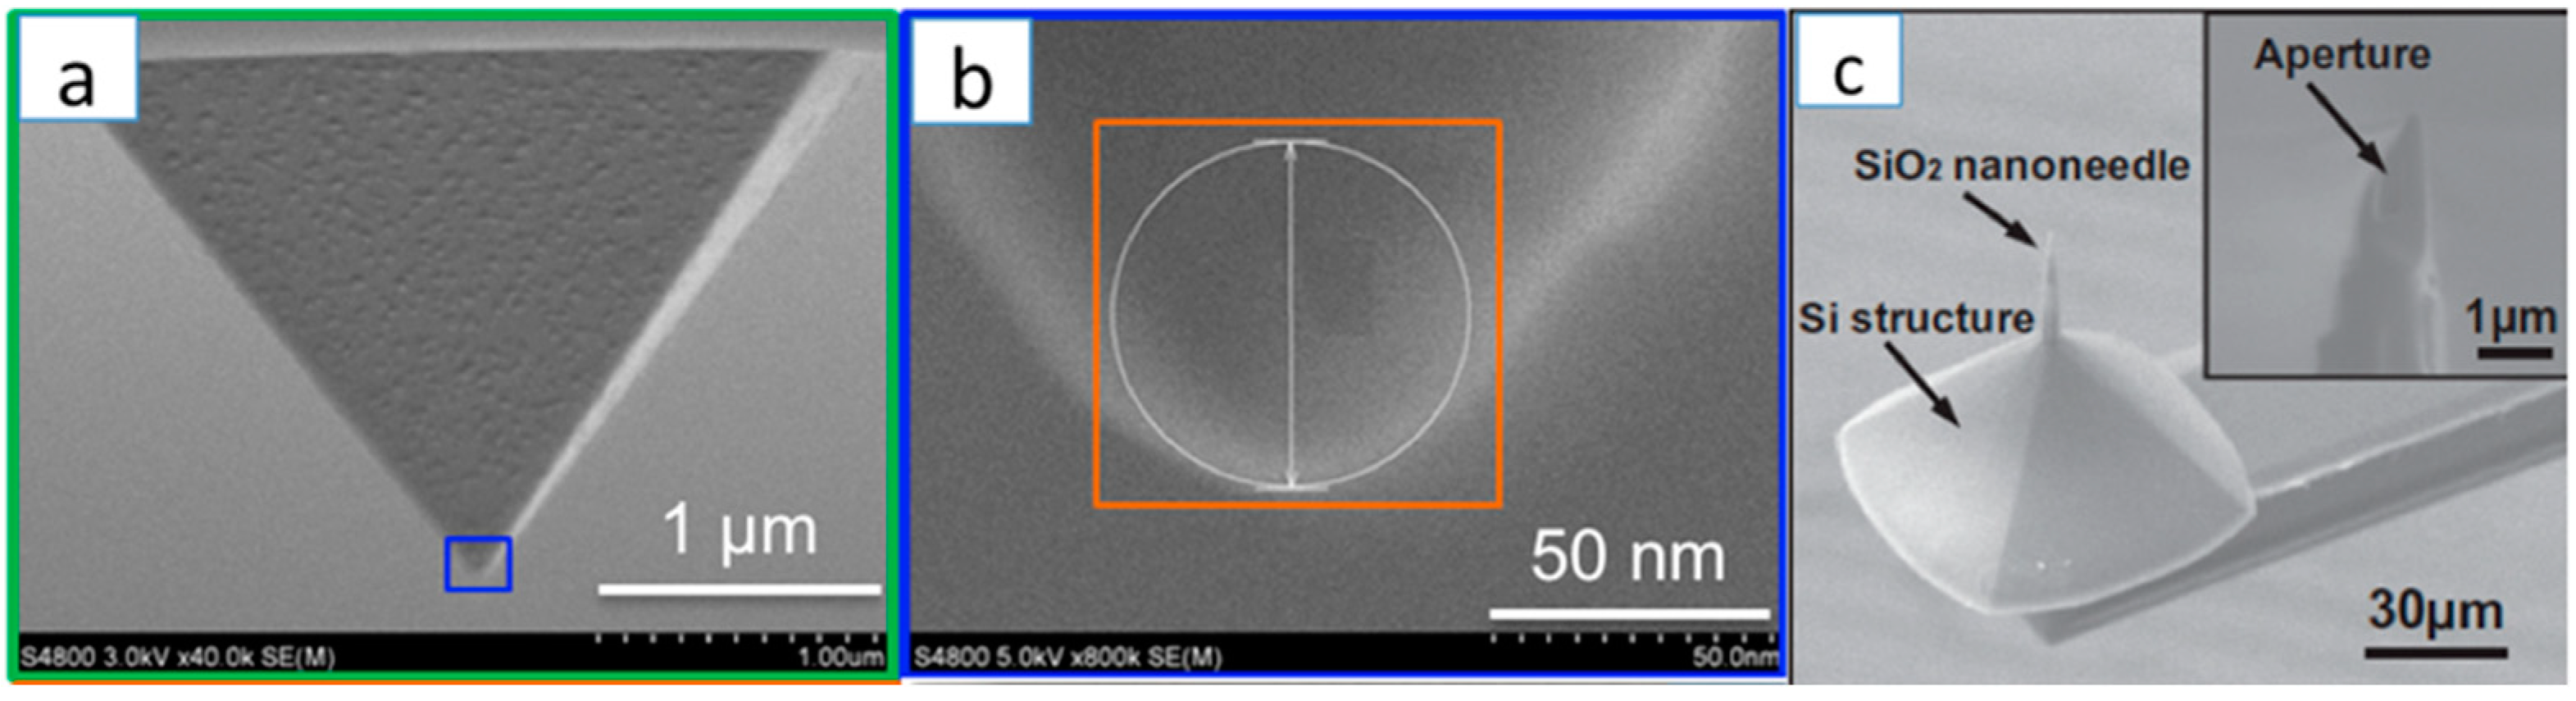
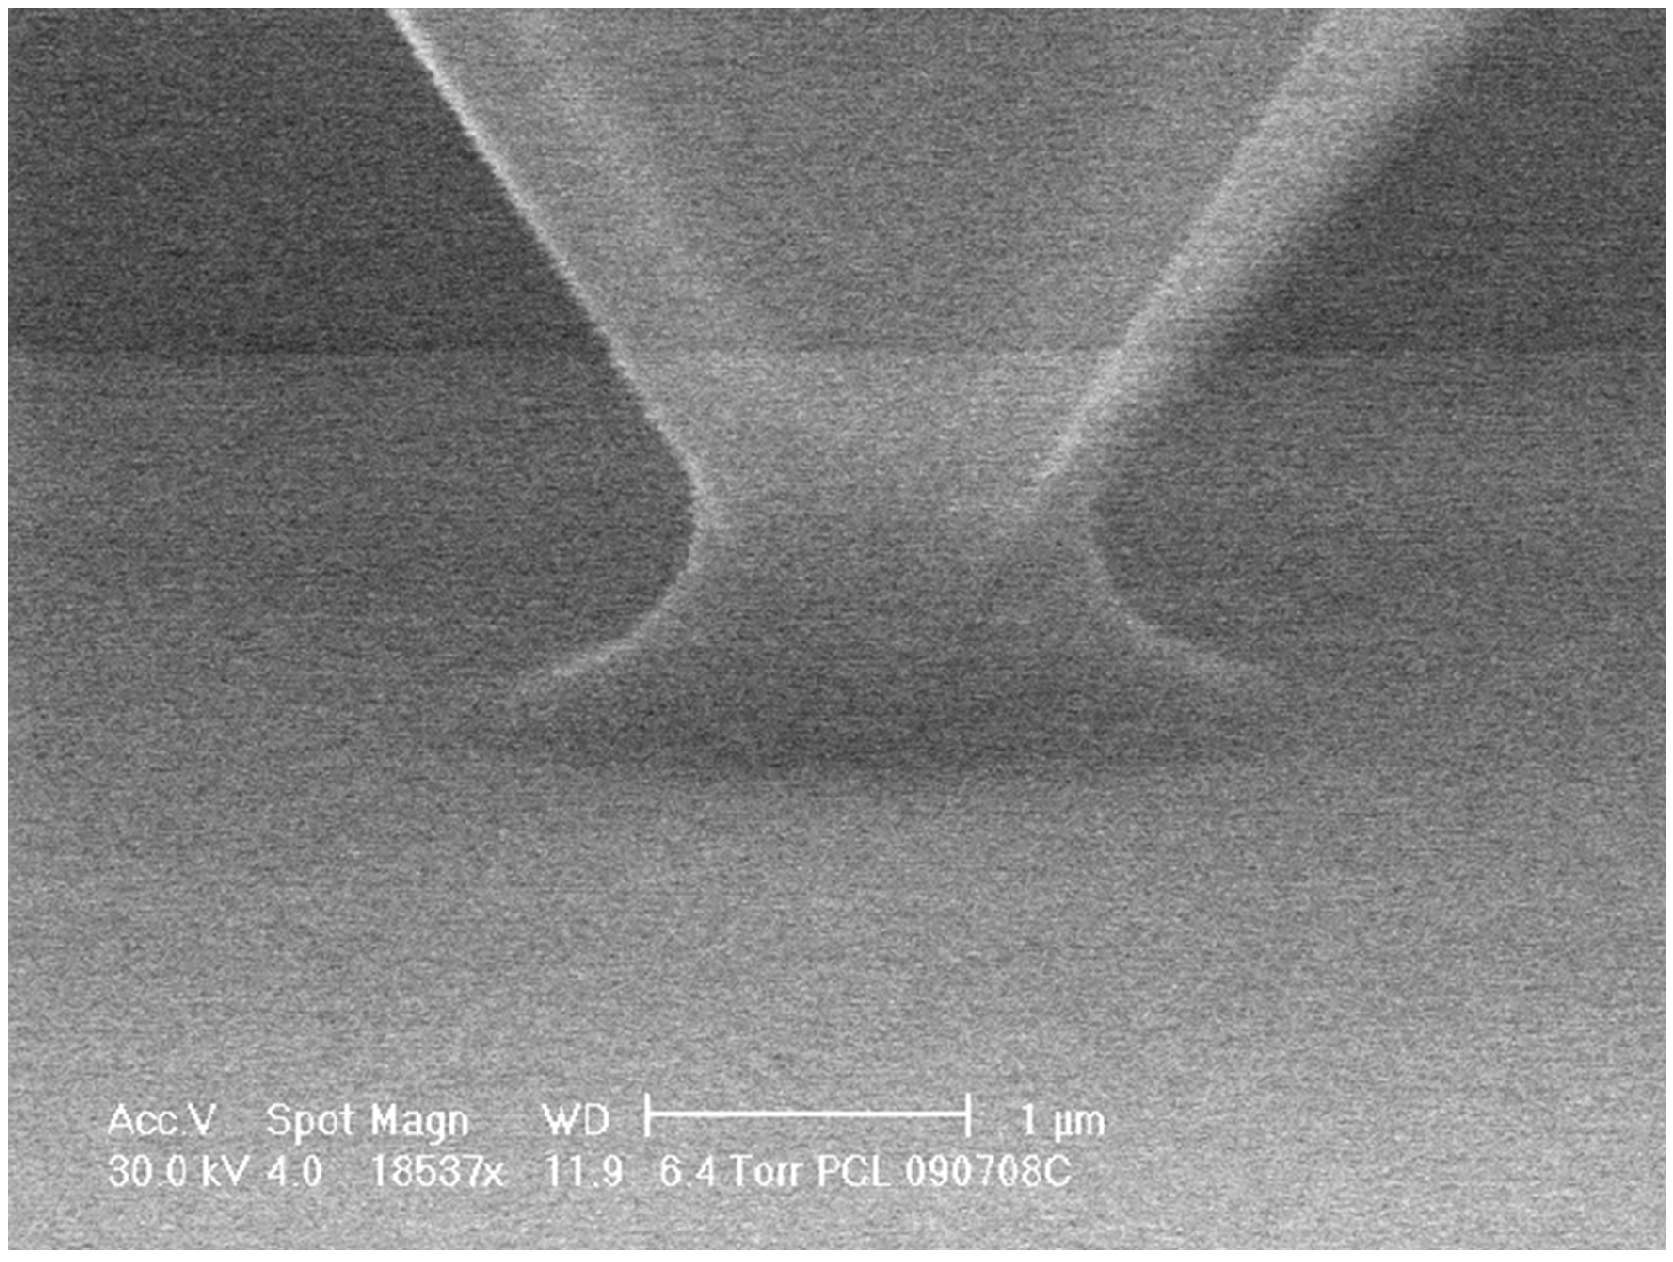
Scanning Electron Microscope (SEM):

Unlike optical techniques of imaging, the SEM involves creating vacuum, and therefore the chosen liquid should have very low vapor pressure. Ionic liquids are good candidates for this purpose [138]. An ionic liquid is a salt in the liquid state, typically used as the liquid electrolyte. They have vapor pressure values in the range of 10−10 Pa at 25 °C, which keep the droplets intact even under the vacuum. As a comparison, water has a vapor pressure of 3.3 kPa at the same temperature. However, the ionic liquid is about 20%–40% more viscous than water. Nevertheless, they can be made to flow through the hollow channels of the microcantilever (like SIP, NADIS, NFProbe).
For water-based liquids, the droplets should leave residues after they evaporate, clearly marking the droplet boundaries by “coffee-ring” effect. Having nanoparticles or salt solutions that leave crystals after evaporation, are best suited.

Atomic Force Microscope (AFM):

The droplets can be imaged before they evaporate by operating the AFM in non-contact mode [69]. Considering necessary correction factors, the droplet diameter and height can be derived from the image obtained. However, for the droplets which form monolayer of molecules on the substrate surface after evaporation, Lateral Force Microscopy (LFM) is often used for imaging [128]. It exploits the different friction characteristics of the substrate areas with droplet and without droplet producing enhanced edges of the topographic features.
In DPN, if the cantilever tip can be cleaned after dispensing the droplets, the same tip can be used for imaging the dispensed droplets. In the other techniques like SIP and NADIS, if the aperture can be made on the tip wall, the tip sharpness can be kept intact for imaging purpose. Tip should be cleaned before it is operated in the imaging mode for all the techniques.

4. Applications

4.1. Microarray

A microarray is typically a micron-scale spots of DNA, RNA, proteins, carbohydrates or peptides. They are widely used in the selection, assessment and quality control of the drugs in the pharmaceutical industry. They are also used as gene identification method in diagnostics and therapeutics [139]. Inkjet printing is typically used to print these microarrays with a reliable smallest size of 11 microns and above (Affymetrix chips) [140]. Packing more spots in a given area would further increase the multiplexing capabilities of the microarray leading to nanoscale arrays. Using DPN technique, it has been shown that spots of 70 nm are possible. However, 100 nm could be reliably produced. The technique was applied to form patterns of variety of materials like DNA [34,35], peptides, proteins [36,37,38,39,40], viruses [41,42], bacteria [43], metal nanoparticle precursors [44], magnetic nanoparticles [45], silanes [46,47], polymers [48], solid-state features using sol-precursors [49] on conductors, semiconductors, and insulating substrates.

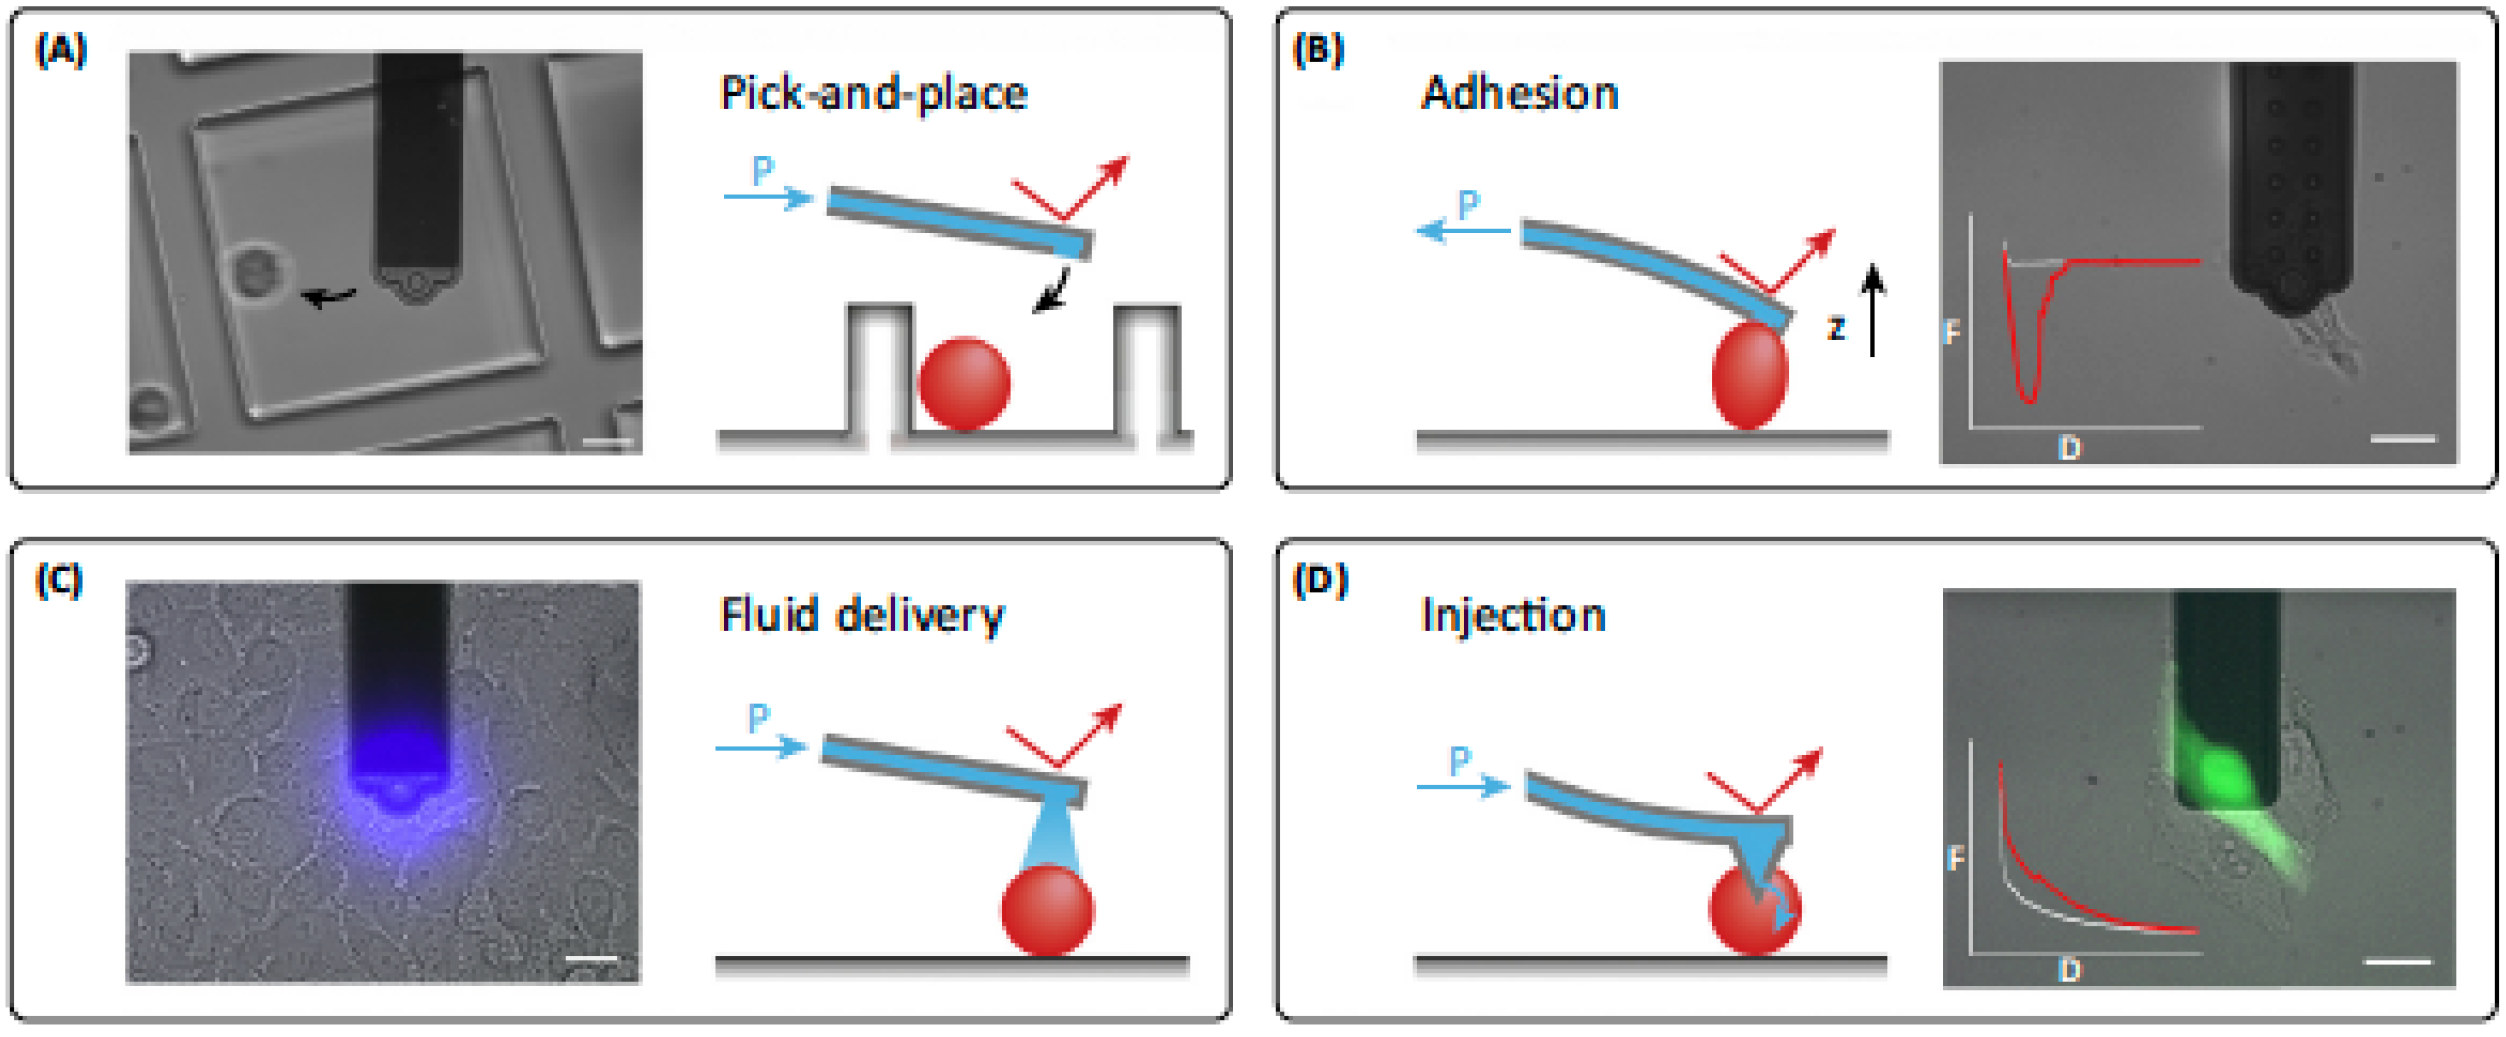
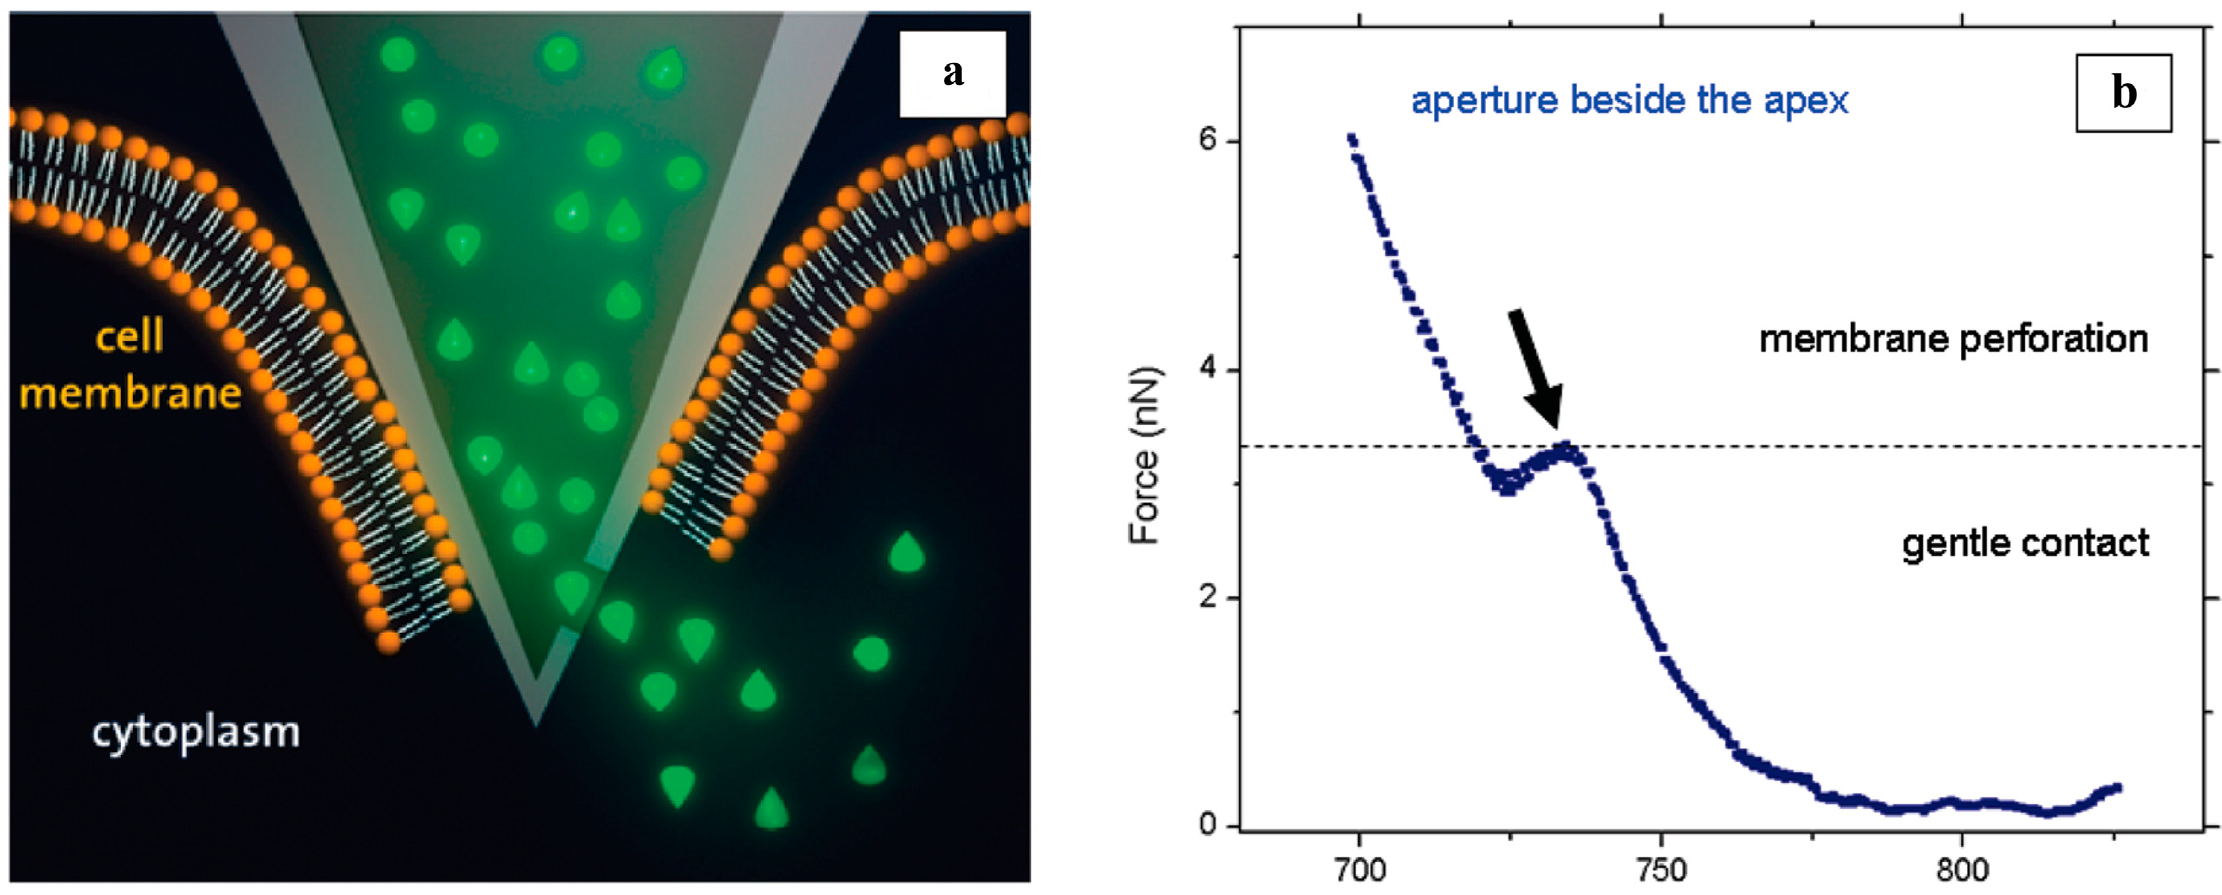
4.2. Single Living Cell Manipulation

Cells are particularly complex and dynamic biochemical entities. Even among cells of the same type, there is still significant biochemical heterogeneity, which can arise via different mechanisms including mutations, localized damage and differential exposure to external signals (e.g., chemical gradients and vesicles) among others. Consequently, understanding the reason of why these differences arise is critical towards a better understanding of cell biology and for the ability to detect early disease stages so that they can be potentially treated before major health consequences appear. The analysis and manipulation of single cells present a variety of challenges. Eukaryotic cells are generally on the order of 8–20 μm in diameter and therefore have volumes of only 0.1–8 pL. Therefore, for an accurate manipulation it is important to have the means to inject the cell with volumes that are much smaller than its own volume, opening the need for a nanotool that can handle volumes in the range of fL and below. Such control can be given by the SPM-based nanopipette, whose dispensing capability could go down to few fL. This enables to introduce different signaling factors such as individual vesicles or other molecules of interest (mRNA and proteins) into the cell. In addition to metering/dosing the liquids, the mass sensing capability that such a nanotool can offer would ensure the accuracy during the delivering of the molecules of interest. In the case of pipettes such as the SIP or NFProbe, the sensitive force feedback allows controlled approach of the tip for local modification of the substrate surface even in liquid environments [141]. Furthermore, the probes with low spring constant guarantee that the cell (particularly the lipid membrane) is handled gently. From the force-distance curves, reliable discrimination between gentle contact with a cell membrane or its perforation was obtained [25], as shown in Figure 25. The electroporation technique using NFProbe was also used to inject molecules into single cells [142,143]. By extracting targeted material from cells, single-cell biopsy was demonstrated [144,145]. Other possibilities of actions that can be performed on a cell are summarized in Figure 26.
Figure 25. Intracellular injection (a) could be monitored by the force-distance curves (b) in order to control the force necessary for perforation of the cell membrane without generating a major damage. If the aperture is made beside the apex, the sharp tip is preserved, which facilitates the membrane perforation. Reprinted with permission from [25].
Micromachines 05 00954 g025
Figure 26. Various actions that can be performed on a living cell using hollow AFM cantilever. The scale bars are 20 microns. Reprinted with permission from [146].
Micromachines 05 00954 g026

5. Conclusions and Future Scope

To conclude, various SPM-based contact-printing techniques are compared in this review. Their characteristics and fabrication methods were discussed. The complexity of multiple parameters that influences the fluid handling processes along with the physics involved in dispensing are described in detail. These devices have already shown to be useful in applications like genomics, proteomics and cell-biology. We conclude that SPM-based techniques remain attractive for generating small spot sizes in the range of one micron in diameter (less is also demonstrated) amounting to fL volumes. By monitoring multiple parameters like deflection, resonance frequency and phase change, information on the amount of force applied on the sample, mass of the injected liquid and image of the sample under investigation can be obtained. These features make SPM-based techniques more versatile compared to inkjet techniques. Furthermore, these devices can be mass-produced on a wafer scale. DPN and NADIS probes are useful for only dispensing, whereas the NFProbe and SIP are more versatile with additional advantage of control over fluid manipulation like controlled dispensing and aspiration.
As an outlook, these devices would be very useful in combinatorial screening, i.e., catalytic activity of different composition or crystal orientation of new solid-state materials [147,148]. AFM chips with liquid handling could also be extended to provide on-chip analysis of the aspirated solution, i.e., determining the mass of bio-molecules by a shift in resonance frequency of the cantilever [107,149,150]. Commonly known techniques from lab-on-a-chip or micro-total analysis systems could also be used to analyze the aspirated solution of different bio-molecules. The solution of biomolecules can be separated by, already existing systems, such as capillary electrophoresis. The identification of the aspirated molecules can be performed by either amperometric [151,152] or cyclic voltammetry detection [153]. However, this would also require new approaches to perform active on-chip liquid handling. Importantly, a high variety of different liquids, individually stored on-chip, should be addressed and dispensed through the tip.
These SPM-based devices have great potential for further exploitation as an active tool in bioanalytics. Korchev et al. [154] employed conventionally pulled microcapillaries to determine the distribution of ion conductive channel proteins. For this, a combination of the patch clamp technique [155] and SICM [78] was used. An SPM-based tool has the distinct advantage of dispensing highly localized bio-active solutions stimulating and enhancing the ion transfer through the channel proteins. Integration of an electrode, preferably at the tip has an added advantage of monitoring mechanical characteristics of the cells along with electrical characteristics. Apart from dispensing, aspiration [69] of liquids would open plethora of opportunities.
In industrial applications, a commercially attractive market can be seen in the printing of nanoarrays, i.e., for biomolecular recognition like protein identification, DNA sequencing and combinatorial drug-testing. Competing with well-established techniques, like inkjet printing or spotting, an AFM with liquid handling is a promising approach to push down the printed spot sizes below one micrometer. This would increase the density of the arrays as well as reduce the amount of expensive liquids used. However, to successfully compete, still a lot of research has to be conducted mainly to increase the reliability of the printing process and to increase the speed of printed spots per time. It is important to note that regardless of the fabrication complexity, a modified liquid handling AFM chip remains an indispensible laboratory accessory for liquid handling at small scale. Wear on the sharp tip and cross contamination require a frequent exchange of chips. With control on surface-energy, adding more functionality and integrating more in-situ cantilever control parameters, a multifunctional SPM-based fluid handling device with numerous applications are envisaged (Figure 27).
Figure 27. By integrating various in-situ capabilities, gaining access over many control parameters and integrating more functionality onto the hollow AFM cantilever the device can be applied to numerous applications.
Micromachines 05 00954 g027

Acknowledgments

This work is supported by NanoNextNL, a micro and nanotechnology consortium of the Government of the Netherlands and 130 partners. We acknowledge the members of the Micro and Nano Engineering group for their valuable suggestions and the fruitful discussions. We also acknowledge the valuable comments from Ralph van Oorschot and Roy Derks of MA3 Solutions. We also thank the members of the technical staff of the DIMES Technology Center at TU Delft for the support provided during the fabrication of the devices. Finally, we thank Reshmi Mukherjee for meticulous correction of this manuscript.

Author Contributions

Murali Krishna Ghatkesar, Hector Hugo Perez Garza, and Friedjof Heuck have equally contributed in reviewing the literature. All authors wrote the article. Murali Krishna Ghatkesar and Urs Staufer have organized and edited the article.

Conflicts of Interest

The authors declare no conflict of interest.

References

  1. Stroscio, J.A.; Eigler, D.M. Atomic and molecular manipulation with the scanning tunneling microscope. Science 1991, 254, 1319–1326. [Google Scholar] [CrossRef] [PubMed]
  2. A Boy and His Atom: The World’s Smallest Movie. Available online: http://www.research.ibm.com/articles/madewithatoms.shtml (accessed on 15 October 2014).
  3. Wijshoff, H. The dynamics of the piezo inkjet printhead operation. Phys. Rep. 2010, 491, 77–177. [Google Scholar] [CrossRef]
  4. Le, H.P. Progress and trends in ink-jet printing technology. J. Imaging Sci. Techn. 1998, 42, 49–62. [Google Scholar]
  5. Leach, R.H. The Printing Ink Manual; Springer: Dordrecht, The Netherlands, 1993. [Google Scholar]
  6. De Gans, B.J.; Duineveld, P.C.; Schubert, U.S. Inkjet printing of polymers: State of the art and future developments. Adv. Mater. 2004, 16, 203–213. [Google Scholar] [CrossRef]
  7. Calvert, P. Inkjet printing for materials and devices. Chem. Mater. 2001, 13, 3299–3305. [Google Scholar] [CrossRef]
  8. Singh, M.; Haverinen, H.M.; Dhagat, P.; Jabbour, G.E. Inkjet printing-process and its applications. Adv. Mater. 2010, 22, 673–685. [Google Scholar] [CrossRef] [PubMed]
  9. Bietsch, A.; Hegner, M.; Lang, H.P.; Gerber, C. Inkjet deposition of alkanethiolate monolayers and DNA oligonucleotides on gold: Evaluation of spot uniformity by wet etching. Langmuir 2004, 20, 5119–5122. [Google Scholar] [CrossRef] [PubMed]
  10. Sutandy, F.; Qian, J.; Chen, C.S.; Zhu, H. Overview of protein microarrays. In Current Protocols in Protein Science; Wiley: Hoboken, NJ, USA, 2013; Chapter 27. [Google Scholar]
  11. Roth, E.A.; Xu, T.; Das, M.; Gregory, C.; Hickman, J.J.; Boland, T. Inkjet printing for high-throughput cell patterning. Biomaterials 2004, 25, 3707–3715. [Google Scholar] [CrossRef] [PubMed]
  12. Xu, T.; Jin, J.; Gregory, C.; Hickman, J.J.; Boland, T. Inkjet printing of viable mammalian cells. Biomaterials 2005, 26, 93–99. [Google Scholar] [CrossRef] [PubMed]
  13. Ru, C.H.; Luo, J.; Xie, S.R.; Sun, Y. A review of non-contact micro- and nano-printing technologies. J. Micromech. Microeng. 2014, 24, 053001. [Google Scholar] [CrossRef]
  14. Taylor, G. Disintegration of water drops in an electric field. Proc. R. Soc. London. Ser. A Math. Phys. Sci. 1964, 280, 383–397. [Google Scholar] [CrossRef]
  15. Wilm, M. Principles of electrospray ionization. Mol. Cell. Proteomics 2011, 10, M111.009407. [Google Scholar] [CrossRef] [PubMed]
  16. Galliker, P.; Schneider, J.; Eghlidi, H.; Kress, S.; Sandoghdar, V.; Poulikakos, D. Direct printing of nanostructures by electrostatic autofocussing of ink nanodroplets. Nat. Commun. 2012, 3, 890. [Google Scholar] [CrossRef] [PubMed]
  17. Binnig, G.; Quate, C.F.; Gerber, C. Atomic force microscope. Phys. Rev. Lett. 1986, 56, 930–933. [Google Scholar] [CrossRef] [PubMed]
  18. Schitter, G.; Steininger, J.; Heuck, F.C.A.; Staufer, U. Towards fast AFM-based nanometrology and nanomanufacturing. Int. J. Nanomanuf. 2012, 8, 392–418. [Google Scholar] [CrossRef]
  19. Bellido, E.; de Miguel, R.; Ruiz-Molina, D.; Lostao, A.; Maspoch, D. Controlling the number of proteins with dip-pen nanolithography. Adv. Mater. 2010, 22, 352–355. [Google Scholar] [CrossRef] [PubMed]
  20. Wu, C.C.; Reinhoudt, D.N.; Otto, C.; Subramaniam, V.; Velders, A.H. Strategies for patterning biomolecules with dip-pen nanolithography. Small 2011, 7, 989–1002. [Google Scholar] [CrossRef] [PubMed]
  21. Bellido, E.; Cardona-Serra, S.; Coronado, E.; Ruiz-Molina, D. Assisted-assembly of coordination materials into advanced nanoarchitectures by Dip Pen nanolithography. Chem. Commun. 2011, 47, 5175–5177. [Google Scholar] [CrossRef] [Green Version]
  22. Meister, A.; Jeney, S.; Liley, M.; Akiyama, T.; Staufer, U.; de Rooij, N.F.; Heinzelmann, H. Nanoscale dispensing of liquids through cantilevered probes. Microelectron. Eng. 2003, 67–68, 644–650. [Google Scholar] [CrossRef]
  23. Kim, K.H.; Moldovan, N.; Ke, C.; Espinosa, H.D. A novel AFM chip for fountain pen nanolithography—Design and microfabrication. Micro Nanosyst. 2004, 782, 267–272. [Google Scholar]
  24. Hug, T.; Biss, T.; de Rooij, N.; Staufer, U. Generic Fabrication Technology for Transparent and Suspended Microfluidic and Nanofluidic Channels. In Proceedings of the 13th International Conference on Solid-State Sensors, Actuators and Microsystems (Transducers’ 05), Seoul, Korea, 5–9 June 2005; pp. 1191–1194.
  25. Meister, A.; Gabi, M.; Behr, P.; Studer, P.; Voros, J.; Niedermann, P.; Bitterli, J.; Polesel-Maris, J.; Liley, M.; Heinzelmann, H.; Zambelli, T. FluidFM: Combining atomic force microscopy and nanofluidics in a universal liquid delivery system for single cell applications and beyond. Nano Lett. 2009, 9, 2501–2507. [Google Scholar] [CrossRef] [PubMed]
  26. Lewis, A.; Kheifetz, Y.; Shambrodt, E.; Radko, A.; Khatchatryan, E.; Sukenik, C. Fountain pen nanochemistry: Atomic force control of chrome etching. Appl. Phys. Lett. 1999, 75, 2689–2691. [Google Scholar] [CrossRef]
  27. Pellegrino, M.; Orsini, P.; Pellegrini, M.; Baschieri, P.; Dinelli, F.; Petracchi, D.; Tognoni, E.; Ascoli, C. Weak hydrostatic forces in far-scanning ion conductance microscopy used to guide neuronal growth cones. Neurosci. Res. 2011, 69, 234–240. [Google Scholar] [CrossRef] [PubMed]
  28. Chen, C.-C.; Zhou, Y.; Baker, L.A. Scanning ion conductance microscopy. Annu. Rev. Anal. Chem. 2012, 5, 207–228. [Google Scholar] [CrossRef]
  29. Leichle, T.; Lishchynska, M.; Mathieu, F.; Pourciel, J.B.; Saya, D.; Nicu, L. A microcantilever-based picoliter droplet dispenser with integrated force sensors and electroassisted deposition means. J. Microelectromech. Syst. 2008, 17, 1239–1253. [Google Scholar] [CrossRef]
  30. Jaschke, M.; Butt, H.J. Deposition of organic material by the tip of a scanning force microscope. Langmuir 1995, 11, 1061–1064. [Google Scholar] [CrossRef]
  31. Piner, R.D.; Zhu, J.; Xu, F.; Hong, S.H.; Mirkin, C.A. “Dip-pen” nanolithography. Science 1999, 283, 661–663. [Google Scholar] [CrossRef] [PubMed]
  32. Jang, J.Y.; Hong, S.H.; Schatz, G.C.; Ratner, M.A. Self-assembly of ink molecules in dip-pen nanolithography: A diffusion model. J. Chem. Phys. 2001, 115, 2721–2729. [Google Scholar] [CrossRef]
  33. Mirkin, C.A. Programming the assembly of two- and three-dimensional architectures with DNA and nanoscale inorganic building blocks. Inorg. Chem. 2000, 39, 2258–2272. [Google Scholar] [CrossRef] [PubMed]
  34. Demers, L.M.; Ginger, D.S.; Park, S.J.; Li, Z.; Chung, S.W.; Mirkin, C.A. Direct patterning of modified oligonucleotides on metals and insulators by dip-pen nanolithography. Science 2002, 296, 1836–1838. [Google Scholar] [CrossRef] [PubMed]
  35. Chung, S.W.; Ginger, D.S.; Morales, M.W.; Zhang, Z.F.; Chandrasekhar, V.; Ratner, M.A.; Mirkin, C.A. Top-down meets bottom-up: Dip-pen nanolithography and DNA-directed assembly of nanoscale electrical circuits. Small 2005, 1, 64–69. [Google Scholar] [CrossRef] [PubMed]
  36. Lee, K.B.; Park, S.J.; Mirkin, C.A.; Smith, J.C.; Mrksich, M. Protein nanoarrays generated by dip-pen nanolithography. Science 2002, 295, 1702–1705. [Google Scholar] [CrossRef] [PubMed]
  37. Lim, J.H.; Ginger, D.S.; Lee, K.B.; Heo, J.; Nam, J.M.; Mirkin, C.A. Direct-write dip-pen nanolithography of proteins on modified silicon oxide surfaces. Angew. Chemie-Int. Ed. 2003, 42, 2309–2312. [Google Scholar] [CrossRef]
  38. Lee, K.B.; Lim, J.H.; Mirkin, C.A. Protein nanostructures formed via direct-write dip-pen nanolithography. J. Am. Chem. Soc. 2003, 125, 5588–5589. [Google Scholar] [CrossRef] [PubMed]
  39. Lee, S.W.; Oh, B.K.; Sanedrin, R.G.; Salaita, K.; Fujigaya, T.; Mirkin, C.A. Biologically active protein nanoarrays generated using parallel dip-pen nanolithography. Adv. Mater. 2006, 18, 1133–1136. [Google Scholar] [CrossRef]
  40. Lee, K.B.; Kim, E.Y.; Mirkin, C.A.; Wolinsky, S.M. The use of nanoarrays for highly sensitive and selective detection of human immunodeficiency virus type 1 in plasma. Nano Lett. 2004, 4, 1869–1872. [Google Scholar] [CrossRef]
  41. Smith, J.C.; Lee, K.B.; Wang, Q.; Finn, M.G.; Johnson, J.E.; Mrksich, M.; Mirkin, C.A. Nanopatterning the chemospecific immobilization of cowpea mosaic virus capsid. Nano Lett. 2003, 3, 883–886. [Google Scholar] [CrossRef]
  42. Vega, R.A.; Maspoch, D.; Salaita, K.; Mirkin, C.A. Nanoarrays of single virus particles. Angew. Chemie-Int. Ed. 2005, 44, 6013–6015. [Google Scholar] [CrossRef]
  43. Rozhok, S.; Shen, C.K.F.; Littler, P.L.H.; Fan, Z.F.; Liu, C.; Mirkin, C.A.; Holz, R.C. Methods for fabricating microarrays of motile bacteria. Small 2005, 1, 445–451. [Google Scholar] [CrossRef] [PubMed]
  44. Maynor, B.W.; Li, Y.; Liu, J. Au “ink” for AFM “dip-pen” nanolithography. Langmuir 2001, 17, 2575–2578. [Google Scholar] [CrossRef]
  45. Liu, X.G.; Fu, L.; Hong, S.H.; Dravid, V.P.; Mirkin, C.A. Arrays of magnetic nanoparticles patterned via “dip-pen” nanolithography. Adv. Mater. 2002, 14, 231–234. [Google Scholar] [CrossRef]
  46. Jung, H.; Kulkarni, R.; Collier, C.P. Dip-pen nanolithography of reactive alkoxysilanes on glass. J. Am. Chem. Soc. 2003, 125, 12096–12097. [Google Scholar] [CrossRef] [PubMed]
  47. Pena, D.J.; Raphael, M.P.; Byers, J.M. “Dip-Pen” nanolithography in registry with photolithography for biosensor development. Langmuir 2003, 19, 9028–9032. [Google Scholar] [CrossRef]
  48. Noy, A.; Miller, A.E.; Klare, J.E.; Weeks, B.L.; Woods, B.W.; DeYoreo, J.J. Fabrication of luminescent nanostructures and polymer nanowires using dip-pen nanolithography. Nano Lett. 2002, 2, 109–112. [Google Scholar] [CrossRef]
  49. Su, M.; Liu, X.G.; Li, S.Y.; Dravid, V.P.; Mirkin, C.A. Moving beyond molecules: Patterning solid-state features via dip-pen nanolithography with sol-based inks. J. Am. Chem. Soc. 2002, 124, 1560–1561. [Google Scholar] [CrossRef] [PubMed]
  50. Salaita, K.; Wang, Y.H.; Mirkin, C.A. Applications of dip-pen nanolithography. Nat. Nanotechnol. 2007, 2, 145–155. [Google Scholar] [CrossRef] [PubMed]
  51. Salaita, K.; Wang, Y.H.; Fragala, J.; Vega, R.A.; Liu, C.; Mirkin, C.A. Massively parallel dip-pen nanolithography with 55000-pen two-dimensional arrays. Angew. Chemie-Int. Ed. 2006, 45, 7220–7223. [Google Scholar] [CrossRef]
  52. Huo, F.W.; Zheng, Z.J.; Zheng, G.F.; Giam, L.R.; Zhang, H.; Mirkin, C.A. Polymer pen lithography. Science 2008, 321, 1658–1660. [Google Scholar] [CrossRef] [PubMed]
  53. Shim, W.; Braunschweig, A.B.; Liao, X.; Chai, J.N.; Lim, J.K.; Zheng, G.F.; Mirkin, C.A. Hard-tip, soft-spring lithography. Nature 2011, 469, 516–521. [Google Scholar] [CrossRef] [PubMed]
  54. Giam, L.R.; Mirkin, C.A. Cantilever-Free Scanning Probe Molecular Printing. Angew.Chemie-Int. Ed. 2011, 50, 7482–7485. [Google Scholar] [CrossRef]
  55. Meister, A.; Liley, M.; Brugger, J.; Pugin, R.; Heinzelmann, H. Nanodispenser for attoliter volume deposition using atomic force microscopy probes modified by focused-ion-beam milling. Appl. Phys. Lett. 2004, 85, 6260–6262. [Google Scholar] [CrossRef]
  56. Meister, A. Nanoscale Dispensing of Single Ultrasmall Droplets. Ph.D. Thesis, University of Basel, Basel, The Switzerland, 2005. [Google Scholar]
  57. Kaisei, K.; Satoh, N.; Kobayashi, K.; Matsushige, K.; Yamada, H. Nanoscale liquid droplet deposition using the ultrasmall aperture on a dynamic mode AFM tip. Nanotechnology 2011, 22, 175301. [Google Scholar] [CrossRef] [PubMed]
  58. Kim, K.H.; Moldovan, N.; Espinosa, H.D. A nanofountain probe with sub-100 nm molecular writing resolution. Small 2005, 1, 632–635. [Google Scholar] [CrossRef] [PubMed]
  59. Lee, Y.K.; Lee, S.H.; Kim, Y.J.; Kim, H.M. A novel passive membrane pumping nano fountain-pen. In Proceedings of the 1st IEEE International Conference on Nano/Micro Engineered and Molecular Systems, Zhuhai, China, 18–21 January 2006; pp. 1012–1017.
  60. Hwang, K.; Lee, S.H.; Kim, Y.J.; Kim, H. Control of line width with active nano fountain pen (ANFP) for nano manufacturing. J. Mech. Sci. Technol. 2008, 22, 1339–1348. [Google Scholar] [CrossRef]
  61. Loh, O.Y.; Ho, A.M.; Rim, J.E.; Kohli, P.; Patankar, N.A.; Espinosa, H.D. Electric field-induced direct delivery of proteins by a nanofountain probe. Proc. Natl. Acad. Sci. USA 2008, 105, 16438–16443. [Google Scholar] [CrossRef] [PubMed]
  62. Moldovan, N.; Kim, K.H.; Espinosa, H.D. A multi-ink linear array of nanofountain probes. J. Micromech. Microeng. 2006, 16, 1935–1942. [Google Scholar] [CrossRef]
  63. Deladi, S.; Tas, N.R.; Berenschot, J.W.; Krijnen, G.J.M.; de Boer, M.J.; de Boer, J.H.; Peter, M.; Elwenspoek, M.C. Micromachined fountain pen for atomic force microscope-based nanopatterning. Appl. Phys. Lett. 2004, 85, 5361–5363. [Google Scholar] [CrossRef]
  64. Deladi, S.; Berenschot, J.W.; Tas, N.R.; Krijnen, G.J.M.; de Boer, J.H.; de Boer, M.J.; Elwenspoek, M.C. Fabrication of micromachined fountain pen with in situ characterization possibility of nanoscale surface modification. J. Micromech. Microeng. 2005, 15, 528–534. [Google Scholar] [CrossRef]
  65. Meister, A.; Polesel-Maris, J.; Niedermann, P.; Przybylska, J.; Studer, P.; Gabi, M.; Behr, P.; Zambelli, T.; Liley, M.; Voros, J.; et al. Nanoscale dispensing in liquid environment of streptavidin on a biotin-functionalized surface using hollow atomic force microscopy probes. Microelectron. Eng. 2009, 86, 1481–1484. [Google Scholar] [CrossRef]
  66. Geerlings, J.; Sarajlic, E.; Berenschot, J.; Sanders, R.; Abelmann, L.; Tas, N. Electrospray deposition from AFM probes with nanoscale apertures. In Proceedings of the 2014 IEEE 27th International Conference on Micro Electro Mechanical Systems (MEMS), San Francisco, CA, USA, 26–30 January 2014; pp. 100–103.
  67. Garza, H.; Stoute, R.; Ghatkesar, M.; Staufer, U. Self-sensing nanopipette for liquid dispensing and AFM imaging. In Proceedings of the 2013 Transducers & Eurosensors XXVII: The 17th International Conference on Solid-State Sensors, Actuators and Microsystems, Madrid, Spain, 16–20 June 2013; pp. 2648–2651.
  68. Khan, M.F.; Schmid, S.; Davis, Z.J.; Dohn, S.; Boisen, A. Fabrication of resonant micro cantilevers with integrated transparent fluidic channel. Microelectron. Eng. 2011, 88, 2300–2303. [Google Scholar] [CrossRef]
  69. Ghatkesar, M.K.; Garza, H.H.P.; Staufer, U. Hollow AFM cantilever pipette. Microelectron. Eng. 2014, 124, 22–25. [Google Scholar] [CrossRef]
  70. Lovsky, Y.; Lewis, A.; Sukenik, C.; Grushka, E. Atomic-force-controlled capillary electrophoretic nanoprinting of proteins. Anal. Bioanal. Chem. 2010, 396, 133–138. [Google Scholar] [CrossRef] [PubMed]
  71. Tsarfati-BarAd, I.; Sauer, U.; Preininger, C.; Gheber, L.A. Miniaturized protein arrays: Model and experiment. Biosensors Bioelectron. 2011, 26, 3774–3781. [Google Scholar] [CrossRef]
  72. Taha, H.; Marks, R.S.; Gheber, L.A.; Rousso, I.; Newman, J.; Sukenik, C.; Lewis, A. Protein printing with an atomic force sensing nanofountainpen. Appl. Phys. Lett. 2003, 83, 1041–1043. [Google Scholar] [CrossRef]
  73. Strain, K.M.; Yeshua, T.; Gromov, A.V.; Nerushev, O.; Lewis, A.; Campbell, E.E.B. Direct deposition of aligned single walled carbon nanotubes by fountain pen nanolithography. Mater. Express 2011, 1, 279–284. [Google Scholar] [CrossRef]
  74. Sokuler, M.; Aronov, D.; Rosenman, G.; Gheber, L.A. Tailored polymer microlenses on treated glass surfaces. Appl. Phys. Lett. 2007, 90, 203106. [Google Scholar] [CrossRef]
  75. Kantarovich, K.; Tsarfati, I.; Gheber, L.A.; Haupt, K.; Bar, I. Writing droplets of molecularly imprinted polymers by nano fountain pen and detecting their molecular interactions by surface-enhanced raman scattering. Anal. Chem. 2009, 81, 5686–5690. [Google Scholar] [CrossRef] [PubMed]
  76. Belmont, A.S.; Sokuler, M.; Haupt, K.; Gheber, L.A. Direct writing of molecularly imprinted microstructures using a nanofountain pen. Appl. Phys. Lett. 2007, 90, 193101. [Google Scholar] [CrossRef]
  77. Edwards, M.A.; Williams, C.G.; Whitworth, A.L.; Unwin, P.R. Scanning ion conductance microscopy: A model for experimentally realistic conditions and image interpretation. Anal. Chem. 2009, 81, 4482–4492. [Google Scholar] [CrossRef] [PubMed]
  78. Hansma, P.K.; Drake, B.; Marti, O.; Gould, S.A.C.; Prater, C.B. The scanning ion-conductance microscope. Science 1989, 243, 641–643. [Google Scholar] [CrossRef] [PubMed]
  79. Shevchuk, A.I.; Frolenkov, G.I.; Sanchez, D.; James, P.S.; Freedman, N.; Lab, M.J.; Jones, R.; Klenerman, D.; Korchev, Y.E. Imaging proteins in membranes of living cells by high-resolution scanning ion conductance microscopy. Angew. Chemie-Int. Ed. 2006, 45, 2212–2216. [Google Scholar] [CrossRef]
  80. Happel, P.; Thatenhorst, D.; Dietzel, I.D. Scanning ion conductance microscopy for studying biological samples. Sensors 2012, 12, 14983–15008. [Google Scholar] [CrossRef] [PubMed]
  81. Seger, R.A.; Actis, P.; Penfold, C.; Maalouf, M.; Vilozny, B.; Pourmand, N. Voltage controlled nano-injection system for single-cell surgery. Nanoscale 2012, 4, 5843–5846. [Google Scholar] [CrossRef] [PubMed]
  82. Ebejer, N.; Guell, A.G.; Lai, S.C.S.; McKelvey, K.; Snowden, M.E.; Unwin, P.R. Scanning electrochemical cell microscopy: A versatile technique for nanoscale electrochemistry and functional imaging. Annu. Rev. Anal. Chem. 2013, 6, 329–351. [Google Scholar] [CrossRef]
  83. Ebejer, N.; Schnippering, M.; Colburn, A.W.; Edwards, M.A.; Unwin, P.R. Localized high resolution electrochemistry and multifunctional imaging: Scanning electrochemical cell microscopy. Anal. Chem. 2010, 82, 9141–9145. [Google Scholar] [CrossRef] [PubMed]
  84. Snowden, M.E.; Guell, A.G.; Lai, S.C.S.; McKelvey, K.; Ebejer, N.; O’Connell, M.A.; Colburn, A.W.; Unwin, P.R. Scanning Electrochemical cell microscopy: Theory and experiment for quantitative high resolution spatially-resolved voltammetry and simultaneous ion-conductance measurements. Anal. Chem. 2012, 84, 2483–2491. [Google Scholar] [CrossRef] [PubMed]
  85. Cortes-Salazar, F.; Lesch, A.; Momotenko, D.; Busnel, J.M.; Wittstock, G.; Girault, H.H. Fountain pen for scanning electrochemical microscopy. Anal. Methods 2010, 2, 817–823. [Google Scholar] [CrossRef]
  86. Momotenko, D.; Qiao, L.; Cortes-Salazar, F.; Lesch, A.; Wittstock, G.; Girault, H.H. Electrochemical push-pull scanner with mass spectrometry detection. Anal. Chem. 2012, 84, 6630–6637. [Google Scholar] [CrossRef] [PubMed]
  87. Juncker, D.; Schmid, H.; Delamarche, E. Multipurpose microfluidic probe. Nat. Mater. 2005, 4, 622–628. [Google Scholar] [CrossRef] [PubMed]
  88. Lishchynska, M.; Leiche, T.; Nicu, L. FEM assisted calibration of a MEMS-based dispensing system with integrated piezoresistive force sensors. J. Micromech. Microeng. 2008, 18, 015010. [Google Scholar] [CrossRef]
  89. Lishchynska, M.; Leichle, T.; Nicu, L. Semi-empirical model for longitudinal piezoresistive sensitivity of microcantilevers. Microelectron. Eng. 2008, 85, 1321–1325. [Google Scholar] [CrossRef]
  90. Leichle, T.; Saya, D.; Pourciel, J.B.; Mathieu, F.; Nicu, L.; Bergaud, C. Liquid loading of silicon-based cantilevers using electrowetting actuation for microspotting applications. Sens. Actuators Phys. 2006, 132, 590–596. [Google Scholar] [CrossRef]
  91. Berthet-Duroure, N.; Leichle, T.; Pourciel, J.B.; Martin, C.; Bausells, J.; Lora-Tamayo, E.; Perez-Murano, F.; Francois, J.M.; Trevisiol, E.; Nicu, L. Interaction of biomolecules sequentially deposited at the same location using a microcantilever-based spotter. Biomed. Microdevices 2008, 10, 479–487. [Google Scholar] [CrossRef] [PubMed]
  92. Martin, C.; Llobera, A.; Leichle, T.; Villanueva, G.; Voigt, A.; Fakhfouri, V.; Kim, J.Y.; Berthet, N.; Bausells, J.; Gruetzner, G.; et al. Novel methods to pattern polymers for microfluidics. Microelectron. Eng. 2008, 85, 972–975. [Google Scholar] [CrossRef]
  93. Leïchlé, T. Bioplume: A MEMS-Based Picoliter Droplet Dispenser with Electrospotting Means for Patterning Surfaces at the Micro- and the Nanometer Scales. Ph.D. Thesis, Université Paul Sabatier-Toulouse III, Toulouse, France, 5 December 2005. [Google Scholar]
  94. Moldovan, N.; Kim, K.H.; Espinosa, H.D. Design and fabrication of a novel microfluidic nanoprobe. J. Microelectromech. Syst. 2006, 15, 204–213. [Google Scholar] [CrossRef]
  95. Heuck, F.; Hug, T.; Akiyama, T.; Frederix, P.L.T.M.; Engel, A.; Meister, A.; Heinzelmann, H.; de Rooij, N.F.; Staufer, U. Evaporation based micro pump integrated into a scanning force microscope probe. Microelectron. Eng. 2008, 85, 1302–1305. [Google Scholar] [CrossRef]
  96. Garza, H.H.P.; Ghatkesar, M.K.; Staufer, U. Combined AFM—Nanopipette Cartridge System for Actively Dispensing Femtolitre Droplets. In Proceedings of the 2012 International Conference on Manipulation, Manufacturing and Measurement on the Nanoscale (3M-Nano), Shanxi, China, 29 August–1 September 2012; pp. 320–325.
  97. Heuck, F.C.A.; Staufer, U. Low voltage electroosmotic pump for high density integration into microfabricated fluidic systems. Microfluid. Nanofluid. 2011, 10, 1317–1332. [Google Scholar] [CrossRef]
  98. Wang, Y.H.; Giam, L.R.; Park, M.; Lenhert, S.; Fuchs, H.; Mirkin, C.A. A self-correcting inking strategy for cantilever arrays addressed by an inkjet printer and used for dip-pen nanolithography. Small 2008, 4, 1666–1670. [Google Scholar] [CrossRef] [PubMed]
  99. Heuck, F. Developing and Analysing Sub-10 μm Fluidic Systems with Integrated Electrodes for Pumping and Sensing in Nanotechnology Applications. Ph.D. Thesis, Delft University of Technology, Delft, The Netherlands, 28 October 2010. [Google Scholar]
  100. Janz, G.J.; Ives, D.J.G. Silver silver chloride electrodes. Ann. NY Acad. Sci. 1968, 148, 210–221. [Google Scholar] [CrossRef]
  101. Heuck, F.C.A.; Staufer, U. Electroless deposition and structuring of silver electrodes in closed microfluidic capillaries. J. Microelectromech. Syst. 2011, 20, 451–459. [Google Scholar] [CrossRef]
  102. Heuck, F.; van der Ploeg, P.; Staufer, U. Deposition and structuring of Ag/AgCl electrodes inside a closed polymeric microfluidic system for electroosmotic pumping. Microelectron. Eng. 2011, 88, 1887–1890. [Google Scholar] [CrossRef]
  103. Elveflow Microfluidic Flow Control System. Available online: http://www.elveflow.com/microfluidic-reviews-and-tutorials/how-to-choose-the-right-microfluidics-flow-control-system (accessed on 15 October 2014).
  104. Oh, K.W.; Lee, K.; Ahn, B.; Furlani, E.P. Design of pressure-driven microfluidic networks using electric circuit analogy. Lab. Chip 2012, 12, 515–545. [Google Scholar] [CrossRef] [PubMed]
  105. Biswas, S.; Hirtz, M.; Fuchs, H. Measurement of Mass Transfer during Dip-Pen Nanolithography with Phospholipids. Small 2011, 7, 2081–2086. [Google Scholar] [CrossRef] [PubMed]
  106. Arcamone, J.; Dujardin, E.; Rius, G.; Perez-Murano, F.; Ondarcuhu, T. Evaporation of femtoliter sessile droplets monitored with nanomechanical mass sensors. J. Phys. Chem. B 2007, 111, 13020–13027. [Google Scholar] [CrossRef] [PubMed]
  107. Burg, T.P.; Godin, M.; Knudsen, S.M.; Shen, W.; Carlson, G.; Foster, J.S.; Babcock, K.; Manalis, S.R. Weighing of biomolecules, single cells and single nanoparticles in fluid. Nature 2007, 446, 1066–1069. [Google Scholar] [CrossRef] [PubMed]
  108. Ghatkesar, M.K.; Braun, T.; Barwich, V.; Ramseyer, J.P.; Gerber, C.; Hegner, M.; Lang, H.P. Resonating modes of vibrating microcantilevers in liquid. Appl. Phys. Lett. 2008, 92, 043106. [Google Scholar] [CrossRef]
  109. Stone, H.A.; Stroock, A.D.; Ajdari, A. Engineering flows in small devices: Microfluidics toward a lab-on-a-chip. Annu. Rev. Fluid Mech. 2004, 36, 381–411. [Google Scholar] [CrossRef]
  110. Gunther, A.; Jensen, K.F. Multiphase microfluidics: from flow characteristics to chemical and materials synthesis. Lab. Chip 2006, 6, 1487–1503. [Google Scholar] [CrossRef] [PubMed]
  111. Hager, W.H. Wilfrid Noel Bond and the Bond number. J. Hydraul Res. 2012, 50, 3–9. [Google Scholar] [CrossRef]
  112. Rozhok, S.; Sun, P.; Piner, R.; Lieberman, M.; Mirkin, C.A. AFM study of water meniscus formation between an AFM tip and NaCl substrate. J. Phys. Chem. B 2004, 108, 7814–7819. [Google Scholar] [CrossRef]
  113. Sirghi, L. Transport mechanisms in capillary condensation of water at a single-asperity nanoscopic contact. Langmuir 2012, 28, 2558–2566. [Google Scholar] [CrossRef] [PubMed]
  114. Sheehan, P.E.; Whitman, L.J. Thiol diffusion and the role of humidity in “dip pen nanolithography”. Phys. Rev. Lett. 2002, 88, 156104. [Google Scholar] [CrossRef] [PubMed]
  115. Rozhok, S.; Piner, R.; Mirkin, C.A. Dip-pen nanolithography: What controls ink transport? J. Phys. Chem. B 2003, 107, 751–757. [Google Scholar] [CrossRef]
  116. Ho, A.M.; Espinosa, H.D. Scanning Probes for the Life Sciences. In Applied Scanning Probe Methods VIII; Bhushan, B., Fuchs, H., Eds.; Springer: Berlin Heidelberg, Germany, 2008; pp. 183–217. [Google Scholar]
  117. Espinosa, H.D.; Moldovan, N.; Kim, K.-H. Novel AFM nanoprobes. Appl. Scanning Probe Methods VII 2007, 77–134. [Google Scholar]
  118. Fang, A.P.; Dujardin, E.; Ondarcuhu, T. Control of droplet size in liquid nanodispensing. Nano Lett. 2006, 6, 2368–2374. [Google Scholar] [CrossRef] [PubMed]
  119. Shibata, T.; Nakamura, K.; Horiike, S.; Nagai, M.; Kawashima, T.; Mineta, T.; Makino, E. Fabrication and characterization of bioprobe integrated with a hollow nanoneedle for novel AFM applications in cellular function analysis. Microelectron. Eng. 2013, 111, 325–331. [Google Scholar] [CrossRef]
  120. Good, R.J. Contact-angle, wetting, and adhesion—A critical review. J. Adhes. Sci. Technol. 1992, 6, 1269–1302. [Google Scholar] [CrossRef]
  121. Derjagui, B.V.; Churaev, N.V. Structural component of disjoining pressure. J. Coll. Interface Sci. 1974, 49, 249–255. [Google Scholar]
  122. Michael Nosonovsky, B.B. Capillary Adhesion and Nanoscale Properties of Water; Springer: Berlin, Germany, 2011. [Google Scholar]
  123. Israelachvili, J.N. Intermolecular and Surface Forces; Elsevier: Amsterdam, The Netherlands, 2011. [Google Scholar]
  124. Butt, H.J.; Kappl, M. Normal capillary forces. Adv. Coll. Interface 2009, 146, 48–60. [Google Scholar] [CrossRef]
  125. Gao, C. Theory of menisci and its applications. Appl. Phys. Lett. 1997, 71, 1801–1803. [Google Scholar] [CrossRef]
  126. Hotta, K.; Takeda, K.; Iinoya, K. Capillary binding force of a liquid bridge. Powder Technol. 1974, 10, 231–242. [Google Scholar] [CrossRef]
  127. Fabie, L.; Durou, H.; Ondarcuhu, T. Capillary forces during liquid nanodispensing. Langmuir 2010, 26, 1870–1878. [Google Scholar] [CrossRef] [PubMed]
  128. Hampton, J.R.; Dameron, A.A.; Weiss, P.S. Double-ink dip-pen nanolithography studies elucidate molecular transport. J. Am. Chem. Soc. 2006, 128, 1648–1653. [Google Scholar] [CrossRef] [PubMed]
  129. Fabie, L.; Ondarcuhu, T. Writing with liquid using a nanodispenser: Spreading dynamics at the sub-micron scale. Soft Matter 2012, 8, 4995–5001. [Google Scholar] [CrossRef]
  130. van Honschoten, J.W.; Brunets, N.; Tas, N.R. Capillarity at the nanoscale. Chem. Soc. Rev. 2010, 39, 1096–1114. [Google Scholar]
  131. Chung, S.; Felts, J.R.; Wang, D.; King, W.P.; De Yoreo, J.J. Temperature-dependence of ink transport during thermal dip-pen nanolithography. Appl. Phys. Lett. 2011, 99, 193101. [Google Scholar] [CrossRef]
  132. Andrienko, D.; Patricio, P.; Vinogradova, O.I. Capillary bridging and long-range attractive forces in a mean-field approach. J. Chem. Phys. 2004, 121, 4414–4423. [Google Scholar] [CrossRef] [PubMed]
  133. Sirghi, L.; Szoszkiewicz, R.; Riedo, E. Volume of a nanoscale water bridge. Langmuir 2006, 22, 1093–1098. [Google Scholar] [CrossRef] [PubMed]
  134. O’connell, C.D.; Higgins, M.J.; Marusic, D.; Moulton, S.E.; Wallace, G.G. Liquid ink deposition from an atomic force microscope tip: Deposition monitoring and control of feature size. Langmuir 2014, 30, 2712–2721. [Google Scholar] [CrossRef]
  135. Bonaccurso, E.; Golovko, D.S.; Bonanno, P.; Raiteri, R.; Haschke, T.; Wiechert, W.; Butt, H.-J. Atomic Force Microscope Cantilevers Used as Sensors for Monitoring Microdrop Evaporation. In Applied Scanning Probe Methods XI; Springer: Berlin, Germany, 2009; pp. 17–38. [Google Scholar]
  136. Butt, H.J.; Golovko, D.S.; Bonaccurso, E. On the derivation of Young’s equation for sessile drops: Nonequilibrium effects due to evaporation. J. Phys. Chem. B 2007, 111, 5277–5283. [Google Scholar] [CrossRef] [PubMed]
  137. Schonfeld, F.; Graf, K.; Hardt, S.; Butt, H.J. Evaporation dynamics of sessile liquid drops in still air with constant contact radius. Int. J. Heat Mass Transf. 2008, 51, 3696–3699. [Google Scholar] [CrossRef]
  138. MacFarlane, D.R.; Golding, J.; Forsyth, S.; Forsyth, M.; Deacon, G.B. Low viscosity ionic liquids based on organic salts of the dicyanamide anion. Chem. Commun. 2001, 1430–1431. [Google Scholar]
  139. Heller, M.J. DNA microarray technology: Devices, systems, and applications. Annu. Rev. Biomed. Eng. 2002, 4, 129–153. [Google Scholar] [CrossRef] [PubMed]
  140. Stoughton, R.B. Applications of DNA microarrays in biology. Annu. Rev. Biochem. 2005, 74, 53–82. [Google Scholar] [CrossRef] [PubMed]
  141. Gruter, R.R.; Voros, J.; Zambelli, T. FluidFM as a lithography tool in liquid: Spatially controlled deposition of fluorescent nanoparticles. Nanoscale 2013, 5, 1097–1104. [Google Scholar] [CrossRef] [PubMed]
  142. Kang, W.M.; Yavari, F.; Minary-Jolandan, M.; Giraldo-Vela, J.P.; Safi, A.; McNaughton, R.L.; Parpoil, V.; Espinosa, H.D. Nanofountain probe electroporation (NFP-E) of single cells. Nano Lett. 2013, 13, 2448–2457. [Google Scholar] [CrossRef] [PubMed]
  143. Kang, W.M.; McNaughton, R.L.; Yavari, F.; Minary-Jolandan, M.; Safi, A.; Espinosa, H.D. Microfluidic parallel patterning and cellular delivery of molecules with a nanofountain probe. Jala 2014, 19, 100–109. [Google Scholar] [PubMed]
  144. Actis, P.; Maalouf, M.M.; Kim, H.J.; Lohith, A.; Vilozny, B.; Seger, R.A.; Pourmand, N. Compartmental genomics in living cells revealed by single-cell nanobiopsy. ACS Nano 2014, 8, 546–553. [Google Scholar] [CrossRef] [PubMed]
  145. Seger, R.A.; Actis, P.; Vilozny, B.; Pourmand, N. Single cell sensing and manipulation by scanning nanopore microscopy. Biophys. J. 2011, 100, 183–183. [Google Scholar] [CrossRef] [PubMed]
  146. Guillaume-Gentil, O.; Potthoff, E.; Ossola, D.; Franz, C.M.; Zambelli, T.; Vorholt, J.A. Force-controlled manipulation of single cells: from AFM to FluidFM. Trends Biotechnol. 2014, 32, 381–388. [Google Scholar] [CrossRef] [PubMed]
  147. Cong, P.J.; Doolen, R.D.; Fan, Q.; Giaquinta, D.M.; Guan, S.H.; McFarland, E.W.; Poojary, D.M.; Self, K.; Turner, H.W.; Weinberg, W.H. High-throughput synthesis and screening of combinatorial heterogeneous catalyst libraries. Angew. Chemie-Int. Ed. 1999, 38, 484–488. [Google Scholar] [CrossRef]
  148. Jambunathan, K.; Hillier, A.C. Measuring electrocatalytic activity on a local scale with scanning differential electrochemical mass spectrometry. J. Electrochem. Soc. 2003, 150, E312–E320. [Google Scholar] [CrossRef]
  149. Ghatkesar, M.K.; Barwich, V.; Braun, T.; Ramseyer, J.P.; Gerber, C.; Hegner, M.; Lang, H.P.; Drechsler, U.; Despont, M. Higher modes of vibration increase mass sensitivity in nanomechanical microcantilevers. Nanotechnology 2007, 18, 445502. [Google Scholar] [CrossRef]
  150. Burg, T.P.; Manalis, S.R. Suspended microchannel resonators for biomolecular detection. Appl. Phys. Lett. 2003, 83, 2698–2700. [Google Scholar]
  151. Woolley, A.T.; Lao, K.Q.; Glazer, A.N.; Mathies, R.A. Capillary electrophoresis chips with integrated electrochemical detection. Anal. Chem. 1998, 70, 684–688. [Google Scholar] [CrossRef] [PubMed]
  152. Pai, R.S.; Walsh, K.M.; Crain, M.M.; Roussel, T.J.; Jackson, D.J.; Baldwin, R.P.; Keynton, R.S.; Naber, J.F. Fully integrated three-dimensional electrodes for electrochemical detection in microchips: Fabrication, characterization, and applications. Anal. Chem. 2009, 81, 4762–4769. [Google Scholar] [CrossRef] [PubMed]
  153. Bratten, C.D.T.; Cobbold, P.H.; Cooper, J.M. Micromachining sensors for electrochemical measurement in subnanoliter volumes. Anal. Chem. 1997, 69, 253–258. [Google Scholar] [CrossRef]
  154. Korchev, Y.E.; Negulyaev, Y.A.; Edwards, C.R.W.; Vodyanoy, I.; Lab, M.J. Functional localization of single active ion channels can the surface of a living cell. Nat. Cell Biol. 2000, 2, 616–619. [Google Scholar] [CrossRef] [PubMed]
  155. Hamill, O.P.; Marty, A.; Neher, E.; Sakmann, B.; Sigworth, F.J. Improved patch-clamp techniques for high-resolution current recording from cells and cell-free membrane patches. Pflug. Arch. Eur. J. Physiol. 1981, 391, 85–100. [Google Scholar] [CrossRef]

