1. Introduction
Differential gene expression is a primary component with respect to the genotype and phenotype that facilitates rapid evolutionary response in the face of changing environmental pressures by generating phenotypic diversity [
1]. Comparative transcriptomics has emerged as the tool to understand these responses by linking the phenotype to the genotype through mRNA sequencing. However, the molecular mechanisms underlying phenotypic divergence are difficult to determine because there is usually no one-to-one link between the genotype and phenotype due to pleiotropic and epistatic effects [
2,
3]. Venom is an exception to this because it is a complex trait that is highly tractable from the gene being expressed to the final protein product [
4]. Venom is under strong selection as it aids in prey acquisition and/or serves as a predator deterrent [
5]. Changes within the venom phenotype occur through regulatory shifts in protein expression [
6], through loss of specific genes [
7], duplication [
8], and point mutations [
9]. Transcriptomics cannot detect all possible mechanisms resulting in phenotypic diversity, particularly with regard to genes in the genome that are not expressed or have multiple copies [
10]. However, for those genes that are expressed, transcriptomics offer an effective means of linking sequence-based and regulatory variation to changes in a composite phenotype [
11]. With the increase in availability of high-throughput proteomic, transcriptomic, and genomic resources, rattlesnakes and their venom have become a model system to understand these mechanisms as they exhibit high phenotypic diversity [
12,
13,
14,
15].
Rattlesnake venoms can be broadly characterized by the presence or absence of heterodimeric phospholipases A
(PLA
s). Type A venoms contain this PLA
which is a
-neurotoxin responsible for highly toxic venom in individuals that express it. These venoms also have little hemorrhagic activity due to low expression of snake venom metalloproteinases (SVMPs). Type B venoms lack the neurotoxic PLA
and are also characterized by high hemorrhagic activity due to high expression of SVMPs [
12,
13,
15,
16,
17]. When present, the PLA
acts presynaptically to disrupt the nervous system and both the acidic and basic subunits of the heterodimer must be expressed in the venom for the neurotoxic effect to occur. The origin of this toxin and its effect is due to a single nucleotide substitution that allowed the interaction of the two subunits to be energetically favorable [
9], and no evidence exists of this PLA
being in the genome and not being expressed proteomically [
18,
19,
20]. Examples include Mojave toxin (MTX) in
Crotalus scutulatus and its close relatives, sistruxin in
Sistrurus catenatus, crotoxin in the
Crotalus durissus complex, and canebrake toxin in
Crotalus horridus [
21,
22,
23,
24,
25]. Of the 48 species of rattlesnakes (
Crotalus and
Sistrurus) currently recognized [
26], 38 are considered as Type B, one is Type A, and 9 are documented as polymorphic [
25].
The lack of a phylogenetic pattern in venom phenotypes exhibited by rattlesnakes has hampered our understanding of the evolution of this dichotomy. The most recent hypothesis, based on genomic sequencing and ancestral state reconstruction, is that the ancestral state was neurotoxic (Type A) and lineages no longer possessing the neurotoxic PLA
(hereafter Mojave toxin/MTX) have lost it [
7]. Dowell et al. [
7] examined three rattlesnake species (
Crotalus adamanteus,
Crotalus atrox, and
C. scutulatus) and found that these three species have different sets of PLA
s based on venom type, which is supported by current transcriptomic evidence. Rokyta et al. [
27] compared the venom gland transcriptomes of one individual from a Type B species (
C. adamanteus) to one Type A species (
C. horridus) and found different sets of PLA
s. This was further supported by Rokyta et al. [
28] when they compared the venom gland transcriptomes of one Type B individual and one Type A individual of
C. horridus to examine intraspecific variation. They found different sets of PLA
s expressed in the transcriptome between Type A and Type B
C. horridus. Additionally, both studies found evidence to support the dichotomy. Type A individuals had simpler venom in that fewer toxins were expressed and the primary difference was the trade-off between MTX and SVMPs, but they also found differences in C-type lectins (CTLs) and myotoxin
a (hereafter MYO or myotoxins) [
27,
28]. Like
C. horridus,
C. scutulatus (Dowell et al. [
7]’s neurotoxic/Type A representative), have well documented intraspecific venom variability corresponding to the Type A and Type B venom phenotypes throughout their distribution [
20,
21,
29,
30,
31,
32,
33].
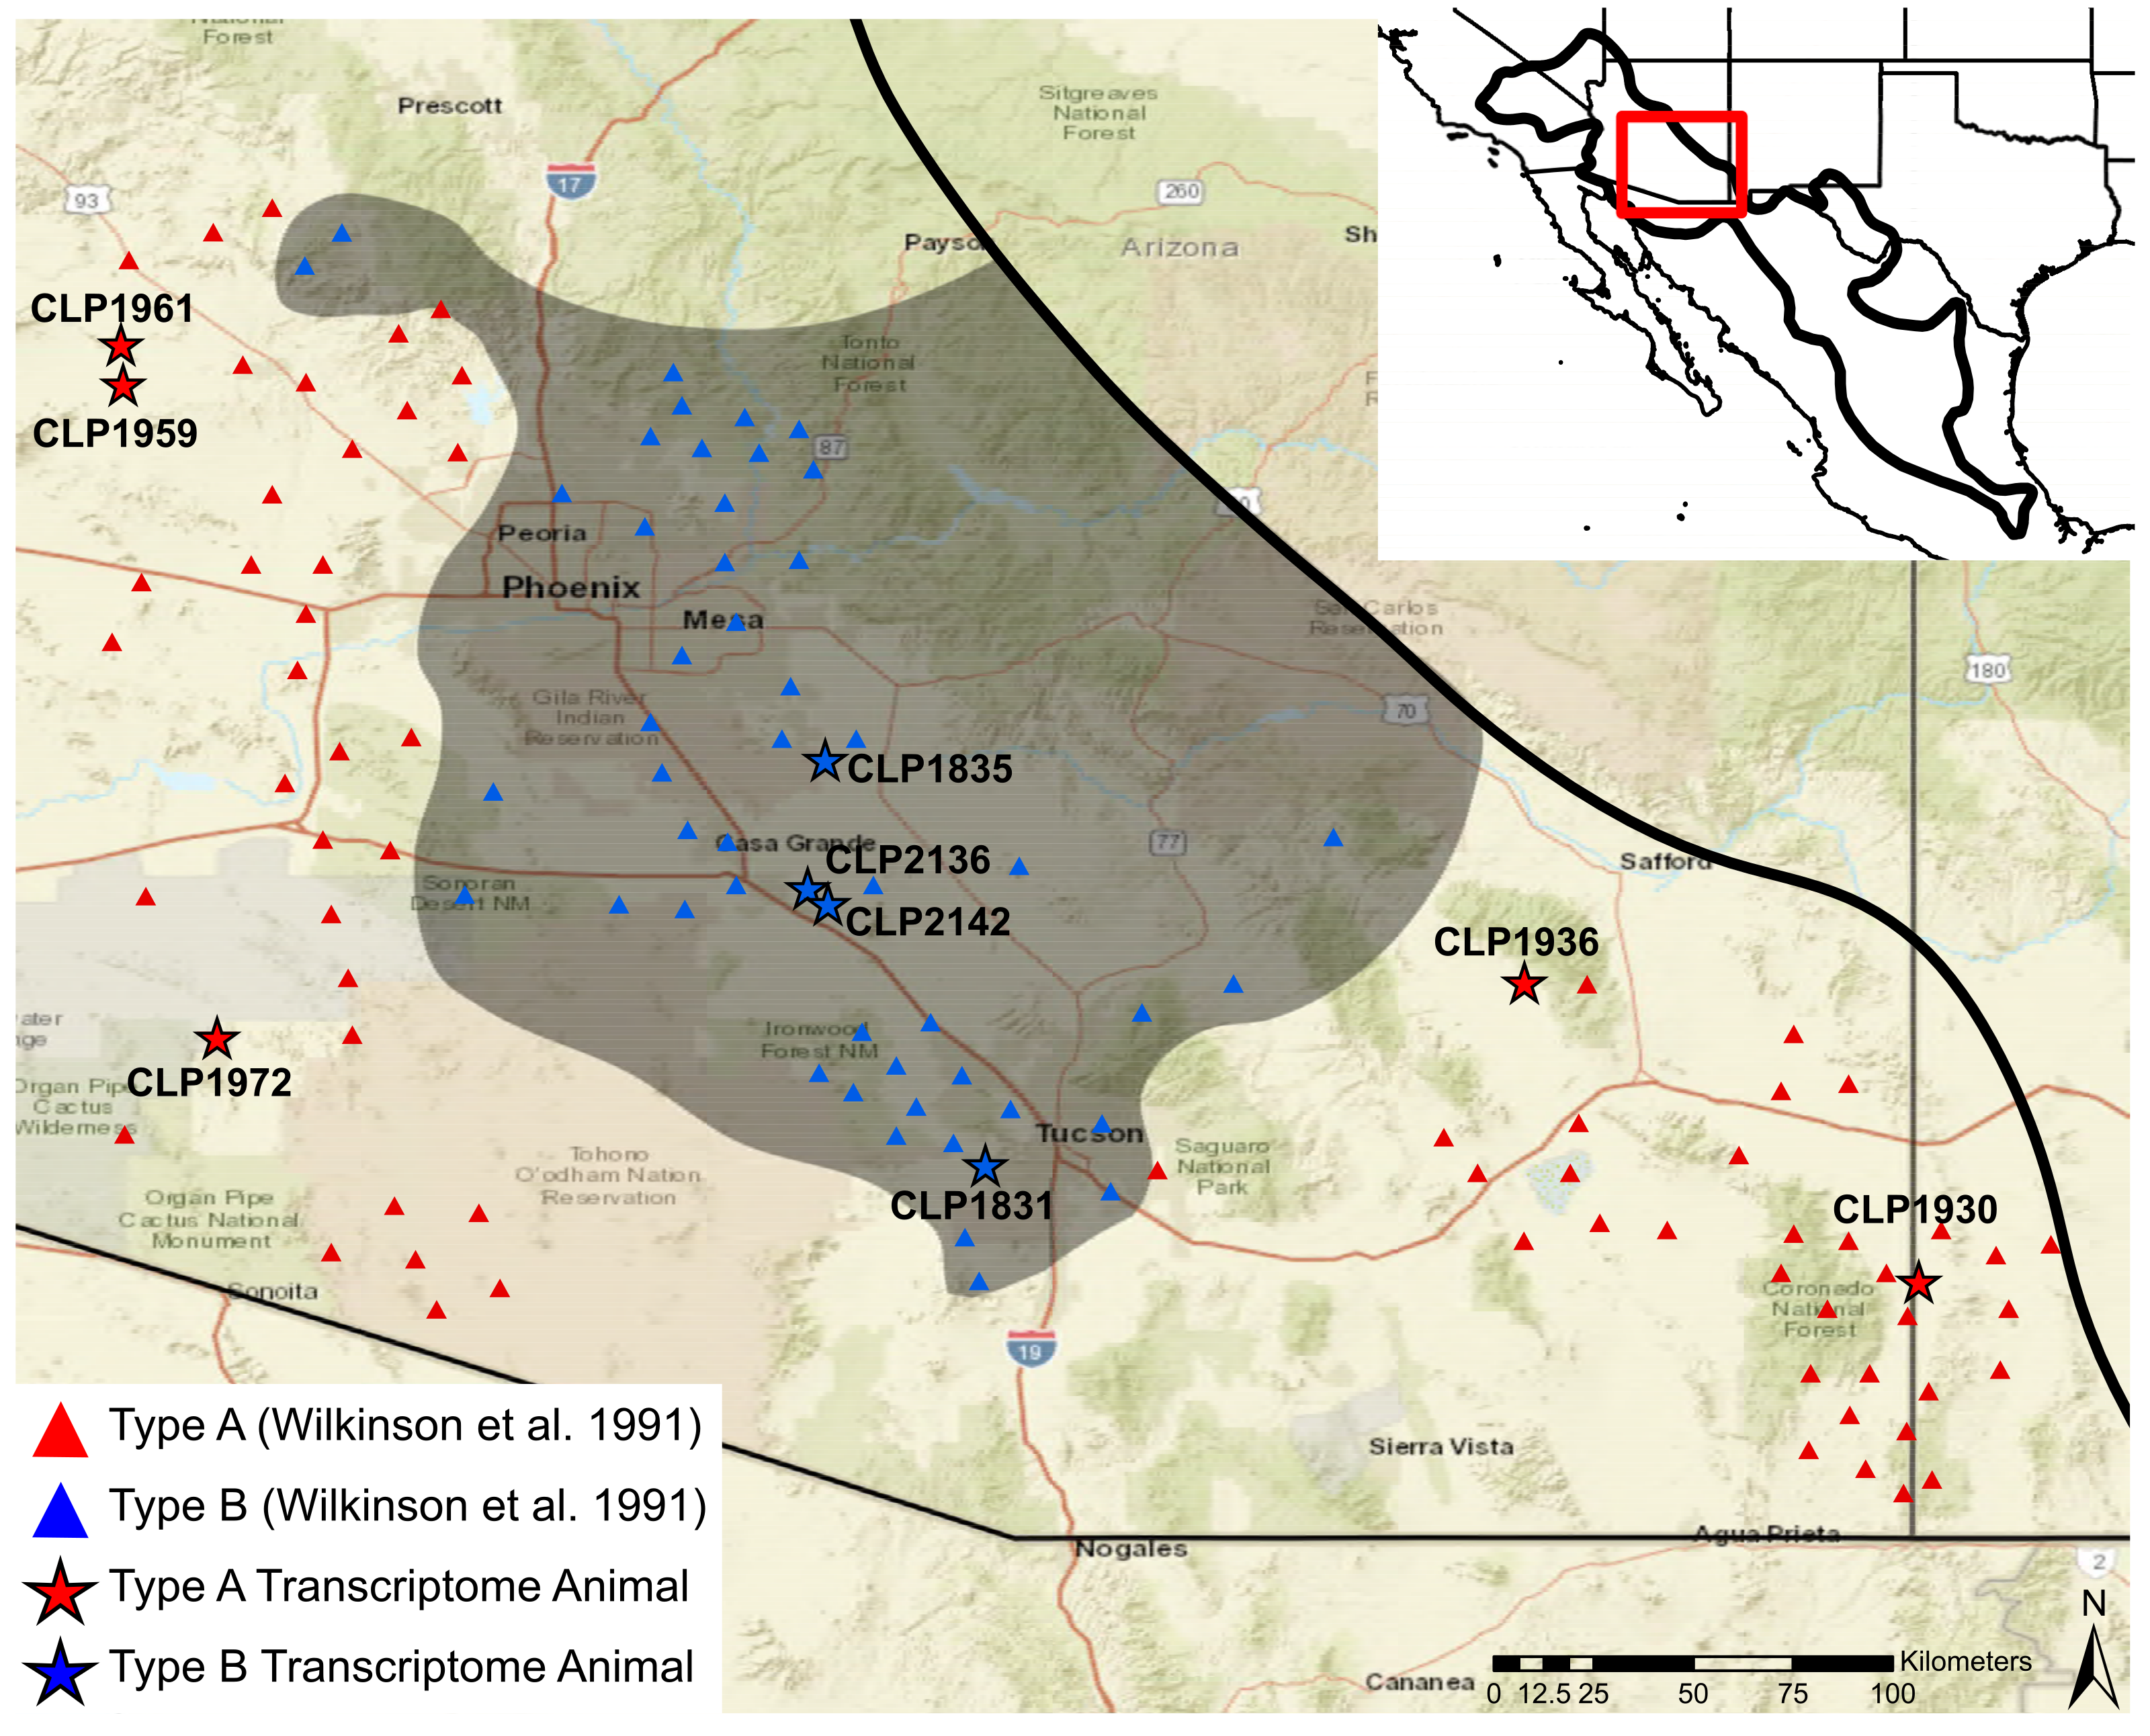
Mojave rattlesnakes (
C. scutulatus) are known to be present from the deserts of the southwestern United States and as far south as the state of Puebla in Mexico (
Figure 1).
Crotalus scutulatus is comprised of three phylogeographic lineages [
34]. The basal lineage includes the subspecies
Crotalus scutulatus salvini, which has Type A venom and is located at the southern end of the distribution [
12,
33]. The remaining two lineages are
Crotalus scutulatus scutulatus distributed in the Chihuahuan Desert and Sonoran/Mojave Deserts (hereafter, Sonoran), respectively [
34]. Both Type A and Type B venoms are found in the latter two lineages, and although rare, snakes possessing a Type A + B phenotype (highly expressing both MTX and SVMPs) have also been documented [
18,
20,
31,
35,
36].
The venom phenotype complexity in
C. scutulatus is best documented within the Sonoran lineage [
37,
38,
39]. Proteomic differences in the venom seem to be geographically fixed, but intergradation occurs where Type A and Type B ranges come into contact [
12,
31,
35,
39,
40]. In addition to the dichotomy between PLA
s and SVMPs, variability in other toxins has been documented [
36,
39]. Particularly, Massey et al. [
39] described variation in myotoxins in one small area of the distribution where some individuals had ∼25% of their proteome made up of myotoxins. This finding prompted them to suggest further dividing venom types within
C. scutulatus into Types A–F to account for variation between PLA
s, SVMPs, and myotoxins, and hypothesize that myotoxins occur when the Type A and Type B phenotypes come into contact [
39]. No phylogeographic structure exists and high gene flow occurs between individuals regardless of venom type within this region based on allozymes [
31], mitochondrial (ND4), and nuclear (RADSeq) data [
34], so genetic recombination at the contact zone is possible.
To examine the role of differential expression in the evolution of venom phenotypes, we used Sonoran Desert Mojave rattlesnakes because they are a microcosm for the diversity found in rattlesnakes. Within the Sonoran lineage, high venom diversity exists and six phenotypes are described [
36,
39] with Type A and Type B venom phenotypes being geographically fixed despite high gene flow [
31,
34]. Moreover, the ancestral lineage within Mojave rattlesnakes,
C. scutulatus salvini, is neurotoxic [
33,
34], as is the hypothesized ancestral rattlesnake [
7]. Thus, mechanisms underlying the presence or absence of Mojave toxin in other rattlesnake species may become more apparent by focusing on
C. scutulatus. Through comparative venom-gland transcriptomics, we link the patterns found genomically and the diversity identified proteomically to test: (1) whether myotoxin expression is localized to contact areas between individuals with Type A and Type B venom; (2) if expression patterns within and between venom phenotypes are consistent among species and individuals; and (3) whether individuals with Type A and Type B venom will express distinct sets of PLA
s as hypothesized by Dowell et al. [
7]. In this pursuit, we present the most extensive transcriptomic sampling to date of
Crotalus scutulatus and the A/B venom dichotomy.
3. Discussion
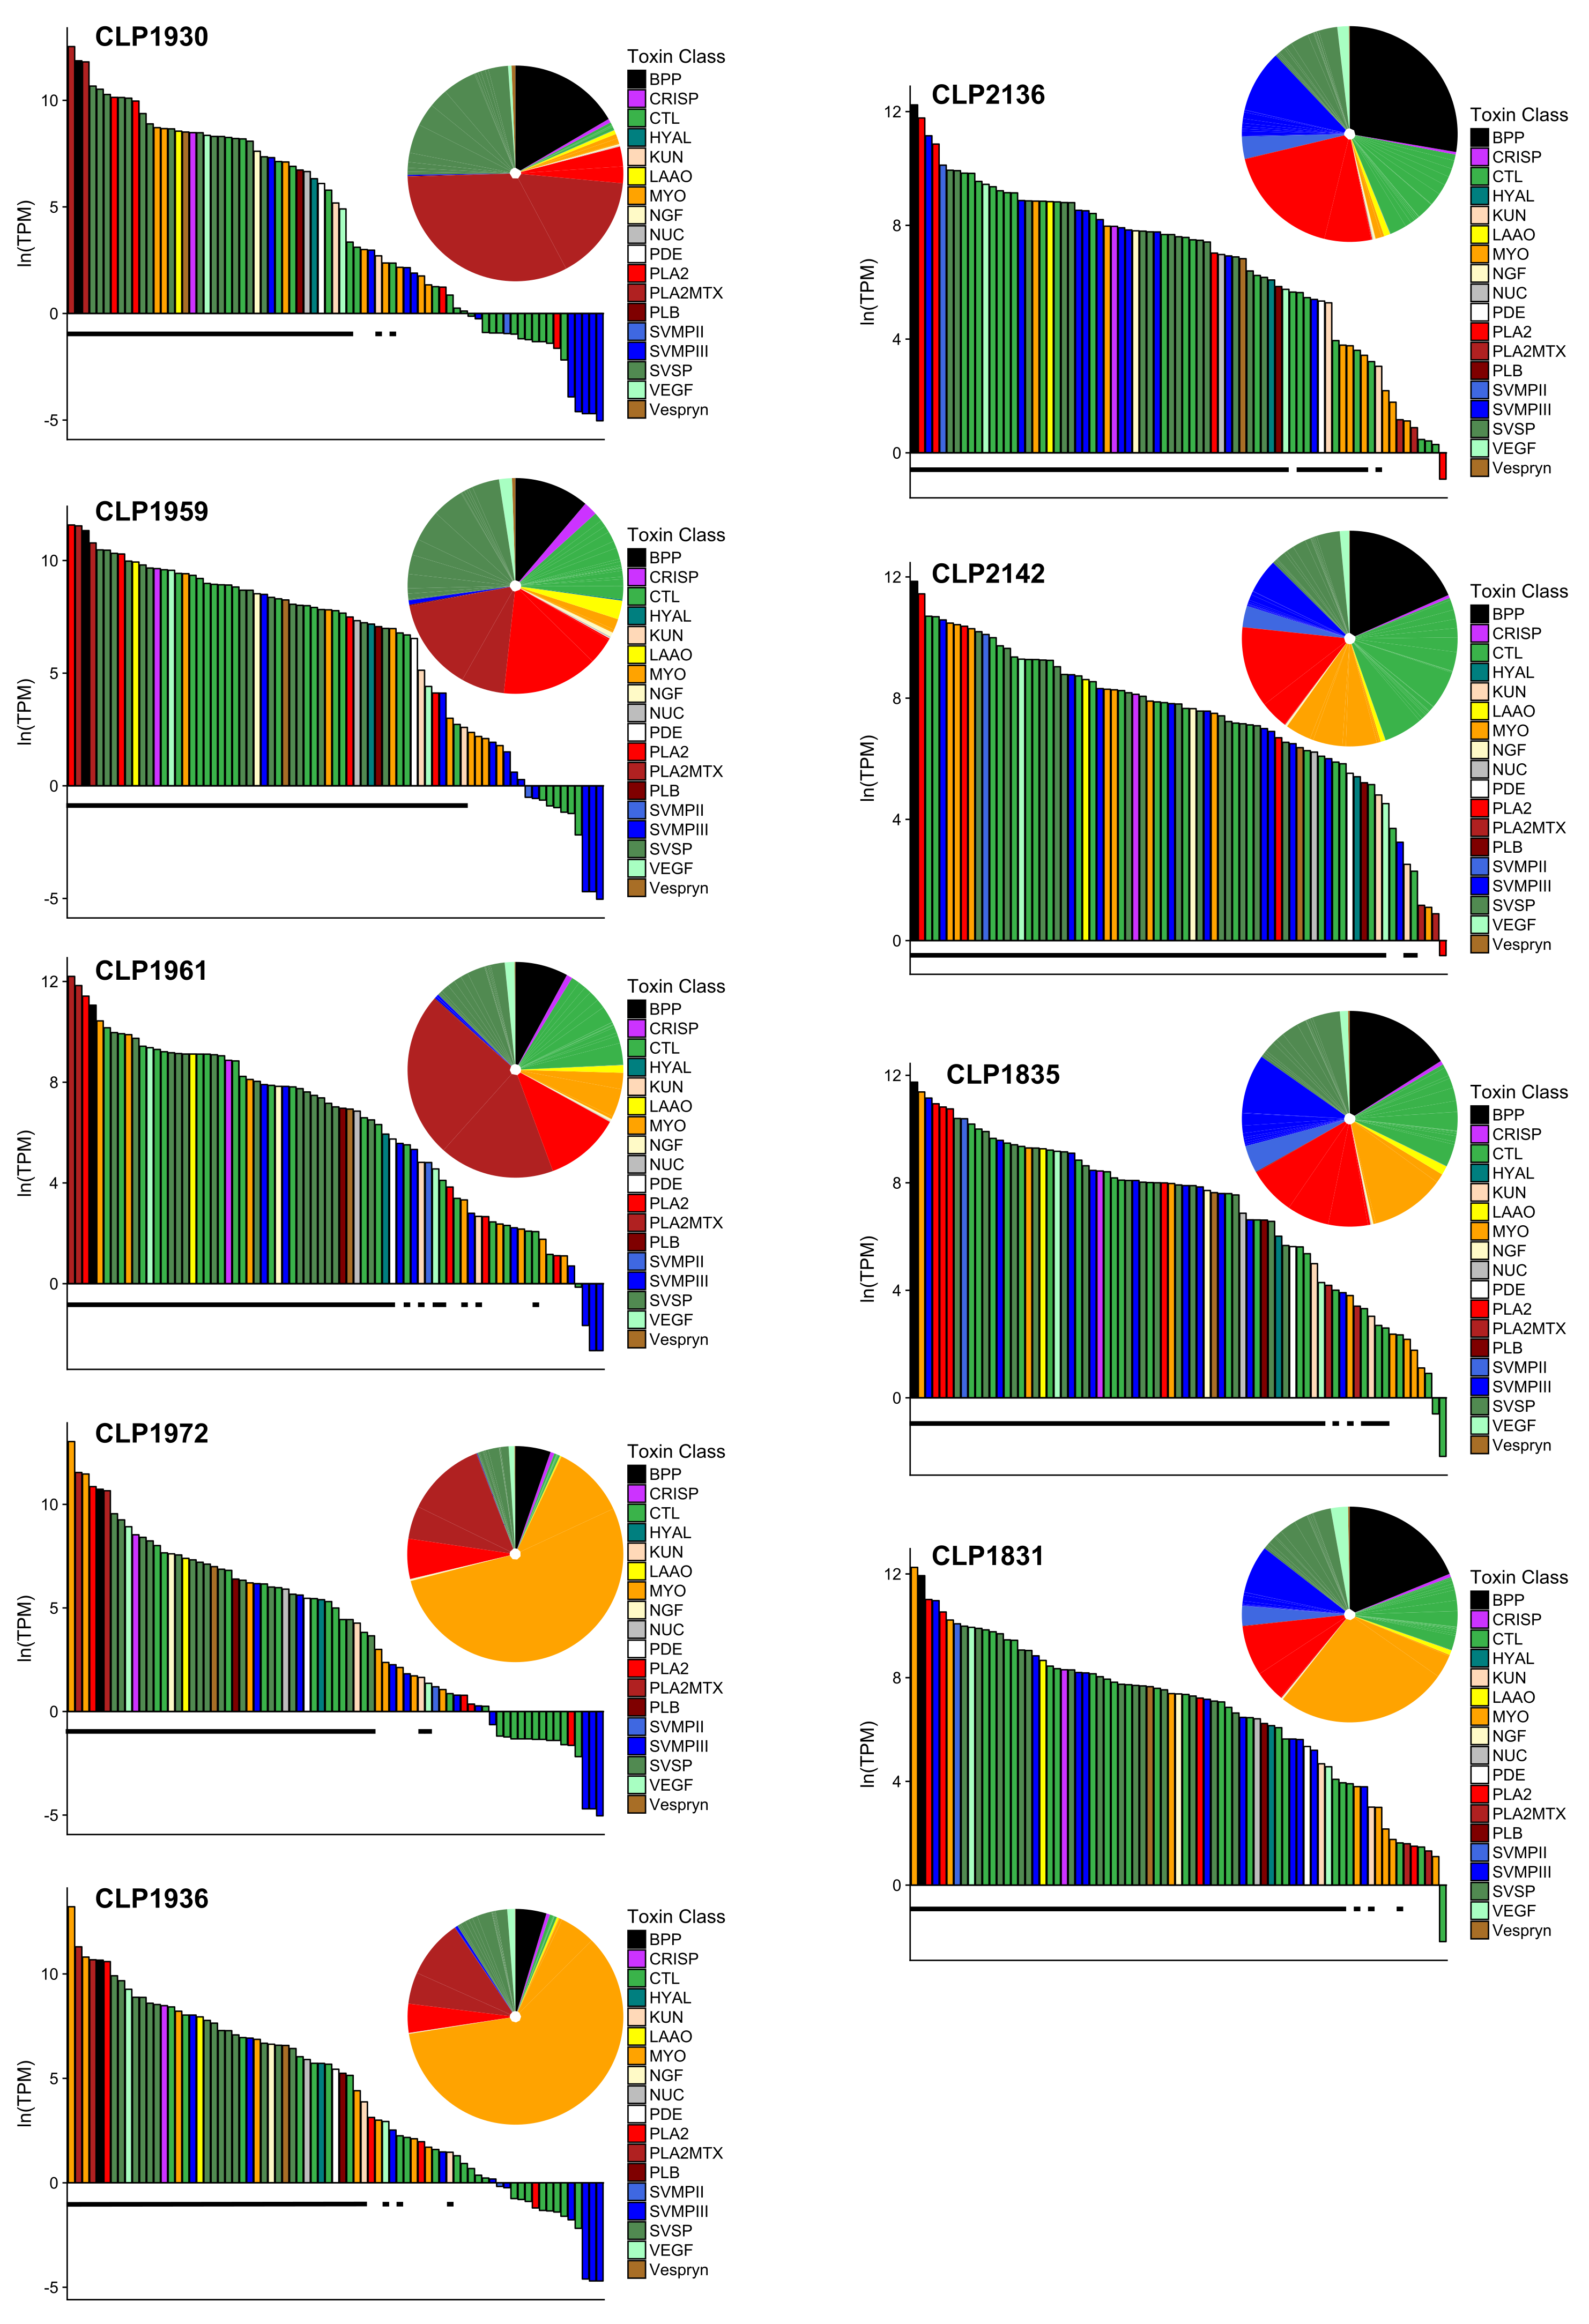
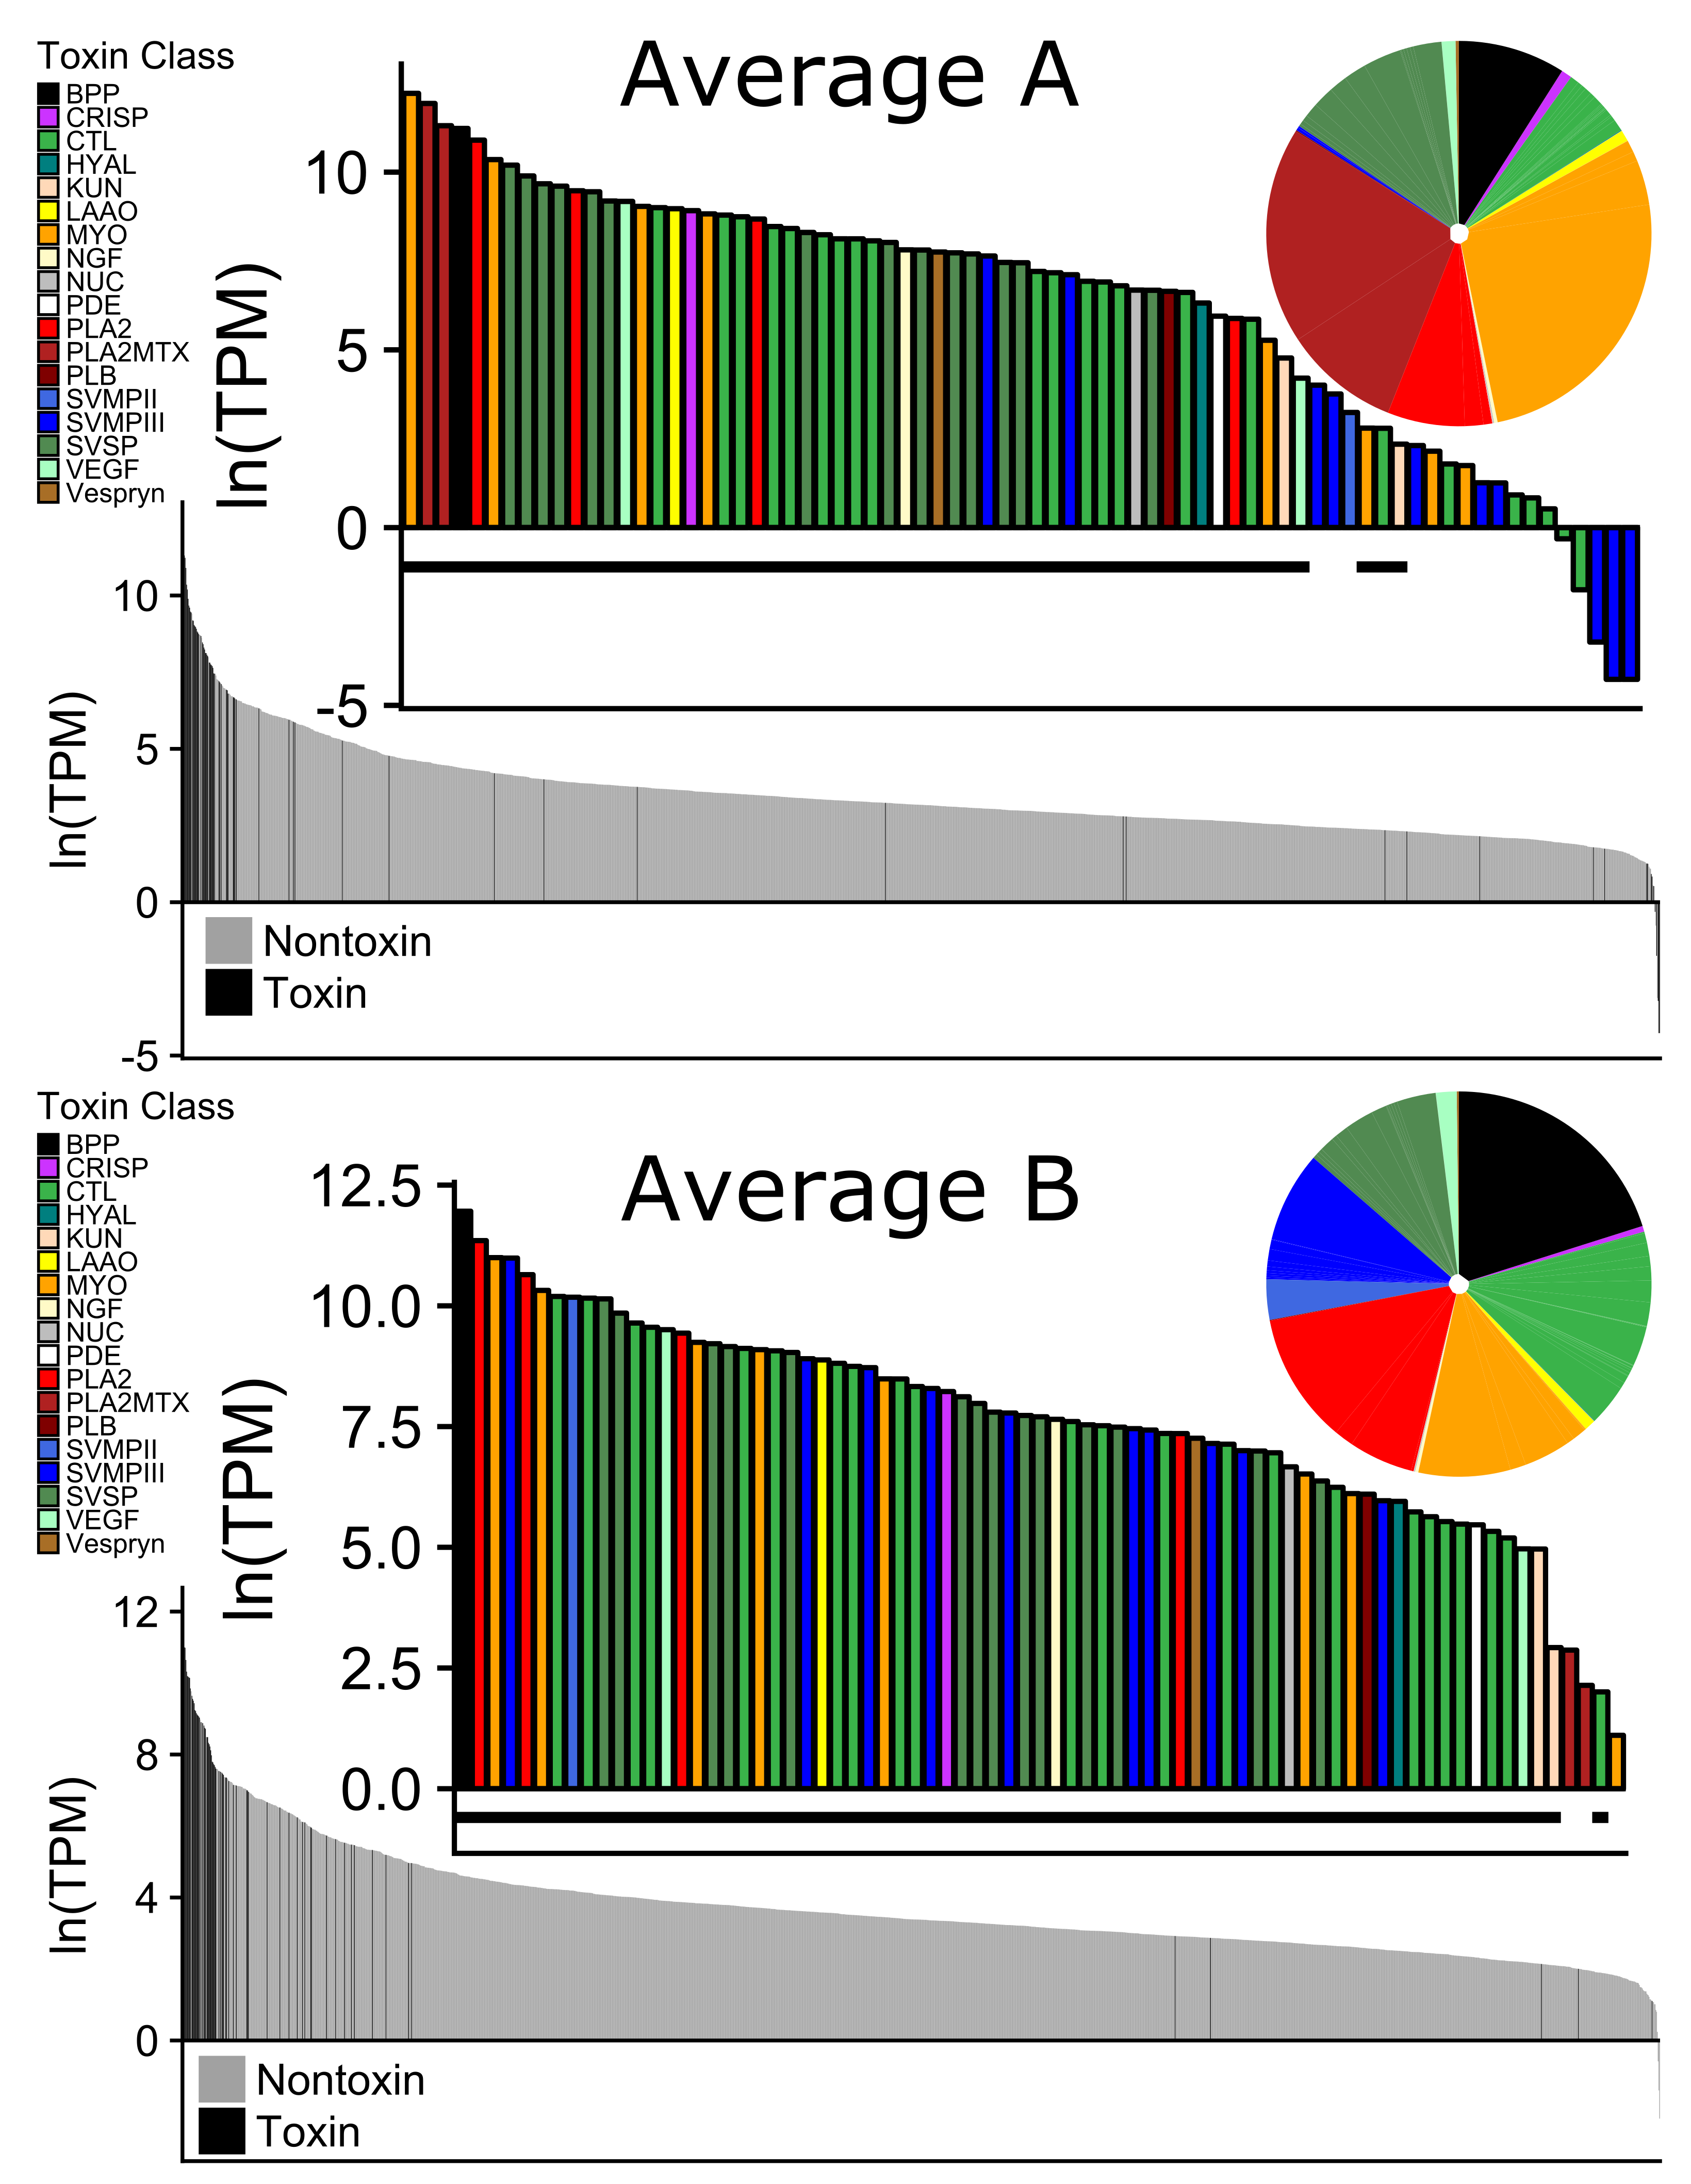
The major differences in the venom gland transcriptome within and between Type A and Type B
C. scutulatus from the Sonoran Desert were driven by the presence or absence of PLA
s including Mojave toxin (MTX), snake venom metalloproteinases (SVMPs), C-type lectins (CTLs), and myotoxins (MYO) (
Figure 3). Myotoxin expression was not associated with the contact zones between the two venom types as hypothesized by Massey et al. [
39]. We did not find evidence for distinct sets of PLA
s for Type A and Type B venom types as hypothesized by Dowell et al. [
7] using three species (two Type B/one Type A). Additionally, one individual expressed all six PLA
s (
Table 5). We also found evidence for a PLA
allele in one
C. scutulatus individual that was more similar to a congener,
C. viridis, than the other eight
C. scutulatus specimens. The allele could have originated from interspecific hybridization with a member of the
C. viridis species complex. Other works have suggested introgression through hybridization as a mechanism for propagating toxin genes among species. For example, It is hypothesized that the
C. horridus MTX homolog, canebrake toxin, was introduced by intergeneric hybridization with
Sistrurus catenatus [
28]. These data, taken together, support non-allelic homologous recombination (NAHR) as an important mechanism driving PLA
diversity in
C. scutulatus venom and rattlesnakes more broadly [
7].
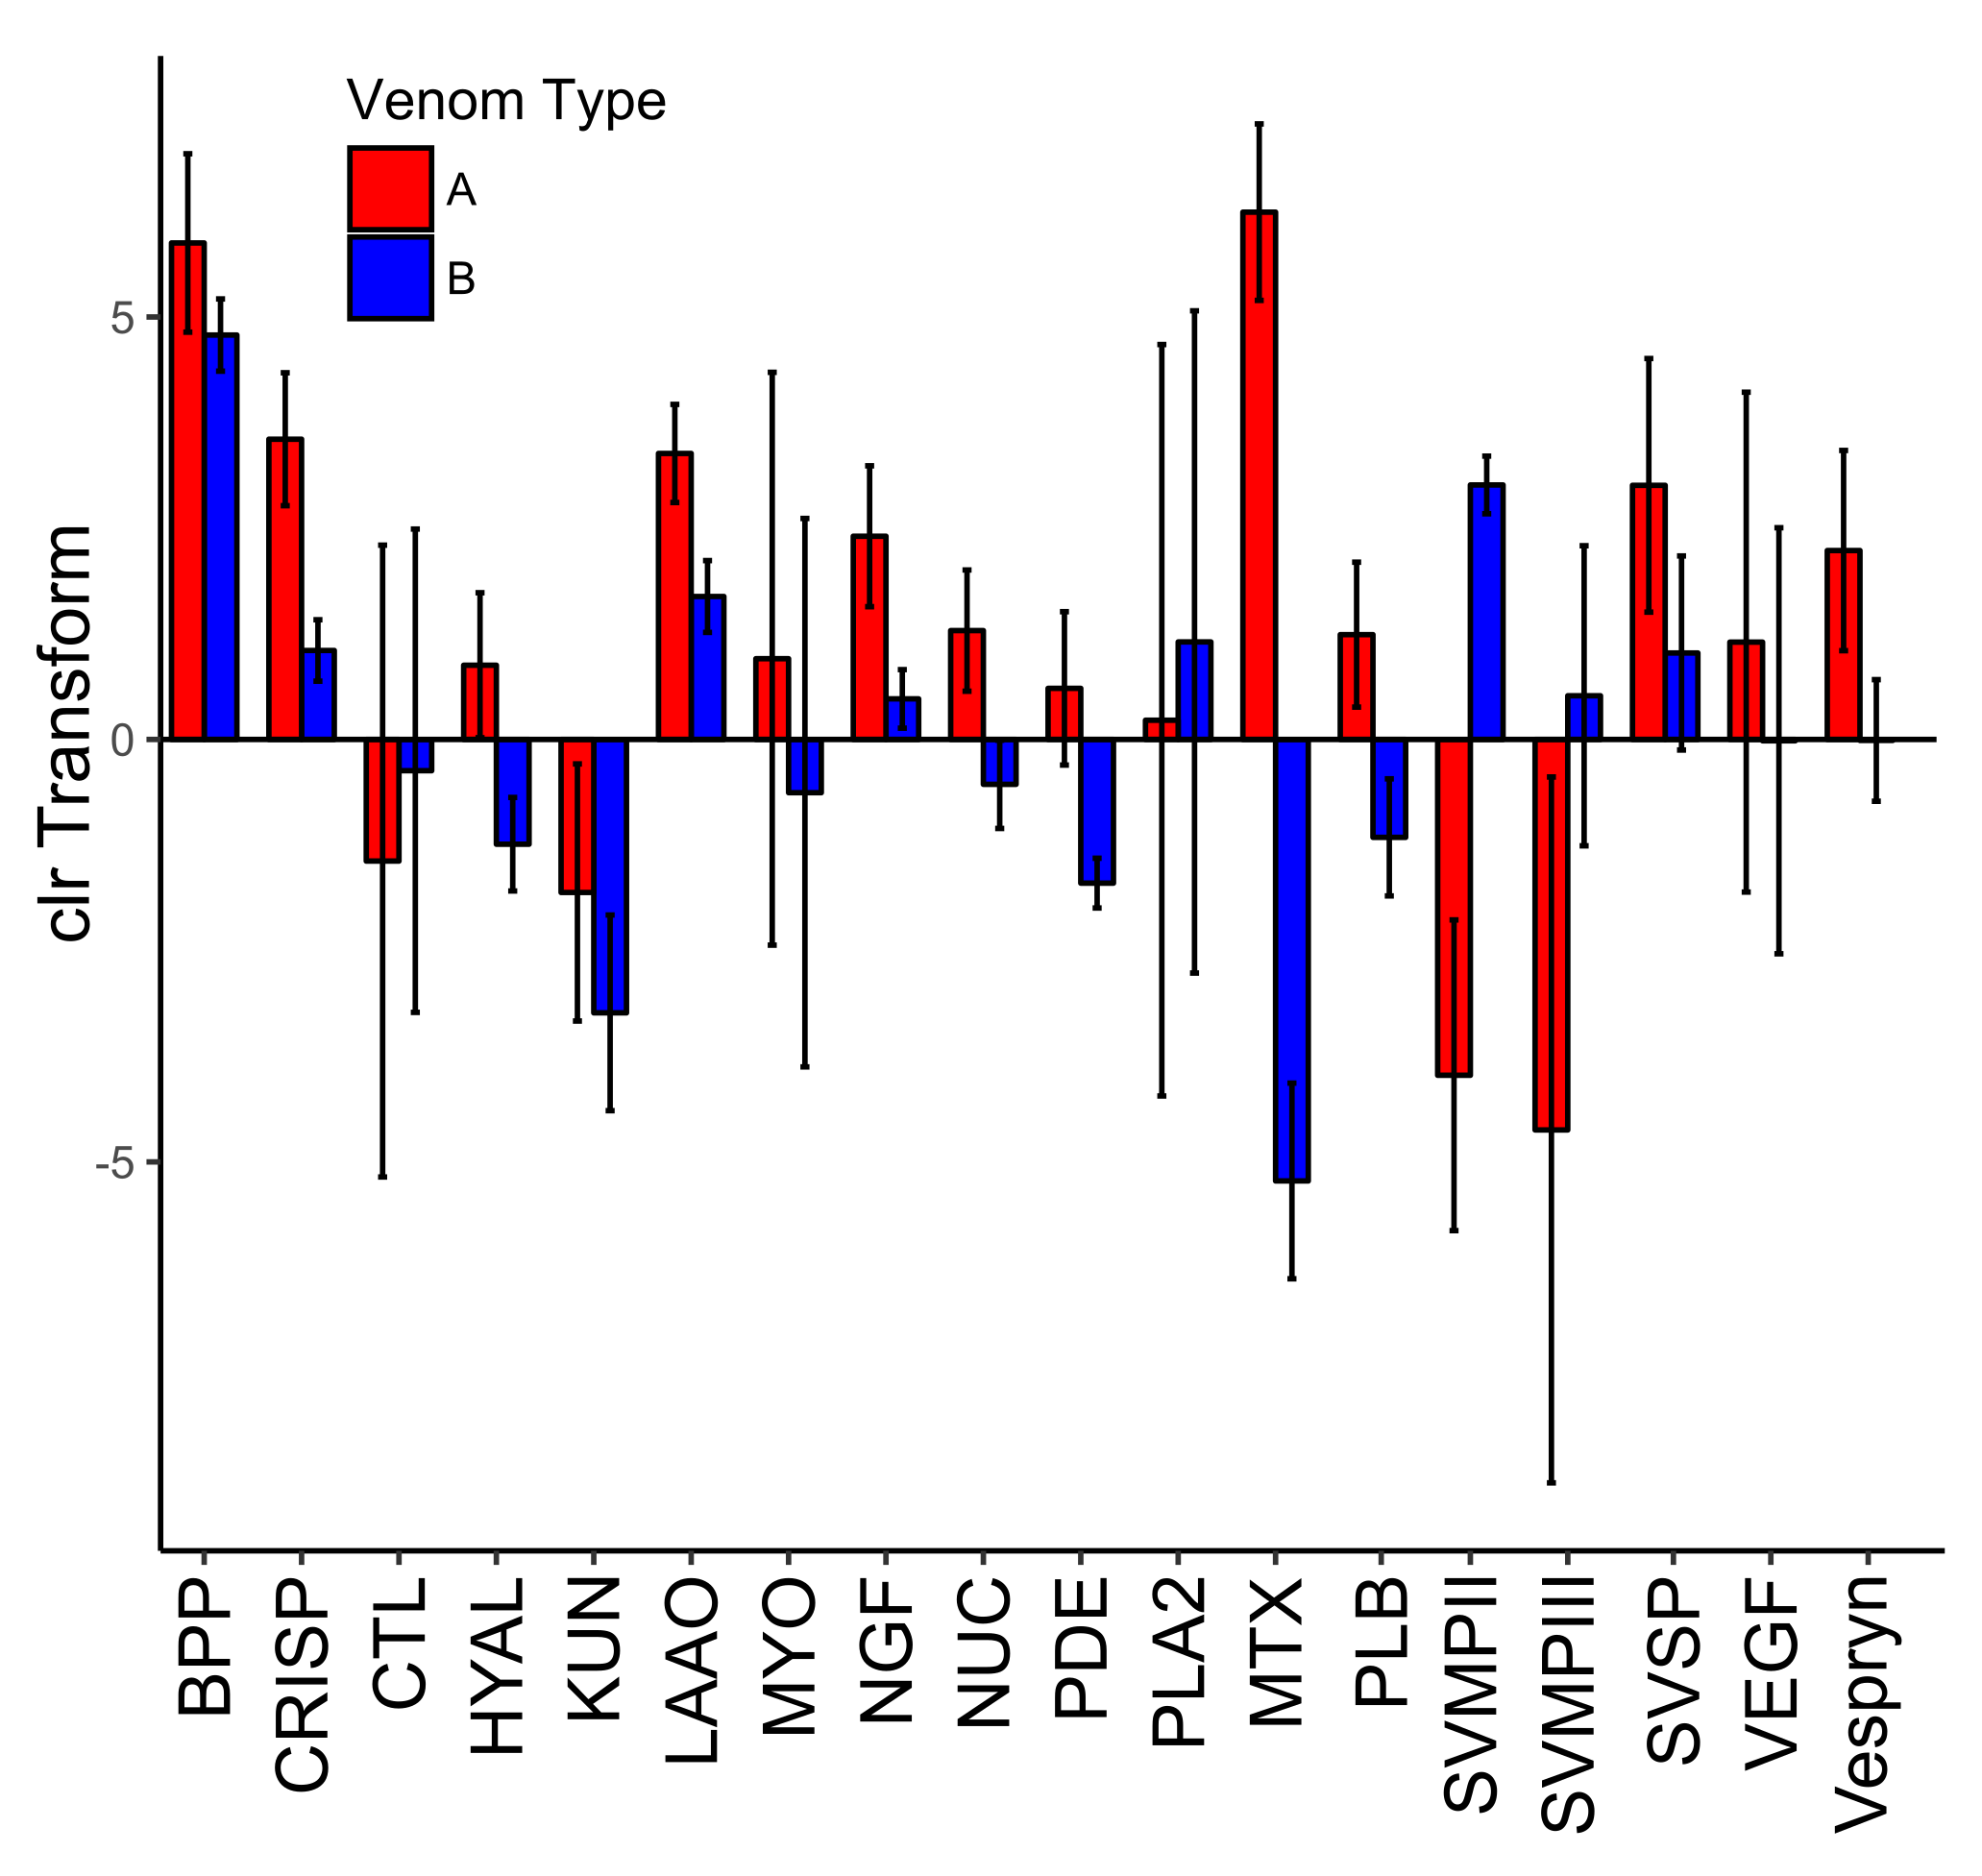
Expression differences between Type A and Type B venom were due to the presence/absence of specific toxins (
Table 4). Type A venoms were simpler in that they contained fewer toxins overall, driven by the lack of SVMP and CTL expression. The presence/absence expression difference between MTX and SVMPs is the characteristic difference between the Type A (neurotoxic) and Type B (hemorrhagic) venom dichotomy seen within rattlesnakes. As expected, both subunits of the neurotoxic PLA
(Mojave toxin) were exclusively found in Type A individuals, and Type B individuals had a high diversity of SVMPs [
43,
44]. All but two SVMPs (SVMPIII-2 and SVMPIII-4) were absent from all Type A individuals which is similar to what was found in the Type A
C. horridus [
28]. SVMPIII-4 was found in all nine individuals and SVMPIII-2 was missing in CLP1930 (
Table 3).
C-type lectins (CTLs) had the highest number of unique toxins within a family, with 23 different toxins (
Table 2). Only two were found in all nine individuals, six were exclusively found in Type B individuals, and the remaining 15 were found in different combinations regardless of venom type (
Table 3). CTLs are diverse in Type B species and affect coagulation factors, increasing hemorrhaging [
27,
45]. Interestingly, two of the Type A individuals, CLP1959 and CLP1961, had high expression of CTLs at 10.2% and 12.4%, respectively where the other three individuals had almost no expression (≤1.0%,
Figure 3). This is the first time that CTLs have been documented to be highly expressed in a Type A individual. In the Type A
C. horridus, CTLs only accounted for 0.2% of the toxin reads [
27].
Massey et al. [
39] documented high intraspecific variability of myotoxin in the proteome of
C. scutulatus, independent of venom type. Because of this, they suggested
C. scutulatus venoms be further divided into six venom types: Type A, Type A + M, Type B, Type B + M, Type A + B, and Type A + B + M. The addition of these myotoxins in the venom decreased the lethal dose 50 (LD
) values and work to disrupt sodium channels in muscle cells causing muscle paralysis [
39,
46]. Our transcriptome data support further differentiating venom types to account for the diversity in myotoxin expression levels. We found differences in myotoxin expression among the nine individuals but they were not associated with the contact zone between the two venom types as predicted. Of the eight myotoxins we identified, one was found exclusively in Type A individuals and two were exclusively found in type B individuals (
Table 3). However, these are likely a function of sampling rather than fixed toxins in those venom types given the variability in myotoxins overall (
Figure 3). When present, the four most highly expressed myotoxins (MYO-1–4) were expressed at similar levels between the venom types (
Figure 6).
Based on the hypothesis of Dowell et al. [
7], we expected to find distinct sets of PLA
s in Type A and Type B
C. scutulatus, as was found in
C. horridus [
28] and the three species with genomic fragments sequenced [
7]. However, this was not the case and we found almost all possible combinations of the six putative PLA
toxins among the nine individuals we sequenced (
Table 5). Other than the acidic and basic subunits of MTX which were exclusively found in Type A individuals, the remaining four PLA
s were not specific to a venom type (
Table 5). Further genomic analysis is needed to determine why the two subunits of MTX appear to be consistently found together whereas the other four can be inherited in different combinations. Additionally, it is possible for homologs of MTX, like crotoxin, to be present in the genome and not be expressed as
Crotalus simus undergoes an ontogenetic shift where crotoxin is expressed in juveniles, but not expressed in adults [
47].
One individual, CLP1959, expressed all six PLA
s including the acidic subunit of Mojave toxin (MTXA) and the basic unit of Mojave toxin (MTXB) and the PLA
s associated with Type B individuals, although one, Pla2gA1, was expressed at a significantly lower level than the other individuals that expressed it. That same toxin, Pla2gA1, in CLP1835 was 100% identical to a known allele found in
C. viridis. All eight nucleotide changes from the other
C. scutulatus that expressed it were non-synonymous, thus changing the amino acid sequence. The
C. viridis species complex is sister to
C. scutulatus so this could be a shared ancestral allele or introduced through hybridization. Hybridization between
C. scutulatus and
C. viridis has been documented but they are not syntopic in this region [
19]. However,
Crotalus cerberus, a member of the
C. viridis species complex, is co-distributed with
C. scutulatus in this region and could be the origin of this allele if it is shared within the complex.
Using two Type B species (
Crotalus atrox and
C. adamanteus) and one Type A individual (
C. scutulatus from the Chihuahuan phylogeographic lineage), Dowell et al. [
7] predicted that the region in the genome that contains the PLA
genes is prone to NAHR and hypothesized that there would likely be diversity within a species as we document in
C. scutulatus. If NAHR is the mechanism for gene movement, then it might explain how the different PLA
genes, particularly MTX, can be reintroduced into populations that lose it through hybridization as hypothesized by Rokyta et al. [
28] for
C. horridus.
C. scutulatus is known to hybridize with other species of rattlesnakes and, when this occurs, MTX can be found in the resulting hybrids [
19]. Dowell et al. [
7] agree with Lynch [
48] in that PLA
s could go through a selective sieve after an ecological shift such as changing diet which causes the loss of the less adaptive PLA
s. This mechanism presumes SVMPs are down regulated or lost when MTX is present, but it could be the opposite. Alternatively, the two phenotypes may represent two fitness optima that can be maintained spatially or certain venom components could be selected for or against in specific environments based on different prey availability. Regardless of the mechanism, the interplay between gene flow and selection in the Sonoran Desert is allowing individuals with the two venom types to persist spatially without an obvious ecological difference between venom phenotypes.
The 13 remaining toxin families did not show the same pattern of presence/absence and all 27 toxins were present in each transcriptome at varying levels (
Table 3 and
Figure 4). Though snake venom serine proteinases (SVSPs) were the second most diverse toxin family, there were no differences in expression of the toxins between venom types. This is similar to what was found in
C. horridus (see
Figure 4 in Rokyta et al. [
28]). There was one BPP and it was among the most highly expressed proteins in the venom of all individuals and had low variability among individuals (
Figure 5). Other than KUN and VEGF, the remaining families (CRISP, LAAO, NGF, NUC, PDE, PLB, and Vespryn) also had low variability among individuals (
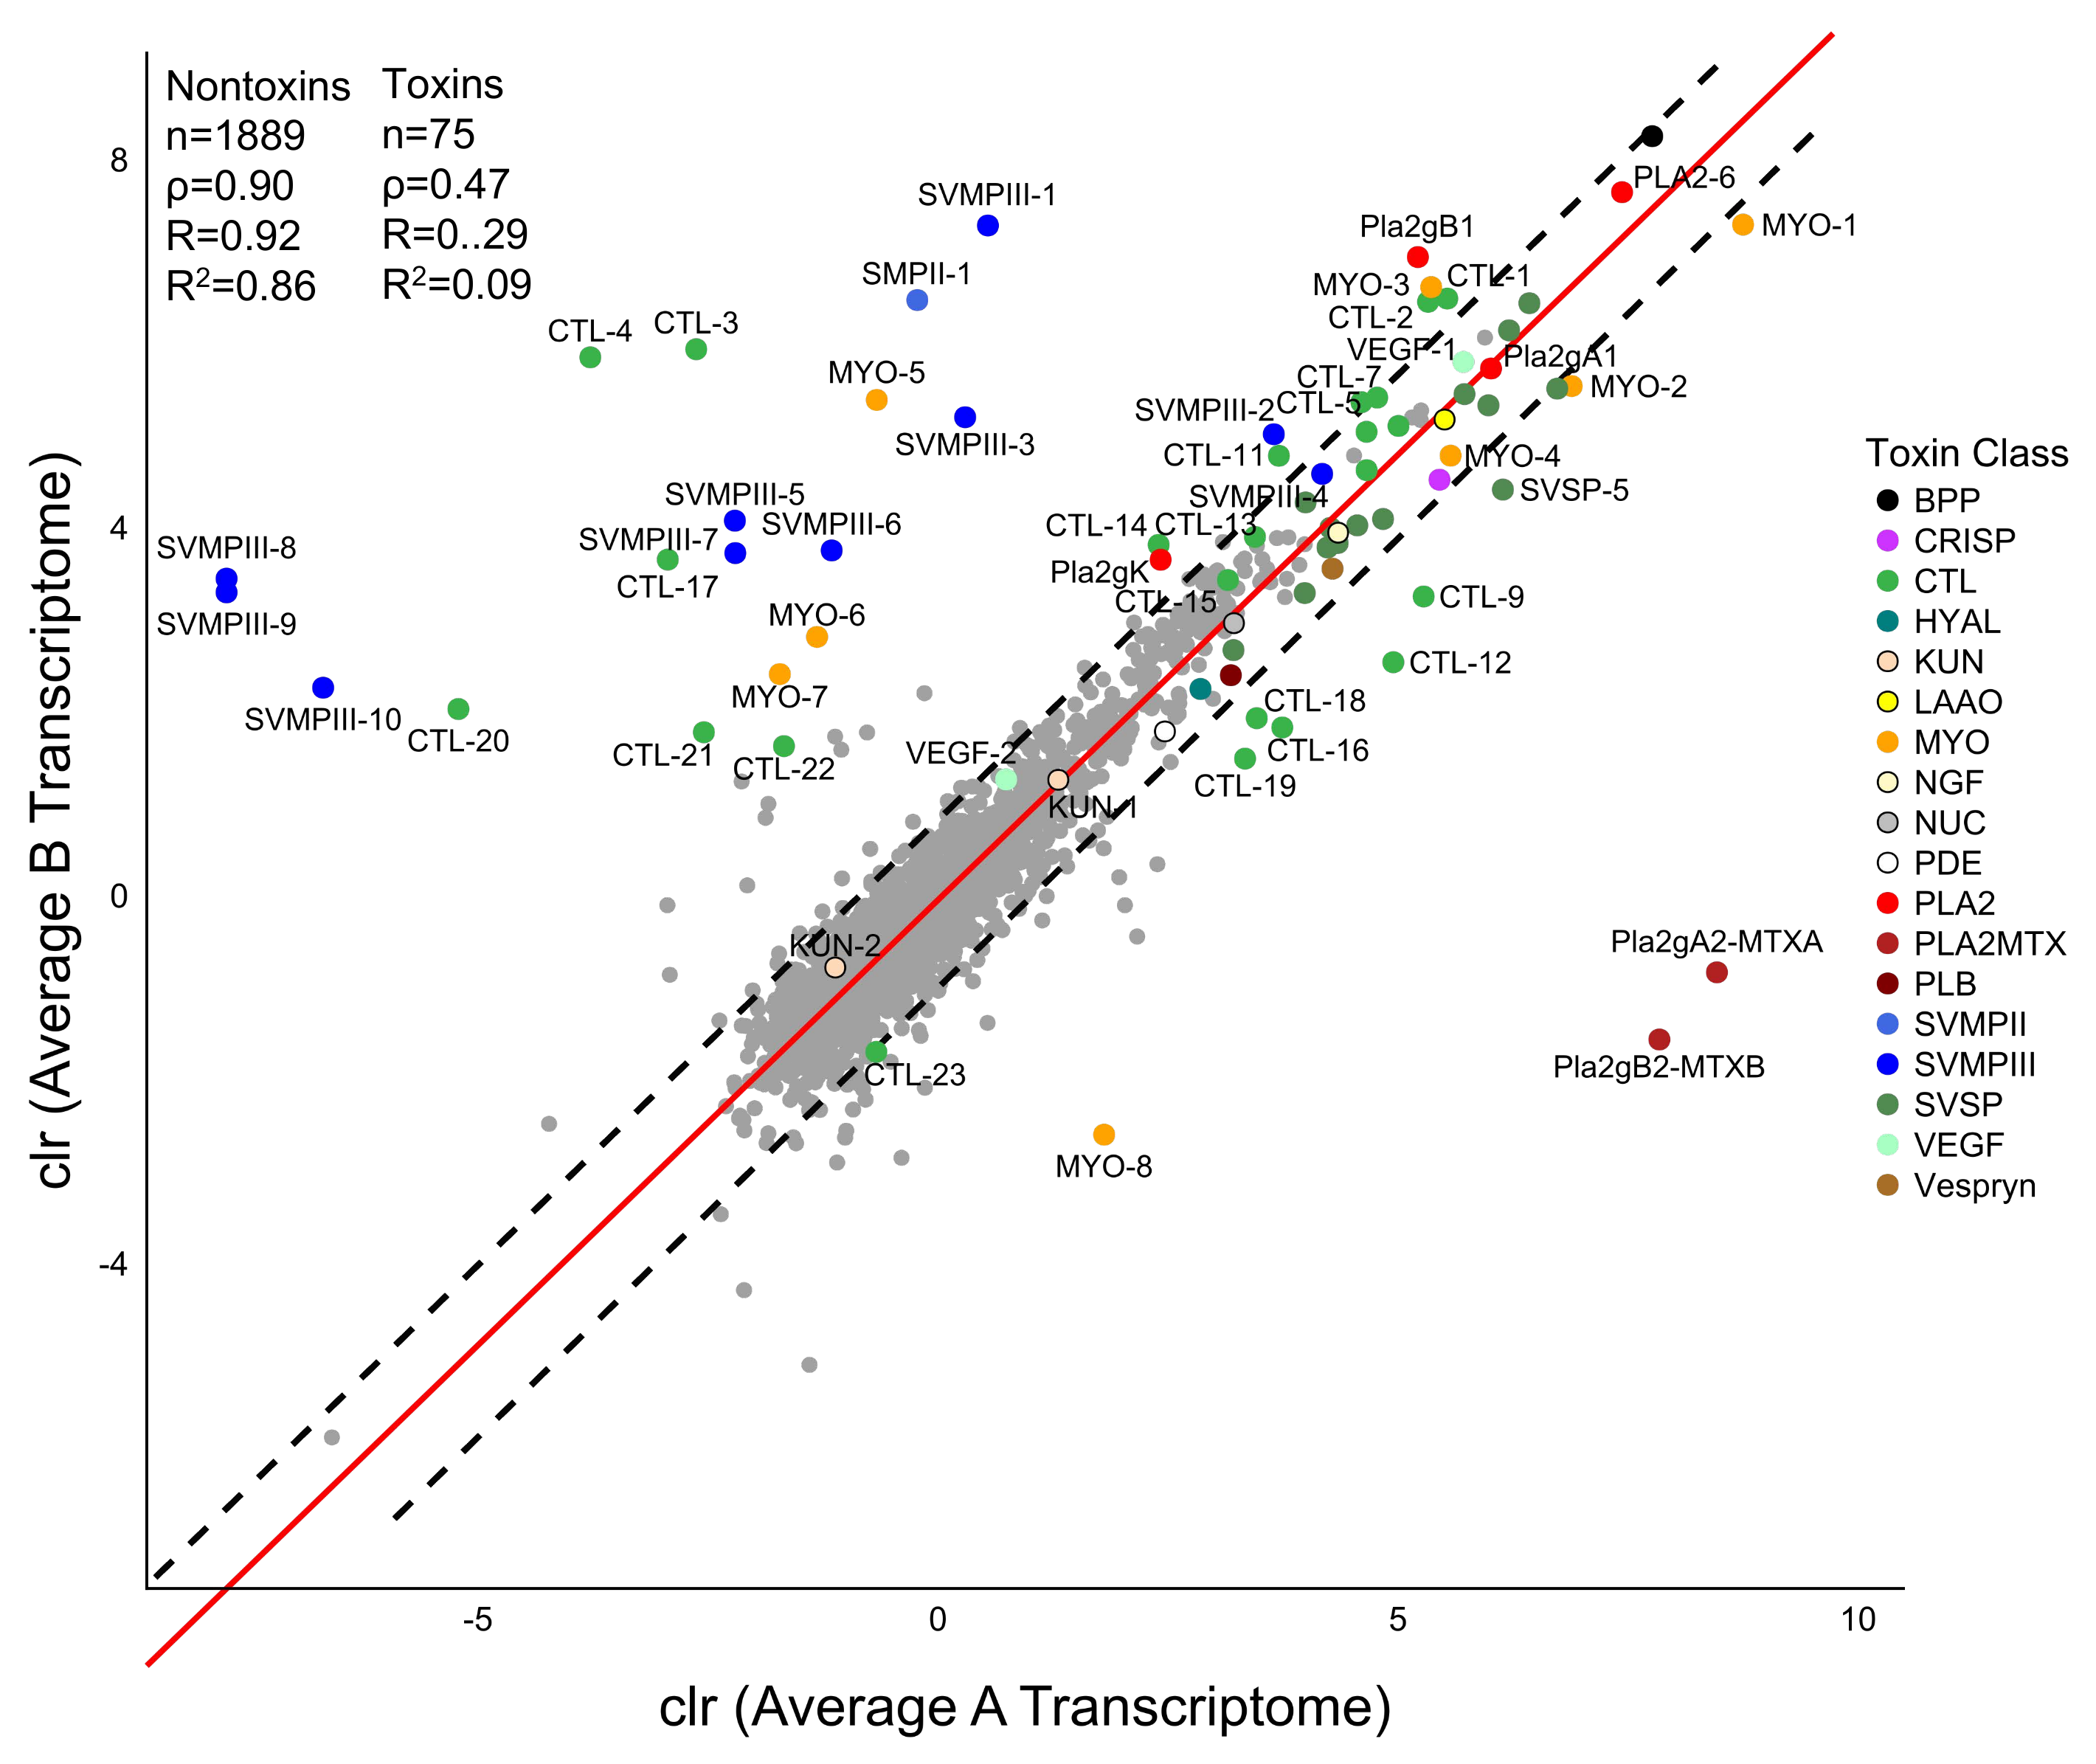
Figure 5). We did not find any expression differences associated with the size or sex of
C. scutulatus. Nontoxin expression was strongly correlated between the two venom types (
Figure 4).
Mojave rattlesnakes are representative of the diversity documented in other rattlesnakes and our work illustrates the utility of sequencing multiple individuals of a species to represent the phenotypic diversity found. Both CTL and MYO diversity would have been underestimated within venom types if multiple individuals were not included (
Figure 3). Overall, the transcriptomic differences in
C. scutulatus matched the patterns documented between
C. adamanteus and
C. horridus [
27] and that between Type A and Type B
C. horridus. This included some individuals that had high levels of myotoxins as in
C. adamanteus [
49]. However,
C. scutulatus was different in that myotoxin expression was much higher and there were no distinct sets of PLA
s between venom types as exhibited by the polymorphic
C. horridus.
Crotalus scutulatus will continue to be an exemplary model system to understand the evolution of venom particularly when the remaining phylogeographic lineages are included as well as the Type A + B individuals. Additionally, given the diversity in presence/absence of toxins within the major families,
C. scutulatus would be useful to test NAHR in other toxin families.


