Dietary Sources of High Sodium Intake in Turkey: SALTURK II

Abstract
:1. Introduction
2. Materials and Methods
2.1. Sample Size
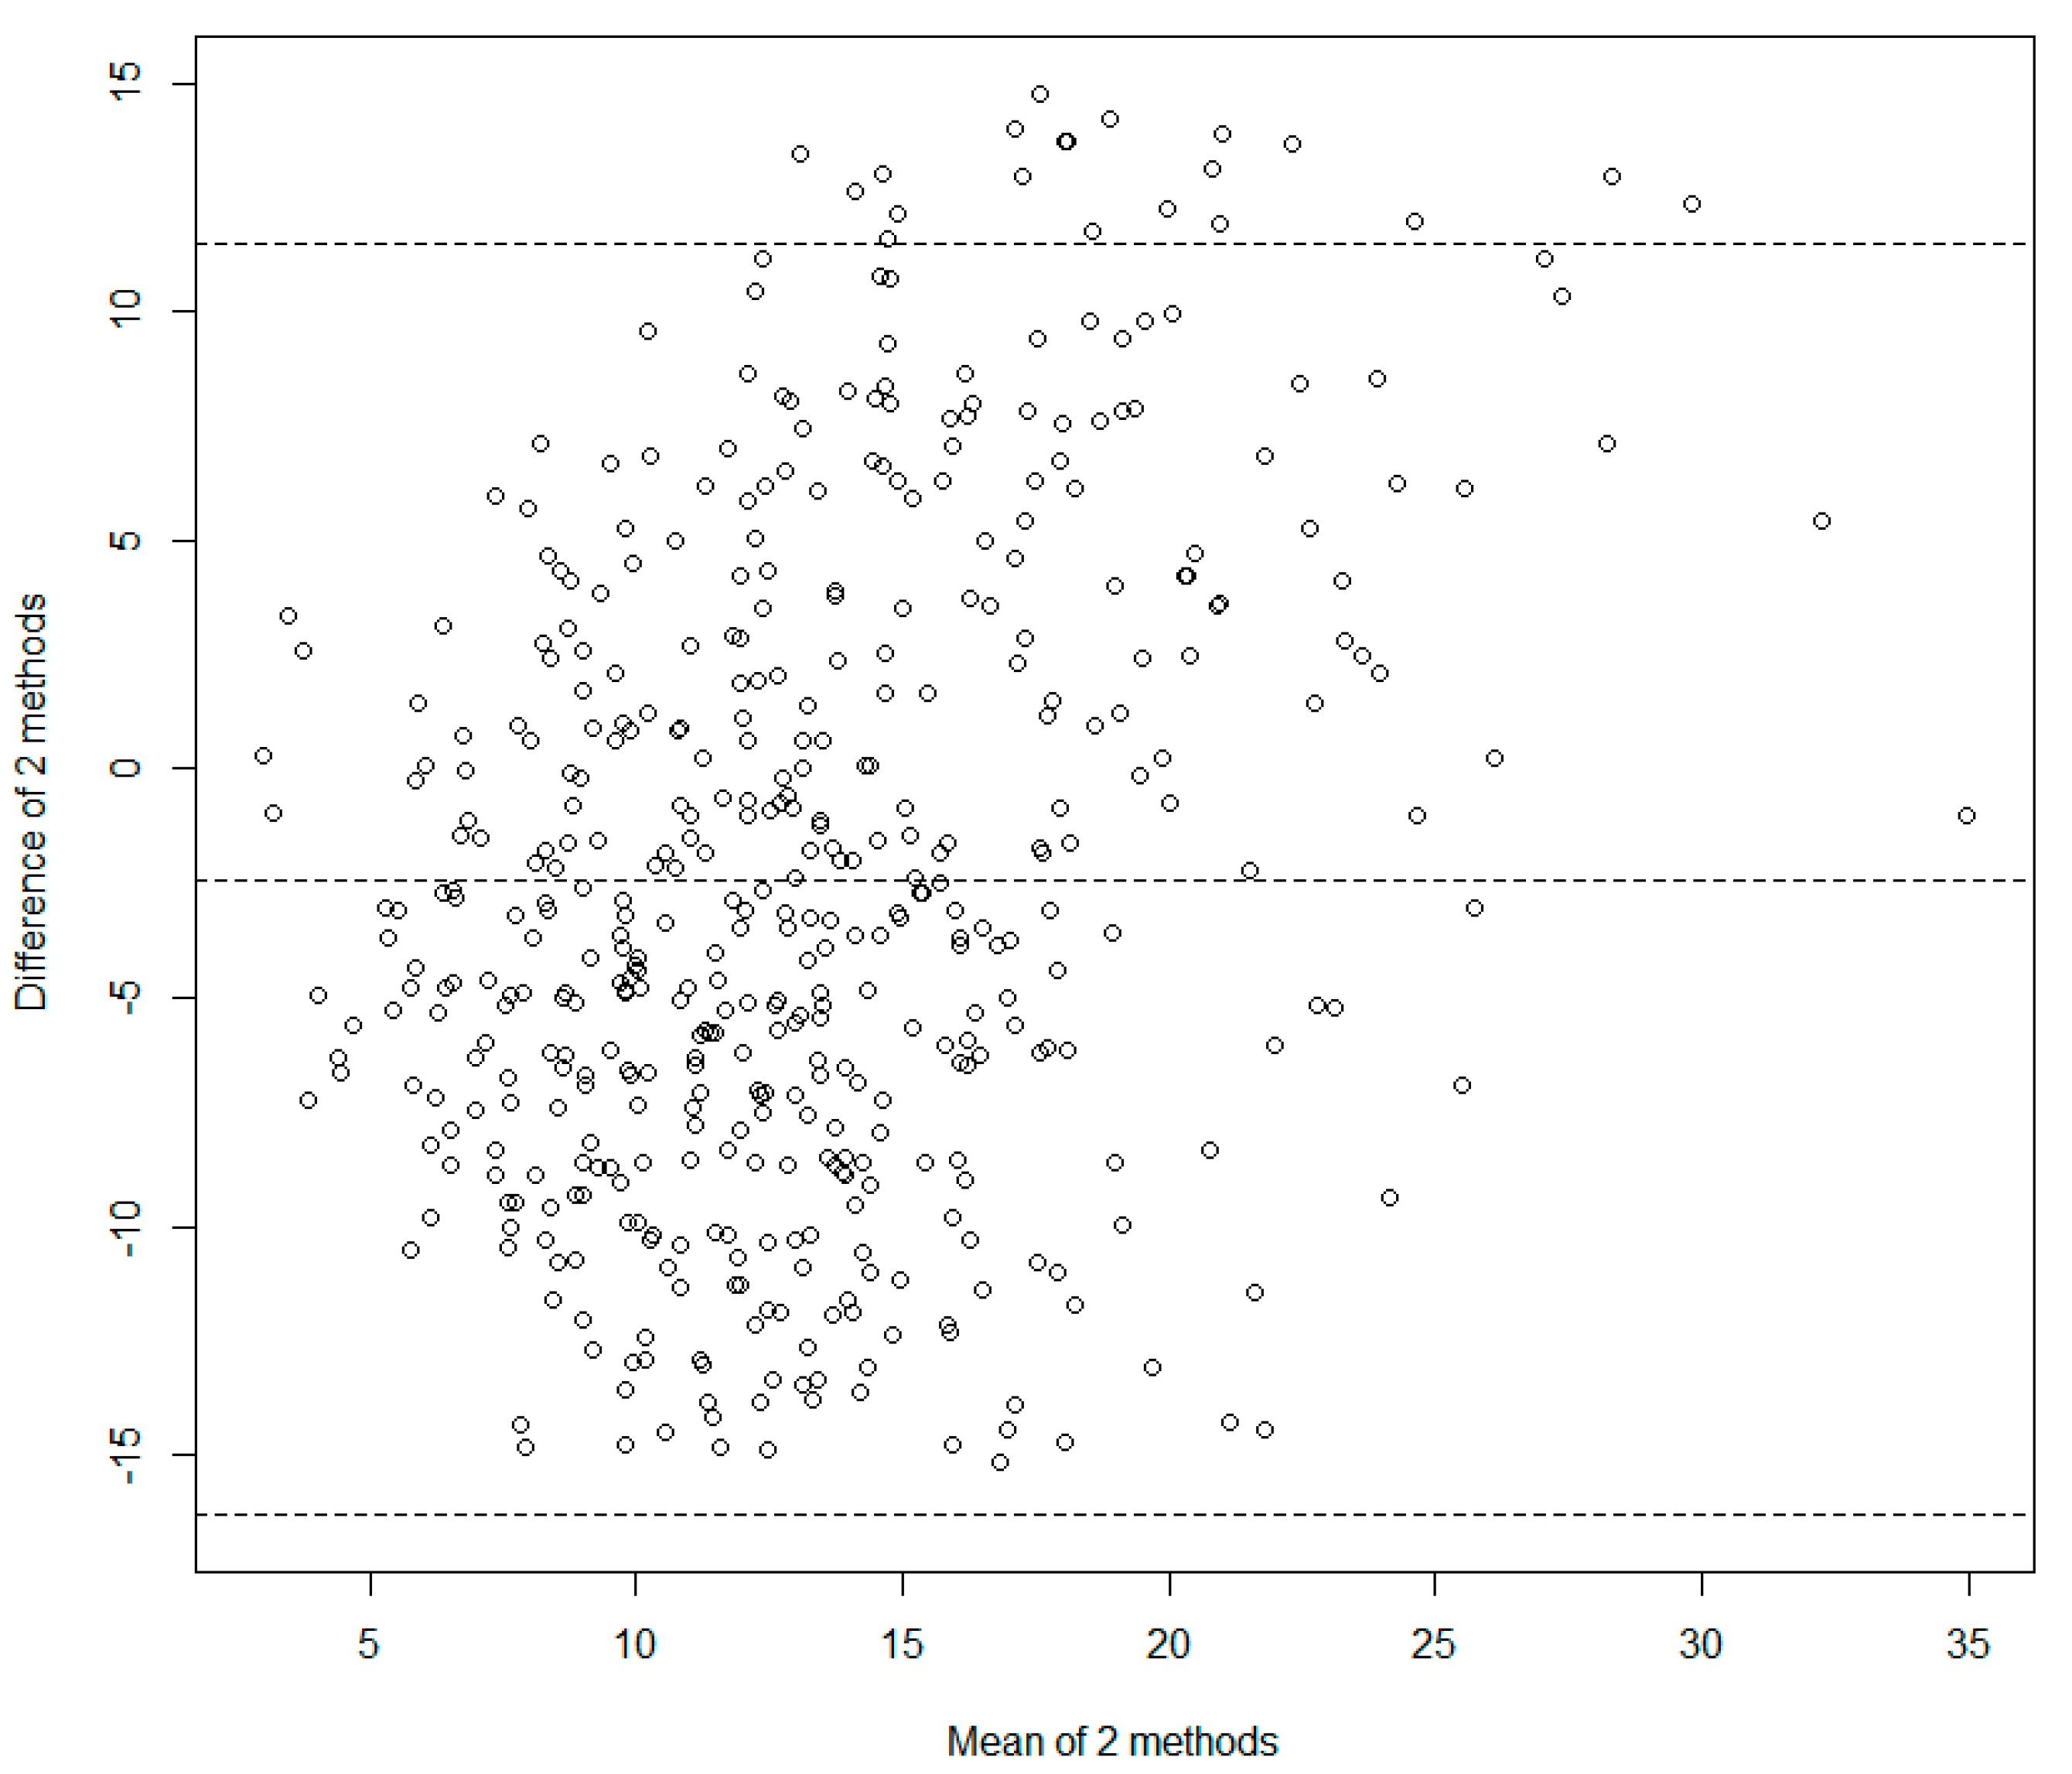
2.2. Statistical Analysis
3. Results
4. Discussion
5. Conclusions
Acknowledgments
Author Contributions
Conflicts of Interest
References
- Altun, B.; Arici, M. Salt and blood pressure: Time to challenge. Cardiology 2006, 105, 9–16. [Google Scholar] [CrossRef] [PubMed]
- World Health Organization. WHO Guideline: Sodium Intakes for Adults and Children; WHO Press: Geneva, Switzerland, 2012. [Google Scholar]
- Chen, J.; Gu, D.; Huang, J.; Rao, D.C.; Jaquish, C.E.; Hixson, J.E.; Chen, C.S.; Chen, J.; Lu, F.; Hu, D.; et al. Metabolic syndrome and salt sensitivity of blood pressure in non-diabetic people in China: A dietary intervention study. Lancet 2009, 373, 829–835. [Google Scholar] [CrossRef]
- Polonia, J.; Martins, L.; Pinto, F.; Nazare, J. Prevalence, awareness, treatment and control of hypertension and salt intake in Portugal: Changes over a decade. The PHYSA study. J. Hypertens. 2014, 32, 1211–1221. [Google Scholar] [CrossRef] [PubMed]
- Brown, I.J.; Tzoulaki, I.; Candeias, V.; Elliott, P. Salt intakes around the world: Implications for public health. Int. J. Epidemiol. 2009, 38, 791–813. [Google Scholar] [CrossRef] [PubMed]
- Martikainen, J.A.; Soini, E.J.; Laaksonen, D.E.; Niskanen, L. Health economic consequences of reducing salt intake and replacing saturated fat with polyunsaturated fat in the adult Finnish population: Estimates based on the FINRISK and FINDIET studies. Eur. J. Clin. Nutr. 2011, 65, 1148–1155. [Google Scholar] [CrossRef] [PubMed]
- Tuomilehto, J.; Jousilahti, P.; Rastenyte, D.; Moltchanov, V.; Tanskanen, A.; Pietinen, P.; Nissinen, A. Urinary sodium excretion and cardiovascular mortality in Finland: A prospective study. Lancet 2001, 357, 848–851. [Google Scholar] [CrossRef]
- He, F.J.; Pombo-Rodrigues, S.; Macgregor, G.A. Salt reduction in England from 2003 to 2011: Its relationship to blood pressure, stroke, and ischaemic heart disease mortality. BMJ Open 2014, 4, e004549. [Google Scholar] [CrossRef] [PubMed]
- Sahan, C.; Sozmen, K.; Unal, B.; O’Flaherty, M.; Critchley, J. Potential benefits of healthy food and lifestyle policies for reducing coronary heart disease mortality in Turkish adults by 2025: A modelling study. BMJ Open 2016, 6, E011217. [Google Scholar] [CrossRef] [PubMed]
- Erdem, Y.; Arici, M.; Altun, B.; Turgan, C.; Sindel, S.; Erbay, B.; Derici, U.; Karatan, O.; Hasanoglu, E.; Caglar, S. The relationship between hypertension and salt intake in Turkish population: SALTURK study. Blood Press. 2010, 19, 313–318. [Google Scholar] [CrossRef] [PubMed]
- Sengul, S.; Akpolat, T.; Erdem, Y.; Derici, U.; Arici, M.; Sindel, S.; Karatan, O.; Turgan, C.; Hasanoglu, E.; Caglar, S.; et al. Changes in hypertension prevalence, awareness, treatment, and control rates in Turkey from 2003 to 2012. J. Hypertens. 2016, 34, 1208–1217. [Google Scholar] [CrossRef] [PubMed]
- Arici, M. Clinical assessment of a patient with chronic kidney disease. In Management of Chronic Kidney Disease; Arici, M., Ed.; Springer: Berlin/Heidelberg, Germany, 2014; pp. 15–28. [Google Scholar]
- Akpolat, T.; Kadi, R.; Utas, C. Hypertension, salt, and bread. Am. J. Kidney Dis. 2009, 53, 1103. [Google Scholar] [CrossRef] [PubMed]
- Rakıcıoglu, N.; Tek, N.; Ayaz, A.; Pekcan, G. Yemek ve Besin Fotoğraf Kataloğu. Ölçü ve Miktarlar, 2nd ed.; Hacettepe Üniversitesi Sağlık Bilimleri Fakültesi Beslenme ve Diyetetik Bölümü: Ankara, Turkey, 2009. [Google Scholar]
- United States Department of Agriculture Agricultural Research Service. USDA Food Composition Databases. Available online: https://ndb.nal.usda.gov/ndb/ (accessed on 9 June 2017).
- Bland, J.M.; Altman, D.G. Statistical methods for assessing agreement between two methods of clinical measurement. Lancet 1986, 1, 307–310. [Google Scholar] [CrossRef]
- Centers for Disease Control and Prevention (CDC). Vital signs: Food categories contributing the most to sodium consumption—United States, 2007–2008. MMWR 2012, 61, 92–98. [Google Scholar]
- Fischer, P.W.; Vigneault, M.; Huang, R.; Arvaniti, K.; Roach, P. Sodium food sources in the Canadian diet. Appl. Physiol. Nutr. Metab. 2009, 34, 884–892. [Google Scholar] [CrossRef] [PubMed]
- Zhang, L.; Zhao, F.; Zhang, P.; Gao, J.; Liu, C.; He, F.J.; Lin, C.P. A pilot study to validate a standardized one-week salt estimation method evaluating salt intake and its sources for family members in China. Nutrients 2015, 7, 751–763. [Google Scholar] [CrossRef] [PubMed]
- Zhao, F.; Zhang, P.; Zhang, L.; Niu, W.; Gao, J.; Lu, L.; Liu, C.; Gao, X. Consumption and sources of dietary salt in family members in Beijing. Nutrients 2015, 7, 2719–2730. [Google Scholar] [CrossRef] [PubMed]
- Rumpler, W.V.; Kramer, M.; Rhodes, D.G.; Moshfegh, A.J.; Paul, D.R. Identifying sources of reporting error using measured food intake. Eur. J. Clin. Nutr. 2008, 62, 544–552. [Google Scholar] [CrossRef] [PubMed]
- Conway, J.M.; Ingwersen, L.A.; Moshfegh, A.J. Accuracy of dietary recall using the USDA five-step multiple-pass method in men: An observational validation study. J. Am. Diet. Assoc. 2004, 104, 595–603. [Google Scholar] [CrossRef] [PubMed]
- Freedman, L.S.; Commins, J.M.; Moler, J.E.; Willett, W.; Tinker, L.F.; Subar, A.F.; Spiegelman, D.; Rhodes, D.; Potischman, N.; Neuhouser, M.L.; et al. Pooled results from 5 validation studies of dietary self-report instruments using recovery biomarkers for potassium and sodium intake. Am. J. Epidemiol. 2015, 181, 473–487. [Google Scholar] [CrossRef] [PubMed]
- Drewnowski, A.; Rehm, C.D. Sodium intakes of US children and adults from foods and beverages by location of origin and by specific food source. Nutrients 2013, 5, 1840–1855. [Google Scholar] [CrossRef] [PubMed]
- Ravi, S.; Bermudez, O.I.; Harivanzan, V.; Kenneth Chui, K.H.; Vasudevan, P.; Must, A.; Thanikachalam, S.; Thanikachalam, M. Sodium intake, blood pressure, and dietary sources of sodium in an adult South Indian population. Ann. Glob. Health 2016, 82, 234–242. [Google Scholar] [CrossRef] [PubMed]
- Quilez, J.; Salas Salvado, J. Salt in bread in Europe: Potential benefits of reduction. Nutr. Rev. 2012, 70, 666–678. [Google Scholar] [CrossRef] [PubMed]
- Polonia, J.J.; Magalhaes, M.T.; Senra, D.; Barbosa, L.; Silva, J.A.; Ribeiro, S.M. Association of 24-h urinary salt excretion with central haemodynamics and assessment of food categories contributing to salt consumption in Portuguese patients with hypertension. Blood Press. Monit. 2013, 18, 303–310. [Google Scholar] [CrossRef] [PubMed]
- Belz, M.C.; Ryan, L.A.; Arendt, E.K. The impact of salt reduction in bread: A review. Crit. Rev. Food Sci. Nutr. 2012, 52, 514–524. [Google Scholar] [CrossRef] [PubMed]
- Resmi Gazete. Gıda, Tarım ve Hayvancılık Bakanlığı. Türk Gıda Kodeksi Ekmek ve Ekmek Çeşitleri Tebliği. Tebliğ No: 2012/2. Sayı: 28163. Available online: http://www.resmigazete.gov.tr/eskiler/2012/01/20120104-6.htm (accessed on 9 June 2017).
- Brinsden, H.C.; He, F.J.; Jenner, K.H.; Macgregor, G.A. Surveys of the salt content in UK bread: Progress made and further reductions possible. BMJ Open 2013, 3, E002936. [Google Scholar] [CrossRef] [PubMed]
- Webster, J.; Trieu, K.; Dunford, E.; Hawkes, C. Target salt 2025: A global overview of national programs to encourage the food industry to reduce salt in foods. Nutrients 2014, 6, 3274–3287. [Google Scholar] [CrossRef] [PubMed] [Green Version]
- Jaenke, R.; Barzi, F.; McMahon, E.; Webster, J.; Brimblecombe, J. Consumer acceptance of reformulated food products: A systematic review and meta-analysis of salt-reduced foods. Crit. Rev. Food Sci. Nutr. 2017, 57, 3357–3372. [Google Scholar] [CrossRef] [PubMed]
- Eyles, H.; Shields, E.; Webster, J.; Ni Mhurchu, C. Achieving the WHO sodium target: Estimation of reductions required in the sodium content of packaged foods and other sources of dietary sodium. Am. J. Clin. Nutr. 2016, 104, 470–479. [Google Scholar] [CrossRef] [PubMed]
- Newson, R.S.; Elmadfa, I.; Biro, G.; Cheng, Y.; Prakash, V.; Rust, P.; Barna, M.; Lion, R.; Meijer, G.W.; Neufingerl, N.; et al. Barriers for progress in salt reduction in the general population. An international study. Appetite 2013, 71, 22–31. [Google Scholar] [CrossRef] [PubMed] [Green Version]
- Okuda, N.; Stamler, J.; Brown, I.J.; Ueshima, H.; Miura, K.; Okayama, A.; Saitoh, S.; Nakagawa, H.; Sakata, K.; Yoshita, K.; et al. Individual efforts to reduce salt intake in China, Japan, UK, USA: What did people achieve? The INTERMAP Population Study. J. Hypertens. 2014, 32, 2385–2392. [Google Scholar] [CrossRef] [PubMed]
- T.C. Sağlık Bakanlığı Türkiye Halk Sağlığı Kurumu. Türkiye Aşırı Tuz Tüketiminin Azaltılmasi Programi 2017–2021. Ankara; August 2016. Available online: http://beslenme.gov.tr/content/files/Tuz/t_rkiye_a_r_tuz_t_ketiminin_azalt_lmas_program_2017-2021.pdf (accessed on 9 June 2017).

| Variable | Male (n = 308) | Female (n = 349) | Total (n = 657) | p |
|---|---|---|---|---|
| Age, years, mean ± SD | 48.7 ± 16.1 | 46.7 ± 14.6 | 47.6 ± 15.3 | 0.073 |
| Age groups, years, n (%) | ||||
| 18–35 | 75 (24.4) | 90 (25.8) | 165 (25.1) | 0.308 |
| 36–64 | 187 (60.7) | 221 (63.3) | 408 (62.1) | |
| ≥65 | 46 (14.9) | 38 (10.9) | 84 (12.8) | |
| BMI, kg/m2, mean ± SD | 27.9 ± 4.6 | 29.8 ± 6.5 | 28.9 ± 5.7 | 0.001 |
| BMI groups, n (%) | ||||
| Normal weight (<24.9 kg/m2) | 84 (27.2) | 102 (29.2) | 186 (28.3) | <0.001 |
| Overweight (25–29.9 kg/m2) | 125 (40.6) | 92 (26.4) | 217 (33.0) | |
| Obese (≥30 kg/m2) | 99 (32.1) | 155 (44.4) | 254 (38.7) | |
| Hypertension, n (%) | ||||
| Absent | 184 (59.7) | 218 (62.5) | 402 (61.2) | 0.475 |
| Present | 124 (40.3) | 131 (37.5) | 255 (38.8) | |
| BP, mmHg, mean ± SD | ||||
| Systolic BP | 131.0 ± 19.5 | 123.2 ± 19.2 | 126.9 ± 19.7 | <0.001 |
| Diastolic BP | 75.4 ± 11.5 | 72.1 ± 10.8 | 73.7 ± 11.2 | <0.001 |
| Laboratory parameters, mean ± SD | ||||
| 24-h urinary sodium, mmol/day | 267.4 ± 94.2 | 238.4 ± 88.3 | 252.0 ± 92.2 | <0.001 |
| Urinary creatinine, mg/day | 1746.9 ± 486.2 | 1373.5 ± 407.3 | 1548.5 ± 483.1 | <0.001 |
| Male (n = 210) | Female (n = 254) | Total (n = 464) | |
|---|---|---|---|
| 24-h urinary sodium, mmol/day | 256.4 ± 85.6 | 237.0 ± 87.4 | 245.8 ± 87.0 |
| Salt intake estimated from 24-h urinary sodium, g/day | 15.1 ± 5.0 | 13.9 ± 5.1 | 14.5 ± 5.1 |
| Salt intake estimated from dietary recall, g/day | 11.9 ± 6.6 | 12.2 ± 7.3 | 12.0 ± 7.0 |
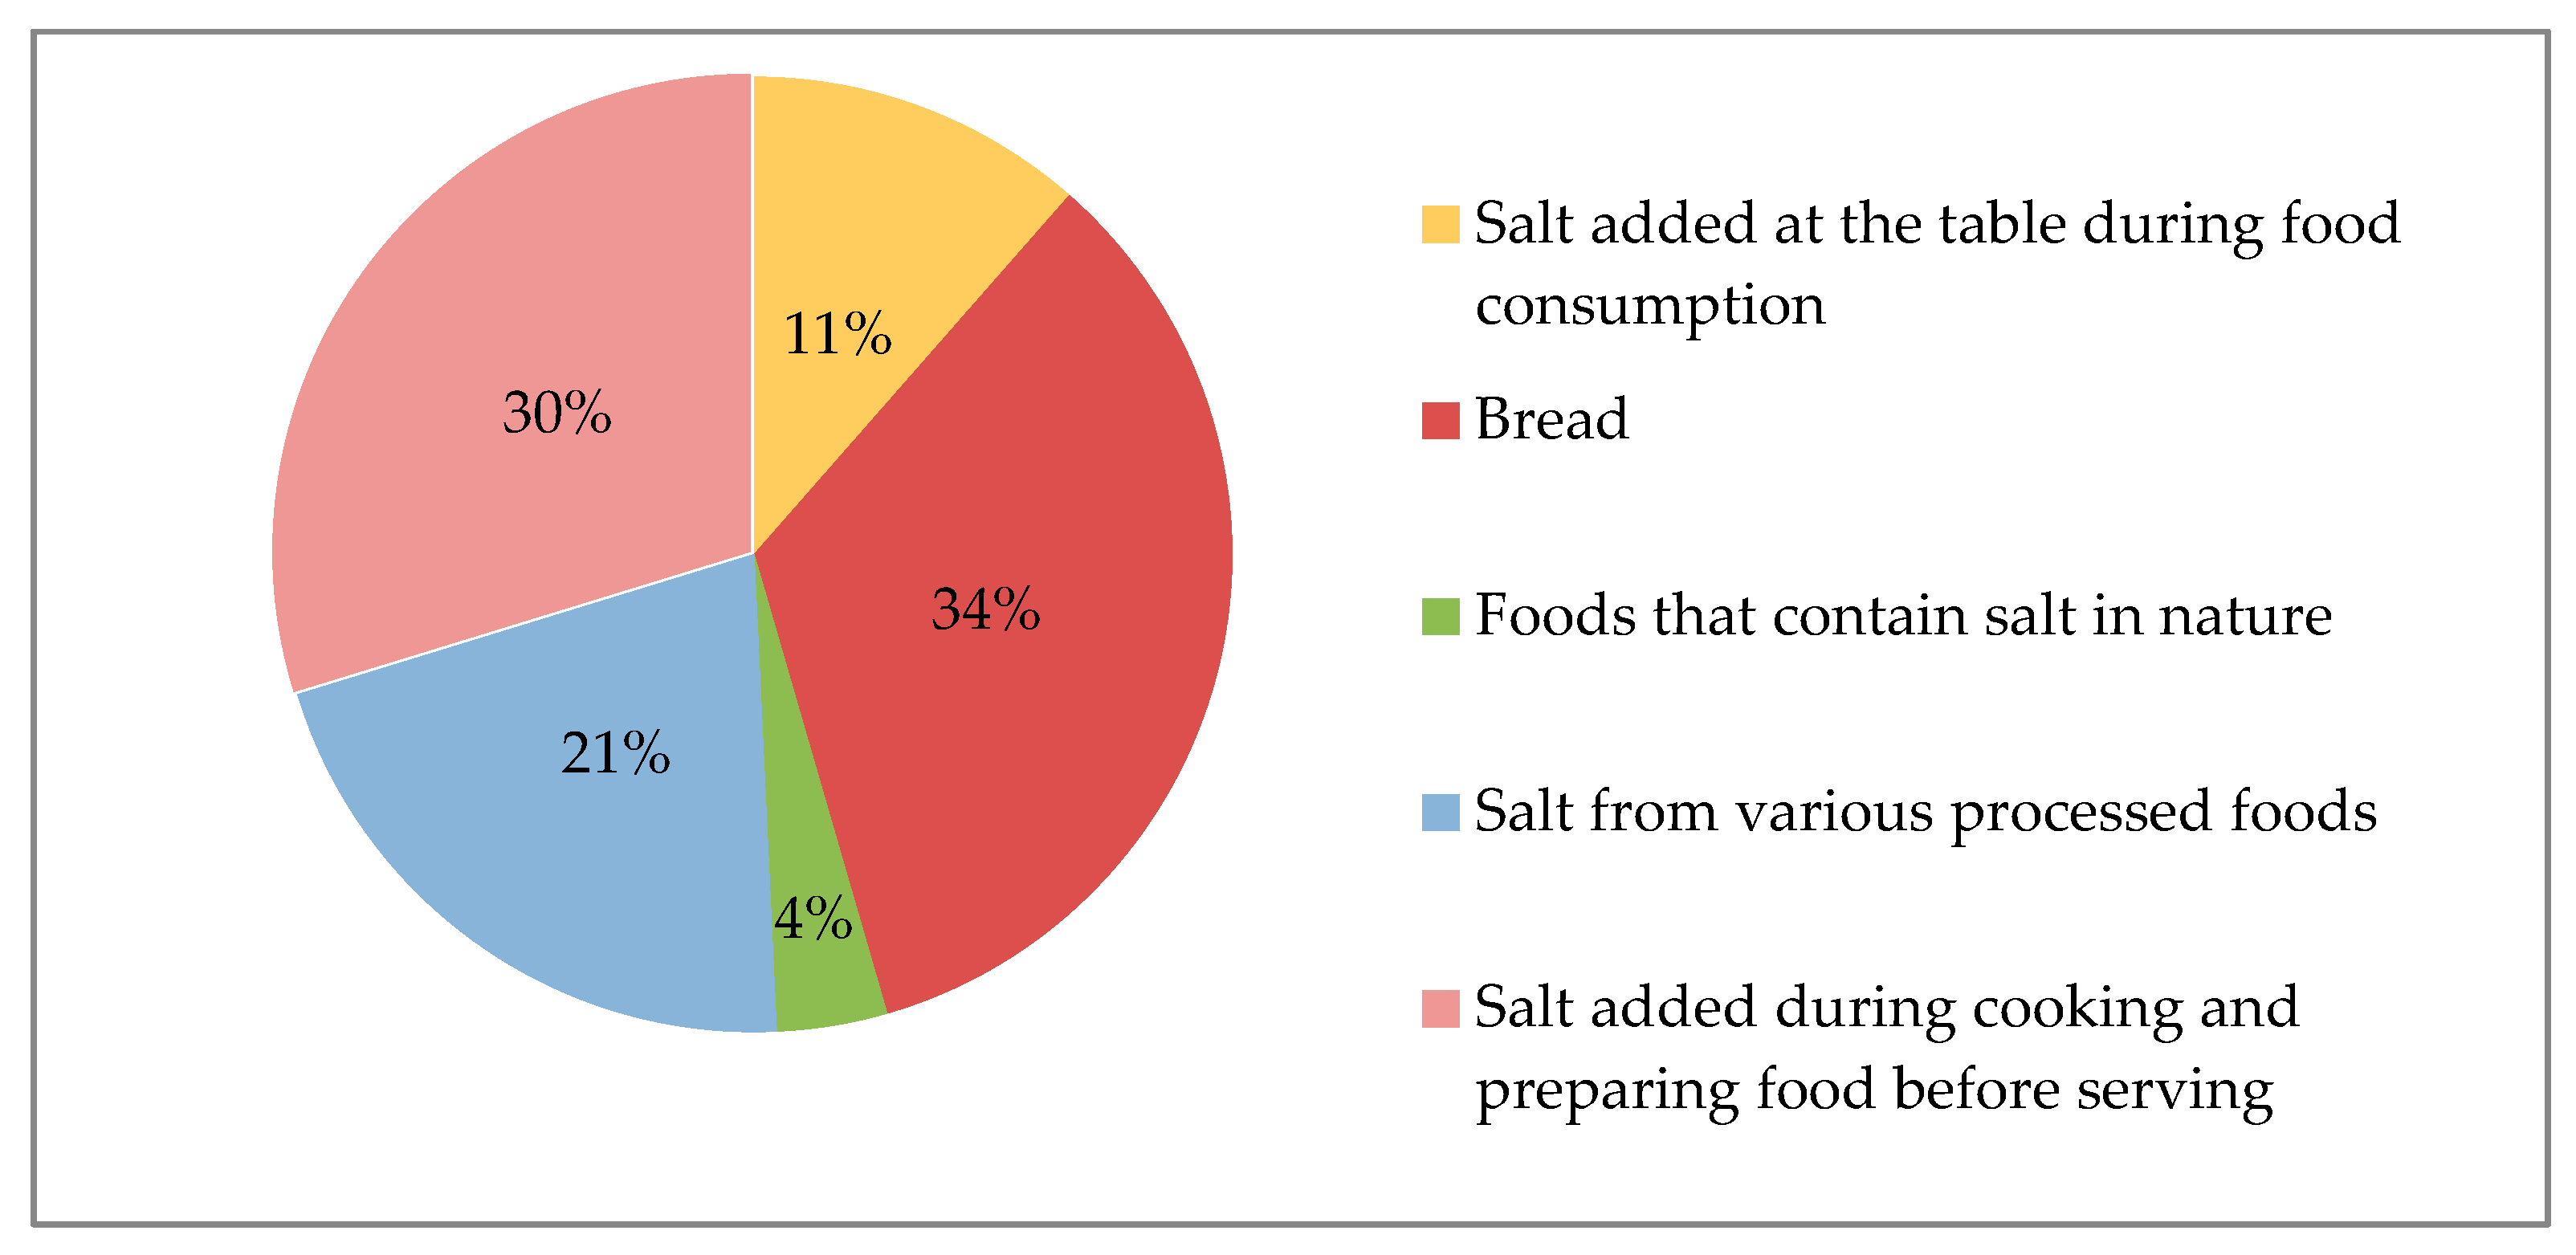
| Food Items | Estimated Salt Intake (g/Day, Mean ± SD) |
|---|---|
| Bread | 4.1 ± 4.1 |
| Salt added during cooking and preparing food before serving | 3.6 ± 4.5 |
| Salt from various processed foods | 2.5 ± 2.5 |
| Distribution of processed foods (%) | |
| Breakfast foods (cheese, olive, butter, eggs, etc.) | 62% |
| Pickle | 16% |
| Meat-poultry-fish and meat products | 10% |
| Dried nuts and fruits | 4% |
| Biscuits and crackers | 3% |
| Others * | 6% |
| Estimated Salt Intake (g/day, Mean ± SD) | |
| Salt added at the table during food consumption | 1.4 ± 2.5 |
| Foods that contain salt in nature (e.g., some vegetables, etc.) | 0.5 ± 0.8 |
© 2017 by the authors. Licensee MDPI, Basel, Switzerland. This article is an open access article distributed under the terms and conditions of the Creative Commons Attribution (CC BY) license (http://creativecommons.org/licenses/by/4.0/).
Share and Cite
Erdem, Y.; Akpolat, T.; Derici, Ü.; Şengül, Ş.; Ertürk, Ş.; Ulusoy, Ş.; Altun, B.; Arıcı, M. Dietary Sources of High Sodium Intake in Turkey: SALTURK II. Nutrients 2017, 9, 933. https://doi.org/10.3390/nu9090933
Erdem Y, Akpolat T, Derici Ü, Şengül Ş, Ertürk Ş, Ulusoy Ş, Altun B, Arıcı M. Dietary Sources of High Sodium Intake in Turkey: SALTURK II. Nutrients. 2017; 9(9):933. https://doi.org/10.3390/nu9090933
Chicago/Turabian StyleErdem, Yunus, Tekin Akpolat, Ülver Derici, Şule Şengül, Şehsuvar Ertürk, Şükrü Ulusoy, Bülent Altun, and Mustafa Arıcı. 2017. "Dietary Sources of High Sodium Intake in Turkey: SALTURK II" Nutrients 9, no. 9: 933. https://doi.org/10.3390/nu9090933
APA StyleErdem, Y., Akpolat, T., Derici, Ü., Şengül, Ş., Ertürk, Ş., Ulusoy, Ş., Altun, B., & Arıcı, M. (2017). Dietary Sources of High Sodium Intake in Turkey: SALTURK II. Nutrients, 9(9), 933. https://doi.org/10.3390/nu9090933