Prospective Associations of Dietary and Nutrient Patterns with Fracture Risk: A 20-Year Follow-Up Study

 ,
,  ,
, 
Abstract
:1. Introduction
2. Materials and Methods
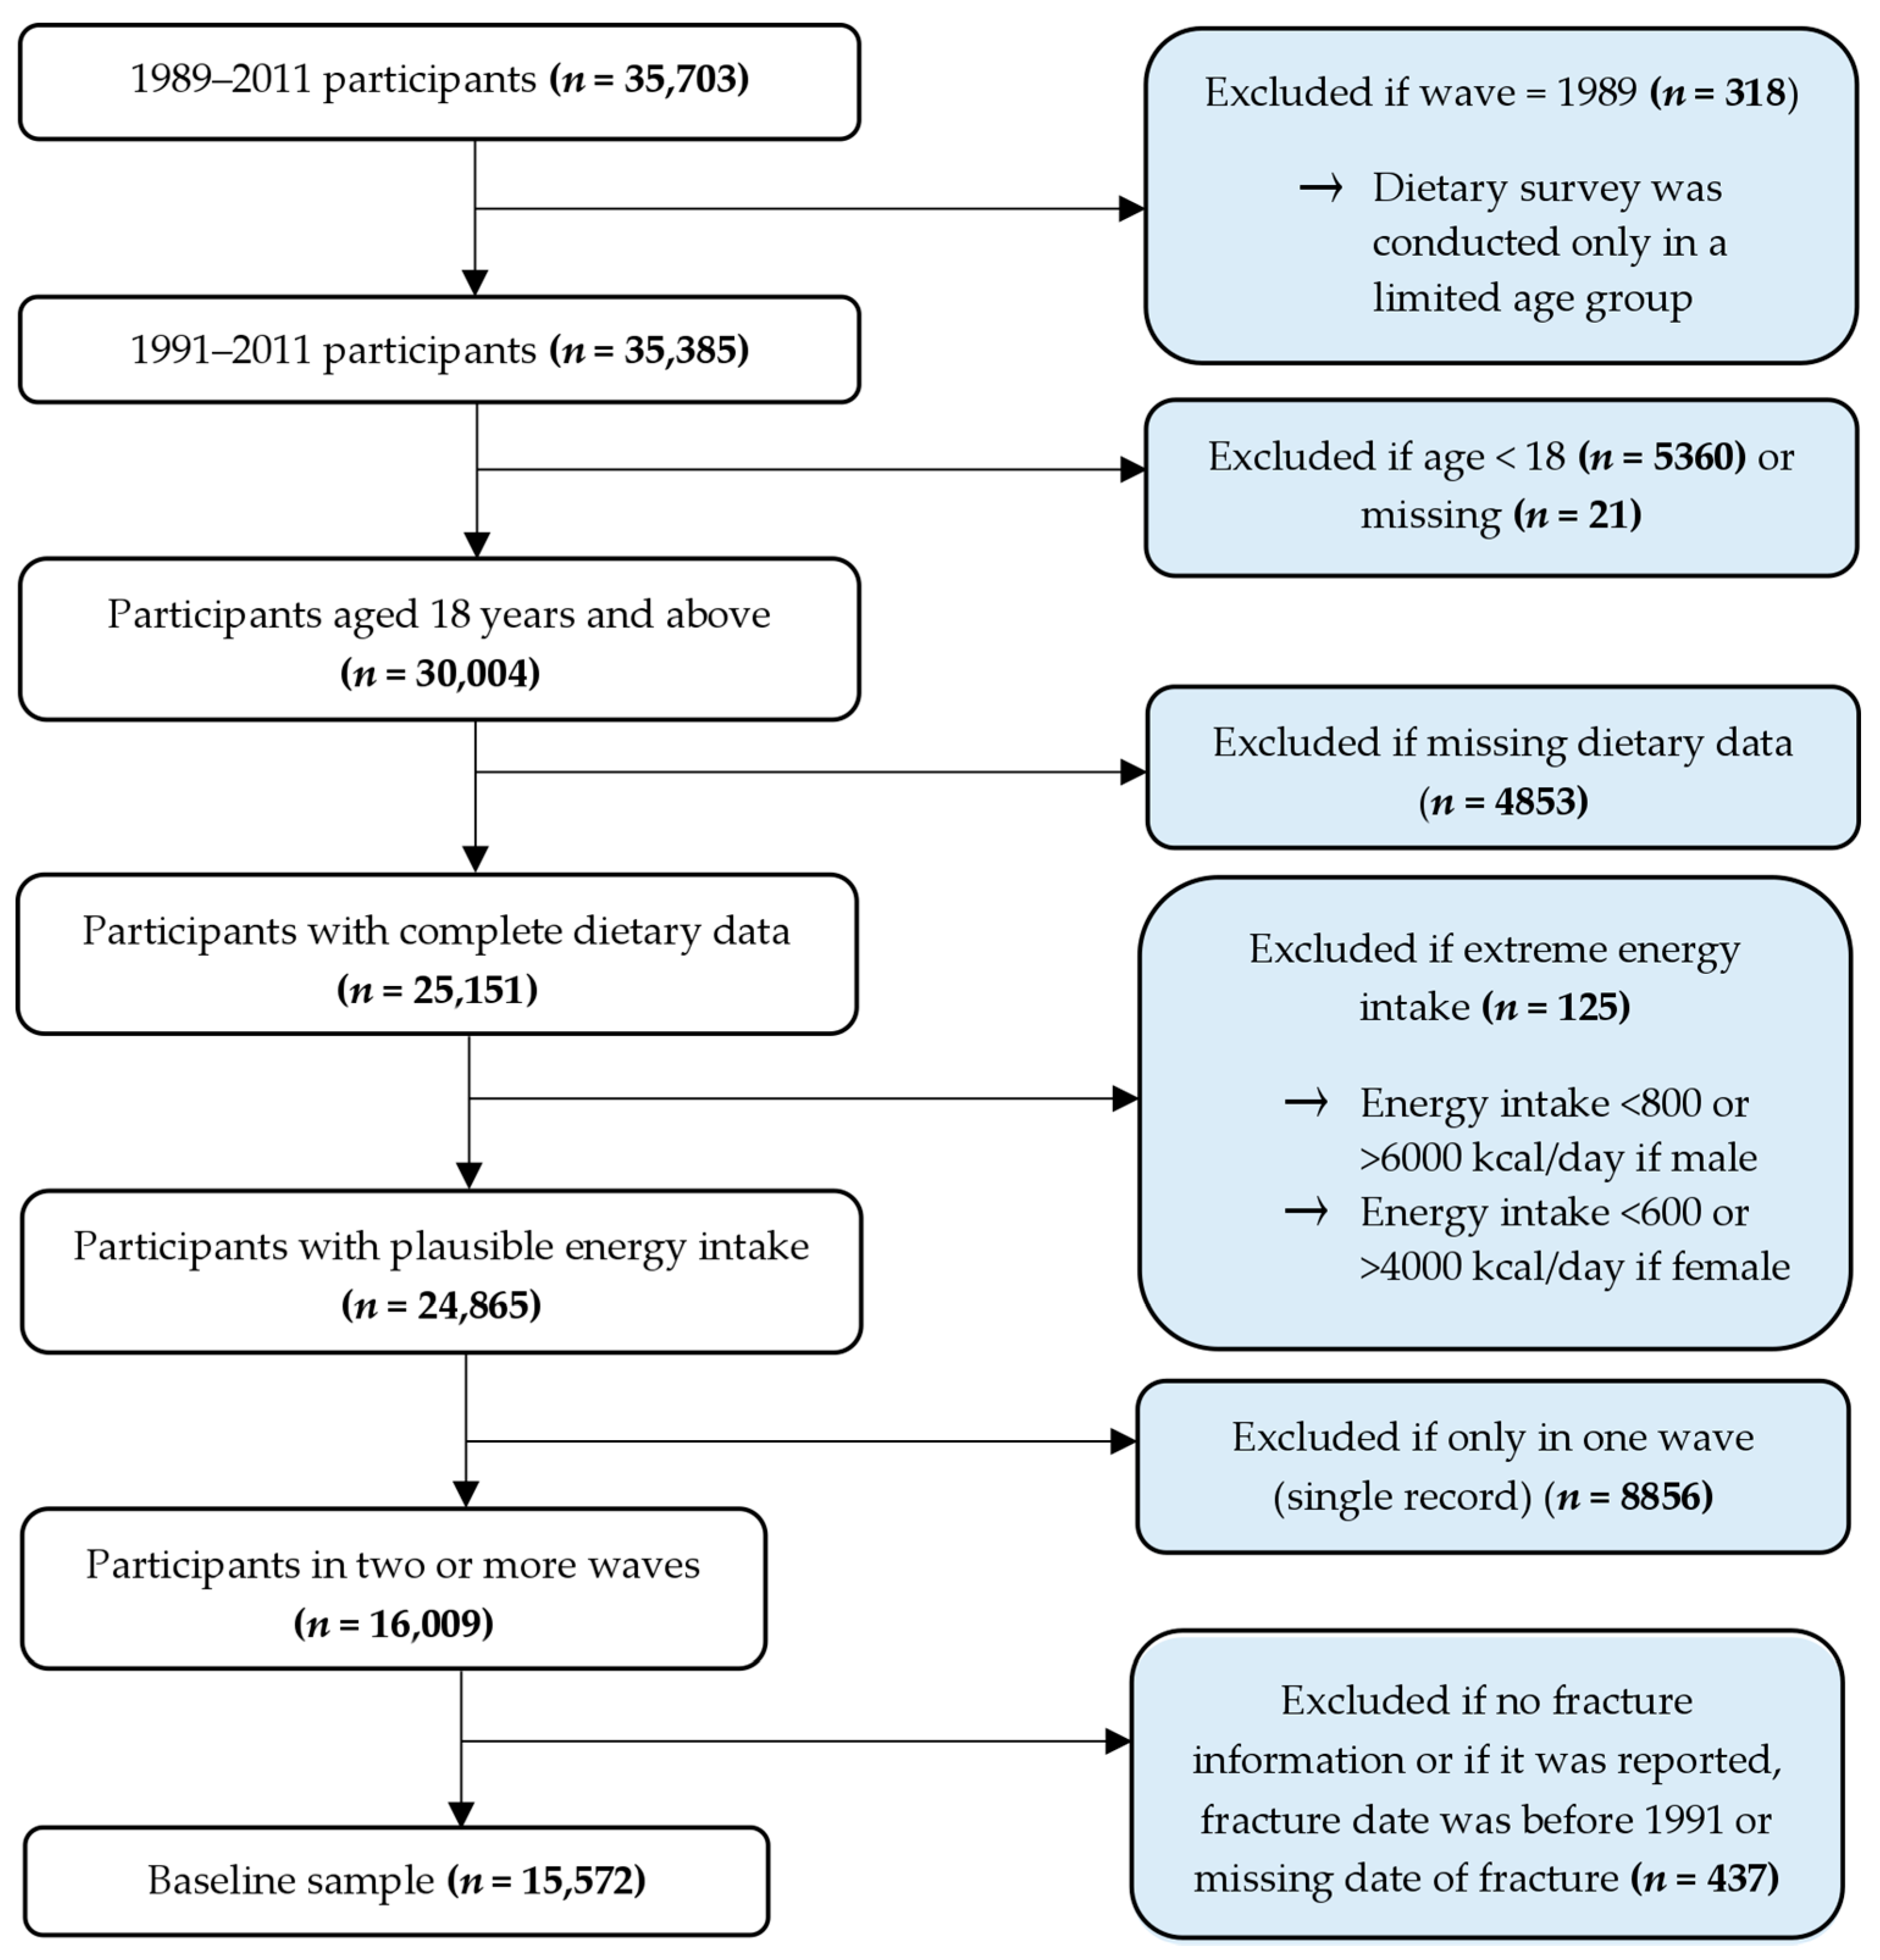
2.1. Study Design and Population
2.2. Outcome Variable
2.3. Assessment of Dietary and Nutrient Intakes
2.4. Covariates
2.5. Statistical Analysis
3. Results
3.1. Baseline Characteristics
3.2. Dietary and Nutrient Patterns
3.3. Dietary and Nutrient Patterns and Fracture Rate
4. Discussion
4.1. Comparison with Other Studies
4.2. Potential Mechanisms
4.3. Dietary Exposure Measurement
5. Conclusions
Supplementary Materials
Acknowledgments
Author Contributions
Conflicts of Interest
References
- Wiklund, R.; Toots, A.; Conradsson, M.; Olofsson, B.; Holmberg, H.; Rosendahl, E.; Rosendahl, E.; Gustafson, Y.; Littbrand, H. Risk factors for hip fracture in very old people: A population-based study. Osteoporos. Int. 2016, 27, 923–931. [Google Scholar] [CrossRef] [PubMed]
- Cauley, J.A.; Cawthon, P.M.; Peters, K.E.; Cummings, S.R.; Ensrud, K.E.; Bauer, D.C.; Taylor, B.C.; Shikany, J.M.; Hoffman, A.R.; Lane, N.E.; et al. Risk factors for hip fracture in older men: The osteoporotic fractures in men study (MrOS). J. Bone Miner. Res. 2016, 31, 1810–1819. [Google Scholar] [CrossRef] [PubMed]
- Zeng, F.-F.; Wu, B.-H.; Fan, F.; Xie, H.-L.; Xue, W.-Q.; Zhu, H.-L.; Chen, Y.-M. Dietary patterns and the risk of hip fractures in elderly Chinese: A matched case-control study. J. Clin. Endocrinol. Metab. 2013, 98, 2347–2355. [Google Scholar] [CrossRef] [PubMed]
- Haring, B.; Crandall, C.J.; Wu, C.; LeBlanc, E.S.; Shikany, J.M.; Carbone, L.; Orchard, T.; Thomas, F.; Wactawaski-Wende, J.; Li, W.; et al. Dietary patterns and fractures in postmenopausal women: Results from the women’s health initiative. JAMA Intern. Med. 2016, 176, 645–652. [Google Scholar] [CrossRef] [PubMed]
- Dai, Z.; Butler, L.M.; van Dam, R.M.; Ang, L.-W.; Yuan, J.-M.; Koh, W.-P. Adherence to a vegetable-fruit-soy dietary pattern or the alternative healthy eating index is associated with lower hip fracture risk among Singapore Chinese. J. Nutr. 2014, 144, 511–518. [Google Scholar] [CrossRef] [PubMed]
- Fung, T.T.; Arasaratnam, M.H.; Grodstein, F.; Katz, J.N.; Rosner, B.; Willett, W.C.; Feskanich, D. Soda consumption and risk of hip fractures in postmenopausal women in the Nurses’ Health Study. Am. J. Clin. Nutr. 2014, 100, 953–958. [Google Scholar] [CrossRef] [PubMed]
- Zhang, X.; Shu, X.; Li, H.; Yang, G.; Li, Q.; Gao, Y.T.; Zheng, W. Prospective cohort study of soy food consumption and risk of bone fracture among postmenopausal women. Arch. Intern. Med. 2005, 165, 1890–1895. [Google Scholar] [CrossRef] [PubMed]
- Virtanen, J.K.; Mozaffarian, D.; Willett, W.C.; Feskanich, D. Dietary intake of polyunsaturated fatty acids and risk of hip fracture in men and women. Osteoporos. Int. 2012, 23, 2615–2624. [Google Scholar] [CrossRef] [PubMed]
- Snellman, G.; Byberg, L.; Lemming, E.W.; Melhus, H.; Gedeborg, R.; Mallmin, H.; Wolk, A.; Michaëlsson, K. Long-term dietary vitamin D intake and risk of fracture and osteoporosis: A longitudinal cohort study of Swedish middle-aged and elderly women. J. Clin. Endocrinol. Metab. 2014, 99, 781–790. [Google Scholar] [CrossRef] [PubMed]
- Brezovský, M.; Magula, D.; Bitter, K.; Chlebo, P.; Fatrcová-Šramková, K.; Palkovič, J. Dietary calcium and phosphorus intake, the dietary calcium to phosphorus ratio and the risk of osteoporotic fractures in postmenopausal women. Osteol. Bull. 2014, 19, 42–47. [Google Scholar]
- Langsetmo, L.; Hanley, D.A.; Prior, J.C.; Barr, S.I.; Anastassiades, T.; Towheed, T.; Goltzman, D.; Morin, S.; Poliquin, S.; Kreiger, N.; et al. Dietary patterns and incident low-trauma fractures in postmenopausal women and men aged ≥ 50 years: A population-based cohort study. Am. J. Clin. Nutr. 2011, 93, 192–199. [Google Scholar] [CrossRef] [PubMed]
- Fung, T.T.; Feskanich, D. Dietary patterns and risk of hip fractures in postmenopausal women and men over 50 years. Osteoporos. Int. 2015, 26, 1825–1830. [Google Scholar] [CrossRef] [PubMed]
- McTiernan, A.; Wactawski-Wende, J.; Wu, L.; Rodabough, R.J.; Watts, N.B.; Tylavsky, F.; Freeman, R.; Hendrix, S.; Jackson, R.; Alving, B.; et al. Low-fat, increased fruit, vegetable, and grain dietary pattern, fractures, and bone mineral density: The Women’s Health Initiative Dietary Modification Trial. Am. J. Clin. Nutr. 2009, 89, 1864–1876. [Google Scholar] [CrossRef] [PubMed]
- Samieri, C.; Ginder Coupez, V.; Lorrain, S.; Letenneur, L.; Allès, B.; Féart, C.; Paineau, D.; Barberger-Gateau, P. Nutrient patterns and risk of fracture in older subjects: Results from the Three-City Study. Osteoporos. Int. 2013, 24, 1295–1305. [Google Scholar] [CrossRef] [PubMed]
- Sornay-Rendu, E.; Duboeuf, F.; Boutroy, S.; Chapurlat, R.D. Muscle mass is associated with incident fracture in postmenopausal women: The OFELY study. Bone 2017, 94, 108–113. [Google Scholar] [CrossRef] [PubMed]
- Mozaffarian, D. Dietary and Policy Priorities for Cardiovascular disease, diabetes, and obesity: A comprehensive review. Circulation 2016, 133, 187–225. [Google Scholar] [CrossRef] [PubMed]
- Zhang, B.; Zhai, F.; Du, S.; Popkin, B.M. The China Health and Nutrition Survey, 1989–2011. Obes. Rev. Off. J. Int. Assoc. Stud. Obes. 2014, 15. [Google Scholar] [CrossRef] [PubMed]
- Popkin, B.M.; Du, S.; Zhai, F.; Zhang, B. Cohort Profile: The China Health and Nutrition Survey—Monitoring and understanding socio-economic and health change in China, 1989–2011. Int. J. Epidemiol. 2010, 39, 1435–1440. [Google Scholar] [CrossRef] [PubMed]
- Berecki-Gisolf, J.; McClure, R.; Seubsman, S.A.; Sleigh, A. Reporting of lifetime fractures: Methodological considerations and results from the Thai Cohort Study. BMJ Open 2012, 2. [Google Scholar] [CrossRef] [PubMed]
- Zhai, F.Y.; Du, S.F.; Wang, Z.H.; Zhang, J.G.; Du, W.W.; Popkin, B.M. Dynamics of the Chinese diet and the role of urbanicity, 1991–2011. Obes. Rev. 2014, 15 (Suppl. 1), 16–26. [Google Scholar] [CrossRef] [PubMed]
- Hu, F.B.; Stampfer, M.J.; Rimm, E.; Ascherio, A.; Rosner, B.A.; Spiegelman, D.; Willett, W.C. Dietary fat and coronary heart disease: A comparison of approaches for adjusting for total energy intake and modeling repeated dietary measurements. Am. J. Epidemiol. 1999, 149, 531–540. [Google Scholar] [CrossRef] [PubMed]
- Byberg, L.; Bellavia, A.; Larsson, S.C.; Orsini, N.; Wolk, A.; Michaëlsson, K. Mediterranean Diet and Hip Fracture in Swedish Men and Women. J. Bone Miner. Res. 2016, 31, 2098–2105. [Google Scholar] [CrossRef] [PubMed]
- Shin, S.; Joung, H. A dairy and fruit dietary pattern is associated with a reduced likelihood of osteoporosis in Korean postmenopausal women. Br. J. Nutr. 2013, 110, 1926–1933. [Google Scholar] [CrossRef] [PubMed]
- Park, S.J.; Joo, S.E.; Min, H.; Park, J.K.; Kim, Y.; Kim, S.S.; Ahn, Y. Dietary patterns and osteoporosis risk in postmenopausal Korean women. Osong Public Health Res. Perspect. 2012, 3, 199–205. [Google Scholar] [CrossRef] [PubMed]
- Melaku, Y.A.; Gill, T.K.; Adams, R.; Shi, Z. Association between dietary patterns and low bone mineral density among adults aged 50 years and above: Findings from the North West Adelaide Health Study (NWAHS). Br. J. Nutr. 2016, 116, 1437–1446. [Google Scholar] [CrossRef] [PubMed]
- De Jonge, E.A.L.; Rivadeneira, F.; Erler, N.S.; Hofman, A.; Uitterlinden, A.G.; Franco, O.H.; Kiefte-de, J.C. Dietary patterns in an elderly population and their relation with bone mineral density: The Rotterdam Study. Eur. J. Nutr. 2016, 1–13. [Google Scholar] [CrossRef] [PubMed]
- Tucker, K.L.; Morita, K.; Qiao, N.; Hannan, M.T.; Cupples, L.A.; Kiel, D.P. Colas, but not other carbonated beverages, are associated with low bone mineral density in older women: The Framingham Osteoporosis Study. Am. J. Clin. Nutr. 2006, 84, 936–942. [Google Scholar] [PubMed]
- McNaughton, S.A.; Wattanapenpaiboon, N.; Wark, J.D.; Nowson, C.A. An energy-dense, nutrient-poor dietary pattern is inversely associated with bone health in women. J. Nutr. 2011, 141, 1516–1523. [Google Scholar] [CrossRef] [PubMed]
- Nguyen, N.D.; Frost, S.A.; Center, J.R.; Eisman, J.A.; Nguyen, T.V. Development of prognostic nomograms for individualizing 5-year and 10-year fracture risks. Osteoporos. Int. 2008, 19, 1431–1444. [Google Scholar] [CrossRef] [PubMed]
- Granic, A.; Jagger, C.; Davies, K.; Adamson, A.; Kirkwood, T.; Hill, T.R.; Siervo, M.; Mathers, J.C.; Sayer, A.A. Effect of dietary patterns on muscle strength and physical performance in the very old: Findings from the Newcastle 85+ Study. PLoS ONE 2016, 11, e0149699. [Google Scholar] [CrossRef] [PubMed]
- Monma, Y.; Niu, K.; Iwasaki, K.; Tomita, N.; Nakaya, N.; Hozawa, A.; Kuriyama, S.; Takayama, S.; Seki, T.; Takeda, T.; et al. Dietary patterns associated with fall-related fracture in elderly Japanese: A population based prospective study. BMC Geriatr. 2010, 10, 31. [Google Scholar] [CrossRef] [PubMed]
- Fougère, B.; Mazzuco, S.; Spagnolo, P.; Guyonnet, S.; Vellas, B.; Cesari, M.; Gallucci, M. Association between the Mediterranean-style dietary pattern score and physical performance: Results from TRELONG study. J. Nutr. Health Aging 2016, 20, 415–419. [Google Scholar] [CrossRef] [PubMed]
- Jajoo, R.; Song, L.; Rasmussen, H.; Harris, S.S.; Dawson-Hughes, B.; Burckhardt, P. Dietary acid-base balance, bone resorption, and calcium excretion. J. Am. Coll. Nutr. 2006, 25, 224–230. [Google Scholar]
- Orchard, T.; Yildiz, V.; Steck, S.E.; Hebert, J.R.; Ma, Y.; Cauley, J.A.; Li, W.; Mossavar-Rahmani, Y.; Johnson, K.C.; Sattari, M.; et al. Dietary inflammatory index, bone mineral density, and risk of fracture in postmenopausal women: Results from the women’s health initiative. J. Bone Miner. Res. 2017, 32, 1136–1146. [Google Scholar] [CrossRef] [PubMed]
- Mangano, K.M.; Walsh, S.J.; Kenny, A.M.; Insogna, K.L.; Kerstetter, J.E. Dietary acid load is associated with lower bone mineral density in men with low intake of dietary calcium. J. Bone Miner. Res. 2014, 29, 500–506. [Google Scholar] [CrossRef] [PubMed]
- Buclin, T.; Cosma, M.; Appenzeller, M.; Jacquet, A.-F.; Décosterd, L.A.; Biollaz, J.; Li, W.; Mossavar-Rahmani, Y.; Johnson, K.C.; Sattari, M.; et al. Diet acids and alkalis influence calcium retention in bone. Osteoporos. Int. 2001, 12, 493–499. [Google Scholar] [CrossRef] [PubMed]
- Shariati-Bafghi, S.E.; Nosrat-Mirshekarlou, E.; Karamati, M.; Rashidkhani, B. Higher dietary acidity is associated with lower bone mineral density in postmenopausal Iranian Women, Independent of dietary calcium intake. Int. J. Vitam. Nutr. Res. 2014, 84, 206–217. [Google Scholar] [CrossRef] [PubMed]
- Fenton, T.R.; Tough, S.C.; Lyon, A.W.; Eliasziw, M.; Hanley, D.A. Causal assessment of dietary acid load and bone disease: A systematic review & meta-analysis applying Hill’s epidemiologic criteria for causality. Nutr. J. 2011, 10, 41. [Google Scholar] [PubMed]
- Shivappa, N.; Hébert, J.R.; Karamati, M.; Shariati-Bafghi, S.-E.; Rashidkhani, B. Increased inflammatory potential of diet is associated with bone mineral density among postmenopausal women in Iran. Eur. J. Nutr. 2016, 55, 561–568. [Google Scholar] [CrossRef] [PubMed]
- Campbell, W.W.; Tang, M. Protein intake, weight loss, and bone mineral density in postmenopausal women. J. Gerontol. A Biol. Sci. Med. Sci. 2010, 65, 1115–1122. [Google Scholar] [CrossRef] [PubMed]
- Cao, J.J.; Johnson, L.K.; Hunt, J.R. A diet high in meat protein and potential renal acid load increases fractional calcium absorption and urinary calcium excretion without affecting markers of bone resorption or formation in postmenopausal women. J. Nutr. 2011, 141, 391–397. [Google Scholar] [CrossRef] [PubMed]
- Cao, J.J.; Nielsen, F.H. Acid diet (high-meat protein) effects on calcium metabolism and bone health. Curr. Opin. Clin. Nutr. Metab. Care 2010, 13, 698–702. [Google Scholar] [CrossRef] [PubMed]
- Hanley, D.A.; Whiting, S.J. Does a high dietary acid content cause bone loss, and can bone loss be prevented with an alkaline diet? J. Clin. Densitom. 2013, 16, 420–425. [Google Scholar] [CrossRef] [PubMed]
- Hardy, R.; Cooper, M.S. Bone loss in inflammatory disorders. J. Endocrinol. 2009, 201, 309–320. [Google Scholar] [CrossRef] [PubMed]
- Cao, Y.; Wittert, G.; Taylor, A.W.; Adams, R.; Appleton, S.; Shi, Z. Nutrient patterns and chronic inflammation in a cohort of community dwelling middle-aged men. Clin. Nutr. 2017, 36, 1040–1047. [Google Scholar] [CrossRef] [PubMed]
- Cauley, J.A.; Danielson, M.E.; Boudreau, R.M.; Forrest, K.Y.; Zmuda, J.M.; Pahor, M.; Tylavsky, F.A.; Cummings, S.R.; Harris, T.B.; Newman, A.B.; et al. Inflammatory markers and incident fracture risk in older men and women: The Health Aging and Body Composition Study. J. Bone Miner. Res. 2007, 22, 1088–1095. [Google Scholar] [CrossRef] [PubMed]
- Willett, W. Nutritional Epidemiology; Oxford University Press: New York, NY, USA, 2013. [Google Scholar]
- Chen, W.; Lv, H.; Liu, S.; Liu, B.; Zhu, Y.; Chen, X.; Yang, G.; Liu, L.; Zhang, T.; Wang, H.; et al. National incidence of traumatic fractures in China: A retrospective survey of 512 187 individuals. Lancet Glob. Health 2017, 5, e807–e817. [Google Scholar] [CrossRef]
- Warriner, A.H.; Patkar, N.M.; Curtis, J.R.; Delzell, E.; Gary, L.; Kilgore, M.; Saag, K. Which fractures are most attributable to osteoporosis? J. Clin. Epidemiol. 2011, 64, 46–53. [Google Scholar] [CrossRef] [PubMed]
- Burge, R.; Dawson-Hughes, B.; Solomon, D.H.; Wong, J.B.; King, A.; Tosteson, A. Incidence and economic burden of osteoporosis-related fractures in the United States, 2005–2025. J. Bone Miner. Res. 2007, 22, 465–475. [Google Scholar] [CrossRef] [PubMed]
- Yu, C.; Shi, Z.; Lv, J.; Guo, Y.; Bian, Z.; Du, H.; Chen, Y.; Tao, R.; Huang, Y.; Chen, J.; et al. Dietary Patterns and Insomnia Symptoms in Chinese Adults: The China Kadoorie Biobank. Nutrients 2017, 9, 232. [Google Scholar] [CrossRef] [PubMed]
- Zhao, L.-G.; Shu, X.-O.; Li, H.-L.; Zhang, W.; Gao, J.; Sun, J.-W.; Zheng, W.; Xiang, Y.-B. Dietary antioxidant vitamins intake and mortality: A report from two cohort studies of Chinese adults in Shanghai. J. Epidemiol. 2017, 27, 89–97. [Google Scholar] [CrossRef] [PubMed]
| Food Groups | Dietary Patterns and Factor Loadings | Nutrients | Nutrient Patterns and Factor Loadings | ||
|---|---|---|---|---|---|
| Traditional | Modern | Plant-Sourced | Animal-Sourced | ||
| Rice | 0.71 | −0.40 | Potassium | 0.93 | −0.08 |
| Pork | 0.48 | 0.21 | Phosphorus | 0.93 | 0.26 |
| Fish | 0.41 | 0.19 | Magnesium | 0.93 | 0.08 |
| Poultry | 0.29 | 0.21 | Zinc | 0.87 | 0.32 |
| Dry tofu | 0.29 | 0.03 | Calcium | 0.87 | −0.17 |
| Beef | 0.24 | 0.16 | Iron | 0.86 | 0.19 |
| Fresh vegetable | 0.24 | −0.20 | Copper | 0.82 | 0.25 |
| Offal | 0.24 | 0.03 | Fiber | 0.79 | 0.08 |
| Mushroom | 0.16 | 0.29 | Manganese | 0.78 | 0.11 |
| Spirit | 0.12 | 0.10 | Vitamin C | 0.78 | −0.26 |
| Shrimp | 0.11 | 0.22 | Carbohydrate | 0.73 | 0.17 |
| Nuts | 0.09 | 0.23 | Niacin (vitamin B3) | 0.72 | 0.39 |
| Beer | 0.09 | 0.23 | Thiamine (vitamin B1) | 0.70 | 0.37 |
| Fruit | 0.08 | 0.44 | Sodium | 0.25 | 0.11 |
| Salted vegetable | 0.07 | −0.21 | Riboflavin (vitamin B2) | 0.22 | 0.79 |
| Milk | 0.05 | 0.40 | Protein | 0.61 | 0.70 |
| Beverage | 0.04 | 0.12 | Fat | 0.08 | 0.66 |
| Yoghurt | 0.03 | 0.16 | Selenium | 0.30 | 0.52 |
| Sugar | 0.03 | 0.11 | Vitamin E | 0.34 | 0.51 |
| Wine | 0.02 | 0.03 | Vitamin A | −0.07 | 0.47 |
| Milk powder | 0.02 | 0.06 | Folate | −0.04 | 0.11 |
| Lamb | 0.01 | 0.18 | |||
| Fresh bean | 0.00 | 0.03 | |||
| Cake | −0.02 | 0.31 | |||
| Legume | −0.02 | −0.11 | |||
| Fast food | −0.03 | 0.40 | |||
| Eggs | −0.03 | 0.44 | |||
| Tofu | −0.05 | 0.05 | |||
| Soy milk | −0.07 | 0.42 | |||
| Bean thread noodle | −0.09 | 0.07 | |||
| Tubers | −0.19 | −0.13 | |||
| Deep fried products | −0.20 | 0.41 | |||
| Whole grain | −0.47 | −0.04 | |||
| Wheat | −0.73 | 0.07 | |||

| Characteristics | Overall | T1 | T2 | T3 | p Value | T1 | T2 | T3 | p Value | |
|---|---|---|---|---|---|---|---|---|---|---|
| Category | Value | Traditional Dietary Pattern | Modern Dietary Pattern | |||||||
| N | 15,572 | 5476 | 5164 | 4932 | 6019 | 4796 | 4757 | |||
| Sex # | Male | 7627 (49.0%) | 2613 (47.7%) | 2192 (42.4%) | 2822 (57.2%) | <0.001 | 3000 (49.8%) | 2213 (46.1%) | 2414 (50.7%) | <0.001 |
| Age in years, median (IQR) $ | 37.6 (27.5, 51.1) | 37.9 (27.5, 51.7) | 38.6 (27.9, 53.3) | 36.3 (26.7, 47.9) | <0.001 | 36.5 (26.8, 48.4) | 37.7 (27.2, 51.5) | 39.2 (28.6, 53.5) | <0.001 | |
| Income # | Low | 4537 (29.1%) | 2010 (36.7%) | 1335 (25.9%) | 1192 (24.2%) | <0.001 | 2409 (40.0%) | 1481 (30.9%) | 647 (13.6%) | <0.001 |
| Medium | 5083 (32.6%) | 1739 (31.8%) | 1728 (33.5%) | 1616 (32.8%) | 2066 (34.3%) | 1651 (34.4%) | 1366 (28.7%) | |||
| High | 5842 (37.5%) | 1674 (30.6%) | 2065 (40.0%) | 2103 (42.6%) | 1522 (25.3%) | 1624 (33.9%) | 2696 (56.7%) | |||
| Missing | 110 (0.7%) | 53 (1.0%) | 36 (0.7%) | 21 (0.4%) | 22 (0.4%) | 40 (0.8%) | 48 (1.0%) | |||
| Residency # | Urban | 5578 (35.8%) | 1610 (29.4%) | 2150 (41.6%) | 1818 (36.9%) | <0.001 | 999 (16.6%) | 1839 (38.3%) | 2740 (57.6%) | <0.001 |
| Education # | Low | 6496 (41.7%) | 2514 (45.9%) | 2042 (39.5%) | 1940 (39.3%) | <0.001 | 3311 (55.0%) | 2036 (42.5%) | 1149 (24.2%) | <0.001 |
| Medium | 4601 (29.5%) | 1630 (29.8%) | 1470 (28.5%) | 1501 (30.4%) | 1751 (29.1%) | 1458 (30.4%) | 1392 (29.3%) | |||
| High | 3086 (19.8%) | 847 (15.5%) | 1099 (21.3%) | 1140 (23.1%) | 603 (10.0%) | 846 (17.6%) | 1637 (34.4%) | |||
| Missing | 1389 (8.9%) | 485 (8.9%) | 553 (10.7%) | 351 (7.1%) | 354 (5.9%) | 456 (9.5%) | 579 (12.2%) | |||
| Physical activity (MET-hours/week), mean (SD) (n = 14,930) @ | 201.1 (174.1) | 212.4 (185.2) | 192.3 (169.5) | 197.9 (165.4) | <0.001 | 236.8 (183.0) | 202.4 (173.9) | 153.7 (149.6) | <0.001 | |
| Alcohol consumption # | None | 9327 (59.9%) | 3247 (59.3%) | 3311 (64.1%) | 2769 (56.1%) | <0.001 | 3663 (60.9%) | 3002 (62.6%) | 2662 (56.0%) | <0.001 |
| <1/week | 1826 (11.7%) | 653 (11.9%) | 534 (10.3%) | 639 (13.0%) | 740 (12.3%) | 515 (10.7%) | 571 (12.0%) | |||
| 1–2/week | 1256 (8.1%) | 390 (7.1%) | 401 (7.8%) | 465 (9.4%) | 449 (7.5%) | 334 (7.0%) | 473 (9.9%) | |||
| 3–4/week | 705 (4.5%) | 220 (4.0%) | 216 (4.2%) | 269 (5.5%) | 264 (4.4%) | 178 (3.7%) | 263 (5.5%) | |||
| Daily | 1299 (8.3%) | 412 (7.5%) | 400 (7.7%) | 487 (9.9%) | 424 (7.0%) | 369 (7.7%) | 506 (10.6%) | |||
| Missing | 1159 (7.4%) | 554 (10.1%) | 302 (5.8%) | 303 (6.1%) | 479 (8.0%) | 398 (8.3%) | 282 (5.9%) | |||
| Smoking # | Current/ex-smoker | 4759 (30.6%) | 1606 (29.3%) | 1411 (27.3%) | 1742 (35.3%) | <0.001 | 1916 (31.8%) | 1379 (28.8%) | 1464 (30.8%) | 0.002 |
| Missing | 957 (6.1%) | 463 (8.5%) | 252 (4.9%) | 242 (4.9%) | 415 (6.9%) | 329 (6.9%) | 213 (4.5%) | |||
| Body-mass index (kg/m2), mean (SD) (n = 14,045) @ | 22.1 (3.1) | 22.6 (3.1) | 22.0 (3.2) | 21.7 (2.9) | <0.001 | 21.4 (2.7) | 22.2 (3.1) | 23.0 (3.3) | <0.001 | |
| Hypertension # | Yes | 1725 (11.1%) | 634 (11.6%) | 611 (11.8%) | 480 (9.7%) | <0.001 | 466 (7.7%) | 529 (11.0%) | 730 (15.3%) | <0.001 |
| Missing | 1401 (9.0%) | 623 (11.4%) | 406 (7.9%) | 372 (7.5%) | 555 (9.2%) | 481 (10.0%) | 365 (7.7%) | |||
| Energy (kcal), mean (SD) @ | 2448.2 (708.4) | 2452.8 (750.7) | 2212.2 (595.9) | 2690.2 (685.5) | <0.001 | 2597.3 (692.4) | 2356.5 (714.5) | 2351.9 (689.7) | <0.001 | |
| Plant-Sourced Nutrient Pattern | Animal-Sourced Nutrient Pattern | |||||||||
| 15,571 | 5661 | 4210 | 5700 | 6026 | 4170 | 5375 | ||||
| Sex # | Men | 2146 (37.9%) | 2200 (52.3%) | 3280 (57.5%) | <0.001 | 2435 (40.4%) | 1973 (47.3%) | 3218 (59.9%) | <0.001 | |
| Age in years, median (IQR) $ | 39.4 (28.2, 55.5) | 36.9 (26.8, 49.4) | 36.7 (27.1, 47.9) | <0.001 | 38.6 (27.9, 53.5) | 37.3 (27.3, 51.2) | 36.7 (26.9, 48.4) | <0.001 | ||
| Income # | Low | 1377 (24.3%) | 1147 (27.2%) | 2013 (35.3%) | <0.001 | 2121 (35.2%) | 1169 (28.0%) | 1247 (23.2%) | <0.001 | |
| Medium | 1814 (32.0%) | 1414 (33.6%) | 1854 (32.5%) | 2017 (33.5%) | 1381 (33.1%) | 1684 (31.3%) | ||||
| High | 2415 (42.7%) | 1625 (38.6%) | 1802 (31.6%) | 1852 (30.7%) | 1588 (38.1%) | 2402 (44.7%) | ||||
| Missing | 55 (1.0%) | 24 (0.6%) | 31 (0.5%) | 36 (0.6%) | 32 (0.8%) | 42 (0.8%) | ||||
| Residency # | Urban | 2721 (48.1%) | 1491 (35.4%) | 1365 (23.9%) | <0.001 | 1708 (28.3%) | 1599 (38.3%) | 2270 (42.2%) | <0.001 | |
| Education # | Low | 2014 (35.6%) | 1671 (39.7%) | 2811 (49.3%) | <0.001 | 3008 (49.9%) | 1684 (40.4%) | 1804 (33.6%) | <0.001 | |
| Medium | 1592 (28.1%) | 1285 (30.5%) | 1724 (30.2%) | 1673 (27.8%) | 1249 (30.0%) | 1679 (31.2%) | ||||
| High | 1414 (25.0%) | 820 (19.5%) | 851 (14.9%) | 853 (14.2%) | 851 (20.4%) | 1381 (25.7%) | ||||
| Missing | 641 (11.3%) | 434 (10.3%) | 314 (5.5%) | 492 (8.2%) | 386 (9.3%) | 511 (9.5%) | ||||
| Physical activity (MET-hours), mean (SD) (n = 14,930) @ | 165.9 (162.8) | 199.1 (167.0) | 236.5 (182.5) | <0.001 | 214.2 (180.6) | 197.8 (172.8) | 189.2 (166.6) | <0.001 | ||
| Alcohol consumption # | None | 3845 (67.9%) | 2422 (57.5%) | 3060 (53.7%) | <0.001 | 3952 (65.6%) | 2559 (61.4%) | 2816 (52.4%) | <0.001 | |
| <1/week | 517 (9.1%) | 503 (11.9%) | 806 (14.1%) | 599 (9.9%) | 486 (11.7%) | 741 (13.8%) | ||||
| 1–2/week | 354 (6.3%) | 393 (9.3%) | 508 (8.9%) | 383 (6.4%) | 324 (7.8%) | 548 (10.2%) | ||||
| 3–4/week | 206 (3.6%) | 197 (4.7%) | 302 (5.3%) | 222 (3.7%) | 188 (4.5%) | 295 (5.5%) | ||||
| Daily | 419 (7.4%) | 376 (8.9%) | 504 (8.8%) | 398 (6.6%) | 312 (7.5%) | 589 (11.0%) | ||||
| Missing | 320 (5.7%) | 319 (7.6%) | 520 (9.1%) | 472 (7.8%) | 301 (7.2%) | 386 (7.2%) | ||||
| Smoking # | Current/ex-smoke | 1344 (23.7%) | 1345 (31.9%) | 2069 (36.3%) | <0.001 | 1599 (26.5%) | 1199 (28.8%) | 1960 (36.5%) | <0.001 | |
| Missing | 259 (4.6%) | 265 (6.3%) | 433 (7.6%) | 402 (6.7%) | 244 (5.9%) | 311 (5.8%) | ||||
| Body-mass index (kg/m2), mean (SD) (n = 14,045) @ | 22.3 (3.3) | 22.3 (3.1) | 21.9 (2.9) | <0.001 | 21.8 (3.0) | 22.2 (3.2) | 22.4 (3.1) | <0.001 | ||
| Hypertension # | Yes | 781 (13.8%) | 449 (10.7%) | 495 (8.7%) | <0.001 | 698 (11.6%) | 454 (10.9%) | 573 (10.7%) | 0.190 | |
| Missing | 499 (8.8%) | 378 (9.0%) | 524 (9.2%) | 566 (9.4%) | 387 (9.3%) | 448 (8.3%) | ||||
| Energy (kcal), mean (SD) @ | 1943.5 (492.3) | 2491.4 (491.0) | 2917.9 (690.5) | <0.001 | 2136.7 (624.0) | 2385.8 (557.8) | 2846.1 (710.9) | <0.001 | ||
| T1 | T2 | T3 | p Value | T1 | T2 | T3 | p Value | ||
|---|---|---|---|---|---|---|---|---|---|
| Traditional Dietary Pattern | Modern Dietary Pattern | ||||||||
| N | 15,572 | 5476 | 5164 | 4932 | 6019 | 4796 | 4757 | ||
| Food Groups, Mean (SD) | |||||||||
| Rice (g/day) | 286.9 (211.4) | 100.6 (119.7) | 324.1 (137.9) | 454.9 (192.5) | <0.001 | 422.5 (212.2) | 212.2 (171.7) | 190.7 (146.4) | <0.001 |
| Fish (g/day) | 24.1 (47.2) | 6.4 (21.0) | 20.0 (36.4) | 47.9 (65.1) | <0.001 | 13.8 (33.3) | 22.5 (42.4) | 38.8 (61.1) | <0.001 |
| Tofu (g/day) | 22.7 (42.4) | 25.1 (46.0) | 24.3 (42.4) | 18.4 (37.6) | <0.001 | 21.4 (45.1) | 22.3 (40.3) | 24.8 (40.9) | <0.001 |
| Dry tofu (g/day) | 10.0 (26.3) | 3.1 (15.2) | 8.4 (20.9) | 19.3 (36.4) | <0.001 | 10.1 (26.3) | 8.7 (24.9) | 11.2 (27.5) | <0.001 |
| Fresh vegetable (g/day) | 279.1 (179.0) | 238.2 (168.0) | 256.7 (151.7) | 347.8 (196.6) | <0.001 | 338.4 (204.8) | 239.7 (145.7) | 243.7 (152.3) | <0.001 |
| Salted vegetable (g/day) | 15.7 (46.7) | 13.1 (53.7) | 13.3 (34.5) | 21.1 (48.9) | <0.001 | 29.6 (68.1) | 7.5 (21.6) | 6.4 (20.2) | <0.001 |
| Fruit (g/day) | 19.4 (72.2) | 12.5 (48.0) | 20.1 (62.3) | 26.3 (98.6) | <0.001 | 2.2 (15.6) | 7.3 (29.5) | 53.2 (119.1) | <0.001 |
| Soy milk (mL/day) | 5.6 (29.2) | 7.5 (36.8) | 6.0 (28.0) | 2.9 (18.9) | <0.001 | 0.4 (6.0) | 1.3 (9.8) | 16.4 (49.8) | <0.001 |
| Milk (mL/day) | 5.8 (35.3) | 3.5 (28.0) | 7.1 (37.2) | 6.9 (40.2) | <0.001 | 0.0 (0.3) | 0.1 (2.5) | 18.8 (62.0) | <0.001 |
| Milk powder (g/day) | 0.4 (5.5) | 0.3 (4.2) | 0.4 (4.6) | 0.4 (7.4) | 0.360 | 0.0 (1.4) | 0.1 (2.1) | 1.0 (9.6) | <0.001 |
| Whole grain (g/day) | 26.7 (82.4) | 70.0 (126.2) | 5.0 (20.3) | 1.5 (11.6) | <0.001 | 29.8 (101.8) | 33.3 (78.4) | 16.2 (52.6) | <0.001 |
| Nutrients | |||||||||
| Calcium (mg/day) | 639.2 (780.3) | 608.2 (838.3) | 564.1 (641.9) | 752.3 (831.3) | <0.001 | 774.6 (952.5) | 543.2 (653.2) | 564.7 (614.2) | <0.001 |
| Magnesium (mg/day) | 381.8 (239.9) | 451.8 (277.9) | 318.9 (186.7) | 370.1 (222.9) | <0.001 | 421.4 (283.6) | 367.3 (213.3) | 346.4 (193.0) | <0.001 |
| Phosphorus (mg/day) | 1266.8 (595.0) | 1335.5 (669.4) | 1083.6 (471.3) | 1382.2 (578.1) | <0.001 | 1378.1 (668.9) | 1204.3 (551.0) | 1188.8 (511.1) | <0.001 |
| Potassium (mg/day) | 2419.5 (2032.4) | 2479.1 (2231.7) | 2104.9 (1655.9) | 2682.8 (2113.4) | <0.001 | 2858.1 (2464.2) | 2127.5 (1693.5) | 2159.0 (1597.4) | <0.001 |
| Fiber (g/day) | 15.4 (11.4) | 18.9 (12.9) | 12.6 (9.2) | 14.3 (10.7) | <0.001 | 17.7 (13.2) | 14.4 (10.1) | 13.4 (9.4) | <0.001 |
| Vitamin A (mg/day) | 200.6 (738.4) | 106.5 (225.3) | 162.1 (353.4) | 345.3 (1225.6) | <0.001 | 106.3 (605.1) | 174.5 (504.8) | 346.2 (1015.7) | <0.001 |
| Vitamin C (mg/day) | 142.1 (178.0) | 129.6 (185.8) | 129.7 (155.7) | 169.1 (187.9) | <0.001 | 187.5 (214.2) | 114.4 (143.0) | 112.7 (144.5) | <0.001 |
| Protein (g/day) | 73.4 (26.0) | 74.9 (28.6) | 63.2 (20.9) | 82.2 (24.0) | <0.001 | 71.0 (25.0) | 71.3 (25.6) | 78.4 (26.8) | <0.001 |
| Fat (g/day) | 33.6 (25.0) | 26.7 (19.2) | 30.2 (22.6) | 44.7 (29.1) | <0.001 | 25.1 (22.2) | 30.8 (21.4) | 47.1 (26.2) | <0.001 |
| Carbohydrate(g/day) | 394.1 (160.9) | 437.2 (180.9) | 346.7 (127.6) | 395.9 (154.8) | <0.001 | 453.0 (166.6) | 383.5 (156.5) | 330.2 (127.9) | <0.001 |
| Plant-Sourced Nutrient Pattern | Animal-Sourced Nutrient Pattern | ||||||||
| 15,571 | 5661 | 4210 | 5700 | 6026 | 4170 | 5375 | |||
| Food Groups | |||||||||
| Rice (g/day) | 242.3 (145.8) | 309.8 (202.2) | 314.4 (260.1) | <0.001 | 308.8 (200.3) | 278.0 (207.8) | 269.4 (223.7) | <0.001 | |
| Fish (g/day) | 25.3 (43.2) | 26.7 (48.6) | 20.9 (49.8) | <0.001 | 16.4 (36.2) | 23.4 (44.1) | 33.2 (57.8) | <0.001 | |
| Tofu (g/day) | 18.5 (33.4) | 24.1 (42.7) | 25.9 (49.3) | <0.001 | 18.0 (37.8) | 23.8 (41.8) | 27.1 (47.0) | <0.001 | |
| Dry tofu (g/day) | 7.0 (18.7) | 11.9 (28.7) | 11.6 (30.3) | <0.001 | 6.1 (18.7) | 8.7 (22.4) | 15.5 (34.2) | <0.001 | |
| Fresh vegetable (g/day) | 224.0 (130.9) | 294.2 (178.9) | 322.6 (204.6) | <0.001 | 278.6 (176.1) | 274.4 (181.3) | 283.2 (180.4) | 0.057 | |
| Salted vegetable (g/day) | 8.8 (24.7) | 12.8 (36.4) | 24.8 (65.1) | <0.001 | 15.7 (42.6) | 15.3 (46.7) | 16.0 (50.9) | 0.740 | |
| Fruit (g/day) | 21.4 (62.6) | 22.5 (74.9) | 15.0 (78.5) | <0.001 | 11.0 (46.8) | 17.9 (79.0) | 29.9 (87.2) | <0.001 | |
| Soy milk (g/day) | 7.1 (31.2) | 6.1 (29.1) | 3.6 (27.0) | <0.001 | 2.7 (17.9) | 4.7 (24.2) | 9.4 (40.5) | <0.001 | |
| Milk (g/day) | 8.0 (40.5) | 6.8 (39.4) | 2.7 (25.0) | <0.001 | 1.4 (15.2) | 4.4 (28.3) | 11.7 (51.8) | <0.001 | |
| Milk powder (g/day) | 0.4 (4.1) | 0.3 (4.5) | 0.4 (7.1) | 0.930 | 0.1 (2.2) | 0.2 (2.9) | 0.7 (8.7) | <0.001 | |
| Whole grain (g/day), | 8.8 (30.6) | 18.9 (54.5) | 50.3 (120.5) | <0.001 | 21.3 (68.3) | 32.1 (90.4) | 28.7 (89.8) | <0.001 | |
| Nutrients | |||||||||
| Calcium (mg/day) | 280.1 (128.1) | 401.9 (182.0) | 1171.1 (1081.7) | <0.001 | 873.1 (1116.6) | 454.5 (415.5) | 520.2 (360.7) | <0.001 | |
| Magnesium (mg/day) | 218.9 (64.5) | 319.3 (83.4) | 589.9 (274.5) | <0.001 | 394.1 (314.7) | 337.5 (165.3) | 402.6 (179.9) | <0.001 | |
| Phosphorus (mg/day) | 816.9 (192.0) | 1135.5 (188.3) | 1810.5 (628.4) | <0.001 | 1234.5 (773.8) | 1132.4 (385.7) | 1407.1 (451.7) | <0.001 | |
| Potassium (mg/day) | 1271.3 (331.5) | 1809.8 (383.1) | 4010.3 (2636.8) | <0.001 | 2900.2 (2912.9) | 1920.6 (1116.3) | 2267.8 (1006.6) | <0.001 | |
| Fiber (g/day) | 7.9 (3.0) | 12.3 (4.6) | 25.1 (13.1) | <0.001 | 16.2 (13.4) | 13.4 (8.4) | 16.0 (10.7) | <0.001 | |
| Vitamin A (mg/day) | 281.7 (1068.4) | 186.0 (407.9) | 130.8 (470.7) | <0.001 | 66.8 (131.3) | 137.7 (228.3) | 399.4 (1207.2) | <0.001 | |
| Vitamin C (mg/day) | 63.9 (37.6) | 94.1 (56.6) | 255.3 (249.5) | <0.001 | 207.8 (249.0) | 104.3 (101.5) | 97.9 (80.0) | <0.001 | |
| Protein (g/day) | 55.6 (15.6) | 72.9 (17.8) | 91.3 (27.0) | <0.001 | 58.3 (20.6) | 69.1 (14.6) | 93.5 (25.2) | <0.001 | |
| Fat (g/day) | 31.6 (21.1) | 34.6 (27.1) | 34.8 (26.8) | <0.001 | 19.4 (14.3) | 30.4 (15.8) | 51.9 (28.7) | <0.001 | |
| Carbohydrate (g/day) | 271.9 (75.5) | 377.8 (85.3) | 527.5 (163.9) | <0.001 | 375.9 (163.0) | 378.5 (132.3) | 426.6 (173.3) | <0.001 | |
| T1 | T2 | T3 | Log-Rank Test | T1 | T2 | T3 | Log-Rank Test | ||
|---|---|---|---|---|---|---|---|---|---|
| Total | Traditional Dietary Pattern | Modern Dietary Pattern | |||||||
| N | 15,572 | 5476 | 5164 | 4932 | 6019 | 4796 | 4757 | ||
| Median follow-up time (years) | 8.9 | 8.8 | 8.9 | 9.0 | 8.9 | 9.0 | 7.0 | ||
| Number of fractures | 649 | 220 | 214 | 215 | 0.8441 | 227 | 216 | 206 | 0.0230 |
| Person-years at risk | 162,416.3 | 54,925.4 | 52,208.0 | 55,282.9 | 63,297.3 | 54,385.8 | 44,733.2 | ||
| Rate of fracture per 1000 person-years (95% CI) | 4.0 (3.7, 4.3) | 4.0 (3.5, 4.6) | 4.0 (3.6, 4.7) | 3.9 (3.4, 4.5) | 3.6 (3.2, 4.1) | 4.0 (3.5, 4.5) | 4.6 (4.0, 5.3) | ||
| Plant-Sourced Nutrient Pattern | Animal-Sourced Nutrient Patterns | ||||||||
| N | 15,571 | 5661 | 4210 | 5700 | 6026 | 4170 | 5375 | ||
| Median follow-up time (years) | 8.9 | 7.0 | 9.0 | 8.9 | 7.1 | 9.0 | 7.1 | ||
| Number of fractures | 649 | 198 | 189 | 262 | 0.2531 | 221 | 214 | 214 | 0.4048 |
| Person-years at risk | 162,416.3 | 46,670.8 | 51,462.5 | 64,281.0 | 59,501.7 | 51,064.5 | 51,848.1 | ||
| Rate of fracture per 1000 person-years (95% CI) | 4.0 (3.7, 4.3) | 4.2 (3.7, 4.9) | 3.7 (3.2, 4.2) | 4.1 (3.6, 4.6) | 3.7 (3.3, 4.2) | 4.2 (3.7, 4.8) | 4.1 (3.6, 4.7) | ||
| HR 95% CI | p for Trend | AIC | HR 95% CI | p for Trend | AIC | |||||
|---|---|---|---|---|---|---|---|---|---|---|
| T1 | T2 | T3 | T2 | T3 | ||||||
| Models | Person-Years; Number of Study Participants (Number of Cases) | Cumulative Mean Scores | Overall Mean Scores | |||||||
| Traditional Dietary Pattern | ||||||||||
| Model 1 | 162,416.3; 15,572 (649) | 1.00 | 1.00 (0.82–1.20) | 1.01 (0.84–1.23) | 0.887 | 0.97 (0.80–1.17) | 1.10 (0.91–1.33) | 0.361 | ||
| Model 2 | 136,542.0; 14,506 (559) | 1.00 | 1.00 (0.82–1.23) | 0.99 (0.80–1.22) | 0.927 | 0.98 (0.80–1.21) | 1.08 (0.88–1.33) | 0.470 | ||
| Model 3 | 130,075.1; 14,193 (540) | 1.00 | 1.05 (0.85–1.30) | 1.03 (0.83–1.28) | 0.757 | 9565 | 1.00 (0.81–1.24) | 1.12 (0.90–1.39) | 0.313 | 9564 |
| Modern Dietary Pattern | ||||||||||
| Model 1 | 162,414.3; 15,571 (649) | 1.00 | 1.08 (0.90–1.30) | 1.26 (1.04–1.52) * | 0.020 | 1.25 (1.03–1.52) * | 1.48 (1.22–1.80) ** | <0.0001 | ||
| Model 2 | 136,542.0; 14,506 (559) | 1.00 | 1.05 (0.85–1.29) | 1.31 (1.04–1.65) * | 0.029 | 1.25 (1.01–1.55) * | 1.59 (1.26–2.01) ** | <0.0001 | ||
| Model 3 | 130,075.1; 14,193 (540) | 1.00 | 1.06 (0.85–1.31) | 1.34 (1.06–1.71) * | 0.019 | 9559 | 1.29 (1.04–1.61) * | 1.63 (1.28–2.07) ** | <0.0001 | 9550 |
| Plant-Sourced Nutrient Pattern | ||||||||||
| Model 1 | 162,414.3; 15,571 (649) | 1.00 | 0.91 (0.74–1.12) | 1.06 (0.86–1.30) | 0.487 | 1.08 (0.89–1.31) | 0.95 (0.77–1.17) | 0.618 | ||
| Model 2 | 136,540.0; 14,505 (559) | 1.00 | 0.94 (0.75–1.18) | 1.08 (0.86–1.36) | 0.427 | 1.11 (0.90–1.37) | 0.96 (0.76–1.21) | 0.687 | ||
| Model 3 | 130,073.1; 14,192 (540) | 1.00 | 0.94 (0.75–1.19) | 1.08 (0.86–1.37) | 0.438 | 9564 | 1.09 (0.88–1.35) | 0.93 (0.74–1.19) | 0.551 | 9563 |
| Animal-Sourced Nutrient Pattern | ||||||||||
| Model 1 | 162,414.3; 15,571 (649) | 1.00 | 1.18 (0.98–1.43) | 1.25 (1.02–1.54) * | 0.026 | 1.15 (0.94–1.40) | 1.49 (1.22–1.83) ** | <0.0001 | ||
| Model 2 | 136,540.0; 14,505 (559) | 1.00 | 1.27 (1.03–1.56) * | 1.32 (1.05–1.66) * | 0.016 | 1.18 (0.95–1.47) | 1.54 (1.22–1.94) ** | <0.0001 | ||
| Model 3 | 130,073.1; 14,192 (540) | 1.00 | 1.29 (1.04–1.60) * | 1.37 (1.08–1.72) * | 0.008 | 9557 | 1.22 (0.98–1.52) | 1.61 (1.27–2.04) ** | <0.0001 | 9549 |
| Recent Scores | Baseline Scores | |||||||||
| Traditional Dietary Pattern | ||||||||||
| Model 1 | 1.00 | 0.98 (0.81–1.19) | 1.05 (0.87–1.28) | 0.600 | 1.09 (0.90–1.31) | 1.06 (0.87–1.28) | 0.566 | |||
| Model 2 | 1.00 | 1.00 (0.81–1.23) | 1.04 (0.85–1.29) | 0.691 | 1.07 (0.87–1.31) | 1.07 (0.87–1.31) | 0.546 | |||
| Model 3 | 1.00 | 1.02 (0.83–1.27) | 1.08 (0.87–1.34) | 0.498 | 9565 | 1.11 (0.90–1.38) | 1.11 (0.90–1.38) | 0.337 | 9564 | |
| Modern Dietary Pattern | ||||||||||
| Model 1 | 1.00 | 1.04 (0.86–1.25) | 1.19 (0.98–1.44) | 0.083 | 1.15 (0.95–1.40) | 1.20 (0.98–1.45) | 0.072 | |||
| Model 2 | 1.00 | 1.05 (0.85–1.29) | 1.18 (0.94–1.48) | 0.172 | 1.19 (0.97–1.46) | 1.22 (0.97–1.53) | 0.086 | |||
| Model 3 | 1.00 | 1.02 (0.83–1.26) | 1.15 (0.91–1.46) | 0.252 | 9564 | 1.18 (0.95–1.45) | 1.23 (0.97–1.55) | 0.084 | 9562 | |
| Plant-Sourced Nutrient Pattern | ||||||||||
| Model 1 | 1.00 | 1.08 (0.88–1.33) | 1.06 (0.83–1.36) | 0.664 | 1.00 (0.82–1.22) | 1.22 (1.00–1.49) * | 0.037 | |||
| Model 2 | 1.00 | 1.16 (0.92–1.46) | 1.13 (0.86–1.49) | 0.411 | 1.03 (0.82–1.28) | 1.27 (1.02–1.58) * | 0.027 | |||
| Model 3 | 1.00 | 1.15 (0.91–1.46) | 1.12 (0.85–1.48) | 0.455 | 9564 | 1.02 (0.81–1.27) | 1.24 (0.99–1.54) | 0.051 | 9561 | |
| Animal-Sourced Nutrient Pattern | ||||||||||
| Model 1 | 1.00 | 1.01 (0.83–1.22) | 1.04 (0.83–1.29) | 0.747 | 1.04 (0.86–1.26) | 1.09 (0.90–1.32) | 0.373 | |||
| Model 2 | 1.00 | 0.97 (0.79–1.19) | 0.99 (0.77–1.26) | 0.901 | 1.10 (0.90–1.35) | 1.14 (0.93–1.41) | 0.209 | |||
| Model 3 | 1.00 | 0.95 (0.77–1.18) | 0.99 (0.77–1.27) | 0.909 | 9565 | 1.10 (0.89–1.35) | 1.18 (0.95–1.47) | 0.126 | 9563 | |
© 2017 by the authors. Licensee MDPI, Basel, Switzerland. This article is an open access article distributed under the terms and conditions of the Creative Commons Attribution (CC BY) license (http://creativecommons.org/licenses/by/4.0/).
Share and Cite
Melaku, Y.A.; Gill, T.K.; Appleton, S.L.; Taylor, A.W.; Adams, R.; Shi, Z. Prospective Associations of Dietary and Nutrient Patterns with Fracture Risk: A 20-Year Follow-Up Study. Nutrients 2017, 9, 1198. https://doi.org/10.3390/nu9111198
Melaku YA, Gill TK, Appleton SL, Taylor AW, Adams R, Shi Z. Prospective Associations of Dietary and Nutrient Patterns with Fracture Risk: A 20-Year Follow-Up Study. Nutrients. 2017; 9(11):1198. https://doi.org/10.3390/nu9111198
Chicago/Turabian StyleMelaku, Yohannes Adama, Tiffany K. Gill, Sarah L. Appleton, Anne W. Taylor, Robert Adams, and Zumin Shi. 2017. "Prospective Associations of Dietary and Nutrient Patterns with Fracture Risk: A 20-Year Follow-Up Study" Nutrients 9, no. 11: 1198. https://doi.org/10.3390/nu9111198