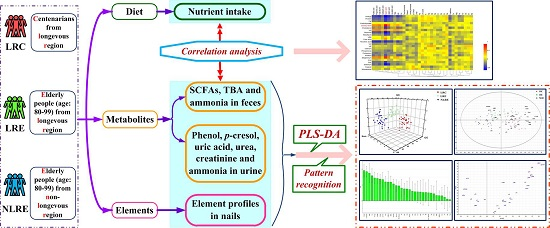
Nutrient Intake Is Associated with Longevity Characterization by Metabolites and Element Profiles of Healthy Centenarians
Abstract
:1. Introduction
2. Materials and Methods
2.1. Participants
2.2. Assessment of Dietary Nutrition Status
2.3. Sample Collection and Preparation
2.4. Analysis of Metabolites in Feces
2.5. Analysis of Metabolites in Urine
2.6. Analysis of Element Profiles in Nails
2.7. Statistical Analysis
3. Results
3.1. Nutrient Intake
3.2. Metabolites in Feces
3.3. Metabolites in Urine
3.4. Element Levels in Fingernails
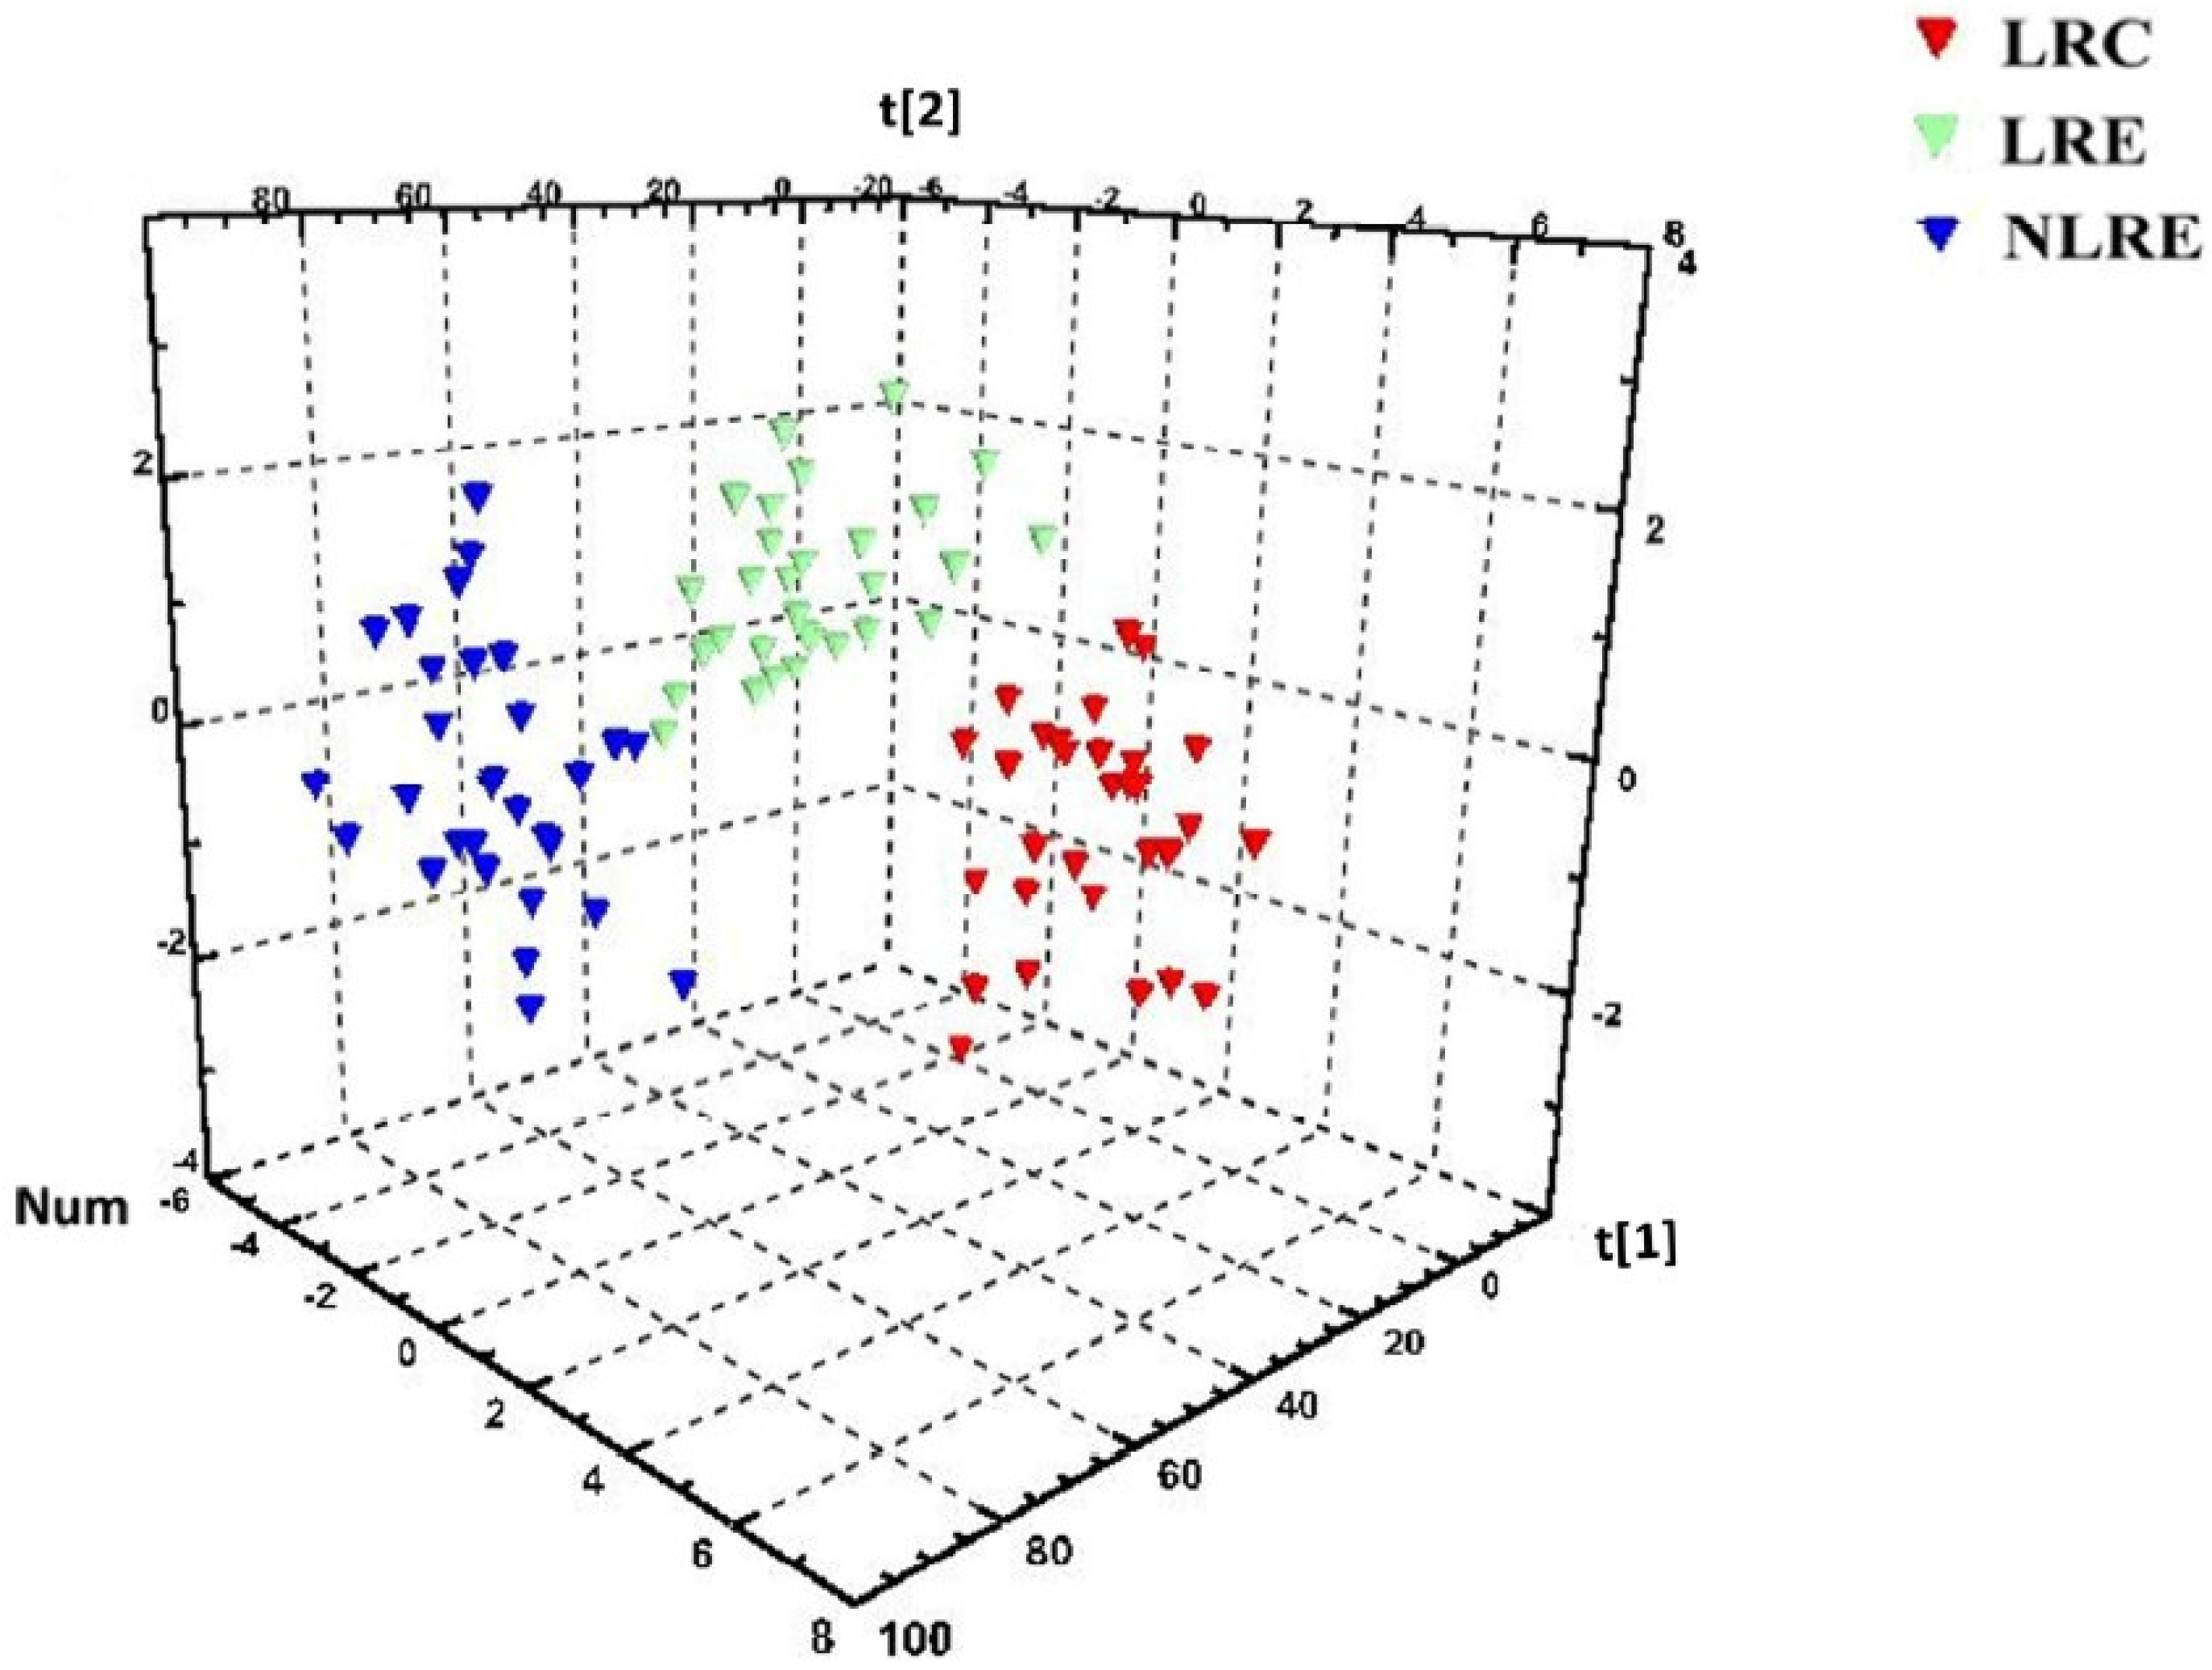
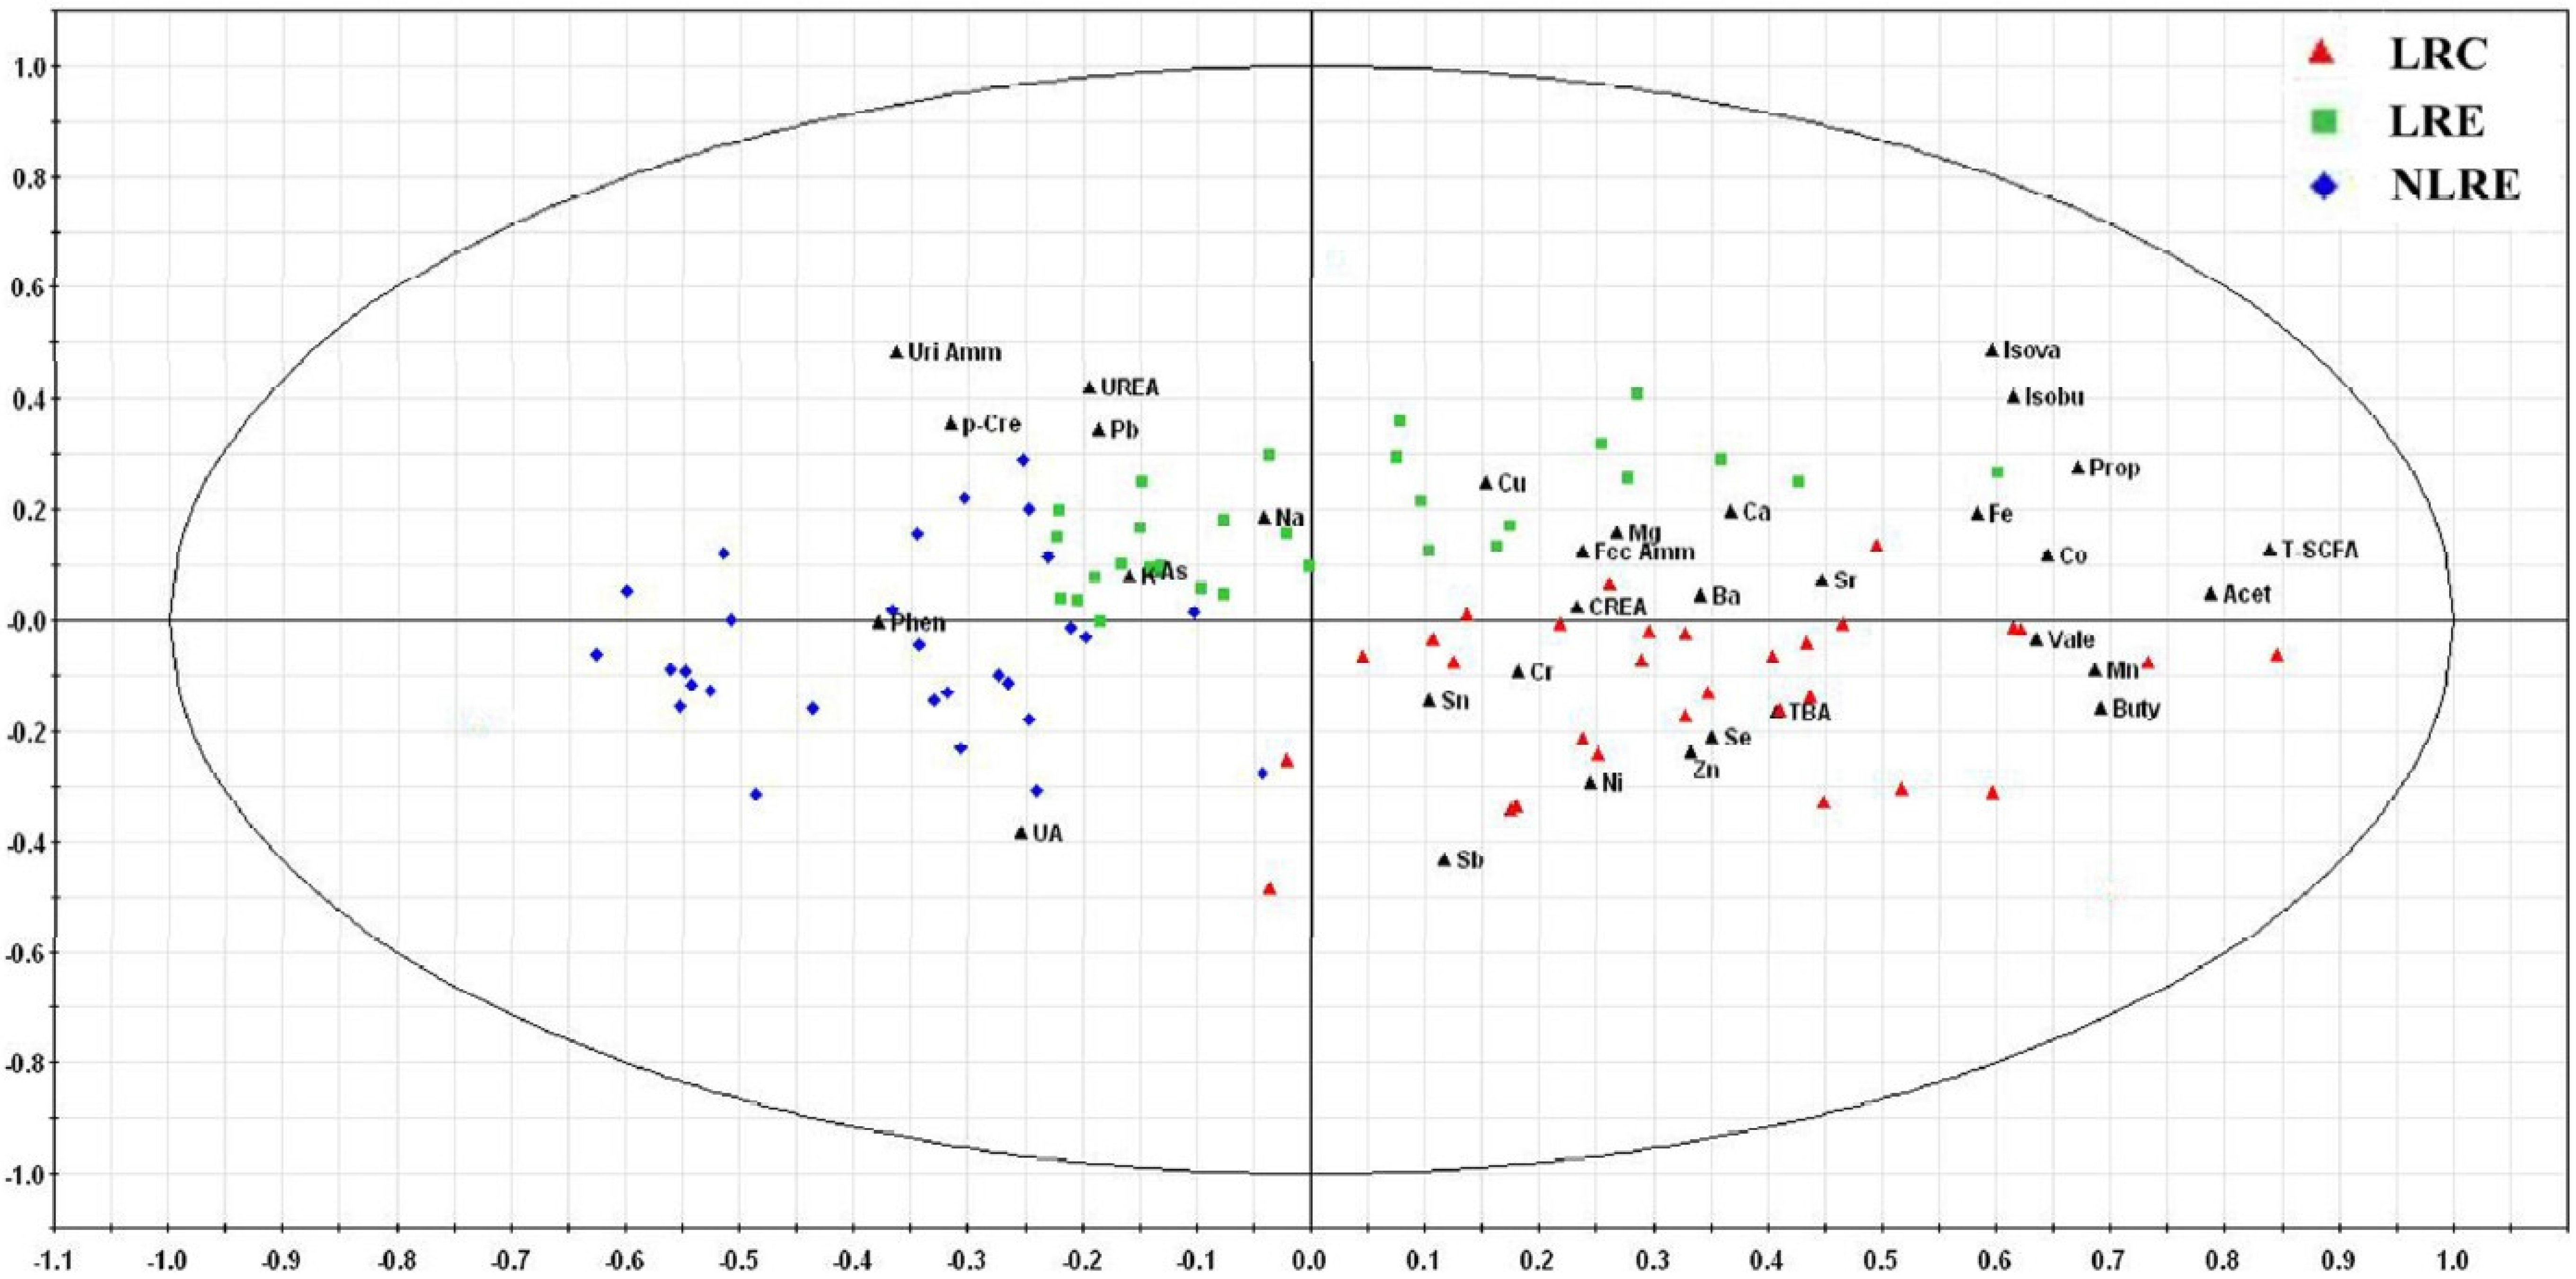
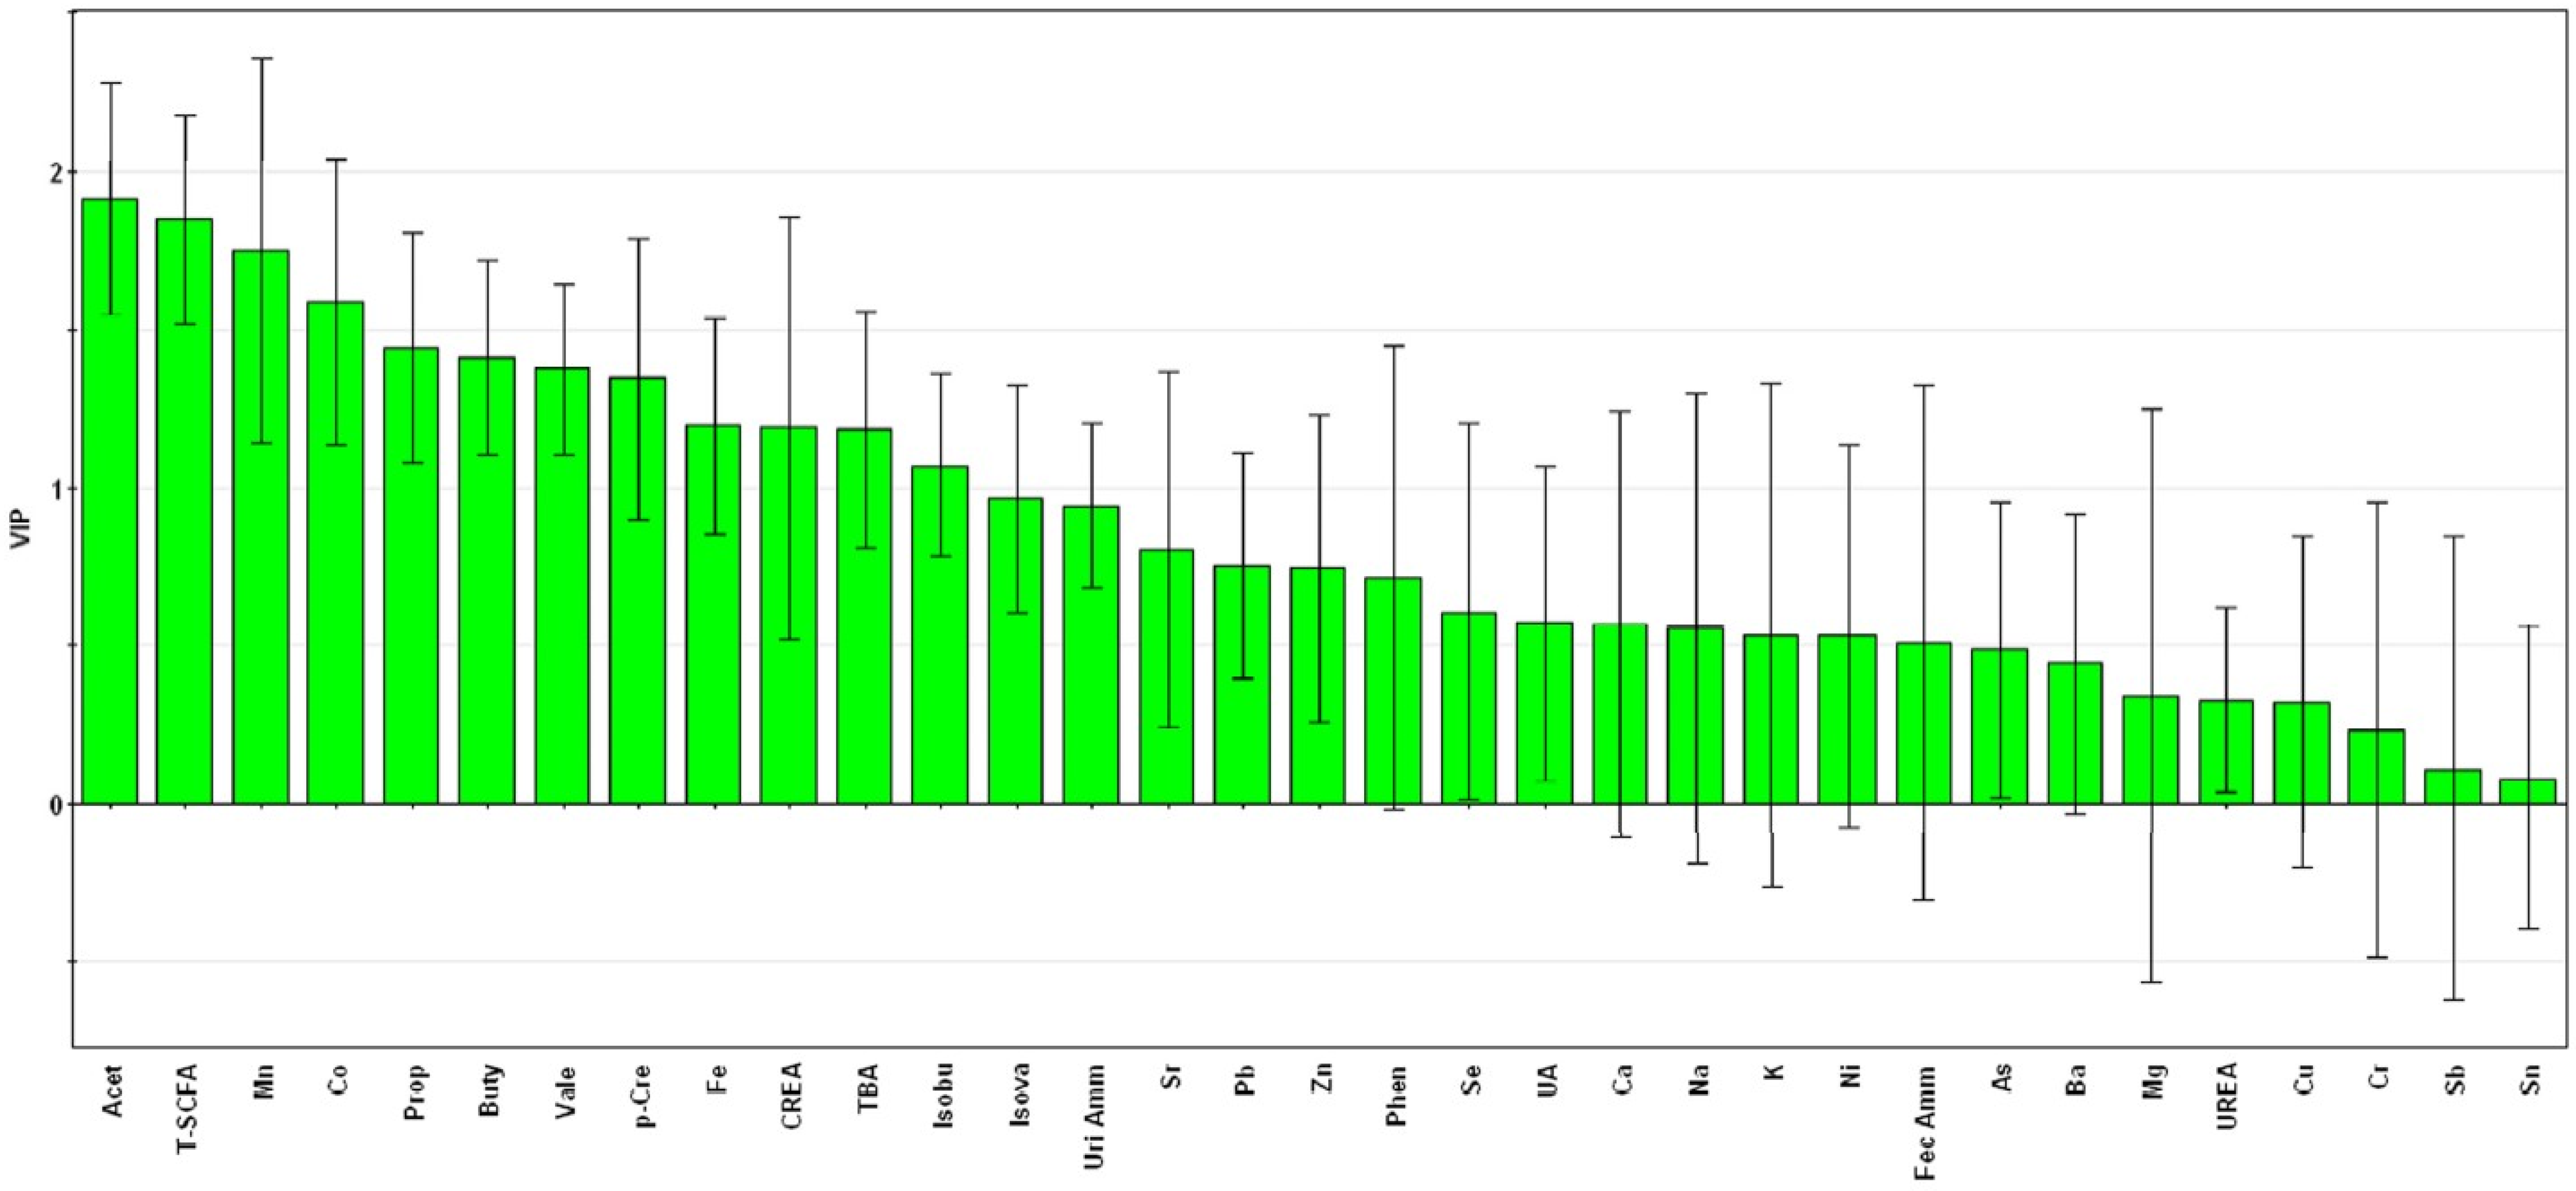
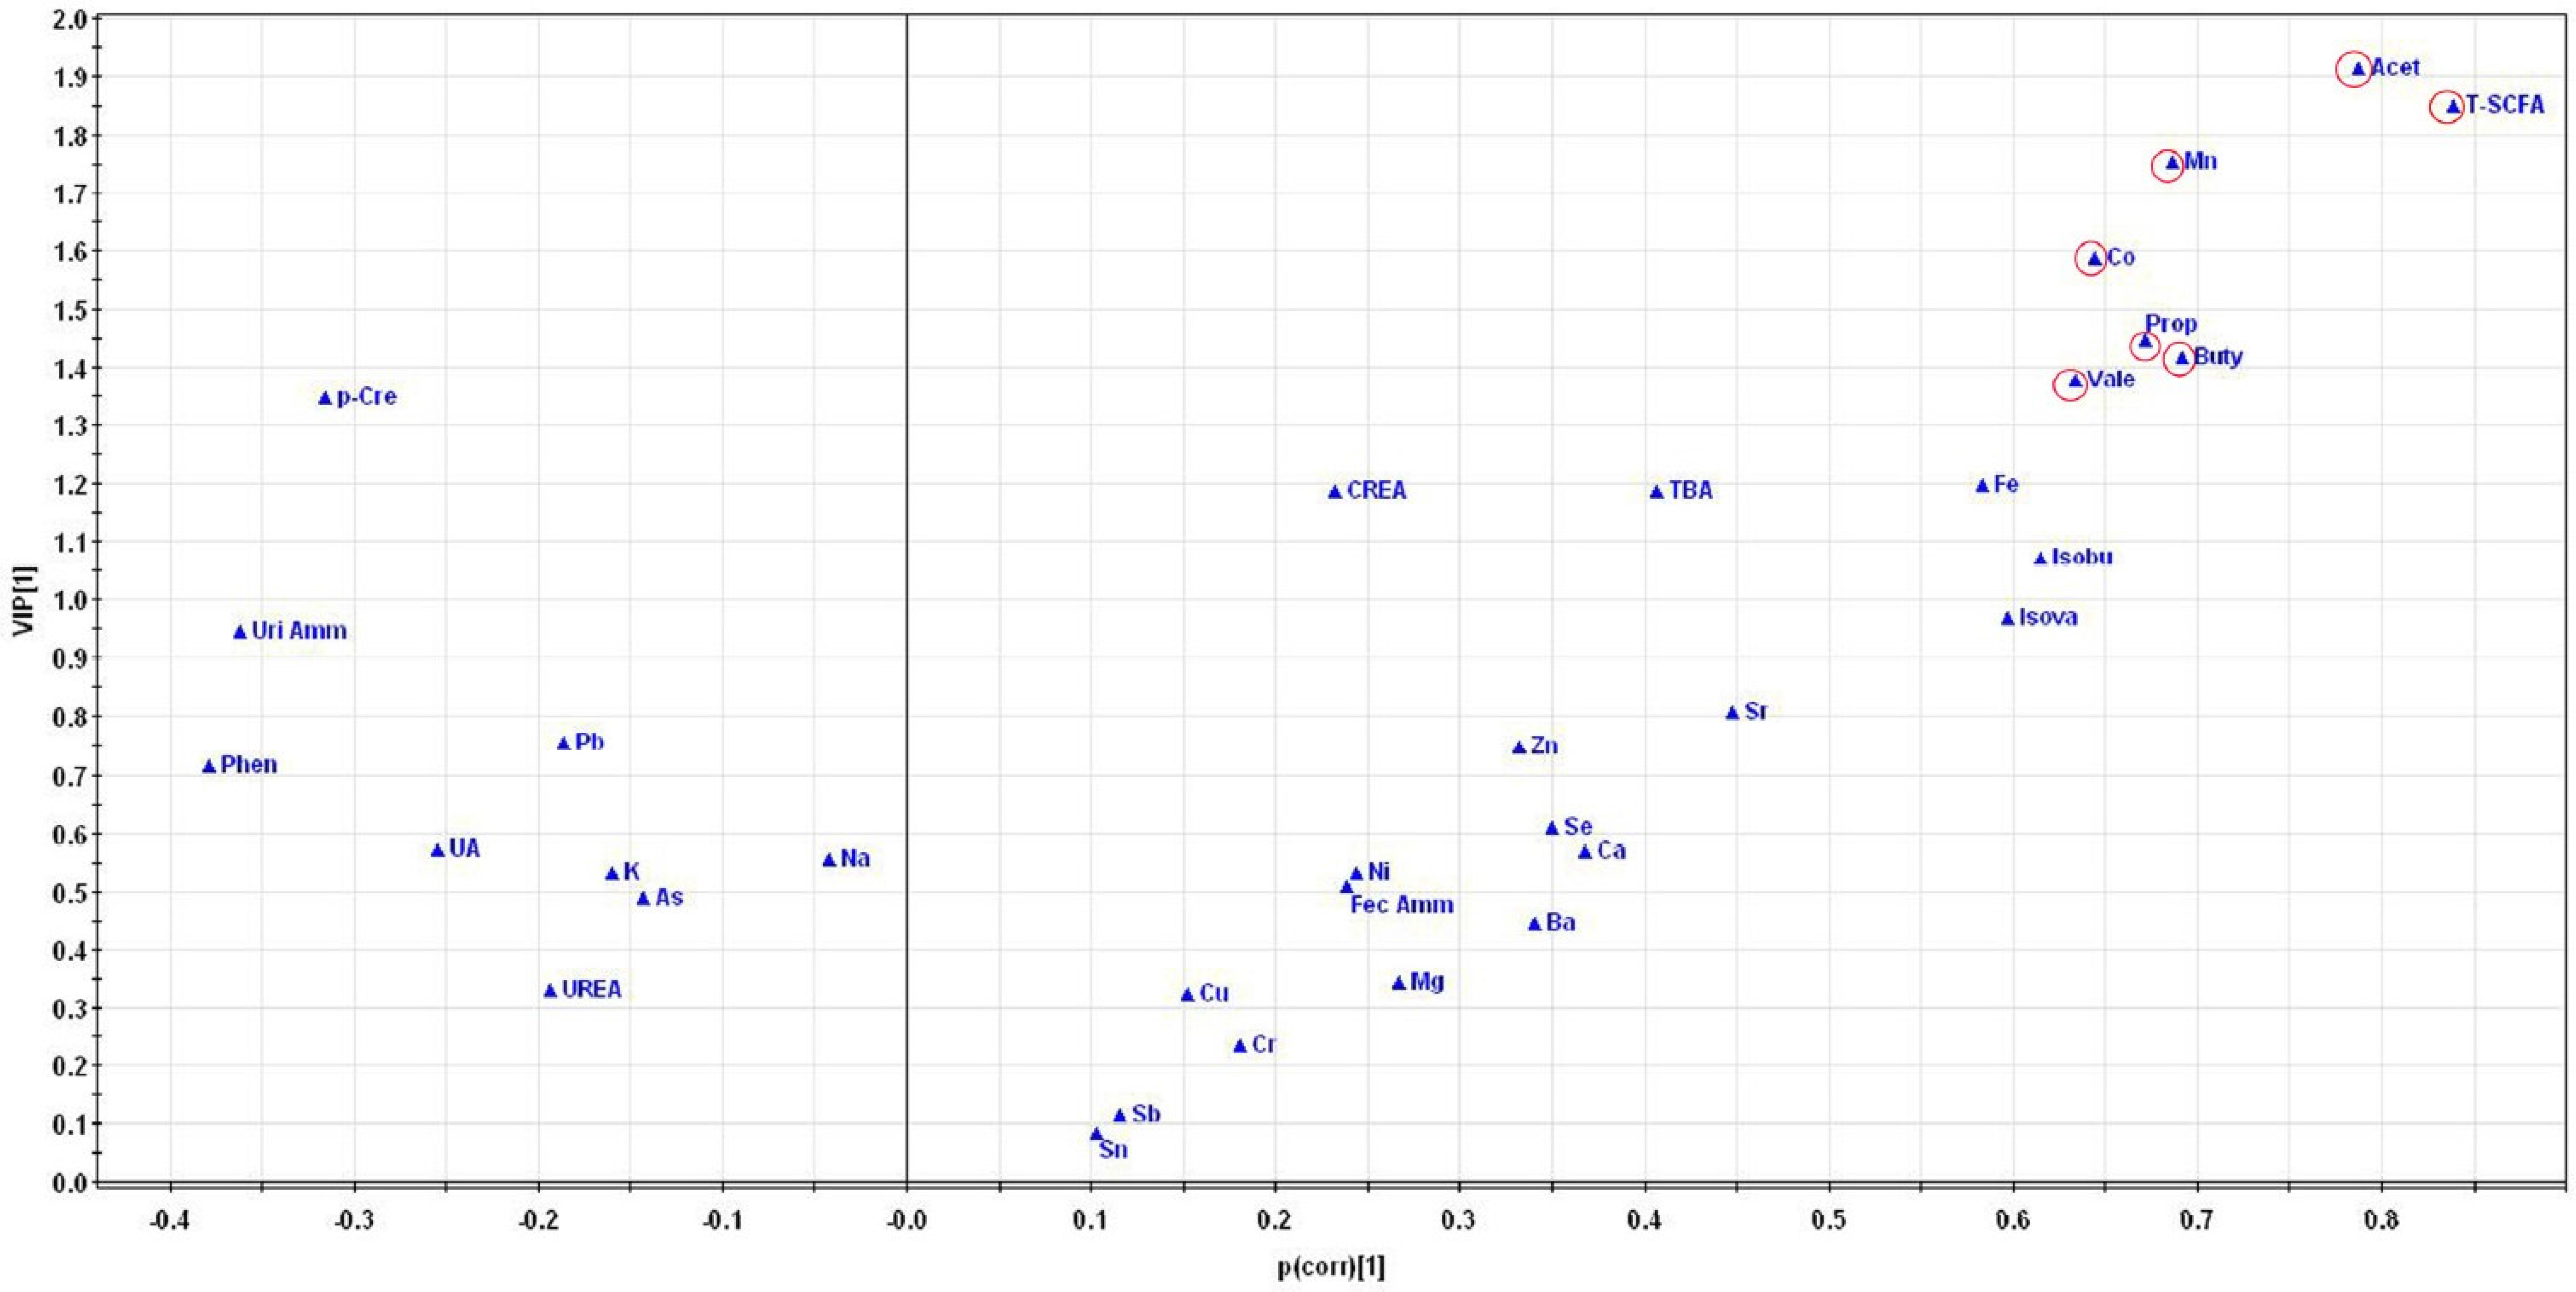
3.5. Pattern Recognition Analysis
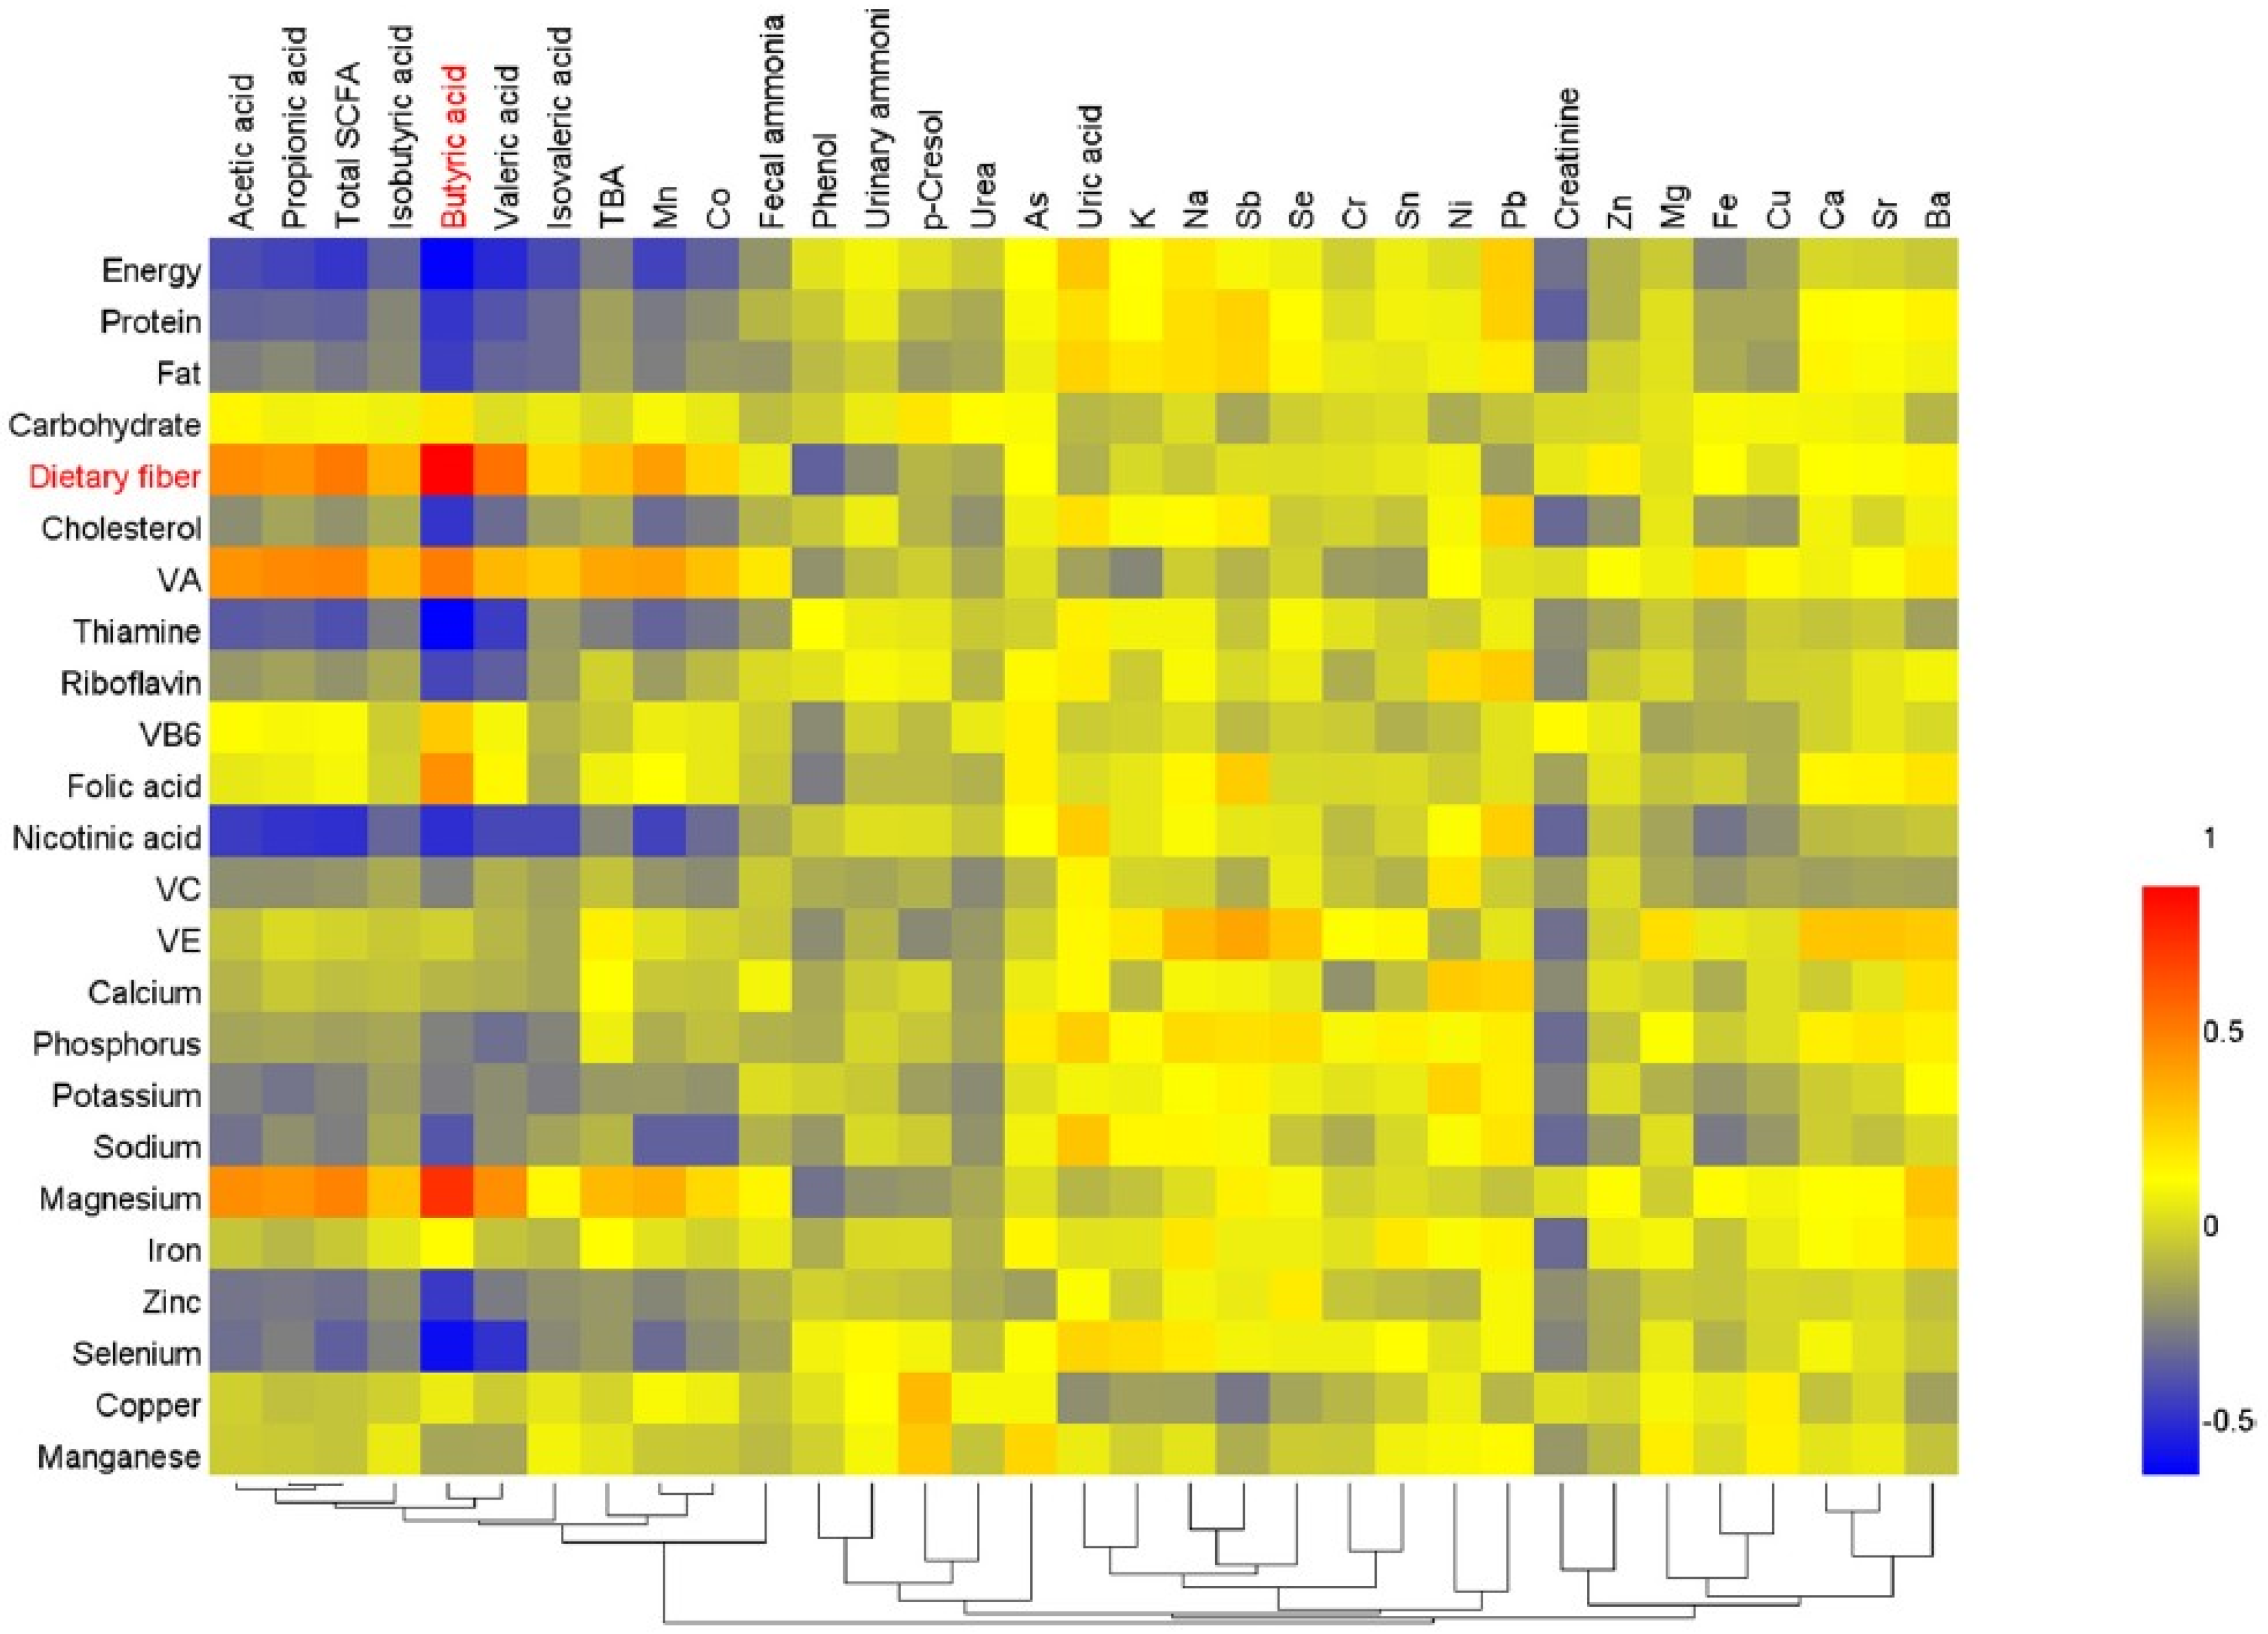
3.6. Correlation Analysis
4. Discussion
5. Conclusions
Acknowledgments
Author Contributions
Conflicts of Interest
References
- Péter, S.; Saris, W.H.M.; Mathers, J.C.; Feskens, E.; Schols, A.; Navis, G.; Kuipers, F.; Weber, P.; Eggersdorfer, M. Nutrient status assessment in individuals and populations for healthy aging—Statement from an expert workshop. Nutrients 2015, 7, 10491–10500. [Google Scholar] [CrossRef] [PubMed]
- Shi, Z.; Zhang, T.; Byles, J.; Martin, S.; Avery, J.C.; Taylor, A.W. Food habits, lifestyle factors and mortality among oldest old Chinese: The Chinese longitudinal healthy longevity survey (CLHLS). Nutrients 2015, 7, 7562–7579. [Google Scholar] [CrossRef] [PubMed]
- Fontana, L.; Partridge, L.; Longo, V.D. Extending healthy life span-from yeast to humans. Science 2010, 328, 321–326. [Google Scholar] [CrossRef] [PubMed]
- Brunner, E.J.; Mosdol, A.; Witte, D.R.; Martikainen, P.; Stafford, M.; Shipley, M.J.; Marmot, M.G. Dietary patterns and 15-year risks of major coronary events, diabetes, and mortality. Am. J. Clin. Nutr. 2008, 87, 1414–1421. [Google Scholar] [PubMed]
- McNiven, E.M.; German, J.B.; Slupsky, C.M. Analytical metabolomics: Nutritional opportunities for personalized health. J. Nutr. Biochem. 2011, 22, 995–1002. [Google Scholar] [CrossRef] [PubMed]
- Wong, J.M.W.; de Souza, R.; Kendall, C.W.C.; Emam, A.; Jenkins, D.J.A. Colonic health: Fermentation and short chain fatty acids. J. Clin. Gastroenterol. 2006, 40, 235–243. [Google Scholar] [CrossRef] [PubMed]
- Nastasi, C.; Candela, M.; Bonefeld, C.M.; Geisler, C.; Hansen, M.; Krejsgaard, T.; Biagi, E.; Andersen, M.H.; Brigidi, P.; Ødum, N.; et al. The effect of short-chain fatty acids on human monocyte-derived dendritic cells. Sci. Rep. 2015, 5, 16148. [Google Scholar] [CrossRef] [PubMed]
- Hambidge, M. Biomarkers of trace mineral intake and status. J. Nutr. 2003, 133, 948S–955S. [Google Scholar] [PubMed]
- Rodrigues, J.L.; Batista, B.L.; Fillion, M.; Passos, C.J.; Mergler, D.; Barbosa, F., Jr. Trace element levels in whole blood of riparian villagers of the Brazilian Amazon. Sci. Total Environ. 2009, 407, 4168–4173. [Google Scholar] [CrossRef] [PubMed]
- Lv, J.; Wang, W.; Zhang, F.; Krafft, T.; Yuan, F.; Li, Y. Identification of human age using trace element concentrations in hair and the support vector machine method. Biol. Trace Elem. Res. 2011, 143, 1441–1450. [Google Scholar] [CrossRef] [PubMed]
- Papp, L.V.; Holmgren, A.; Khanna, K.K. Selenium and selenoproteins in health and disease. Antioxid. Redox Signal. 2010, 12, 793–795. [Google Scholar] [CrossRef] [PubMed]
- Savarino, L.; Granchi, D.; Ciapetti, G.; Cenni, E.; Ravaglia, G.; Forti, P.; Maioli, F.; Mattioli, R. Serum concentrations of zinc and selenium in elderly people: Results in healthy nonagenarians/centenarians. Exp. Gerontol. 2001, 36, 327–339. [Google Scholar] [CrossRef]
- Collino, S.; Montoliu, I.; Martin, F.P.; Scherer, M.; Mari, D.; Salvioli, S.; Bucci, L.; Ostan, R.; Monti, D.; Biagi, E.; et al. Metabolic signatures of extreme longevity in northern Italian centenarians reveal a complex remodeling of lipids, amino acids, and gut microbiota metabolism. PLoS ONE 2013, 8, e56564. [Google Scholar] [CrossRef]
- Boulesteix, A.L.; Strimmer, K. Partial least squares: A versatile tool for the analysis of high-dimensional genomic data. Brief. Bioinform. 2006, 8, 32–44. [Google Scholar] [CrossRef] [PubMed] [Green Version]
- Tan, B.; Qiu, Y.; Zou, X.; Chen, T.; Xie, G.; Cheng, Y.; Dong, T.; Zhao, L.; Feng, B.; Hu, X.; et al. Metabonomics identifies serum metabolite markers of colorectal cancer. J. Proteome Res. 2013, 12, 3000–3009. [Google Scholar] [CrossRef] [PubMed]
- Zhao, T.; Chen, T.; Qiu, Y.; Zou, X.; Li, X.; Su, M.; Yan, C.; Zhao, A.; Jia, W. Trace element profiling using inductively coupled plasma mass spectrometry and its application in an osteoarthritis study. Anal. Chem. 2009, 81, 3683–3692. [Google Scholar] [CrossRef] [PubMed]
- Shi, S.; Liu, S.; Huang, Q.; Huang, F.; Wei, Y. Guangxi Zhuang Autonomous Region 2010 Population Census; China Statistics Press: Beijing, China, 2012. [Google Scholar]
- Chu, H. The Spatial-Temporal Evolution and Influence Factors Analysis of Longevity Level in Southern China. Master’s Thesis, Central China Normal University, Wuhan, China, May 2015. [Google Scholar]
- Lv, J.; Wang, W.; Krafft, T.; Li, Y.; Zhang, F.; Yuan, F. Effects of several environmental factors on longevity and health of the human population of Zhongxiang, Hubei, China. Biol. Trace Elem. Res. 2011, 143, 702–716. [Google Scholar] [CrossRef] [PubMed]
- Wang, Z.; Zeng, Y.; Jeune, B.; Vaupel, J.W. Age validation of Han Chinese centenarians. Genus 1998, 54, 123–141. [Google Scholar] [PubMed]
- Tokudome, S.; Imaeda, N.; Tokudome, Y.; Fujiwara, N.; Nagaya, T.; Sato, J.; Kuriki, K.; Ikeda, M.; Maki, S. Relative validity of a semi-quantitative food frequency questionnaire versus 28 day weighed diet records in Japanese female dietitians. Eur. J. Clin. Nutr. 2001, 55, 735–742. [Google Scholar] [CrossRef] [PubMed]
- Yang, Y.; Wang, G.; Pan, X. China Food Composition; The Peking University Medical Press: Beijing, China, 2009. [Google Scholar]
- Zhuang, M.; Yuan, Z.; Lin, L.; Hu, B.; Wang, X.; Yang, Y.; Chen, X.; Jin, L.; Lu, M.; Ye, W. Reproducibility and relative validity of a food frequency questionnaire developed for adults in Taizhou, China. PLoS ONE 2012, 7, e48341. [Google Scholar] [CrossRef] [PubMed]
- Brinkworth, G.D.; Noakes, M.; Clifton, P.M.; Bird, A.R. Comparative effects of very low-carbohydrate, high-fat and high-carbohydrate, low-fat weight-loss diets on bowel habit and faecal short-chain fatty acids and bacterial populations. Br. J. Nutr. 2009, 101, 1493–1502. [Google Scholar] [CrossRef] [PubMed]
- Bird, A.R.; Vuaran, M.S.; King, R.A.; Noakes, M.; Keogh, J.; Morell, M.K.; Topping, D.L. Wholegrain foods made from a novel high-amylose barley variety (Himalaya 292) improve indices of bowel health in human subjects. Br. J. Nutr. 2008, 99, 1032–1040. [Google Scholar] [CrossRef] [PubMed]
- Ministry of Public Health of China. Determination of Phenol in Urine by Gas Chromatographic Method. WS/T 50-1996; China Standards Press: Beijing, China, 1996. [Google Scholar]
- Samanta, G.; Sharma, R.; Roychowdhury, T.; Chakraborti, D. Arsenic and other elements in hair, nails, and skin-scales of arsenic victims in West Bengal, India. Sci. Total Environ. 2004, 326, 33–47. [Google Scholar] [CrossRef] [PubMed]
- Trygg, J.; Holmes, E.; Lundstedt, T. Chemometrics in metabonomics. J. Proteome Res. 2007, 6, 469–479. [Google Scholar] [CrossRef] [PubMed]
- Wold, S.; Trygg, J.; Berglund, A.; Antti, H. Some recent developments in PLS modeling. Chemometr. Intell. Lab. Syst. 2001, 58, 131–150. [Google Scholar] [CrossRef]
- Wiklund, S.; Johansson, E.; Sjostrom, L.; Mellerowicz, E.J.; Edlund, U.; Shockcor, J.P.; Gottfries, J.; Moritz, T.; Trygg, J. Visualization of GC/TOF-MS-based metabolomics data for identification of biochemically interesting compounds using OPLS class models. Anal. Chem. 2008, 80, 115–122. [Google Scholar] [CrossRef] [PubMed]
- Rios-Avila, L.; Coats, B.; Chi, Y.Y.; Midttun, O.; Ueland, P.M.; Stacpoole, P.W.; Gregory, J.F. Metabolite profile analysis reveals association of vitamin B-6 with metabolites related to one-carbon metabolism and tryptophan catabolism but not with biomarkers of inflammation in oral contraceptive users and reveals the effects of oral contraceptives on these processes. J. Nutr. 2015, 145, 87–95. [Google Scholar] [PubMed]
- Da Silva, V.R.; Rios-Avila, L.; Lamers, Y.; Ralat, M.A.; Midttun, O.; Quinlivan, E.P.; Garrett, T.J.; Coats, B.; Shankar, M.N.; Percival, S.S.; et al. Metabolite profile analysis reveals functional effects of 28-day vitamin B-6 restriction on one-carbon metabolism and tryptophan catabolic pathways in healthy men and women. J. Nutr. 2013, 143, 1719–1727. [Google Scholar] [CrossRef] [PubMed]
- Tan, J.; McKenzie, C.; Potamitis, M.; Thorburn, A.N.; Mackay, C.R.; Macia, L. The role of short-chain fatty acids in health and disease. Adv. Immunol. 2014, 121, 91–119. [Google Scholar] [PubMed]
- Boets, E.; Deroover, L.; Houben, E.; Vermeulen, K.; Gomand, S.V.; Delcour, J.A.; Verbeke, K. Quantification of in vivo colonic short chain fatty acid production from inulin. Nutrients 2015, 7, 8916–8929. [Google Scholar] [CrossRef] [PubMed]
- Kasubuchi, M.; Hasegawa, S.; Hiramatsu, T.; Ichimura, A.; Kimura, I. Dietary gut microbial metabolites, short-chain fatty acids, and host metabolic regulation. Nutrients 2015, 7, 2839–2849. [Google Scholar] [CrossRef] [PubMed] [Green Version]
- Vadder, F.D.; Kovatcheva-Datchary, P.; Goncalves, D.; Vinera, J.; Zitoun, C.; Duchampt, A.; Backhed, F.; Mithieux, G. Microbiota-generated metabolites promote metabolic benefits via gut-brain neural circuits. Cell 2014, 156, 84–96. [Google Scholar] [CrossRef] [PubMed]
- Thibault, R.; Blachier, F.; Darcy-Vrillon, B.; de Coppet, P.; Bourreille, A.; Segain, J.P. Butyrate utilization by the colonic mucosa in inflammatory bowel diseases: A transport deficiency. Inflamm. Bowel Dis. 2010, 16, 684–695. [Google Scholar] [CrossRef] [PubMed]
- Bingham, S.A. Diet and colorectal cancer prevention. Biochem. Soc. Trans. 2000, 28, 12–16. [Google Scholar] [CrossRef] [PubMed]
- Xie, G.; Li, X.; Li, H.; Jia, W. Toward personalized nutrition: comprehensive phytoprofiling and metabotyping. J. Proteome Res. 2013, 12, 1547–1559. [Google Scholar] [CrossRef] [PubMed]
- Walsh, M.C.; Brennan, L.; Pujos-Guillot, E.; Sébédio, J.L.; Scalbert, A.; Fagan, A.; Higgins, D.G.; Gibney, M.J. Influence of acute phytochemical intake on human urinary metabolomic profiles. Am. J. Clin. Nutr. 2007, 86, 1687–1693. [Google Scholar] [PubMed]
- Holmes, E.; Loo, R.L.; Stamler, J.; Bictash, M.; Yap, I.K.; Chan, Q.; Ebbels, T.; de Iorio, M.; Brown, I.J.; Veselkov, K.A.; et al. Human metabolic phenotype diversity and its association with diet and blood pressure. Nature 2008, 453, 396–400. [Google Scholar] [CrossRef] [PubMed]
- Miller, A.F. Superoxide dismutases: Ancient enzymes and new insights. FEBS Lett. 2012, 586, 585–595. [Google Scholar] [CrossRef] [PubMed]
- Carneiro, M.F.H.; Grotto, D.; Batista, B.L.; Rhoden, C.R.; Barbosa, F., Jr. Background values for essential and toxic elements in children’s nails and correlation with hair levels. Biol. Trace Elem. Res. 2011, 144, 339–350. [Google Scholar] [CrossRef] [PubMed]
- Okamoto, S.; Eltis, L.D. The biological occurrence and trafficking of cobalt. Metallomics 2011, 3, 963–970. [Google Scholar] [CrossRef] [PubMed]
- Vignon, M. Inference in morphological taxonomy using collinear data and small sample sizes: Monogenean sclerites (Platyhelminthes) as a case study. Zool. Scr. 2011, 40, 306–316. [Google Scholar] [CrossRef]
- Su, M.; Zheng, X.Y.; Zhang, T.; Pei, L.; Wang, F.; Zheng, X.; Gu, X.; Song, X.; Lu, X.; Chen, G.; et al. Integrated profiling of metabolites and trace elements reveals a multifaceted malnutrition in pregnant women from a region with a high prevalence of congenital malformations. Metabolomics 2012, 8, 831–844. [Google Scholar] [CrossRef]
- Brereton, R.G. Pattern recognition in chemometrics. Chemometr. Intell. Lab. Syst. 2015, 149, 90–96. [Google Scholar] [CrossRef]
- Gromski, P.S.; Muhamadali, H.; Ellis, D.I.; Xu, Y.; Correa, E.; Turner, M.L.; Goodacre, R. A tutorial review: Metabolomics and partial least squares-discriminant analysis—A marriage of convenience or a shotgun wedding. Anal. Chim. Acta 2015, 879, 10–23. [Google Scholar] [CrossRef] [PubMed]
- Gou, X.; Tao, Q.; Feng, Q.; Peng, J.; Sun, S.; Cao, H.; Zheng, N.; Zhang, Y.; Hu, Y.; Liu, P. Urinary metabonomics characterization of liver fibrosis induced by CCl4 in rats and intervention effects of Xia Yu Xue Decoction. J. Pharmaceut. Biomed. Anal. 2013, 74, 62–65. [Google Scholar] [CrossRef] [PubMed]
- Selman, C.; Kerrison, N.D.; Cooray, A.; Piper, M.D.W.; Lingard, S.J.; Barton, R.H.; Schuster, E.F.; Blanc, E.; Gems, D.; Nicholson, J.K.; et al. Coordinated multitissue transcriptional and plasma metabonomic profiles following acute caloric restriction in mice. Physiol. Genom. 2006, 27, 187–200. [Google Scholar] [CrossRef] [PubMed]
- Wijeyesekera, A.; Selman, C.; Barton, R.H.; Holmes, E.; Nicholson, J.K.; Withers, D.J. Metabotyping of long-lived mice using 1H NMR spectroscopy. J. Proteome Res. 2012, 11, 2224–2235. [Google Scholar] [CrossRef] [PubMed]
- Nilsson, U.; Nyman, M. Short-chain fatty acid formation in the hindgut of rats fed oligosaccharides varying in monomeric composition, degree of polymerisation and solubility. Br. J. Nutr. 2005, 94, 705–713. [Google Scholar] [CrossRef] [PubMed]
- Jakobsdottir, G.; Xu, J.; Molin, G.; Ahrne, S.; Nyman, M. High-fat diet reduces the formation of butyrate, but increases succinate, inflammation, liver fat and cholesterol in rats, while dietary fibre counteracts these effects. PLoS ONE 2013, 8, e80476. [Google Scholar] [CrossRef] [PubMed]
- Bird, A.R.; Flory, C.; Davies, D.A.; Usher, S.; Topping, D.L. A novel barley cultivar (Himalaya 292) with a specific gene mutation in starch synthase lla raises large bowel starch and short-chain fatty acids in rats. J. Nutr. 2004, 134, 831–835. [Google Scholar] [PubMed]
- Bird, A.R.; Hayakawa, T.; Marsono, Y.; Gooden, J.M.; Record, I.R.; Correll, R.L.; Topping, D.L. Coarse brown rice increases fecal and large bowel short-chain fatty acids and starch but lowers calcium in the large bowel of pigs. J. Nutr. 2000, 130, 1780–1787. [Google Scholar] [PubMed]
- McOrist, A.L.; Abell, G.C.; Cooke, C.; Nyland, K. Bacterial population dynamics and faecal short-chain fatty acid (SCFA) concentrations in healthy humans. Br. J. Nutr. 2008, 100, 138–146. [Google Scholar] [CrossRef] [PubMed]
- Tokudome, Y.; Imaeda, N.; Nagaya, T.; Ikeda, M.; Fujiwara, N.; Sato, J.; Kuriki, K.; Kikuchi, S.; Maki, S.; Tokudome, S. Daily, weekly, seasonal, within- and between-individual variation in nutrient intake according to four season consecutive 7 day weighed diet records in Japanese female dietitians. J. Epidemiol. 2002, 12, 85–92. [Google Scholar] [CrossRef] [PubMed]
- Davinelli, S.; Willcox, D.C.; Scapagnini, G. Extending healthy ageing: nutrient sensitive pathway and centenarian population. Immun. Ageing 2012, 9, 9. [Google Scholar] [CrossRef] [PubMed]

| Characteristics | LRC Group | LRE Group | NLRE Group |
|---|---|---|---|
| Age (year) | 103 ± 3 | 87 ± 5 | 88 ± 4 |
| Sex (M/F) | 11/19 | 12/18 | 13/17 |
| Height (cm) | 145.9 ± 10.6 | 150.8 ± 7.7 | 157.0 ± 12.0 |
| Weight (kg) | 43.1 ± 10.0 | 45.6 ± 6.5 | 59.1 ± 8.3 |
| Body mass index (kg/m2) | 20.0 ± 2.8 | 20.1 ± 3.1 | 23.9 ± 1.4 |
| Nutrient | LRC Group | LRE Group | NLRE Group | p |
|---|---|---|---|---|
| Energy (Kcal) | 1220.30 ± 134.60 a | 1237.20 ± 154.45 a | 1520.10 ± 215.62 b | 0.000 |
| Protein (g) | 38.90 ± 7.39 a | 36.83 ± 8.61 a | 53.48 ± 14.84 b | 0.000 |
| Fat (g) | 42.24 ± 15.78 a | 39.16 ± 13.02 a | 67.93 ± 25.00 b | 0.000 |
| Carbohydrate (g) | 172.56 ± 20.54 a | 180.12 ± 24.91 a | 167.80 ± 32.05 a | 0.343 |
| Dietary fiber (g) | 23.48 ± 8.26 a | 13.90 ± 6.21 b | 13.77 ± 5.86 b | 0.000 |
| Cholesterol (mg) | 110.73 ± 71.64 a | 124.43 ± 121.97 a | 238.67 ± 130.94 b | 0.001 |
| Vitamin A (μgRE) | 1308.37 ± 439.39 a | 1181.73 ± 370.05 a,b | 956.47 ± 496.79 b | 0.001 |
| Thiamine (mg) | 0.48 ± 0.16 a | 0.57 ± 0.14 a,b | 0.60 ± 0.11 b | 0.002 |
| Riboflavin (mg) | 0.61 ± 0.11 a | 0.62 ± 0.17 a | 0.84 ± 0.30 b | 0.007 |
| Vitamin B6 (mg) | 0.18 ± 0.08 a | 0.13 ± 0.06 b | 0.17 ± 0.10 a,b | 0.040 |
| Folic acid (μg) | 67.36 ± 41.75 a | 37.81 ± 30.09 b | 57.48 ± 23.88 a | 0.002 |
| Nicotinic acid (mg) | 7.93 ± 2.30 a | 7.65 ± 1.86 a | 11.88 ± 3.38 b | 0.000 |
| Vitamin C (mg) | 61.45 ± 20.02 a,b | 51.64 ± 19.06 a | 68.49 ± 23.20 b | 0.014 |
| Vitamin E (mg) | 8.16 ± 3.65 a,b | 6.28 ± 3.41 a | 9.15 ± 3.95 b | 0.014 |
| Calcium (mg) | 481.90 ± 87.48 a,b | 421.93 ± 127.94 a | 511.83 ± 158.33 b | 0.003 |
| Phosphorus (mg) | 602.77 ± 74.36 a,b | 569.13 ± 113.71 a | 779.93 ± 223.26 b | 0.001 |
| Potassium (mg) | 1433.00 ± 203.42 a,b | 1269.13 ± 197.30 a | 1546.33 ± 252.80 b | 0.000 |
| Sodium (mg) | 1817.67 ± 222.17 a | 1854.26 ± 474.14 a | 2144.78 ± 471.59 b | 0.000 |
| Magnesium (mg) | 354.73 ± 71.19 a | 283.73 ± 78.90 b | 276.95 ± 80.48 b | 0.000 |
| Iron (mg) | 14.64 ± 4.40 a | 13.85 ± 3.69 a | 15.26 ± 3.11 a | 0.058 |
| Zinc (mg) | 5.40 ± 1.35 a | 6.10 ± 1.74 a | 6.35 ± 1.96 a | 0.062 |
| Selenium (μg) | 13.86 ± 5.36 a | 15.36 ± 4.82 a,b | 17.68 ± 4.10 b | 0.001 |
| Copper (mg) | 2.08 ± 2.11 a | 3.09 ± 2.12 a | 2.06 ± 1.89 a | 0.067 |
| Manganese (mg) | 3.19 ± 0.83 a | 3.60 ± 0.70 a | 3.68 ± 1.16 a | 0.145 |
| Metabolite | LRC Group | LRE Group | NLRE Group | p |
|---|---|---|---|---|
| Acetic acid (µg/g) | 2539.47 ± 875.80 a | 1825.13 ± 527.79 b | 1016.17 ± 644.02 c | 0.000 |
| Propionic acid (µg/g) | 875.53 ± 363.69 a | 830.80 ± 506.01 a | 326.67 ± 214.75 b | 0.000 |
| Isobutyric acid (µg/g) | 195.03 ± 75.92 a | 186.18 ± 113.04 a | 109.51 ± 67.54 b | 0.000 |
| Butyric acid (µg/g) | 780.61 ± 587.01 a | 365.33 ± 291.05 b | 226.99 ± 153.17 b | 0.000 |
| Isovaleric acid (µg/g) | 358.19 ± 184.83 a | 388.27 ± 254.08 a | 185.15 ± 138.60 b | 0.000 |
| Valeric acid (µg/g) | 223.48 ± 76.80 a | 157.93 ± 93.42 b | 121.77 ± 49.31 b | 0.000 |
| Total SCFA (µg/g) | 4972.31 ± 1773.99 a | 3753.63 ± 1355.86 b | 1986.27 ± 1175.16 c | 0.000 |
| Total bile acids (μmol/g) | 0.15 ± 0.06 a | 0.10 ± 0.04 b | 0.08 ± 0.07 b | 0.000 |
| Fecal ammonia (mg/g) | 0.68 ± 0.28 a | 0.59 ± 0.22 a | 0.56 ± 0.33 a | 0.126 |
| Metabolite | LRC Group | LRE Group | NLRE Group | p |
|---|---|---|---|---|
| Phenol (mg/L) | 13.32 ± 16.02 a | 19.60 ± 8.26 b | 25.79 ± 29.46 b | 0.003 |
| p-Cresol (mg/L) | 65.52 ± 25.08 a | 98.26 ± 31.50 b | 109.52 ± 40.77 b | 0.000 |
| Uric acid (μmol/L) | 974.63 ± 525.26 a | 830.97 ± 251.23 a | 1147.03 ± 191.99 b | 0.000 |
| Urea (mmol/L) | 285.02 ± 132.62 a | 371.80 ± 106.73 b | 325.96 ± 151.43 ab | 0.027 |
| Creatinine (μmol/L) | 7672.50 ± 5840.73 a | 5776.94 ± 1258.51 a | 3791.72 ± 1119.87 b | 0.000 |
| Urinary ammonia (μg/μL) | 0.29 ± 0.15 a | 0.48 ± 0.17 b | 0.50 ± 0.35 b | 0.001 |
| Element | LRC Group | LRE Group | NLRE Group | p |
|---|---|---|---|---|
| Na (μg/L) | 107.836 ± 106.206 a | 136.393 ± 122.729 a | 164.905 ± 127.408 a | 0.208 |
| Mg (μg/L) | 61.143 ± 30.351 a | 62.514 ± 18.946 a | 53.848 ± 26.503 a | 0.332 |
| K (μg/L) | 5.658 ± 8.982 a | 4.759 ± 7.180 a | 18.521 ± 48.124 a | 0.355 |
| Ca (μg/L) | 869.077 ± 452.755 a | 850.038 ± 488.529 a | 650.867 ± 407.325 a | 0.170 |
| Mn (μg/L) | 3.051 ± 2.294 a | 1.499 ± 0.822 a | 0.353 ± 0.368 b | 0.000 |
| Fe (μg/L) | 38.153 ± 15.967 a | 40.478 ± 25.144 a | 16.162 ± 15.351 b | 0.000 |
| Cu (μg/L) | 4.579 ± 1.409 a | 5.547 ± 2.592 a | 3.936 ± 3.153 b | 0.000 |
| Zn (μg/L) | 137.406 ± 43.331 a | 118.979 ± 24.022 a,b | 112.877 ± 40.170 b | 0.012 |
| As (μg/L) | 0.138 ± 0.091 a | 0.241 ± 0.315 a | 0.289 ± 0.521 a | 0.061 |
| Sn (μg/L) | 1.029 ± 2.994 a | 0.567 ± 1.172 a | 0.866 ± 1.679 a | 0.730 |
| Sb (μg/L) | 0.126 ± 0.167 a | 0.059 ± 0.071 a | 0.111 ± 0.131 a | 0.306 |
| Pb (μg/L) | 0.140 ± 0.153 a | 0.311 ± 0.244 b | 0.279 ± 0.181 b | 0.000 |
| Cr (μg/L) | 0.957 ± 1.058 a | 0.763 ± 0.824 a | 0.743 ± 1.268 a | 0.071 |
| Co (μg/L) | 0.030 ± 0.015 a | 0.024 ± 0.017 a | 0.007 ± 0.010 b | 0.000 |
| Ni (μg/L) | 2.130 ± 4.765 a | 0.410 ± 0.301 b | 0.785 ± 0.689 a,b | 0.009 |
| Se (μg/L) | 0.476 ± 0.293 a | 0.267 ± 0.255 b | 0.315 ± 0.314 a,b | 0.020 |
| Sr (μg/L) | 0.561 ± 0.391 a | 0.449 ± 0.325 a | 0.329 ± 0.246 a | 0.058 |
| Ba (μg/L) | 0.879 ± 0.783 a | 0.745 ± 0.603 a | 0.636 ± 0.473 a | 0.605 |
© 2016 by the authors; licensee MDPI, Basel, Switzerland. This article is an open access article distributed under the terms and conditions of the Creative Commons Attribution (CC-BY) license (http://creativecommons.org/licenses/by/4.0/).
Share and Cite
Cai, D.; Zhao, S.; Li, D.; Chang, F.; Tian, X.; Huang, G.; Zhu, Z.; Liu, D.; Dou, X.; Li, S.; et al. Nutrient Intake Is Associated with Longevity Characterization by Metabolites and Element Profiles of Healthy Centenarians. Nutrients 2016, 8, 564. https://doi.org/10.3390/nu8090564
Cai D, Zhao S, Li D, Chang F, Tian X, Huang G, Zhu Z, Liu D, Dou X, Li S, et al. Nutrient Intake Is Associated with Longevity Characterization by Metabolites and Element Profiles of Healthy Centenarians. Nutrients. 2016; 8(9):564. https://doi.org/10.3390/nu8090564
Chicago/Turabian StyleCai, Da, Shancang Zhao, Danlei Li, Fang Chang, Xiangxu Tian, Guohong Huang, Zhenjun Zhu, Dong Liu, Xiaowei Dou, Shubo Li, and et al. 2016. "Nutrient Intake Is Associated with Longevity Characterization by Metabolites and Element Profiles of Healthy Centenarians" Nutrients 8, no. 9: 564. https://doi.org/10.3390/nu8090564
APA StyleCai, D., Zhao, S., Li, D., Chang, F., Tian, X., Huang, G., Zhu, Z., Liu, D., Dou, X., Li, S., Zhao, M., & Li, Q. (2016). Nutrient Intake Is Associated with Longevity Characterization by Metabolites and Element Profiles of Healthy Centenarians. Nutrients, 8(9), 564. https://doi.org/10.3390/nu8090564


