Associations between Macronutrient Intake and Obstructive Sleep Apnoea as Well as Self-Reported Sleep Symptoms: Results from a Cohort of Community Dwelling Australian Men


Abstract
:1. Introduction
2. Methods
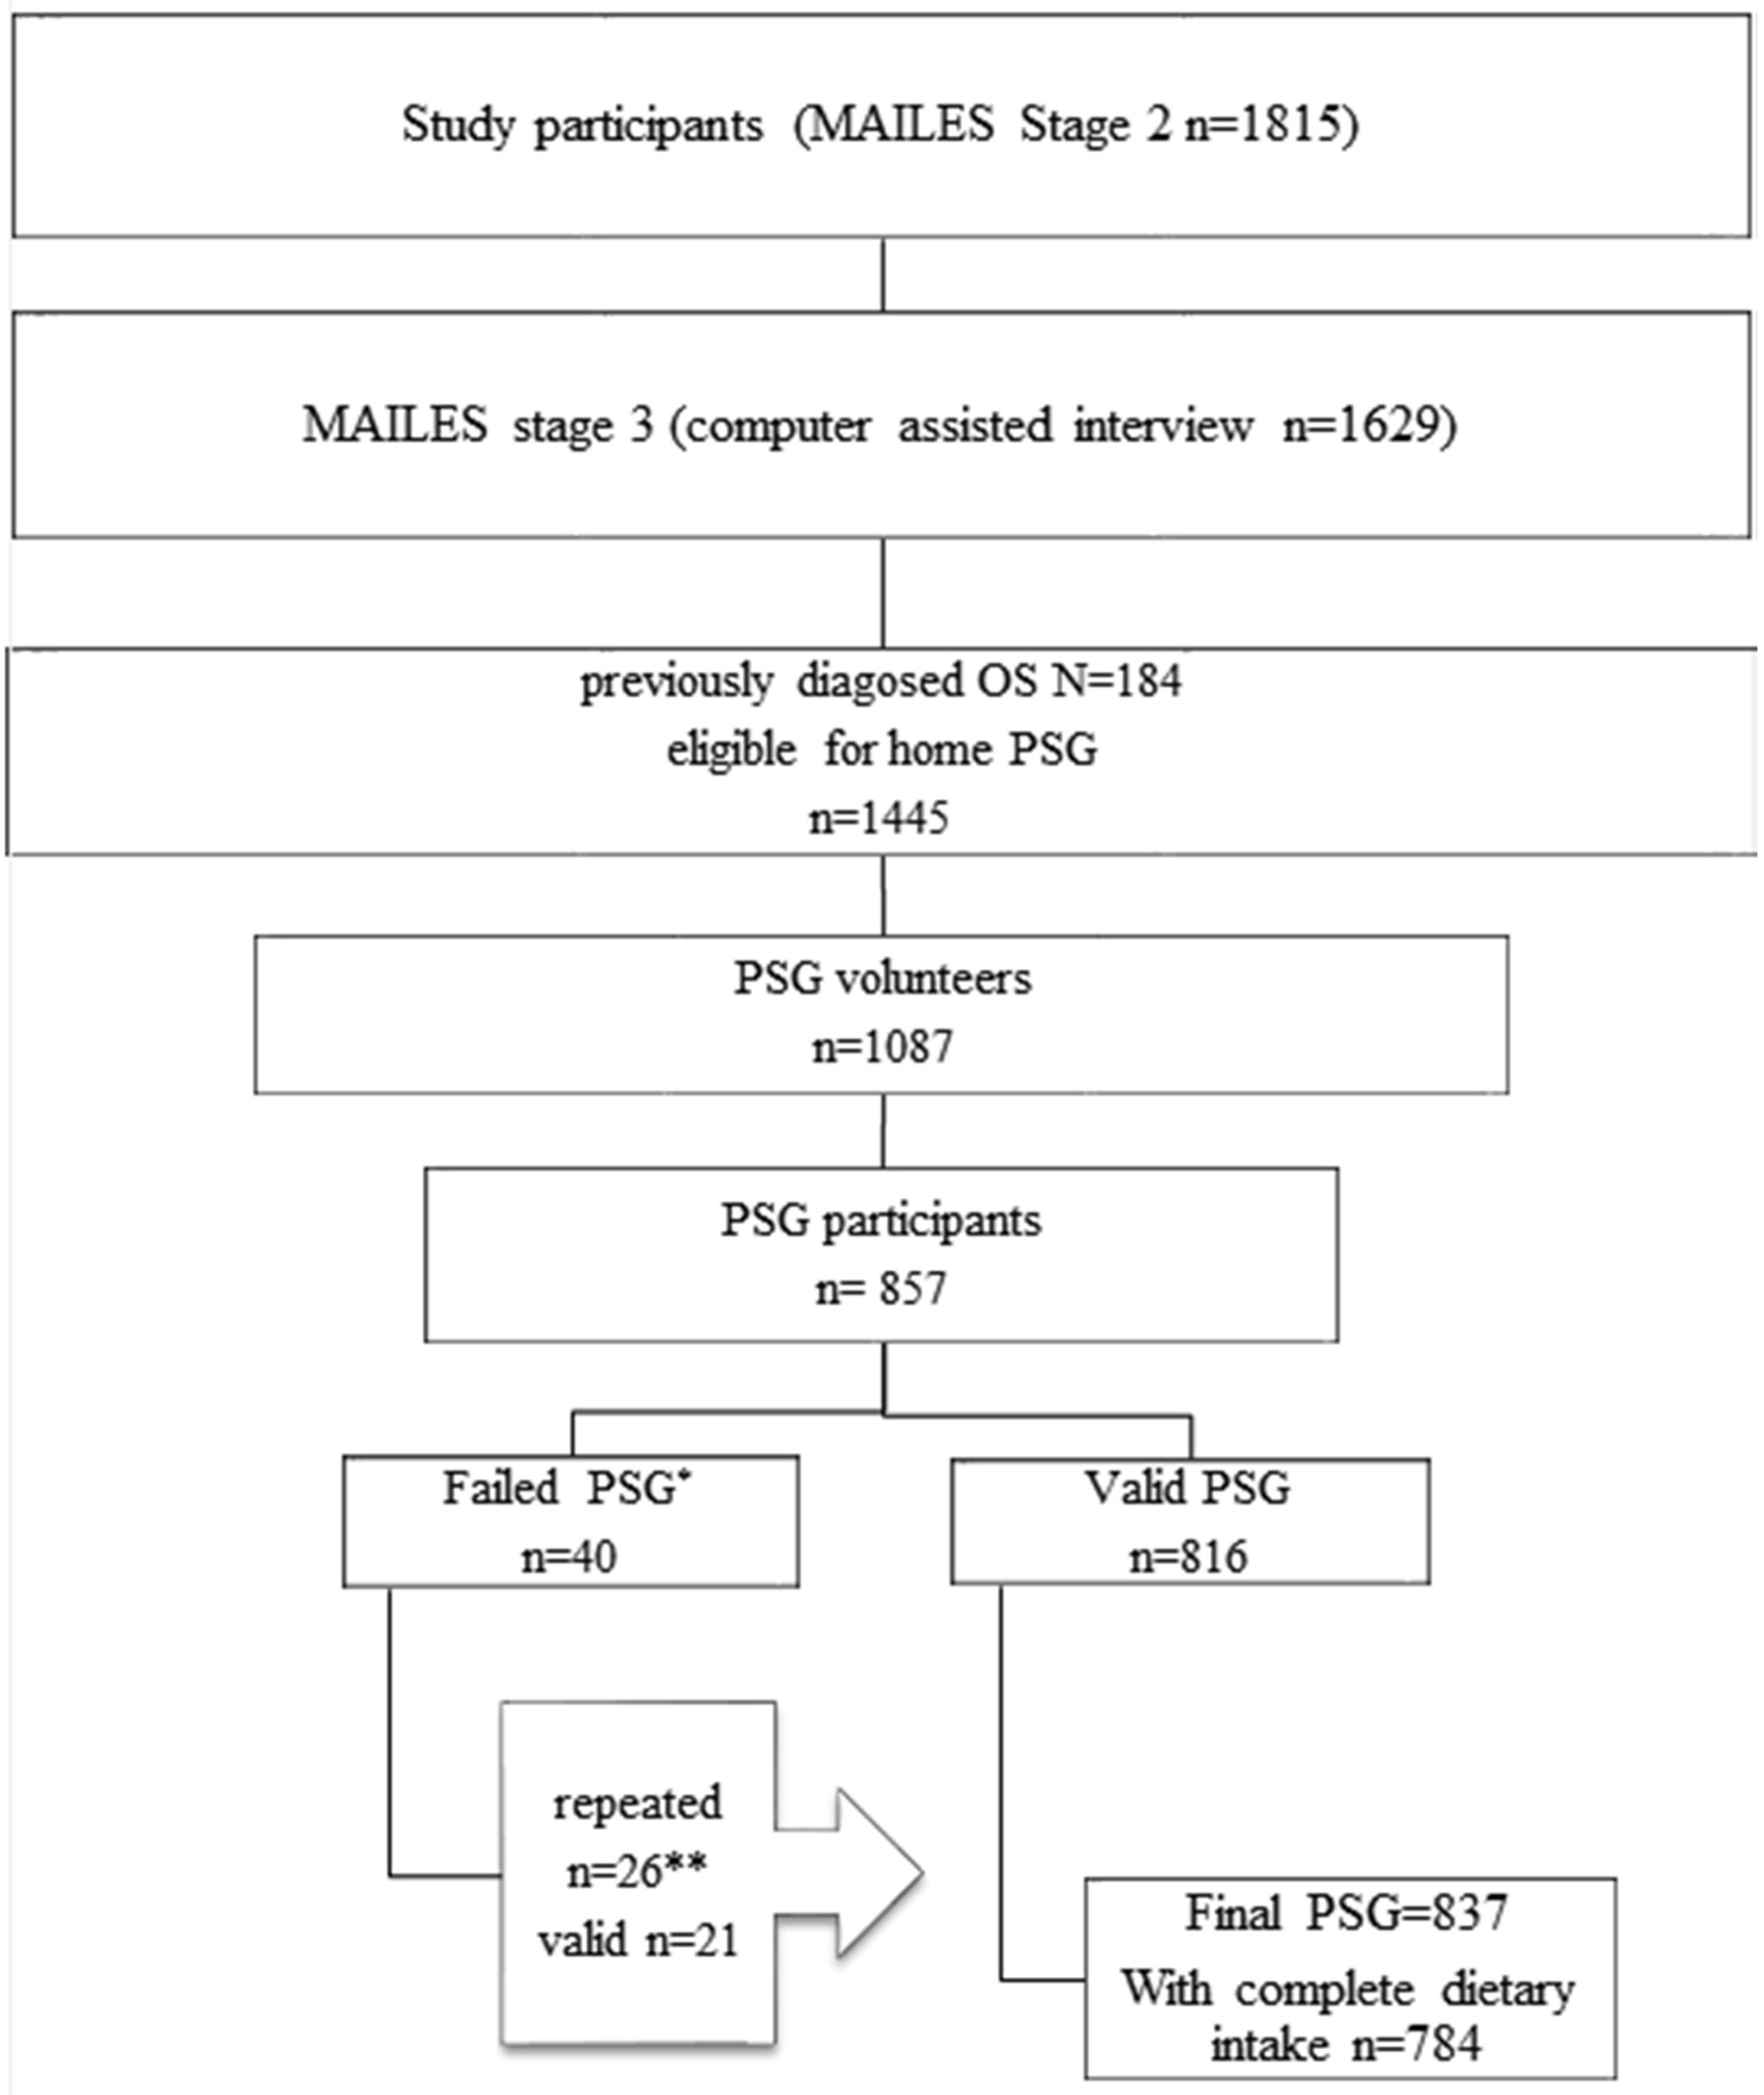
2.1. Study Population
2.2. Macronutrient Intake Assessment
2.3. Sleep Assessments
2.4. Other Measurements
2.5. Statistical Analysis
3. Results
4. Discussion
Supplementary Materials
Acknowledgments
Author Contributions
Conflicts of Interest
References
- Afaghi, A.; O’Connor, H.; Chow, C.M. High-glycemic-index carbohydrate meals shorten sleep onset. Am. J. Clin. Nutr. 2007, 85, 426–430. [Google Scholar] [PubMed]
- Jalilolghadr, S.; Afaghi, A.; O’Connor, H.; Chow, C.M. Effect of low and high glycaemic index drink on sleep pattern in children. J. Pak. Med. Assoc. 2011, 61, 533–536. [Google Scholar] [PubMed]
- Tanaka, E.; Yatsuya, H.; Uemura, M.; Murata, C.; Otsuka, R.; Toyoshima, H.; Tamakoshi, K.; Sasaki, S.; Kawaguchi, L.; Aoyama, A. Associations of protein, fat, and carbohydrate intakes with insomnia symptoms among middle-aged Japanese workers. J. Epidemiol. 2013, 23, 132–138. [Google Scholar] [CrossRef] [PubMed]
- Trakada, G.; Steiropoulos, P.; Zarogoulidis, P.; Nena, E.; Papanas, N.; Maltezos, E.; Bouros, D. A fatty meal aggravates apnea and increases sleep in patients with obstructive sleep apnea. Sleep Breath 2014, 18, 53–58. [Google Scholar] [CrossRef] [PubMed]
- St-Onge, M.P.; Roberts, A.; Shechter, A.; Choudhury, A.R. Fiber and saturated fat are associated with sleep arousals and slow wave sleep. J. Clin. Sleep Med. 2016, 12, 19–24. [Google Scholar] [CrossRef] [PubMed]
- Yamaguchi, M.; Uemura, H.; Katsuura-Kamano, S.; Nakamoto, M.; Hiyoshi, M.; Takami, H.; Sawachika, F.; Juta, T.; Arisawa, K. Relationship of dietary factors and habits with sleep-wake regularity. Asia Pac. J. Clin. Nutr. 2013, 22, 457–465. [Google Scholar] [PubMed]
- Awad, K.M.; Drescher, A.A.; Malhotra, A.; Quan, S.F. Effects of exercise and nutritional intake on sleep architecture in adolescents. Sleep Breath 2013, 17, 117–124. [Google Scholar] [CrossRef] [PubMed]
- Grant, J.F.; Martin, S.A.; Taylor, A.W.; Wilson, D.H.; Araujo, A.; Adams, R.J.; Jenkins, A.; Milne, R.W.; Hugo, G.J.; Atlantis, E.; et al. Cohort profile: The men androgen inflammation lifestyle environment and stress (MAOLES) study. Int. J. Epidemiol. 2014, 43, 1040–1053. [Google Scholar] [CrossRef] [PubMed]
- Martin, S.; Haren, M.; Taylor, A.; Middleton, S.; Wittert, G. Cohort profile: The florey adelaide male ageing study (FAMAS). Int. J. Epidemiol. 2007, 36, 302–306. [Google Scholar] [CrossRef] [PubMed]
- Grant, J.F.; Taylor, A.W.; Ruffin, R.E.; Wilson, D.H.; Phillips, P.J.; Adams, R.J.; Price, K. Cohort profile: The north west Adelaide health study (NWAHS). Int. J. Epidemiol. 2009, 38, 1479–1486. [Google Scholar] [CrossRef] [PubMed]
- Appleton, S.L.; Vakulin, A.; McEvoy, R.D.; Wittert, G.A.; Martin, S.A.; Grant, J.F.; Taylor, A.W.; Antic, N.A.; Catcheside, P.G.; Adams, R.J. Nocturnal hypoxemia and severe obstructive sleep apnea are associated with incident type 2 diabetes in a population cohort of men. J. Clin. Sleep Med. 2015, 11, 609–614. [Google Scholar] [CrossRef] [PubMed]
- Hodge, A.; Patterson, A.J.; Brown, W.J.; Ireland, P.; Giles, G. The anti cancer council of victoria FFQ: Relative validity of nutrient intakes compared with weighed food records in young to middle-aged women in a study of iron supplementation. Aust. N. Z. J. Public Health 2000, 24, 576–583. [Google Scholar] [CrossRef] [PubMed]
- Chung, F.; Yegneswaran, B.; Liao, P.; Chung, S.A.; Vairavanathan, S.; Islam, S.; Khajehdehi, A.; Shapiro, C.M. Stop questionnaire: A tool to screen patients for obstructive sleep apnea. Anesthesiology 2008, 108, 812–821. [Google Scholar] [CrossRef] [PubMed]
- Buysse, D.J.; Reynolds, C.F., 3rd; Monk, T.H.; Berman, S.R.; Kupfer, D.J. The Pittsburgh sleep quality index: A new instrument for psychiatric practice and research. Psychiatry Res. 1989, 28, 193–213. [Google Scholar] [CrossRef]
- Natus Medical Incoportaed-Sleep. Available online: http://www.embla.com/index.cfm/id/57/Embletta-X100/ (accessed on 6 April 2016).
- Iber, C.; Ancoli-Israel, S.; Chesson, A.L.; Quan, S.F. The AASM Manual for the Scoring of Sleep and Associated Events: Rules, Terminology and Technical Specifications, 1st ed.; American Academy of Sleep Medicine: Westchester, IL, USA, 2007. [Google Scholar]
- Peuhkuri, K.; Sihvola, N.; Korpela, R. Diet promotes sleep duration and quality. Nutr. Res. 2012, 32, 309–319. [Google Scholar] [CrossRef] [PubMed]
- Brezinova, V.; Loudon, J.; Oswald, I. Tryptophan and sleep. Lancet 1972, 2, 1086–1087. [Google Scholar] [CrossRef]
- Kohsaka, A.; Laposky, A.D.; Ramsey, K.M.; Estrada, C.; Joshu, C.; Kobayashi, Y.; Turek, F.W.; Bass, J. High-fat diet disrupts behavioral and molecular circadian rhythms in mice. Cell Metab. 2007, 6, 414–421. [Google Scholar] [CrossRef] [PubMed]
- Wells, A.S.; Read, N.W.; Craig, A. Influences of dietary and intraduodenal lipid on alertness, mood, and sustained concentration. Br. J. Nutr. 1995, 74, 115–123. [Google Scholar] [CrossRef] [PubMed]
- Wells, A.S.; Read, N.W.; Uvnas-Moberg, K.; Alster, P. Influences of fat and carbohydrate on postprandial sleepiness, mood, and hormones. Physiol. Behav. 1997, 61, 679–686. [Google Scholar] [CrossRef]
- Spring, B.; Maller, O.; Wurtman, J.; Digman, L.; Cozolino, L. Effects of protein and carbohydrate meals on mood and performance: Interactions with sex and age. J. Psychiatr. Res. 1982, 17, 155–167. [Google Scholar] [CrossRef]
- Flachenecker, P.; Rufer, A.; Bihler, I.; Hippel, C.; Reiners, K.; Toyka, K.V.; Kesselring, J. Fatigue in MS is related to sympathetic vasomotor dysfunction. Neurology 2003, 61, 851–853. [Google Scholar] [CrossRef] [PubMed]
- Valdes-Cruz, A.; Magdaleno-Madrigal, V.M.; Martinez-Vargas, D.; Fernandez-Mas, R.; Almazan-Alvarado, S.; Martinez, A.; Fernandez-Guardiola, A. Chronic stimulation of the cat vagus nerve: Effect on sleep and behavior. Prog. Neuropsychopharmacol. Biol. Psychiatry 2002, 26, 113–118. [Google Scholar] [CrossRef]
- Juhasz, G.; Detari, L.; Kukorelli, T. Effects of hypnogenic vagal stimulation on thalamic neuronal activity in cats. Brain Res. Bull. 1985, 15, 437–441. [Google Scholar] [CrossRef]
- Bazar, K.A.; Yun, A.J.; Lee, P.Y. Debunking a myth: Neurohormonal and vagal modulation of sleep centers, not redistribution of blood flow, may account for postprandial somnolence. Med. Hypotheses 2004, 63, 778–782. [Google Scholar] [CrossRef] [PubMed]
- Kirchgessner, A.L. Orexins in the brain-gut axis. Endocr. Rev. 2002, 23, 1–15. [Google Scholar] [CrossRef] [PubMed]
- Handjieva-Darlenska, T.; Boyadjieva, N. The effect of high-fat diet on plasma ghrelin and leptin levels in rats. J. Physiol. Biochem. 2009, 65, 157–164. [Google Scholar] [CrossRef] [PubMed]
- Sakurai, T. Roles of orexin/hypocretin in regulation of sleep/wakefulness and energy homeostasis. Sleep Med. Rev. 2005, 9, 231–241. [Google Scholar] [CrossRef] [PubMed]
- Jenkins, J.B.; Omori, T.; Guan, Z.; Vgontzas, A.N.; Bixler, E.O.; Fang, J. Sleep is increased in mice with obesity induced by high-fat food. Physiol. Behav. 2006, 87, 255–262. [Google Scholar] [CrossRef] [PubMed]
- Bixler, E.O.; Vgontzas, A.N.; Lin, H.M.; Calhoun, S.L.; Vela-Bueno, A.; Kales, A. Excessive daytime sleepiness in a general population sample: The role of sleep apnea, age, obesity, diabetes, and depression. J. Clin. Endocrinol. Metab. 2005, 90, 4510–4515. [Google Scholar] [CrossRef] [PubMed]
- Resnick, H.E.; Carter, E.A.; Aloia, M.; Phillips, B. Cross-sectional relationship of reported fatigue to obesity, diet, and physical activity: Results from the third national health and nutrition examination survey. J. Clin. Sleep Med. 2006, 2, 163–169. [Google Scholar] [PubMed]
- Ramadan, W.; Dewasmes, G.; Petitjean, M.; Wiernsperger, N.; Delanaud, S.; Geloen, A.; Libert, J.P. Sleep apnea is induced by a high-fat diet and reversed and prevented by metformin in non-obese rats. Obesity 2007, 15, 1409–1418. [Google Scholar] [CrossRef] [PubMed]
- Foster, G.D.; Sanders, M.H.; Millman, R.; Zammit, G.; Borradaile, K.E.; Newman, A.B.; Wadden, T.A.; Kelley, D.; Wing, R.R.; Sunyer, F.X.; et al. Obstructive sleep apnea among obese patients with type 2 diabetes. Diabetes Care 2009, 32, 1017–1019. [Google Scholar] [CrossRef] [PubMed]
- Kohler, M. Risk factors and treatment for obstructive sleep apnea amongst obese children and adults. Curr. Opin. Allergy Clin. Immunol. 2009, 9, 4–9. [Google Scholar] [CrossRef] [PubMed]
- Jakes, R.W.; Day, N.E.; Luben, R.; Welch, A.; Bingham, S.; Mitchell, J.; Hennings, S.; Rennie, K.; Wareham, N.J. Adjusting for energy intake—What measure to use in nutritional epidemiological studies? Int. J. Epidemiol. 2004, 33, 1382–1386. [Google Scholar] [CrossRef] [PubMed]
- Patton, D.F.; Mistlberger, R.E. Circadian adaptations to meal timing: Neuroendocrine mechanisms. Front. Neurosci. 2013, 7, 185. [Google Scholar] [CrossRef] [PubMed]

| Factors | Carbohydrate Intake (g) | Protein Intake (g) | Fat Intake (g) | p-Value | |||||
|---|---|---|---|---|---|---|---|---|---|
| Q1 (n = 454) | Q4 (n = 453) | p-Value | Q1 (n = 454) | Q4 (n = 453) | p-Value | Q1 (n = 454) | Q4 (n = 453) | ||
| Age (years), mean (SD) | 60.5 (11.7) | 58.5 (11.4) | 0.07 | 61.5 (12.1) | 58.4 (10.9) | <0.001 | 59.9 (11.6) | 59.5 (11.1) | 0.47 |
| Energy intake (kcal), mean (SD) | 1539.1 (342.1) | 2930.5 (606.7) | <0.001 | 1548.3 (348.4) | 2900.5 (618.8) | <0.001 | 1535.1 (328.4) | 2934.2 (596.9) | <0.001 |
| Carbohydrates (g/day), mean (SD) | 132.9 (26.0) | 320.1 (91.5) | <0.001 | 157.5 (49.8) | 283.1 (97.1) | <0.001 | 162.2 (51.2) | 276.1 (93.0) | <0.001 |
| Fat (g/day), mean (SD) | 71.3 (22.2) | 119.0 (34.7) | <0.001 | 66.5 (19.4) | 123.4 (32.0) | <0.001 | 58.4 (10.9) | 135.2 (25.8) | <0.001 |
| Protein (g/day), mean (SD) | 74.5 (23.1) | 126.8 (37.1) | <0.001 | 64.1 (12.0) | 141.6 (32.9) | <0.001 | 71.9 (19.0) | 131.0 (39.0) | <0.001 |
| Fibre (g/day), mean (SD) | 18.4 (5.9) | 37.7 (11.5) | <0.001 | 19.6 (7.3) | 35.6 (11.0) | <0.001 | 21.2 (8.3) | 34.3 (10.9) | <0.001 |
| Body mass index (BMI), n (%) | 0.71 | 0.003 | 0.49 | ||||||
| <25 | 81 (18.7) | 79 (18.2) | 102 (23.4) | 71 (16.3) | 79 (18.2) | 81 (18.6) | |||
| 25–30 | 214 (49.3) | 207 (47.6) | 211 (48.4) | 201 (46.1) | 214 (49.2) | 192 (44.1) | |||
| ≥30 | 139 (32.0) | 149 (34.3) | 123 (28.2) | 164 (37.6) | 142 (32.6) | 162 (37.2) | |||
| Income, n (%) | 0.08 | <0.001 | 0.16 | ||||||
| Low income | 171 (39.1) | 153 (34.2) | 193 (44.3) | 153 (34.3) | 163 (37.1) | 164 (36.5) | |||
| Middle income | 113 (25.9) | 156 (34.9) | 113 (25.9) | 165 (37.0) | 120 (27.3) | 164 (36.5) | |||
| High income | 130 (29.7) | 114 (25.5) | 105 (24.1) | 104 (23.3) | 134 (30.5) | 102 (22.7) | |||
| Not stated | 23 (5.3) | 24 (5.4) | 25 (5.7) | 24 (5.4) | 22 (5.0) | 19 (4.2) | |||
| Marriage status, n (%) | 0.003 | 0.014 | 0.07 | ||||||
| Married or living with a partner | 323 (74.1) | 342 (77.0) | 316 (72.6) | 343 (77.1) | 351 (80.1) | 324 (72.5) | |||
| Separated/divorced | 70 (16.1) | 50 (11.3) | 65 (14.9) | 53 (11.9) | 46 (10.5) | 74 (16.6) | |||
| Widowed | 19 (4.4) | 11 (2.5) | 24 (5.5) | 13 (2.9) | 16 (3.7) | 18 (4.0) | |||
| Never married | 22 (5.0) | 40 (9.0) | 28 (6.4) | 33 (7.4) | 24 (5.5) | 30 (6.7) | |||
| Not stated/refused | 2 (0.5) | 1 (0.2) | 2 (0.5) | 3 (0.7) | 1 (0.2) | 1 (0.2) | |||
| Education, n (%) | 0.07 | 0.18 | 0.10 | ||||||
| ≤High school | 96 (25.3) | 93 (23.3) | 100 (27.0) | 96 (24.2) | 95 (25.1) | 112 (28.1) | |||
| Certificate | 228 (60.2) | 219 (54.9) | 214 (57.8) | 229 (57.8) | 226 (59.6) | 208 (52.1) | |||
| Bachelor | 52 (13.7) | 83 (20.8) | 50 (13.5) | 69 (17.4) | 53 (14.0) | 75 (18.8) | |||
| Not stated | 3 (0.8) | 4 (1.0) | 6 (1.6) | 2 (0.5) | 5 (1.3) | 4 (1.0) | |||
| Current smoker, n (%) | 71 (15.8) | 51 (11.3) | 0.22 | 62 (13.7) | 66 (14.7) | 0.35 | 48 (10.6) | 61 (13.6) | 0.36 |
| Physical activity, n (%) | 0.09 | 0.39 | 0.18 | ||||||
| Sedentary | 126 (30.6) | 102 (24.2) | 122 (29.4) | 101 (24.0) | 120 (28.7) | 105 (24.9) | |||
| Low exercise level | 140 (34.0) | 136 (32.2) | 141 (34.0) | 135 (32.1) | 148 (35.4) | 136 (32.3) | |||
| Moderate exercise level | 103 (25.0) | 131 (31.0) | 109 (26.3) | 134 (31.8) | 109 (26.1) | 136 (32.3) | |||
| High exercise level | 43 (10.4) | 53 (12.6) | 43 (10.4) | 51 (12.1) | 41 (9.8) | 44 (10.5) | |||
| Depression, n (%) | 37 (8.6) | 56 (12.8) | 0.17 | 33 (7.7) | 61 (14.0) | 0.016 | 38 (8.7) | 64 (14.6) | 0.029 |
| Sleep Parameters | Quartiles of Macronutrient Intake (g) | p-Value | |||
|---|---|---|---|---|---|
| Carbohydrate Intake (g) | |||||
| Polysomnography measures (n = 784) | Q1 (n = 196) | Q2 (n = 196) | Q3 (n = 196) | Q4 (n = 196) | |
| Apnoea-Hypopnea Index (/h), n (%) | 0.220 | ||||
| <5 | 48 (24.5) | 40 (20.4) | 49 (25.0) | 32 (16.3) | |
| 5–19 | 108 (55.1) | 108 (55.1) | 95 (48.5) | 110 (56.1) | |
| ≥20 | 40 (20.4) | 48 (24.5) | 52 (26.5) | 54 (27.6) | |
| Total sleep duration (min), mean (SD) | 376.8 (57.5) | 376.7 (54.6) | 369.1 (59.2) | 369.7 (62.3) | 0.380 |
| Self-reported measures | Q1 (n = 372) | Q2 (n = 372) | Q3 (n = 372) | Q4 (n = 372) | |
| Daytime sleepiness (n = 1487), n (%) | 133 (35.7) | 160 (43.1) | 159 (43.0) | 152 (40.8) | 0.320 |
| Poor sleep quality (n = 773)2, n (%) | 89 (48.4) | 80 (42.6) | 88 (46.1) | 95 (50.5) | 0.450 |
| Protein Intake (g) | |||||
| Polysomnography measures (n = 784) | Q1 (n = 196) | Q2 (n = 196) | Q3 (n = 196) | Q4 (n = 196) | |
| Apnoea-Hypopnea Index (/h), n (%) | 0.230 | ||||
| <5 | 48 (24.5) | 43 (21.9) | 46 (23.5) | 32 (16.3) | |
| 5–19 | 104 (53.1) | 109 (55.6) | 105 (53.6) | 103 (52.6) | |
| ≥20 | 44 (22.4) | 44 (22.4) | 45 (23.0) | 61 (31.1) | |
| TST (min), mean (SD) | 374.6 (55.8) | 375.8 (57.3) | 365.4 (55.8) | 376.5 (64.2) | 0.200 |
| Self-reported measures | Q1 (n = 372) | Q2 (n = 372) | Q3 (n = 372) | Q4 (n = 372) | |
| Daytime sleepiness (n = 1487), n (%) | 131 (36.1) | 164 (43.6) | 152 (39.9) | 157 (42.8) | 0.490 |
| Poor sleep quality (n = 773), n (%) | 95 (51.4) | 76 (40.0) | 93 (49.7) | 88 (46.6) | 0.130 |
| Fat Intake (g) | |||||
| Polysomnography measures (n = 784) | Q1 (n = 196) | Q2 (n = 196) | Q3 (n = 196) | Q4 (n = 196) | |
| Apnoea-Hypopnea Index (/h), n (%) | 0.004 | ||||
| <5 | 45 (23.0) | 45 (23.0) | 51 (26.0) | 28 (14.3) | |
| 5–19 | 117 (59.7) | 100 (51.0) | 101 (51.5) | 103 (52.6) | |
| ≥20 | 34 (17.3) | 51 (26.0) | 44 (22.4) | 65 (33.2) | |
| TST (min), mean (SD) | 374.4 (54.7) | 373.2 (54.1) | 375.8 (61.8) | 368.8 (62.9) | 0.660 |
| Self-reported measures | Q1 (n = 372) | Q2 (n = 372) | Q3 (n = 372) | Q4 (n = 372) | |
| Daytime sleepiness (n = 1487), n (%) | 137 (37.0) | 151 (41.0) | 144 (38.1) | 172 (46.4) | 0.051 |
| Poor sleep quality (n = 773), n (%) | 86 (45.5) | 89 (46.8) | 85 (46.4) | 92 (48.7) | 0.940 |
| Self-reported Sleep Symptoms | Quartiles of Macronutrient Intake (g) | n | |||
|---|---|---|---|---|---|
| Q1 (n = 372) ref | Q2 (n = 372) | Q3 (n = 372) | Q4 (n = 372) | ||
| Daytime sleepiness 2 | |||||
| Carbohydrate | |||||
| Model 1 | 1.00 | 1.60 (1.08–2.37) * | 1.69 (1.10–2.58) * | 1.48 (0.89–2.46) | 1487 |
| Model 2 | 1.00 | 1.58 (1.02–2.46) * | 1.40 (0.87–2.26) | 1.33 (0.75–2.35) | 1195 |
| Model 3 | 1.00 | 1.46 (0.92–2.31) | 1.25 (0.77–2.04) | 1.19 (0.66–2.13) | 1147 |
| Model 4 | 1.00 | 1.31 (0.81–2.12) | 1.05 (0.61–1.81) | 0.85 (0.41–1.78) | 1147 |
| Protein | |||||
| Model 1 | 1.00 | 1.62 (1.09–2.40) * | 1.29 (0.86–1.94) | 1.59 (1.01–2.51) * | 1487 |
| Model 2 | 1.00 | 1.75 (1.13–2.74) * | 1.32 (0.84–2.08) | 1.74 (1.04–2.89) * | 1195 |
| Model 3 | 1.00 | 1.51 (0.96–2.40) | 1.29 (0.81–2.06) | 1.62 (0.96–2.74) | 1147 |
| Model 4 | 1.00 | 1.47 (0.91–2.36) | 1.21 (0.71–2.05) | 1.44 (0.73–2.86) | 1147 |
| Fat | |||||
| Model 1 | 1.00 | 1.53 (1.04–2.24) * | 1.23 (0.83–1.80) | 1.95 (1.28–2.99) ** | 1487 |
| Model 2 | 1.00 | 1.59 (1.03–2.46) * | 1.23 (0.80–1.87) | 1.85 (1.15–2.96) * | 1195 |
| Model 3 | 1.00 | 1.53 (0.98–2.40) | 1.12 (0.72–1.72) | 1.78 (1.10–2.89) * | 1147 |
| Model 4 | 1.00 | 1.56 (0.97–2.53) | 1.16 (0.69–1.95) | 1.90 (0.93–3.91) | 1147 |
| Poor sleep quality | |||||
| Carbohydrate | |||||
| Model 1 | 1.00 | 0.89 (0.65–1.21) | 0.97 (0.69–1.36) | 1.08 (0.73–1.59) | 751 |
| Model 2 | 1.00 | 0.88 (0.61–1.27) | 0.96 (0.66–1.40) | 0.98 (0.62–1.54) | 590 |
| Model 3 | 1.00 | 0.90 (0.62–1.31) | 0.94 (0.64–1.39) | 0.95 (0.60–1.53) | 569 |
| Model 4 | 1.00 | 0.86 (0.58–1.28) | 0.88 (0.57–1.36) | 0.84 (0.47–1.51) | 569 |
| Protein | |||||
| Model 1 | 1.00 | 0.76 (0.56–1.04) | 0.94 (0.69–1.28) | 0.86 (0.60–1.23) | 751 |
| Model 2 | 1.00 | 0.77 (0.54–1.12) | 0.92 (0.65–1.32) | 0.89 (0.59–1.34) | 590 |
| Model 3 | 1.00 | 0.77 (0.53–1.13) | 0.87 (0.60–1.26) | 0.83 (0.55–1.27) | 569 |
| Model 4 | 1.00 | 0.74 (0.50–1.08) | 0.79 (0.52–1.19) | 0.69 (0.40–1.19) | 569 |
| Fat | |||||
| Model 1 | 1.00 | 1.03 (0.76–1.39) | 1.02 (0.75–1.39) | 1.07 (0.77–1.49) | 751 |
| Model 2 | 1.00 | 1.12 (0.79–1.60) | 1.08 (0.76–1.55) | 1.11 (0.75–1.63) | 590 |
| Model 3 | 1.00 | 1.06 (0.74–1.53) | 0.98 (0.68–1.42) | 1.01 (0.68–1.51) | 569 |
| Model 4 | 1.00 | 1.01 (0.69–1.48) | 0.90 (0.59–1.38) | 0.86 (0.49–1.51) | 569 |
| AHI Categories | Models | Quartiles of Macronutrient Intake (g) | n | |||
|---|---|---|---|---|---|---|
| Q1 (ref) | Q2 | Q3 | Q4 | |||
| AHI (/h) | Carbohydrate | |||||
| <5 (ref) | Model 1 | 1.00 | 1.00 | 1.00 | 1.00 | 169 |
| 5–19 | Model 1 | 1.00 | 1.22 (0.72–2.06) | 0.80 (0.45–1.41) | 1.36 (0.67–2.74) | 421 |
| ≥20 | Model 1 | 1.00 | 1.36 (0.72–2.54) | 0.96 (0.49–1.89) | 1.27 (0.55–2.89) | 194 |
| Subtotal: 784 | ||||||
| <5 (ref) | Model 2 | 1.00 | 1.00 | 1.00 | 1.00 | 127 |
| 5–19 | Model 2 | 1.00 | 1.79 (0.96–3.33) | 1.21 (0.63–2.33) | 1.77 (0.78–3.99) | 338 |
| ≥20 | Model 2 | 1.00 | 1.60 (0.76–3.38) | 1.17 (0.54–2.54) | 1.55 (0.60–4.02) | 155 |
| Subtotal: 620 | ||||||
| <5 (ref) | Model 3 | 1.00 | 1.00 | 1.00 | 1.00 | 123 |
| 5–19 | Model 3 | 1.00 | 1.82 (0.94–3.52) | 1.12 (0.57–2.21) | 1.70 (0.73–3.95) | 324 |
| ≥20 | Model 3 | 1.00 | 1.44 (0.64–3.25) | 1.07 (0.46–2.46) | 1.47 (0.53–4.11) | 149 |
| Subtotal: 596 | ||||||
| <5 (ref) | Model 4 | 1.00 | 1.00 | 1.00 | 1.00 | 123 |
| 5–19 | Model 4 | 1.00 | 1.59 (0.79–3.20) | 0.87 (0.39–1.93) | 1.15 (0.40–3.34) | 324 |
| ≥20 | Model 4 | 1.00 | 1.06 (0.45–2.49) | 0.62 (0.24–1.60) | 0.56 (0.16–2.05) | 149 |
| Subtotal: 596 | ||||||
| Protein | ||||||
| <5 (ref) | Model 1 | 1.00 | 1.00 | 1.00 | 1.00 | 169 |
| 5–19 | Model 1 | 1.00 | 1.20 (0.72–2.01) | 1.09 (0.64–1.85) | 1.51 (0.79–2.87) | 421 |
| ≥20 | Model 1 | 1.00 | 1.09 (0.59–2.03) | 1.04 (0.55–1.97) | 1.80 (0.86–3.78) | 194 |
| Subtotal: 784 | ||||||
| <5 (ref) | Model 2 | 1.00 | 1.00 | 1.00 | 1.00 | 127 |
| 5–19 | Model 2 | 1.00 | 1.44 (0.78–2.67) | 1.18 (0.63–2.20) | 1.96 (0.92–4.18) | 338 |
| ≥20 | Model 3 | 1.00 | 1.21 (0.57–2.54) | 1.00 (0.48–2.12) | 2.40 (1.00–5.76) * | 155 |
| Subtotal: 620 | ||||||
| <5 (ref) | Model 3 | 1.00 | 1.00 | 1.00 | 1.00 | 123 |
| 5–19 | Model 3 | 1.00 | 1.22 (0.64–2.32) | 0.99 (0.51–1.89) | 1.63 (0.74–3.56) | 324 |
| ≥20 | Model 3 | 1.00 | 1.03 (0.46–2.32) | 0.83 (0.36–1.87) | 2.03 (0.79–5.22) | 149 |
| Subtotal: 596 | ||||||
| <5 (ref) | Model 4 | 1.00 | 1.00 | 1.00 | 1.00 | 123 |
| 5–19 | Model 4 | 1.00 | 1.09 (0.55–2.14) | 0.79 (0.37–1.69) | 1.13 (0.41–3.10) | 324 |
| ≥20 | Model 4 | 1.00 | 0.83 (0.36–1.93) | 0.54 (0.21–1.38) | 0.99 (0.29–3.32) | 149 |
| Subtotal: 596 | ||||||
| Fat | ||||||
| <5 (ref) | Model 1 | 1.00 | 1.00 | 1.00 | 1.00 | 169 |
| 5–19 | Model 1 | 1.00 | 0.85 (0.51–1.40) | 0.74 (0.45–1.23) | 1.25 (0.68–2.30) | 421 |
| ≥20 | Model 1 | 1.00 | 1.49 (0.80–2.77) | 1.09 (0.58–2.06) | 2.46 (1.21–5.00) * | 194 |
| Subtotal: 784 | ||||||
| <5 (ref) | Model 2 | 1.00 | 1.00 | 1.00 | 1.00 | 127 |
| 5–19 | Model 2 | 1.00 | 0.84 (0.46–1.55) | 0.67 (0.37–1.21) | 1.33 (0.65–2.73) | 338 |
| ≥20 | Model 3 | 1.00 | 1.61 (0.77–3.40) | 1.10 (0.52–2.30) | 2.67 (1.15–6.20) * | 155 |
| Subtotal: 620 | ||||||
| <5 (ref) | Model 3 | 1.00 | 1.00 | 1.00 | 1.00 | 123 |
| 5–19 | Model 3 | 1.00 | 0.83 (0.44–1.55) | 0.66 (0.36–1.22) | 1.40 (0.66–2.96) | 324 |
| ≥20 | Model 3 | 1.00 | 1.54 (0.69–3.46) | 1.20 (0.54–2.67) | 2.98 (1.20–7.38) * | 149 |
| Subtotal: 596 | ||||||
| <5 (ref) | Model 4 | 1.00 | 1.00 | 1.00 | 1.00 | 127 |
| 5–19 | Model 4 | 1.00 | 0.67 (0.34–1.33) | 0.46 (0.21–1.00) * | 0.76 (0.26–2.23) | 334 |
| ≥20 | Model 4 | 1.00 | 1.25 (0.53–2.97) | 0.84 (0.32–2.21) | 1.63 (0.45–5.90) | 154 |
| Subtotal:596 | ||||||
© 2016 by the authors; licensee MDPI, Basel, Switzerland. This article is an open access article distributed under the terms and conditions of the Creative Commons by Attribution (CC-BY) license (http://creativecommons.org/licenses/by/4.0/).
Share and Cite
Cao, Y.; Wittert, G.; Taylor, A.W.; Adams, R.; Shi, Z. Associations between Macronutrient Intake and Obstructive Sleep Apnoea as Well as Self-Reported Sleep Symptoms: Results from a Cohort of Community Dwelling Australian Men. Nutrients 2016, 8, 207. https://doi.org/10.3390/nu8040207
Cao Y, Wittert G, Taylor AW, Adams R, Shi Z. Associations between Macronutrient Intake and Obstructive Sleep Apnoea as Well as Self-Reported Sleep Symptoms: Results from a Cohort of Community Dwelling Australian Men. Nutrients. 2016; 8(4):207. https://doi.org/10.3390/nu8040207
Chicago/Turabian StyleCao, Yingting, Gary Wittert, Anne W. Taylor, Robert Adams, and Zumin Shi. 2016. "Associations between Macronutrient Intake and Obstructive Sleep Apnoea as Well as Self-Reported Sleep Symptoms: Results from a Cohort of Community Dwelling Australian Men" Nutrients 8, no. 4: 207. https://doi.org/10.3390/nu8040207
APA StyleCao, Y., Wittert, G., Taylor, A. W., Adams, R., & Shi, Z. (2016). Associations between Macronutrient Intake and Obstructive Sleep Apnoea as Well as Self-Reported Sleep Symptoms: Results from a Cohort of Community Dwelling Australian Men. Nutrients, 8(4), 207. https://doi.org/10.3390/nu8040207