Effects of Dietary Protein Source and Quantity during Weight Loss on Appetite, Energy Expenditure, and Cardio-Metabolic Responses


Abstract
:1. Introduction
2. Materials and Methods
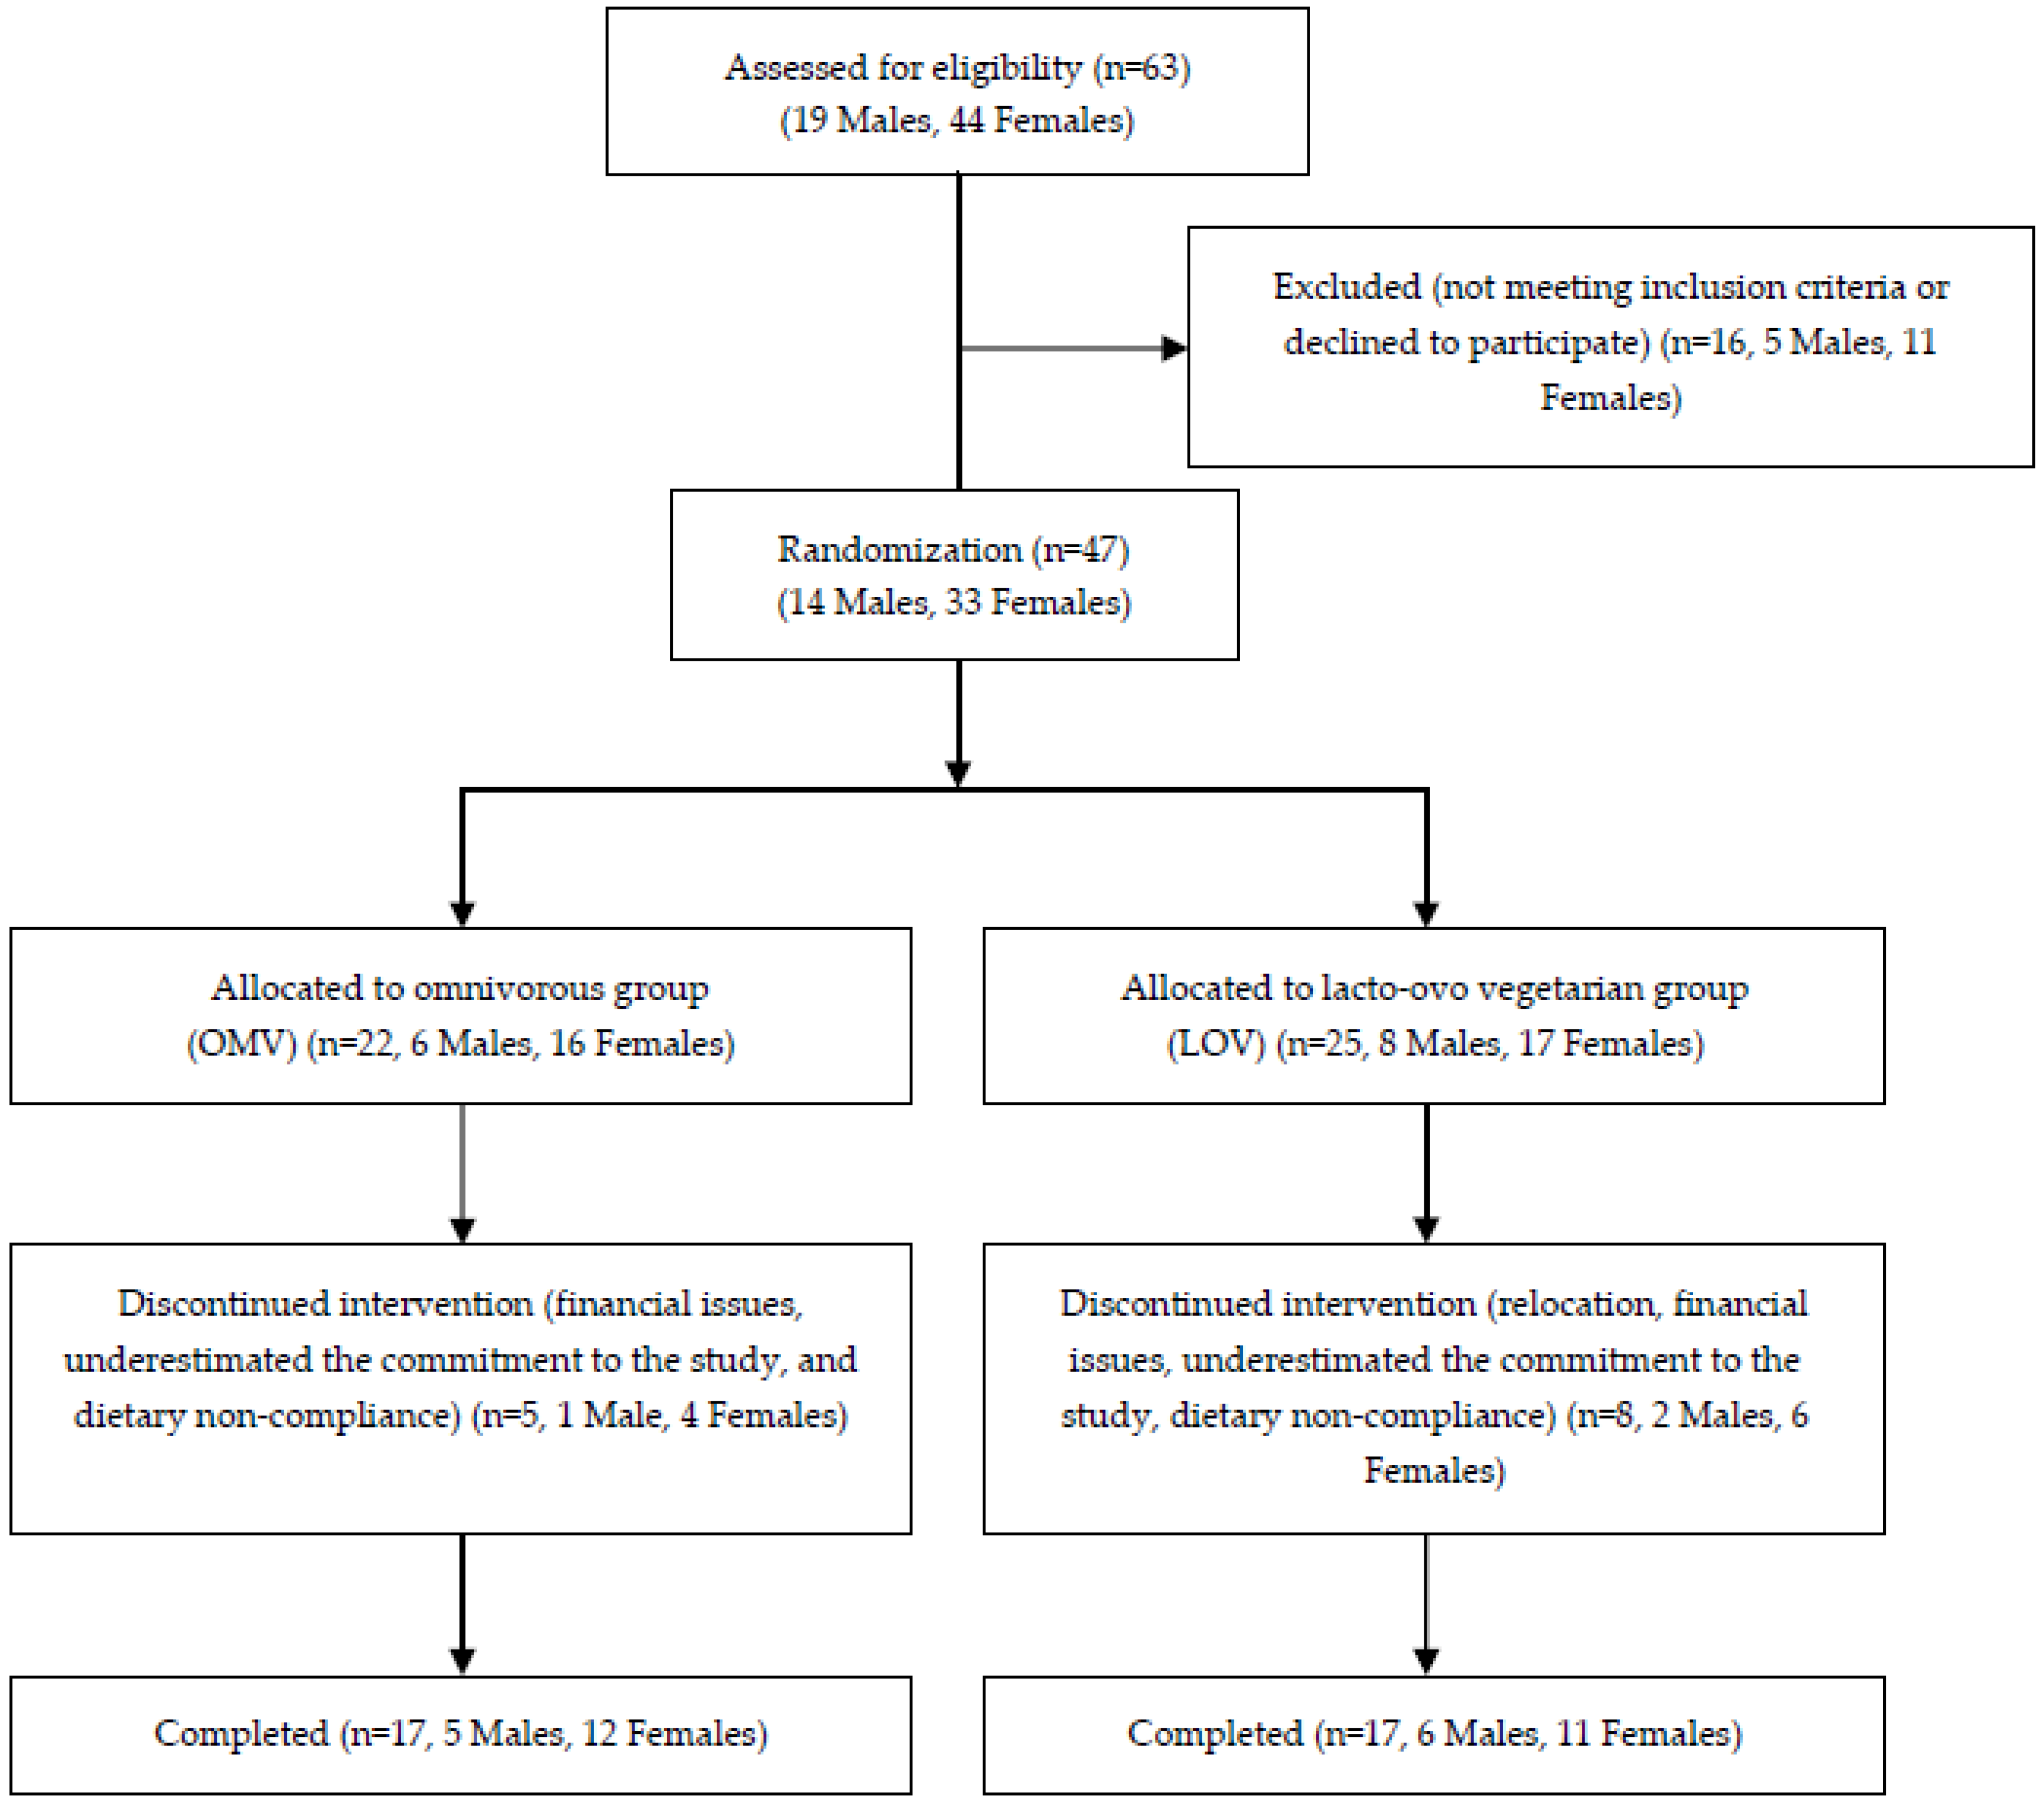
2.1. Recruitment and Screening

2.2. Experimental Design
2.2.1. Study Design Overview
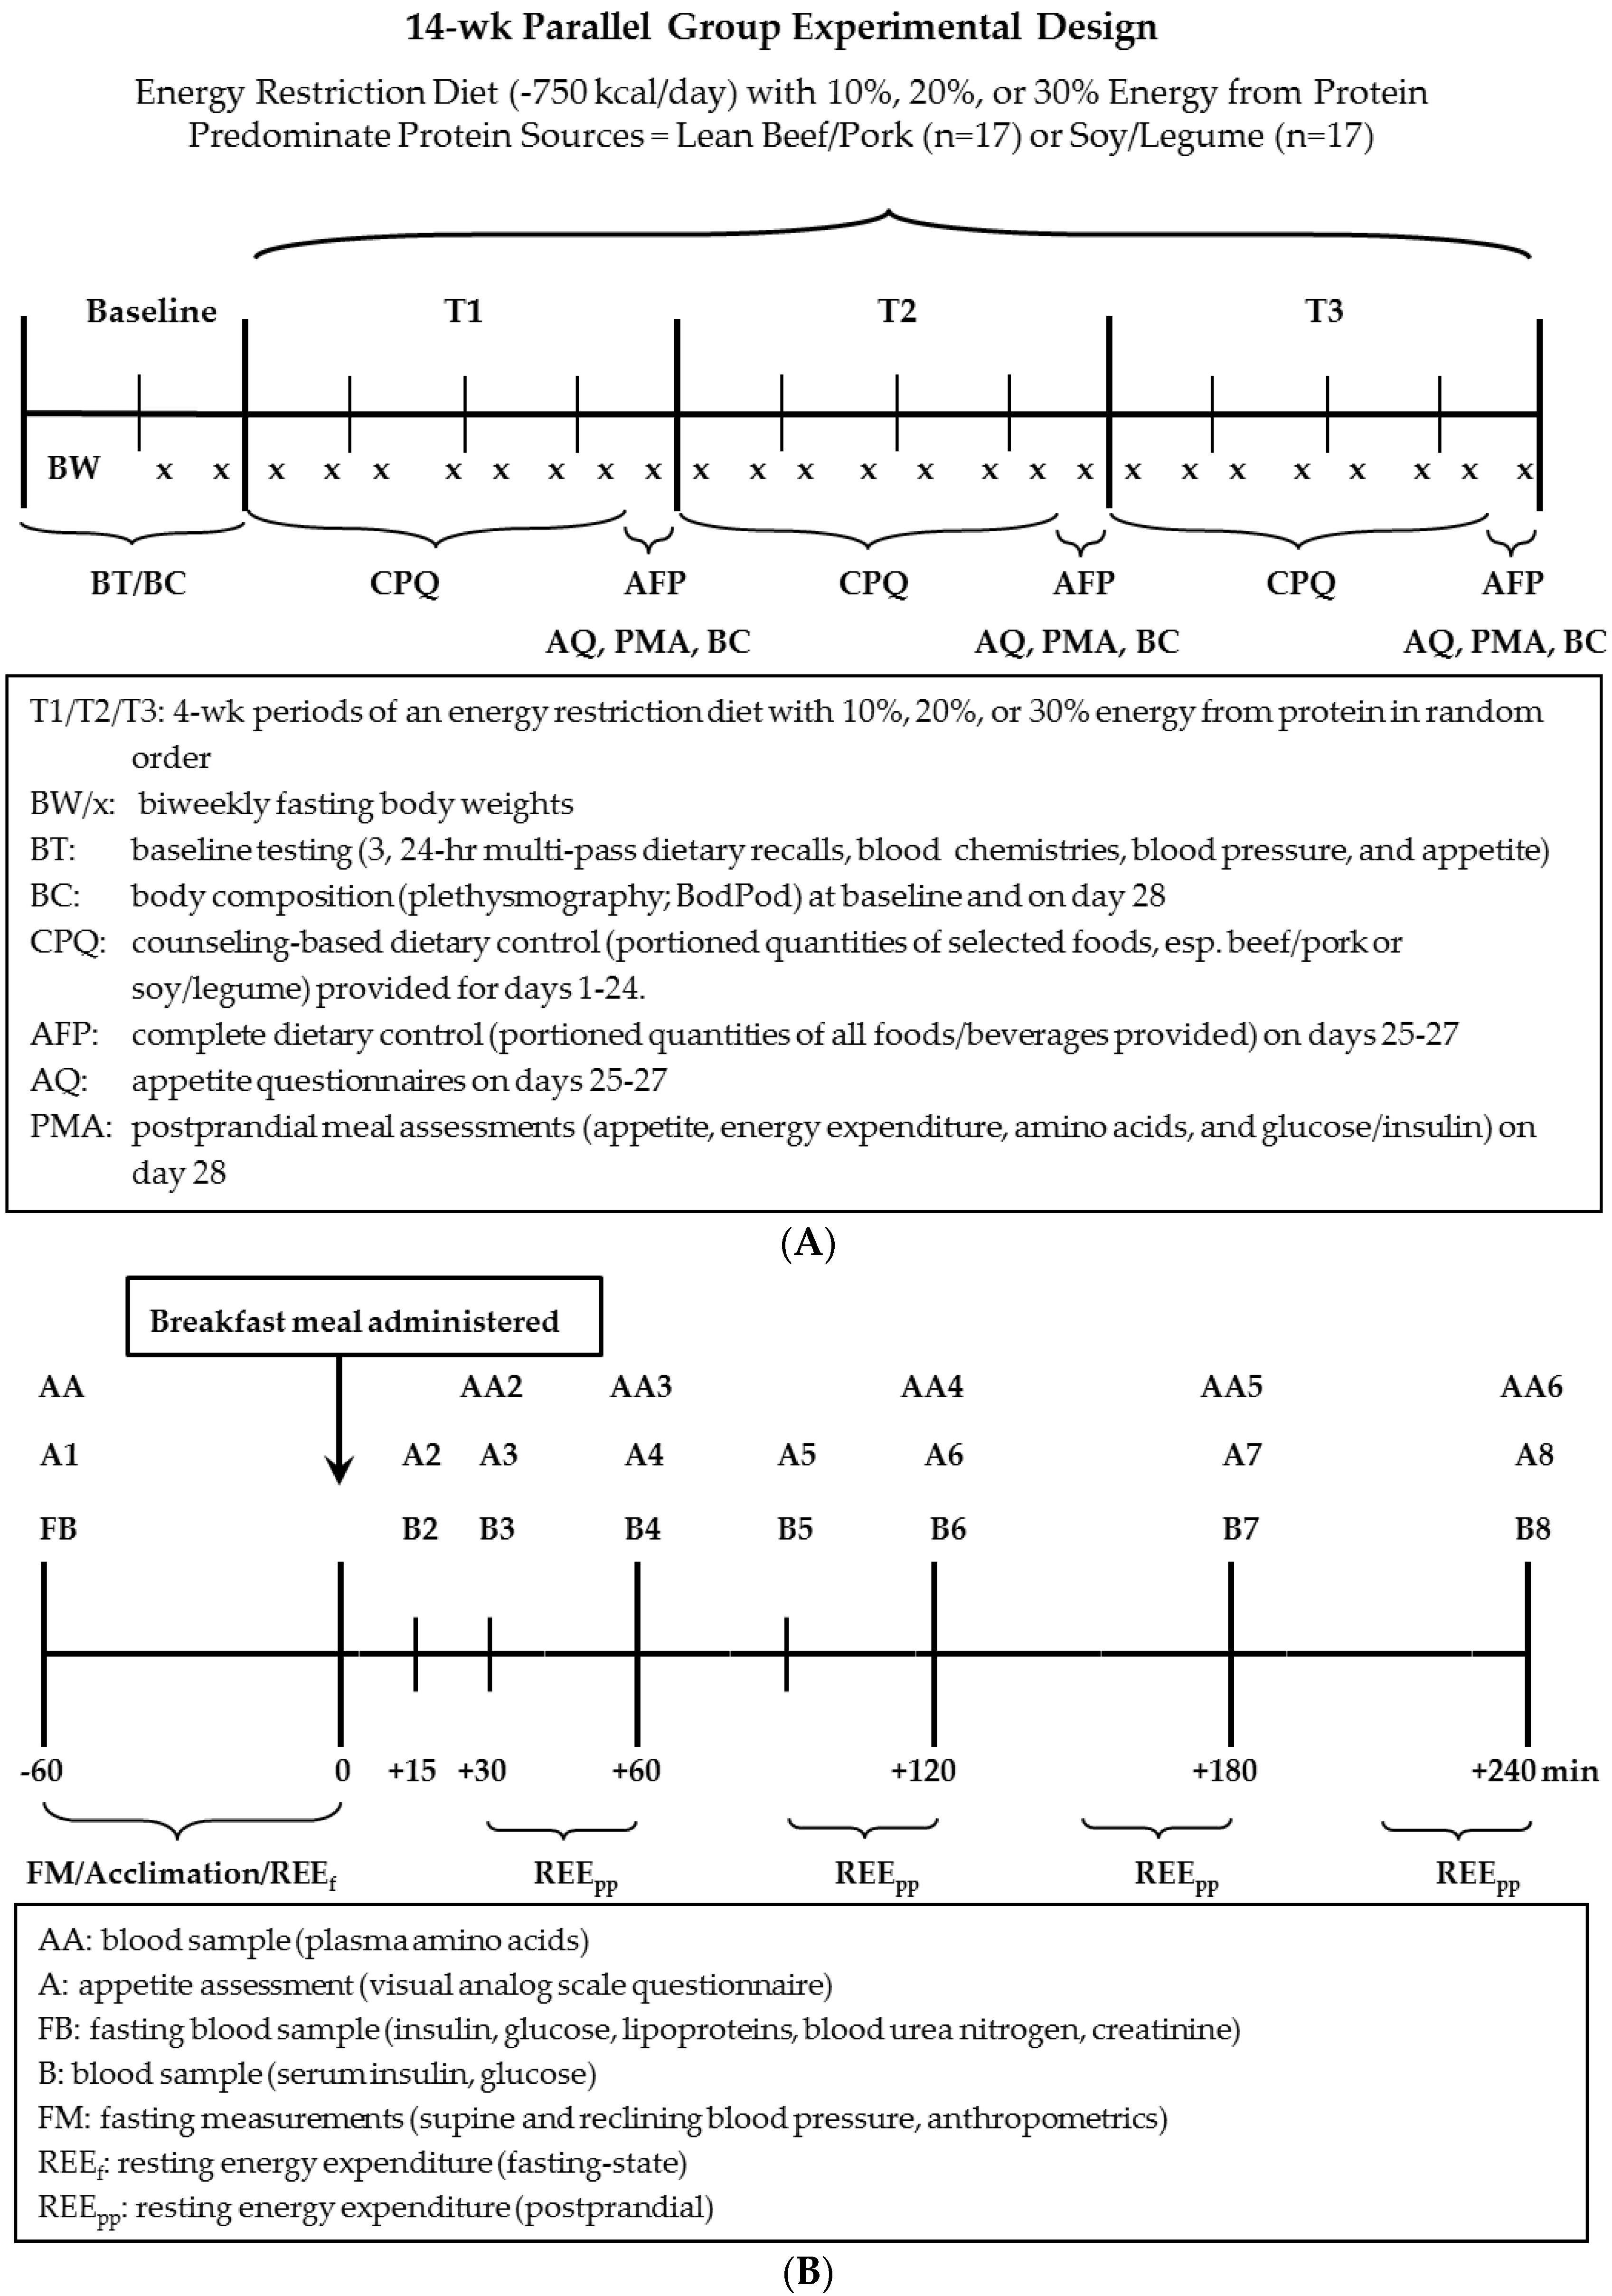
2.2.2. Longitudinal Feeding Component of Study (Three Consecutive 4-Week Dietary Intervention Periods)
2.2.3. Acute Feeding Component of Study (Day 28 of Each 4-Week Period)
2.3. Data and Statistical Analyses
2.3.1. Power Calculation
2.3.2. Data Analysis
3. Results
3.1. Subject Baseline Characteristics

| Measurement | OMV (n = 17) | LOV(n = 17) |
|---|---|---|
| Gender | M = 5, F = 12 | M = 6, F = 11 |
| Age, year | 51 ± 2 | 56 ± 4 |
| Body mass, kg | 87.0 ± 2.9 | 88.1 ± 2.9 |
| Height, cm | 167.5 ± 2.4 | 169.3 ± 2.3 |
| Body mass index, kg/m2 | 31.0 ± 0.7 | 30.7 ± 0.6 |
| Fat mass, kg | 35.8 ± 2.0 | 34.8 ± 1.3 |
| % Fat mass | 41.5 ± 2.2 | 40.1 ± 1.0 |
| Fat-free mass, kg | 51.2 ± 3.0 | 53.3 ± 2.9 |
| % Fat-free mass | 58.5 ± 2.2 | 60.0 ± 1.6 |
| Measurement a | Group | Baseline b | 10% Protein | 20% Protein | 30% Protein |
|---|---|---|---|---|---|
| Fasting Lipid/Lipoprotein Status | |||||
| Total cholesterol c, mg/dL | OMV | 186 ± 9 | 164 ± 5 | 151 ± 8 | 154 ± 8 |
| LOV | 176 ± 6 | 149 ± 6 | 145 ± 6 | 143 ± 6 | |
| HDL-C, mg/dL | OMV | 50 ± 3 | 44 ± 2 | 40 ± 3 | 42 ± 2 |
| LOV | 53 ± 3 | 44 ± 2 | 44 ± 2 | 44 ± 2 | |
| LDL-C, mg/dL | OMV | 112 ± 7 | 94 ± 5 | 89 ± 6 | 92 ± 5 |
| LOV | 102 ± 6 | 83 ± 5 | 81 ± 4 | 82 ± 5 | |
| Triacylglycerol c, mg/dL | OMV | 135 ± 12 | 124 ± 9 | 113 ± 4 | 107 ± 9 |
| LOV | 107 ± 10 | 115 ± 9 | 97 ± 9 | 99 ± 9 | |
| APO-A1 d, mg/dL | OMV | 145 ± 8 | 123 ± 5 | 122 ± 5 | 120 ± 4 |
| LOV | 143 ± 7 | 121 ± 6 | 117 ± 4 | 118 ± 5 | |
| APO-B c, mg/dL | OMV | 91 ± 5 | 84 ± 4 | 81 ± 4 | 78 ± 3 |
| LOV | 83 ± 4 | 77 ± 4 | 71 ± 3 | 70 ± 3 | |
| Glycemic Status | |||||
| Fasting glucose, mg/dL | OMV | 86 ± 3 | 91 ± 2 | 90 ± 2 | 89 ± 2 |
| LOV | 89 ± 2 | 92 ± 2 | 90 ± 1 | 91 ± 2 | |
| Fasting insulin, µU/mL | OMV | 11.6 ± 1.6 | 8.3 ± 1.2 | 7.6 ± 0.8 | 10.1 ± 2.4 |
| LOV | 9.7 ± 1.3 | 6.9 ± 0.8 | 6.2 ± 0.9 | 6.2 ± 0.7 | |
| HOMA-IR | OMV | 2.54 ± 0.42 | 1.90 ± 0.29 | 1.73 ± 0.19 | 2.38 ± 0.68 |
| LOV | 2.14 ± 0.29 | 1.59 ± 0.19 | 1.36 ± 0.20 | 1.42 ± 0.18 | |
| HOMA-β, % | OMV | 144.9 ± 30.8 | 104.9 ± 11.9 | 98.9 ± 7.3 | 124.9 ± 25.2 |
| LOV | 150.4 ± 25.0 | 87.5 ± 9.3 | 87.5 ± 13.3 | 88.8 ± 8.6 | |
| Glucose AUC e, mg/dL × 240 min | OMV | 1557 ± 282 | 1559 ± 278 | 2164 ± 288 | |
| LOV | 2182 ± 274 | 2156 ± 270 | 2245 ± 279 | ||
| Insulin AUC ef, µU/mL × 240 min | OMV | 3964 ± 451 | 3367 ± 411 | 4565 ± 639 | |
| LOV | 4133 ± 365 | 3891 ± 443 | 4675 ± 637 | ||
| Blood Pressure Status g | |||||
| Reclining systolic BP, mm Hg | OMV | 122 ± 2 | 116 ± 3 | 116 ± 3 | 112 ± 2 |
| LOV | 123 ± 3 | 117 ± 3 | 118 ± 4 | 115 ± 3 | |
| Reclining Diastolic BP, mm Hg | OMV | 81 ± 2 | 77 ± 2 | 76 ± 2 | 73 ± 1 |
| LOV | 78 ± 2 | 75 ± 1 | 76 ± 2 | 75 ± 2 | |
| Sitting Systolic BP, mm Hg | OMV | 116 ± 3 | 111 ± 3 | 112 ± 2 | 108 ± 2 |
| LOV | 120 ± 4 | 115 ± 3 | 112 ± 4 | 110 ± 3 | |
| Sitting Diastolic BP, mm Hg | OMV | 74 ± 2 | 70 ± 2 | 69 ± 2 | 67 ± 1 |
| LOV | 74 ± 2 | 71 ± 2 | 70 ± 2 | 69 ± 2 | |
| Fasting Renal Status g | |||||
| Serum Creatinine, mg/dL | OMV | 0.90 ± 0.05 | 0.86 ± 0.04 | 0.90 ± 0.04 | 0.86 ± 0.05 |
| LOV | 0.92 ± 0.04 | 0.83 ± 0.04 | 0.82 ± 0.03 | 0.82 ± 0.03 | |
| Creatinine clearance rate, mL/min | OMV | 111 ± 6 | 108 ± 7 | 103 ± 6 | 110 ± 8 |
| LOV | 104 ± 6 | 107 ± 7 | 107 ± 6 | 106 ± 6 | |
| Glomerular filtration rate, mL/min | OMV | 83 ± 4 | 86 ± 4 | 83 ± 4 | 85 ± 4 |
| LOV | 80 ± 4 | 88 ± 4 | 88 ± 4 | 87 ± 4 | |
| Resting Energy Expenditure | |||||
| REEf, kcal/kg/h h | OMV | 0.89 ± 0.04 | 0.90 ± 0.04 | 0.90 ± 0.04 | 0.87 ± 0.04 |
| LOV | 0.92 ± 0.03 | 0.86 ± 0.05 | 0.90 ± 0.04 | 0.98 ± 0.04 | |
| REEpp AUC e, kcal/kg/h × 4 h | OMV | 0.47 ± 0.09 | 0.40 ± 0.06 | 0.58 ± 0.11 | |
| LOV | 0.66 ± 0.01 | 0.58 ± 0.12 | 0.48 ± 0.10 | ||
| Thermic effect of feeding i (%) | OMV | 8.9 ± 1.6 | 7.7 ± 1.3 | 11.0 ± 2.1 | |
| LOV | 12.7 ± 2.0 | 11.1 ± 2.4 | 9.1 ± 1.8 |
3.2. Longitudinal Response to the Dietary Intervention
3.2.1. Compliance

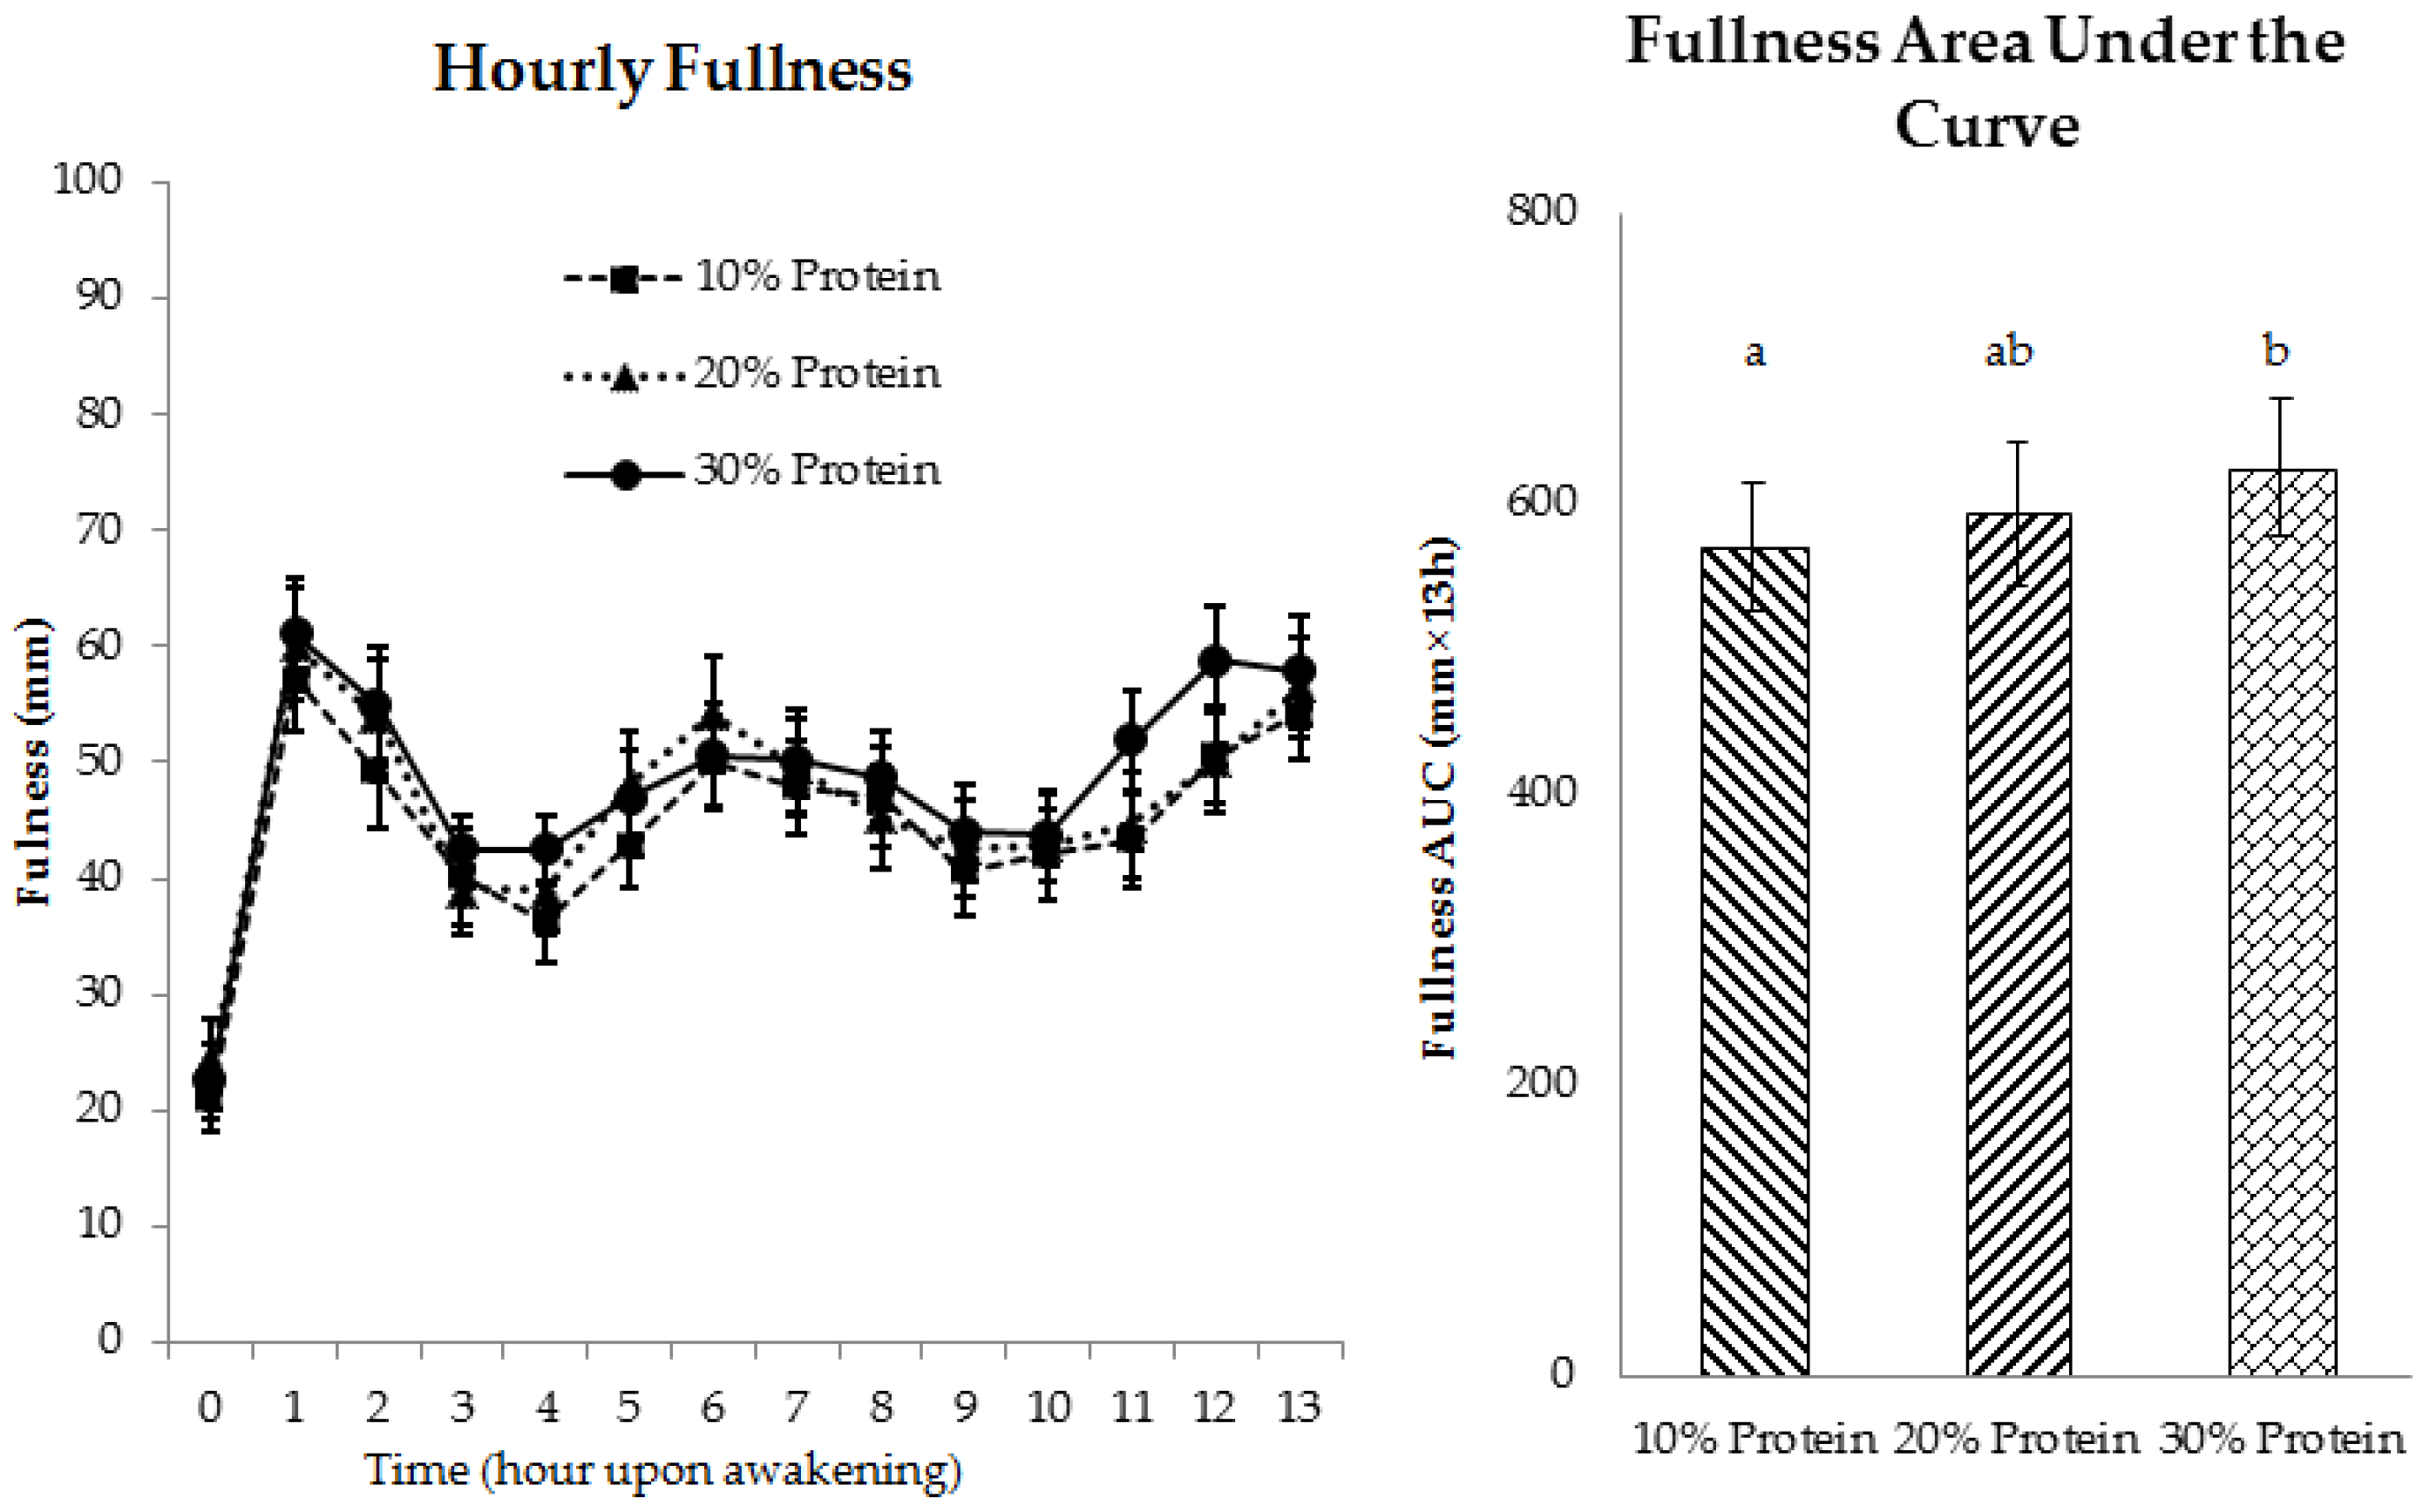
3.2.2. Appetite
3.2.3. Fasting-State Resting Energy Expenditure (REEf)
3.2.4. Metabolic Health
3.3. Postprandial Responses to the Breakfast Test Meal (Day 28 of Each 4-Week Controlled Feeding Period)
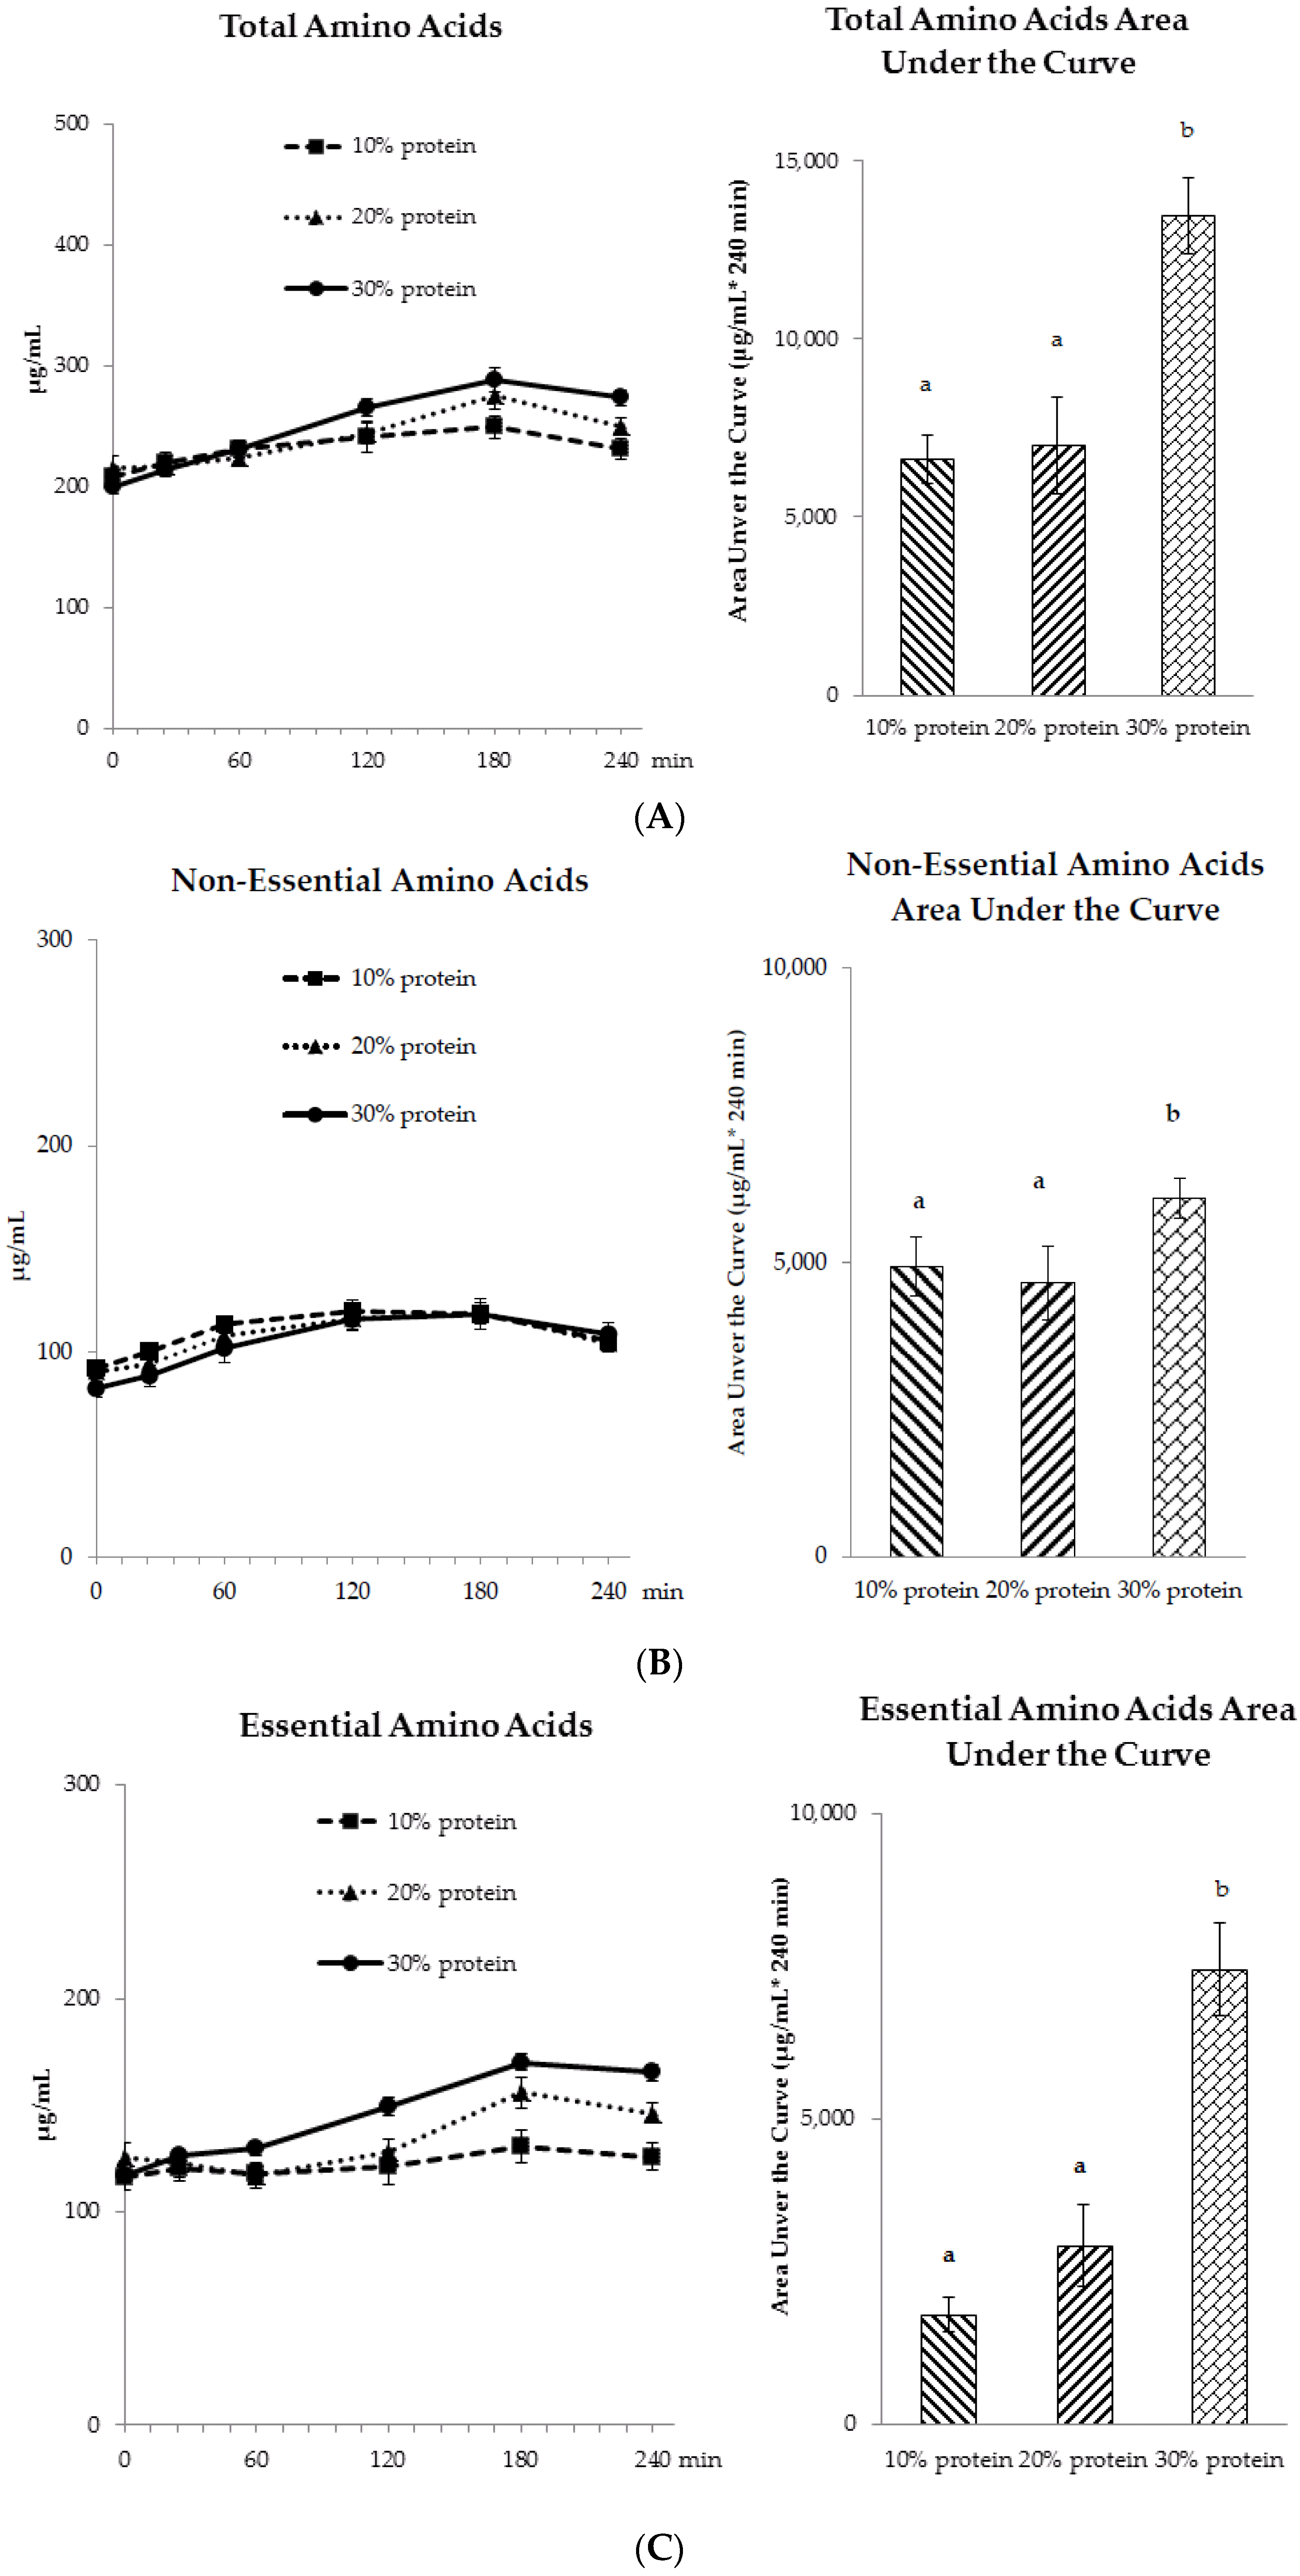
3.3.1. Amino Acid Profiles

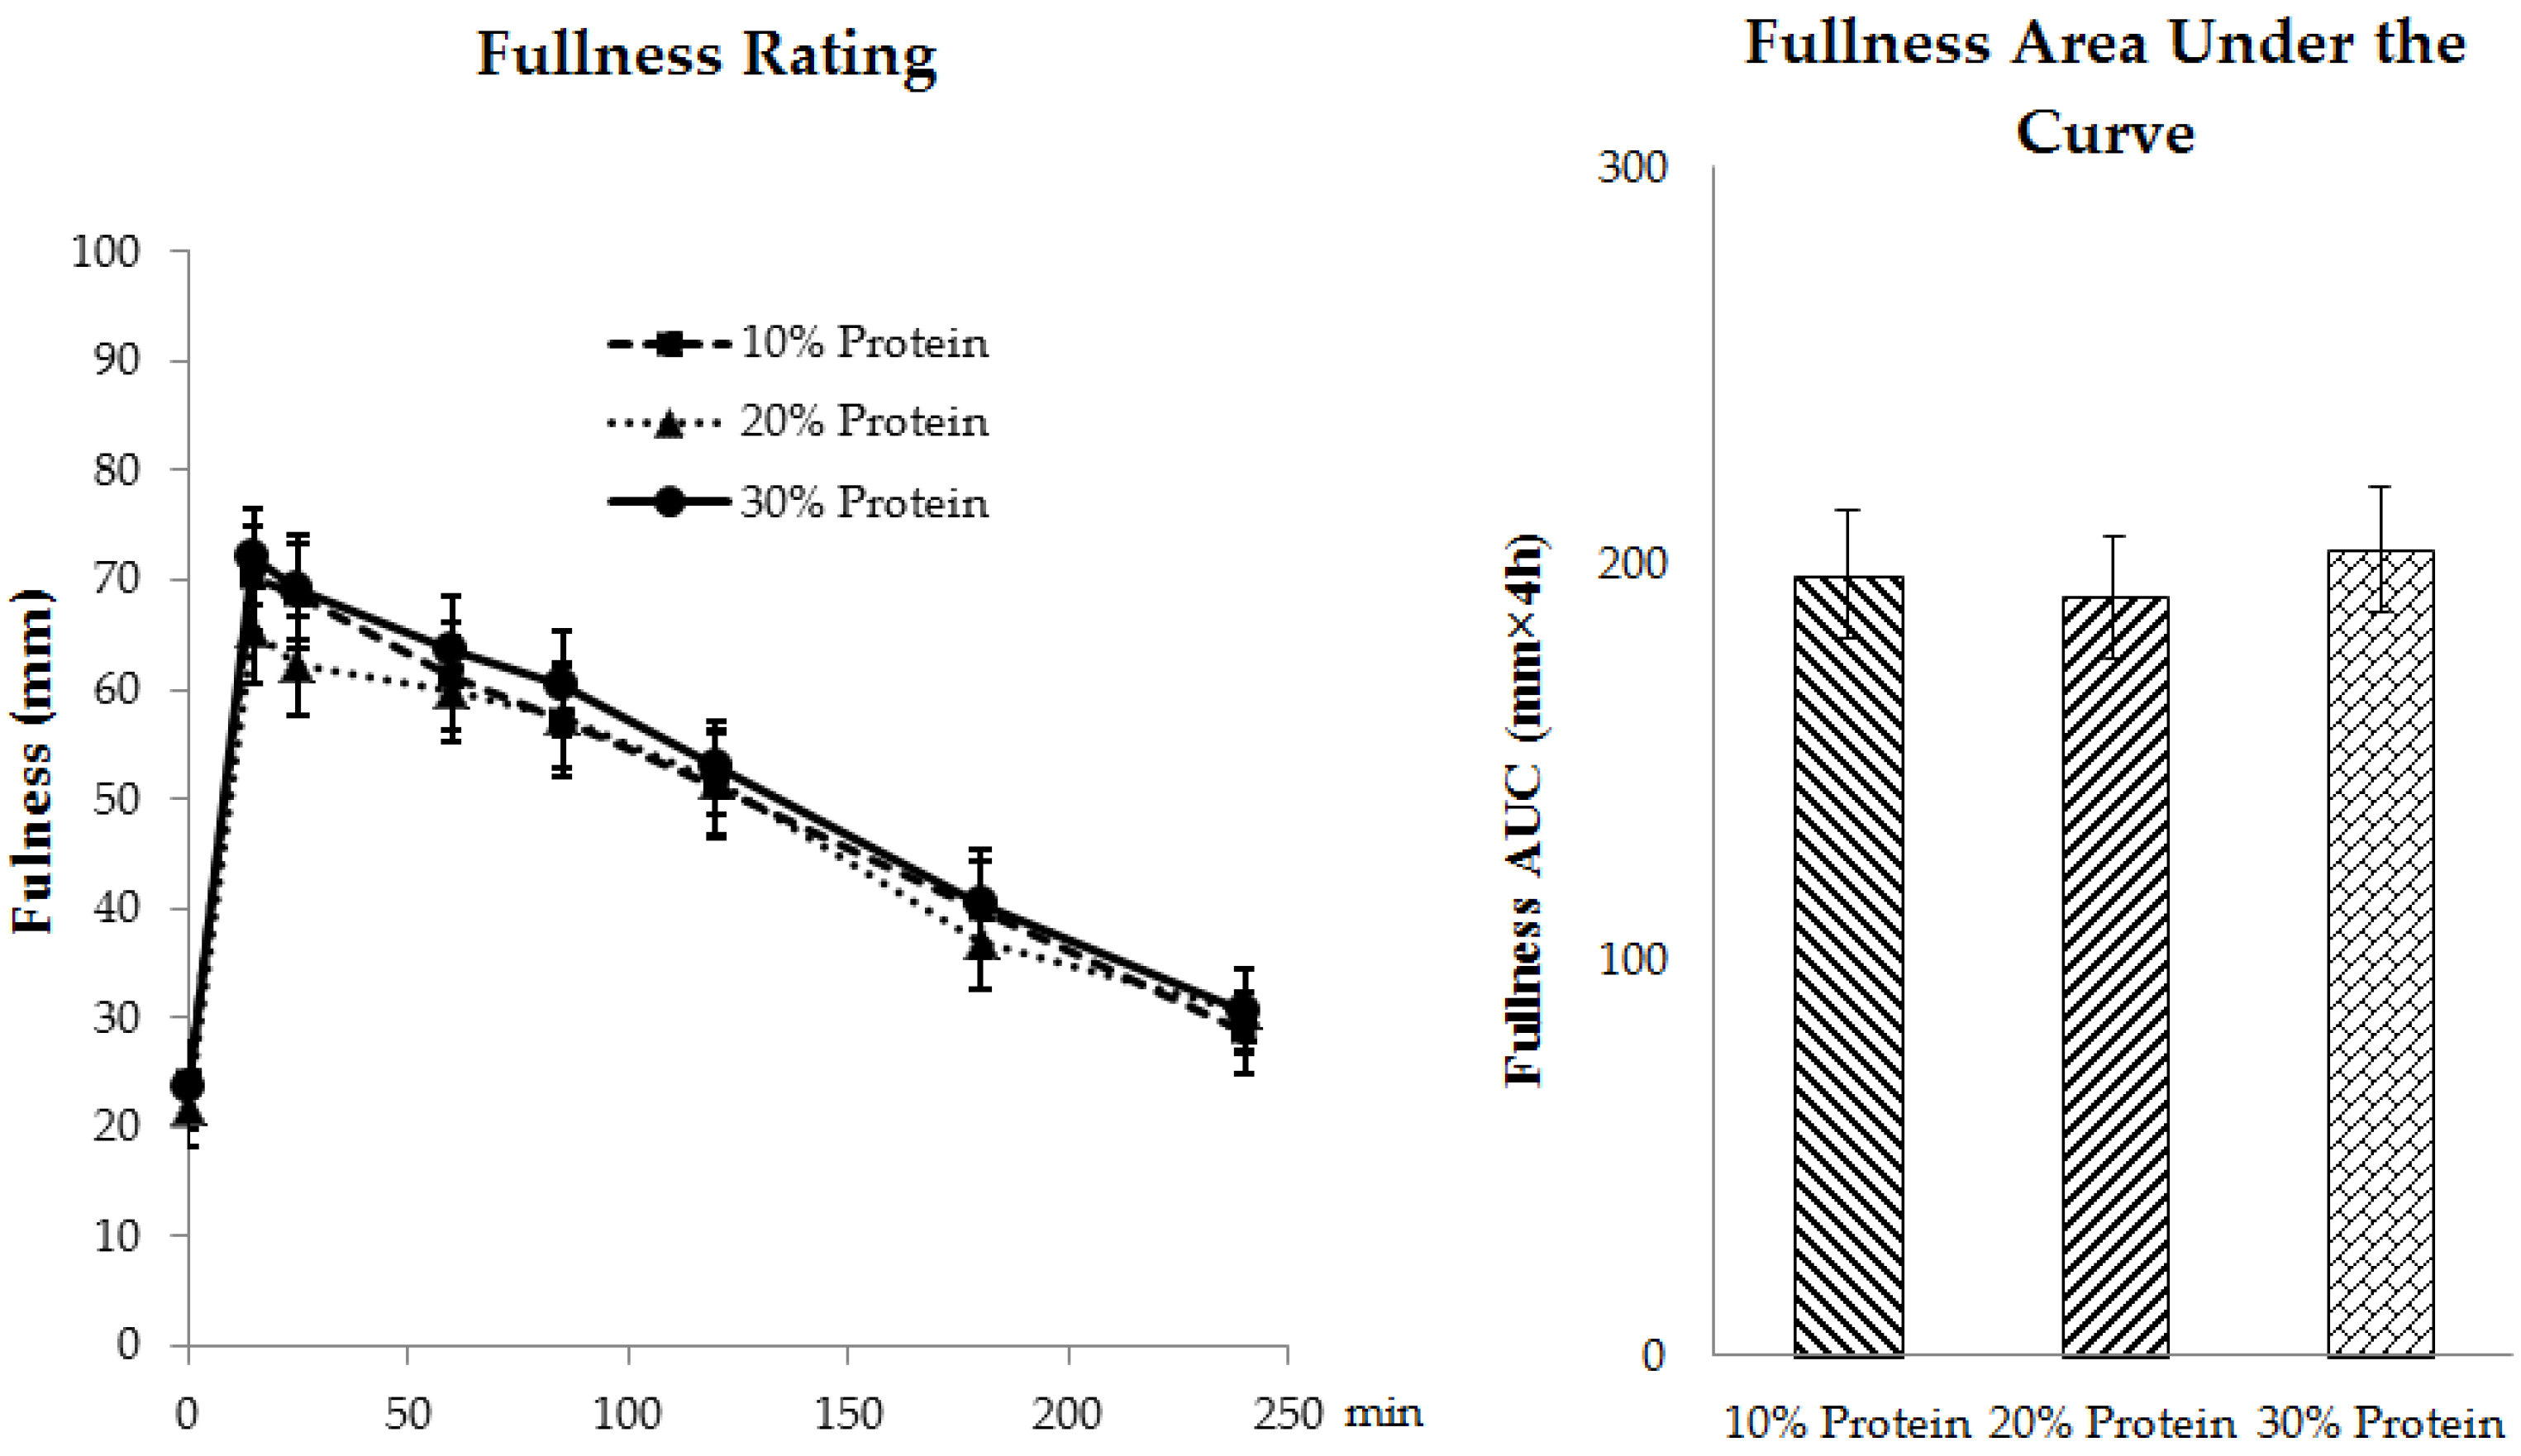
3.3.2. Appetite

3.3.3. Postprandial Energy Expenditures (REEpp)
3.3.4. Postprandial Glycemic and Insulinemic Responses
4. Discussion
4.1. Appetite
4.2. Fasting Energy Expenditure
4.3. Thermic Effect of Feeding
4.4. Cardio-Metabolic Indices
5. Conclusions
Supplementary Materials
Acknowledgments
Author Contributions
Conflicts of Interest
References
- Westerterp-Plantenga, M.S.; Lemmens, S.G.; Westerterp, K.R. Dietary protein—Its role in satiety, energetics, weight loss and health. Br. J. Nutr. 2012, 108, S105–S112. [Google Scholar] [CrossRef] [PubMed]
- Nickols-Richardson, S.M.; Coleman, M.D.; Volpe, J.J.; Hosig, K.W. Perceived hunger is lower and weight loss is greater in overweight premenopausal women consuming a low-carbohydrate/high-protein vs. high-carbohydrate/low-fat diet. J. Am. Diet. Assoc. 2005, 105, 1433–1437. [Google Scholar] [CrossRef] [PubMed]
- Leidy, H.J.; Carnell, N.S.; Mattes, R.D.; Campbell, W.W. Higher protein intake preserves lean mass and satiety with weight loss in pre-obese and obese women. Obesity 2007, 15, 421–429. [Google Scholar] [CrossRef] [PubMed]
- Wycherley, T.P.; Moran, L.J.; Clifton, P.M.; Noakes, M.; Brinkworth, G.D. Effects of energy-restricted high-protein, low-fat compared with standard-protein, low-fat diets: A meta-analysis of randomized controlled trials. Am. J. Clin. Nutr. 2012, 96, 1281–1298. [Google Scholar] [CrossRef] [PubMed]
- Astrup, A. The satiating power of protein—A key to obesity prevention? Am. J. Clin. Nutr. 2005, 82, 1–2. [Google Scholar] [PubMed]
- Eisenstein, J.; Roberts, S.B.; Dallal, G.; Saltzman, E. High-protein weight-loss diets: Are they safe and do they work? A review of the experimental and epidemiologic data. Nutr. Rev. 2002, 60, 189–200. [Google Scholar] [CrossRef] [PubMed]
- Halton, T.L.; Hu, F.B. The effects of high protein diets on thermogenesis, satiety and weight loss: A critical review. J. Am. Coll. Nutr. 2004, 23, 373–385. [Google Scholar] [CrossRef]
- Yang, D.; Liu, Z.; Yang, H.; Jue, Y. Acute effects of high-protein versus normal-protein isocaloric meals on satiety and ghrelin. Eur. J. Nutr. 2014, 53, 493–500. [Google Scholar] [CrossRef] [PubMed]
- Das, S.K.; Gilhooly, C.H.; Golden, J.K.; Pittas, A.G.; Fuss, P.J.; Cheatham, R.A.; Tyler, S.; Tsay, M.; McCrory, M.A.; Lichtenstein, A.H.; et al. Long-term effects of 2 energy-restricted diets differing in glycemic load on dietary adherence, body composition, and metabolism in calerie: A 1-y randomized controlled trial. Am. J. Clin. Nutr. 2007, 85, 1023–1030. [Google Scholar] [PubMed]
- Johnston, C.S.; Tjonn, S.L.; Swan, P.D. High-protein, low-fat diets are effective for weight loss and favorably alter biomarkers in healthy adults. J. Nutr. 2004, 134, 586–591. [Google Scholar] [PubMed]
- Kleiner, R.E.; Hutchins, A.M.; Johnston, C.S.; Swan, P.D. Effects of an 8-weeks high-protein or high-carbohydrate diet in adults with hyperinsulinemia. MedGenMed 2006, 8, 39. [Google Scholar] [PubMed]
- Layman, D.K.; Boileau, R.A.; Erickson, D.J.; Painter, J.E.; Shiue, H.; Sather, C.; Christou, D.D. A reduced ratio of dietary carbohydrate to protein improves body composition and blood lipid profiles during weight loss in adult women. J. Nutr. 2003, 133, 411–417. [Google Scholar] [PubMed]
- Ravussin, E.; Lillioja, S.; Anderson, T.E.; Christin, L.; Bogardus, C. Determinants of 24-h energy expenditure in man. Methods and results using a respiratory chamber. J. Clin. Investig. 1986, 78, 1568–1578. [Google Scholar] [CrossRef] [PubMed]
- Raben, A.; Agerholm-Larsen, L.; Flint, A.; Holst, J.J.; Astrup, A. Meals with similar energy densities but rich in protein, fat, carbohydrate, or alcohol have different effects on energy expenditure and substrate metabolism but not on appetite and energy intake. Am. J. Clin. Nutr. 2003, 77, 91–100. [Google Scholar] [PubMed]
- Westerterp, K.R.; Wilson, S.A.; Rolland, V. Diet induced thermogenesis measured over 24 h in a respiration chamber: Effect of diet composition. Int. J. Obes. Relat. Metab. Disord. 1999, 23, 287–292. [Google Scholar] [CrossRef] [PubMed]
- Williamson, D.A.; Geiselman, P.J.; Lovejoy, J.; Greenway, F.; Volaufova, J.; Martin, C.K.; Arnett, C.; Ortego, L. Effects of consuming mycoprotein, tofu or chicken upon subsequent eating behaviour, hunger and safety. Appetite 2006, 46, 41–48. [Google Scholar] [CrossRef] [PubMed]
- Uhe, A.M.; Collier, G.R.; O’Dea, K. A comparison of the effects of beef, chicken and fish protein on satiety and amino acid profiles in lean male subjects. J. Nutr. 1992, 122, 467–472. [Google Scholar] [PubMed]
- Anderson, J.W.; Fuller, J.; Patterson, K.; Blair, R.; Tabor, A. Soy compared to casein meal replacement shakes with energy-restricted diets for obese women: Randomized controlled trial. Metab. Clin. Exp. 2007, 56, 280–288. [Google Scholar] [CrossRef] [PubMed]
- Mikkelsen, P.B.; Toubro, S.; Astrup, A. Effect of fat-reduced diets on 24-h energy expenditure: Comparisons between animal protein, vegetable protein, and carbohydrate. Am. J. Clin. Nutr. 2000, 72, 1135–1141. [Google Scholar] [PubMed]
- Bonnema, A.L.; Altschwager, D.; Thomas, W.; Slavin, J.L. The effects of a beef-based meal compared to a calorie matched bean-based meal on appetite and food intake. J. Food Sci. 2015, 80, 2088–2093. [Google Scholar] [CrossRef] [PubMed]
- Veldhorst, M.A.; Nieuwenhuizen, A.G.; Hochstenbach-Waelen, A.; van Vught, A.J.; Westerterp, K.R.; Engelen, M.P.; Brummer, R.J.; Deutz, N.E.; Westerterp-Plantenga, M.S. Dose-dependent satiating effect of whey relative to casein or soy. Physiol. Behav. 2009, 96, 675–682. [Google Scholar] [CrossRef] [PubMed]
- Tan, S.Y.; Batterham, M.; Tapsell, L. Energy expenditure does not differ, but protein oxidation rates appear lower in meals containing predominantly meat versus soy sources of protein. Obes. Facts 2010, 3, 101–104. [Google Scholar] [CrossRef] [PubMed]
- Stunkard, A.J.; Messick, S. The three-factor eating questionnaire to measure dietary restraint, disinhibition and hunger. J. Psychosom. Res. 1985, 29, 71–83. [Google Scholar] [CrossRef]
- National Academy of Sciences. Dietary Reference Intakes for Energy, Carbohydrate, Fiber, Fat, Fatty Acids, Cholesterol, Protein, and Amino Acids; National Academies Press: Washington, DC, USA, 2005; p. 1331. [Google Scholar]
- Smit, E.; Nieto, F.J.; Crespo, C.J.; Mitchell, P. Estimates of animal and plant protein intake in us adults: Results from the third national health and nutrition examination survey, 1988–1991. J. Am. Diet. Assoc. 1999, 99, 813–820. [Google Scholar] [CrossRef]
- Fulgoni, V.L., 3rd. Current protein intake in america: Analysis of the national health and nutrition examination survey, 2003–2004. Am. J. Clin. Nutr. 2008, 87, 1554S–1557S. [Google Scholar] [PubMed]
- Weyers, A.M.; Mazzetti, S.A.; Love, D.M.; Gomez, A.L.; Kraemer, W.J.; Volek, J.S. Comparison of methods for assessing body composition changes during weight loss. Med. Sci. Sports Exerc. 2002, 34, 497–502. [Google Scholar] [CrossRef] [PubMed]
- Dempster, P.; Aitkens, S. A new air displacement method for the determination of human body composition. Med. Sci. Sports Exerc. 1995, 27, 1692–1697. [Google Scholar] [CrossRef] [PubMed]
- Stubbs, R.J.; Hughes, D.A.; Johnstone, A.M.; Rowley, E.; Reid, C.; Elia, M.; Stratton, R.; Delargy, H.; King, N.; Blundell, J.E. The use of visual analogue scales to assess motivation to eat in human subjects: A review of their reliability and validity with an evaluation of new hand-held computerized systems for temporal tracking of appetite ratings. Br. J. Nutr. 2000, 84, 405–415. [Google Scholar] [CrossRef] [PubMed]
- Weir, J.B. New methods for calculating metabolic rate with special reference to protein metabolism. Nutrition 1990, 6, 213–221. [Google Scholar] [CrossRef] [PubMed]
- Friedewald, W.T.; Levy, R.I.; Fredrickson, D.S. Estimation of the concentration of low-density lipoprotein cholesterol in plasma, without use of the preparative ultracentrifuge. Clin. Chem. 1972, 18, 499–502. [Google Scholar] [PubMed]
- Wallace, T.M.; Levy, J.C.; Matthews, D.R. Use and abuse of homa modeling. Diabetes Care 2004, 27, 1487–1495. [Google Scholar] [CrossRef] [PubMed]
- Matthews, D.R.; Hosker, J.P.; Rudenski, A.S.; Naylor, B.A.; Treacher, D.F.; Turner, R.C. Homeostasis model assessment: Insulin resistance and beta-cell function from fasting plasma glucose and insulin concentrations in man. Diabetol. 1985, 28, 412–419. [Google Scholar] [CrossRef]
- Campbell, W.W.; Johnson, C.A.; McCabe, G.P.; Carnell, N.S. Dietary protein requirements of younger and older adults. Am. J. Clin. Nutr. 2008, 88, 1322–1329. [Google Scholar] [PubMed]
- Levey, A.S.; Stevens, L.A.; Schmid, C.H.; Zhang, Y.L.; Castro, A.F., 3rd; Feldman, H.I.; Kusek, J.W.; Eggers, P.; van Lente, F.; Greene, T.; et al. A new equation to estimate glomerular filtration rate. Ann. Intern. Med. 2009, 150, 604–612. [Google Scholar] [CrossRef] [PubMed]
- Cockcroft, D.W.; Gault, M.H. Prediction of creatinine clearance from serum creatinine. Nephron 1976, 16, 31–41. [Google Scholar] [CrossRef] [PubMed]
- Association of Analytical Communities (AOAC). Official Methods of Analysis Amino Acids Analysis Complete Amino Acid Profile (AAP)-Item 72; AOAC: Gaithersburg, MD, USA, 2006. [Google Scholar]
- Wolever, T.M. Effect of blood sampling schedule and method of calculating the area under the curve on validity and precision of glycaemic index values. Br. J. Nutr. 2004, 91, 295–301. [Google Scholar] [CrossRef] [PubMed]
- Morse, M.H.; Haub, M.D.; Evans, W.J.; Campbell, W.W. Protein requirement of elderly women: Nitrogen balance responses to three levels of protein intake. J. Gerontol. Ser. A Biol. Sci. Med. Sci. 2001, 56, M724–M730. [Google Scholar] [CrossRef]
- Leidy, H.J.; Tang, M.; Armstrong, C.L.; Martin, C.B.; Campbell, W.W. The effects of consuming frequent, higher protein meals on appetite and satiety during weight loss in overweight/obese men. Obesity 2011, 19, 818–824. [Google Scholar] [CrossRef] [PubMed]
- Bendtsen, L.Q.; Lorenzen, J.K.; Bendsen, N.T.; Rasmussen, C.; Astrup, A. Effect of dairy proteins on appetite, energy expenditure, body weight, and composition: A review of the evidence from controlled clinical trials. Adv. Nutr. 2013, 4, 418–438. [Google Scholar] [CrossRef] [PubMed]
- Neacsu, M.; Fyfe, C.; Horgan, G.; Johnstone, A.M. Appetite control and biomarkers of satiety with vegetarian (soy) and meat-based high-protein diets for weight loss in obese men: A randomized crossover trial. Am. J. Clin. Nutr. 2014, 100, 548–558. [Google Scholar] [CrossRef] [PubMed]
- Douglas, S.M.; Lasley, T.R.; Leidy, H.J. Consuming beef vs. Soy protein has little effect on appetite, satiety, and food intake in healthy adults. J. Nutr. 2015, 145, 1010–1016. [Google Scholar] [CrossRef] [PubMed]
- Baba, N.H.; Sawaya, S.; Torbay, N.; Habbal, Z.; Azar, S.; Hashim, S.A. High protein vs. high carbohydrate hypoenergetic diet for the treatment of obese hyperinsulinemic subjects. Int. J. Obes. Relat. Metab. Disord. 1999, 23, 1202–1206. [Google Scholar] [CrossRef] [PubMed]
- Torbay, N.; Hwalla Baba, N.; Sawaya, S.; Bajjani, R.; Habbal, Z.; Azar, S.; Hashim, S.A. High protein vs. high carbohydrate hypoenergetic diet in treatment of obese normoinsulinemic and hyperinsulinemic subjects. Nutr. Res. 2002, 22, 587–598. [Google Scholar] [CrossRef]
- Luscombe, N.D.; Clifton, P.M.; Noakes, M.; Farnsworth, E.; Wittert, G. Effect of a high-protein, energy-restricted diet on weight loss and energy expenditure after weight stabilization in hyperinsulinemic subjects. Int. J. Obes. Relat. Metab. Disord. 2003, 27, 582–590. [Google Scholar] [CrossRef] [PubMed]
- Reed, G.W.; Hill, J.O. Measuring the thermic effect of food. Am. J. Clin. Nutr. 1996, 63, 164–169. [Google Scholar] [PubMed]
- Kunz, I.; Klaus, S.; Kallies, B.; Schorr, U.; Sharma, A.M. Kinetic analysis of the thermic effect of food and its relationship to body composition in humans. Metabolism 2000, 49, 1340–1345. [Google Scholar] [CrossRef] [PubMed]
- Park, Y.M.; Heden, T.D.; Liu, Y.; Nyhoff, L.M.; Thyfault, J.P.; Leidy, H.J.; Kanaley, J.A. A high-protein breakfast induces greater insulin and glucose-dependent insulinotropic peptide responses to a subsequent lunch meal in individuals with type 2 diabetes. J. Nutr. 2015, 145, 452–458. [Google Scholar] [CrossRef] [PubMed]
- Nuttall, F.Q.; Mooradian, A.D.; Gannon, M.C.; Billington, C.; Krezowski, P. Effect of protein ingestion on the glucose and insulin response to a standardized oral glucose load. Diabetes Care 1984, 7, 465–470. [Google Scholar] [CrossRef] [PubMed]
© 2016 by the authors; licensee MDPI, Basel, Switzerland. This article is an open access article distributed under the terms and conditions of the Creative Commons by Attribution (CC-BY) license (http://creativecommons.org/licenses/by/4.0/).
Share and Cite
Li, J.; Armstrong, C.L.H.; Campbell, W.W. Effects of Dietary Protein Source and Quantity during Weight Loss on Appetite, Energy Expenditure, and Cardio-Metabolic Responses. Nutrients 2016, 8, 63. https://doi.org/10.3390/nu8020063
Li J, Armstrong CLH, Campbell WW. Effects of Dietary Protein Source and Quantity during Weight Loss on Appetite, Energy Expenditure, and Cardio-Metabolic Responses. Nutrients. 2016; 8(2):63. https://doi.org/10.3390/nu8020063
Chicago/Turabian StyleLi, Jia, Cheryl L. H. Armstrong, and Wayne W. Campbell. 2016. "Effects of Dietary Protein Source and Quantity during Weight Loss on Appetite, Energy Expenditure, and Cardio-Metabolic Responses" Nutrients 8, no. 2: 63. https://doi.org/10.3390/nu8020063