Article

Additional Value of CH4 Measurement in a Combined 13C/H2 Lactose Malabsorption Breath Test: A Retrospective Analysis

1
Translational Research Center for Gastrointestinal Disorders (TARGID), KU Leuven, Leuven 3000, Belgium
2
Clinical Department of Laboratory Medicine, University Hospitals Leuven, Leuven 3000, Belgium
3
Group Health and Social Work, University College Leuven-Limburg (UCLL), Leuven 3000, Belgium
4
Laboratory of Clinical and Epidemiological Virology, KU Leuven, Leuven 3000, Belgium
5
Leuven Food Science and Nutrition Research Centre (LFoRCe), Leuven 3000, Belgium
*
Author to whom correspondence should be addressed.
Nutrients 2015, 7(9), 7469-7485; https://doi.org/10.3390/nu7095348
Submission received: 15 July 2015 / Revised: 31 August 2015 / Accepted: 1 September 2015 / Published: 7 September 2015
(This article belongs to the Special Issue Lactose Intolerance: Biology, Genetics and Dietary Management)

Abstract

:
The lactose hydrogen breath test is a commonly used, non-invasive method for the detection of lactose malabsorption and is based on an abnormal increase in breath hydrogen (H2) excretion after an oral dose of lactose. We use a combined 13C/H2 lactose breath test that measures breath 13CO2 as a measure of lactose digestion in addition to H2 and that has a better sensitivity and specificity than the standard test. The present retrospective study evaluated the results of 1051 13C/H2 lactose breath tests to assess the impact on the diagnostic accuracy of measuring breath CH4 in addition to H2 and 13CO2. Based on the 13C/H2 breath test, 314 patients were diagnosed with lactase deficiency, 138 with lactose malabsorption or small bowel bacterial overgrowth (SIBO), and 599 with normal lactose digestion. Additional measurement of CH4 further improved the accuracy of the test as 16% subjects with normal lactose digestion and no H2-excretion were found to excrete CH4. These subjects should have been classified as subjects with lactose malabsorption or SIBO. In conclusion, measuring CH4-concentrations has an added value to the 13C/H2 breath test to identify methanogenic subjects with lactose malabsorption or SIBO.

1. Introduction

Lactose malabsorption refers to a condition in which the disaccharide lactose, a carbohydrate exclusively occurring in mammalian milk, is not completely digested in the small intestine and reaches the large intestine. Small intestinal digestion of lactose occurs by the brush border enzyme lactase, also known as lactase-phlorizin hydrolase, which belongs to the family of β-galactosidase enzymes. Lactase hydrolyses lactose into its constituent monosaccharides glucose and galactose that are subsequently absorbed by the intestinal mucosa. Unabsorbed lactose enters the large intestine where it is fermented by the resident microbiota. Major end products include short chain fatty acids (SCFA) comprising acetate, propionate and butyrate as well as gasses such as hydrogen (H2), methane (CH4) and carbon dioxide (CO2).
Humans are generally born with high levels of lactase activity. However, these levels decline after weaning and reach a stable, low level at the age of about 5–10 years [1]. Only in some populations, especially Caucasians, lactase activity persists at high levels at adult age due to a single nucleotide polymorphism (SNP) within an intron upstream of the lactose coding region (13910C/T with the T-variant causing persistence and the C-variant leading to non-persistence) [2]. Besides hypolactasia, gastrointestinal disorders that affect the small intestinal mucosal integrity such as Crohn’s disease, coeliac disease or gut infections [3], or pelvic radiotherapy [4] can also induce lactose malabsorption. This so-called secondary lactose malabsorption disappears upon healing of the mucosa.
In subjects with lactose malabsorption, the intake of lactose can, but does not necessarily, induce gastrointestinal symptoms including nausea, bloating, flatulence, diarrhea, borborygmi and abdominal pain. Besides, also systemic symptoms have been reported such as headache, fatigue or skin disease [5]. Those subjects are considered to be lactose intolerant. Importantly, lactose intolerance is not a synonym to lactose malabsorption but specifically refers to the experience of discomfort after intake of lactose in subjects with hypolactasia. Only one third up to half of the patients with lactose malabsorption is also lactose intolerant [6,7].
Several tests are available to detect lactase deficiency and lactose malabsorption. The most direct approach, which has therefore been proposed as the golden standard, is the assessment of lactase activity in jejunal biopsies [8]. However, this test is invasive and the result may be influenced by the fact that lactase is irregularly expressed in the intestinal mucosa which limits its widespread application [9]. Other tests involve the measurement of the increase in serum glucose after oral lactose administration or genetic testing to detect SNPs in the lactase gene located on chromosome 2 (2p21q). The most commonly used, inexpensive and widely available test is the lactose hydrogen breath test. This test aims to detect an abnormal increase in breath hydrogen excretion after an oral dose of lactose.
Unfortunately, there is no consensus on the optimal procedure to perform a lactose breath test, relating to administered dose of lactose (20–50 g of lactose), sampling interval (15, 30 or 60 min), test duration (2–5 h) and criteria for a positive test (10 or 20 ppm increase over baseline). Similarly, there is no consensus on whether it is recommended to measure CH4-excretion in breath in addition to H2.
The lactose breath test exhibits a high specificity (89%–97.6%) whereas a mean sensitivity of 77.5% has been reported [10,11]. Additional measurement of CH4-excretion has been proposed as a means to improve the accuracy of the test [12,13,14]. Indeed, generation of methane involves the reduction of CO2 by H2 to yield CH4 [15]. As this reaction removes considerable amounts of H2, it can result in a too low increase in H2 concentrations to result in a measurable increase in breath hydrogen and consequently yield a false negative result. These individuals are classified as H2–non-producers. In most studies, they account for <10% of the subjects [10].
In our hospital, we routinely apply a modified version of the lactose breath test by making use of stable isotope labelled (13C) lactose that allows to estimate the digestion of lactose in addition to the malabsorption of the sugar. Lactose that is digested in the small intestine results in the production of 13C-labelled glucose and galactose. The monosaccharides are absorbed and transported to the liver via the portal blood where they are oxidized to 13CO2 that is exhaled in breath. The test has been validated previously versus jejunal lactase activity [11].
This study was designed to evaluate the impact on the diagnostic accuracy of the lactose breath test when measuring breath CH4 in addition to H2 and 13CO2.

2. Experimental Section

2.1. Subjects

This retrospective study was performed at the Department of Laboratory Medicine of the University Hospitals Leuven (Leuven, Belgium). Data of all subjects that performed a combined 13C/H2 lactose breath test to examine lactose malabsorption between January 2014 and June 2014 were reviewed. Measurements of 13CO2, H2 and CH4, age, gender, Body Mass Index (BMI) for subjects older than 18 years, as well as symptoms recorded on the day of the breath test were extracted from the Hospital’s data management system and were processed.
The study protocol was approved by the Ethics Committee of the University of Leuven in accordance with the declaration of Helsinki (S58141).

2.2. Methods

2.2.1. 13C/H2 Breath Test

The subjects performed a 13C/H2 lactose breath after an overnight fast as described previously [11]. Briefly, four baseline breath samples were collected in Exetainers® (Labco Ltd., Ceredigion, UK) after which the subjects ingested 50 g (children <25 kg; 2g/kg body weight) of naturally enriched 13C-lactose (atom percent: 1.097%; Hanze Nutrition, Groningen, The Netherlands), dissolved in 250 mL of tap water. Subsequently, two breath samples were collected every 30 min for 4 h. During the test, subjects were not allowed to eat, drink or smoke. To keep CO2-production constant, physical activity was prohibited during the test and the subjects remained quietly seated. Patients were asked to report any discomfort experienced during the test or later on the test day.

2.2.2. Analytical Methods

Breath H2-, CH4- and CO2-concentrations were quantified in a single run using a gas chromatograph (GC, Trace GC Ultra, Thermo Scientific, Pittsburgh, PA, USA) coupled to a thermal conductivity detector (TCD, Thermoscientific, Pittsburgh, PA, USA) and a flame ionization detector (FID, Thermo Scientific, Pittsburgh, PA, USA). One mL of breath was injected at a temperature of 90 °C with split ratio 1:20 and injector temperature of 110 °C. Chromatographic separation was achieved isothermally at 120 °C on a packed precolumn (Hayesep-N; 0.25 m; 80–100 mesh; 1/8”SS, Restek, Bellefonte, PA, USA) followed by a packed column (Carboxen 1000; 1.5m; 60–80 mesh; 1/8”SS, Restek, Bellefonte, PA, USA) and using nitrogen 5.0 as a carrier gas with a constant pressure of 96 kPa. H2 eluted from the column with a retention time of 0.8 min and was detected by the TCD with detector temperature at 290 °C, block temperature at 150 °C, transfer temperature at 140 °C, a reference nitrogen flow of 15 mL/min and a gain of 10. After 1 min, a heated valve (50 °C) switched the column effluent to a methanizer at a temperature of 350 °C to convert CO2 into CH4. Both CH4, eluting after 2.3 min and the converted CO2, eluting after 5.4 min, were detected by FID with a temperature at 250 °C, hydrogen flow at 70 mL/min and air flow at 350 mL/min. Data were processed using ChromQuest 5.0 (Thermo Scientific, Pittsburgh, PA, USA). Reference gas (Messer, Zwijndrecht, Belgium) containing 25.4 ppm H2, 2.8 ppm CH4 and 3.6% CO2 was injected every 20 samples for calibration and results were expressed in ppm for H2 and CH4 or in % for CO2. Breath samples that contained less than 1% CO2 were qualified as unreliable due to atmospheric contamination of alveolar breath samples and were excluded from further analysis.
The 13C-content in breath samples was analyzed using a continuous flow isotope ratio mass spectrometer (IRMS, ABCA, Sercon, Crewe, UK) and expressed as δ13PDB value. CO2-production rate was assumed to be 300 mmol/m² body surface area/hour for subjects older than 16 years or children with a body weight ≥80 kg. Body surface area was calculated using the weight-height formula of Haycock et al. [16]. For children <16 years and <80 kg, CO2 productions were calculated according to weight, age, and sex and based on published data about metabolic rates [17]. The measured delta values were converted to percentage of the administered dose of 13C excreted per hour and as cumulative percentage of administered 13C after 4 h. As our IRMS-system was linear for samples containing 0.6%–5% CO2 (i.e., deviation of less than 0.6‰ from the δ13CO2 of completely filled exetainers with reference gas (3.6% CO2)), breath samples containing <0.6% CO2 were excluded from further analysis.

2.2.3. Standard Interpretation of Breath Test Results

A cumulative excretion of 14.5% of administered 13C after 4 h was used as the cutoff value for discrimination between low and normal lactose digestion [11]. Increased H2-excretion was defined as an increase in H2 concentration >20 ppm above baseline levels.
Subjects were classified as normal lactose digesters when the cumulative 13C-excretion after 4 h exceeded 14.5% and no increased H2-excretion during the 4 h during test was observed. Subjects with a cumulative 13C-excretion after 4 h ≤14.5% were diagnosed as lactase deficient, irrespective of a concomitant increase in H2-excretion. A test result with a cumulative 13C-excretion >14.5% and increased H2-excretion, indicated contact of the administered lactose with bacteria despite normal lactase activity, either in the small bowel, suggesting small bowel bacterial overgrowth (SIBO), or in the large bowel, suggesting lactose malabsorption. As no information on transit is available, it is not possible to differentiate between both conditions.

2.2.4. Additional Breath Test Parameters

Breath methane concentrations ≥5 ppm above baseline levels were considered as increased ethane production [12].
The time at which a significant increase in CH4 or H2 compared to baseline was observed in breath was defined as the time at which the CH4- or H2-excretion exceeded 2 SD (standard deviations) of all previous points above the running average of all previous points [18].

2.2.5. Statistics

Statistical analysis was performed using SPSS 22.0 (SPSS Inc. Chicago, IL, USA). Normality was tested with the Shapiro-Wilks-test. When normality assumptions were not met, data were analyzed with non-parametric tests (Kruskal-Wallis (K-W) and Mann-Withney (M-W) test with Bonferonni correction), whereas normally distributed data were analyzed using One-way analysis of Variance (ANOVA) with post-hoc Tuckey test or an independent samples t-test.
Normally distributed data were shown as mean ± standard deviations (SD) whereas not-normally distributed data were expressed as median plus interquartile range (IQR). To investigate differences in the distribution of patients, a Chi-Square test was applied. The level for statistical significance was set at p <0.05.
Spearman correlation was used to evaluate correlation between BMI and CH4-production.

3. Results

3.1. Patient Characteristics
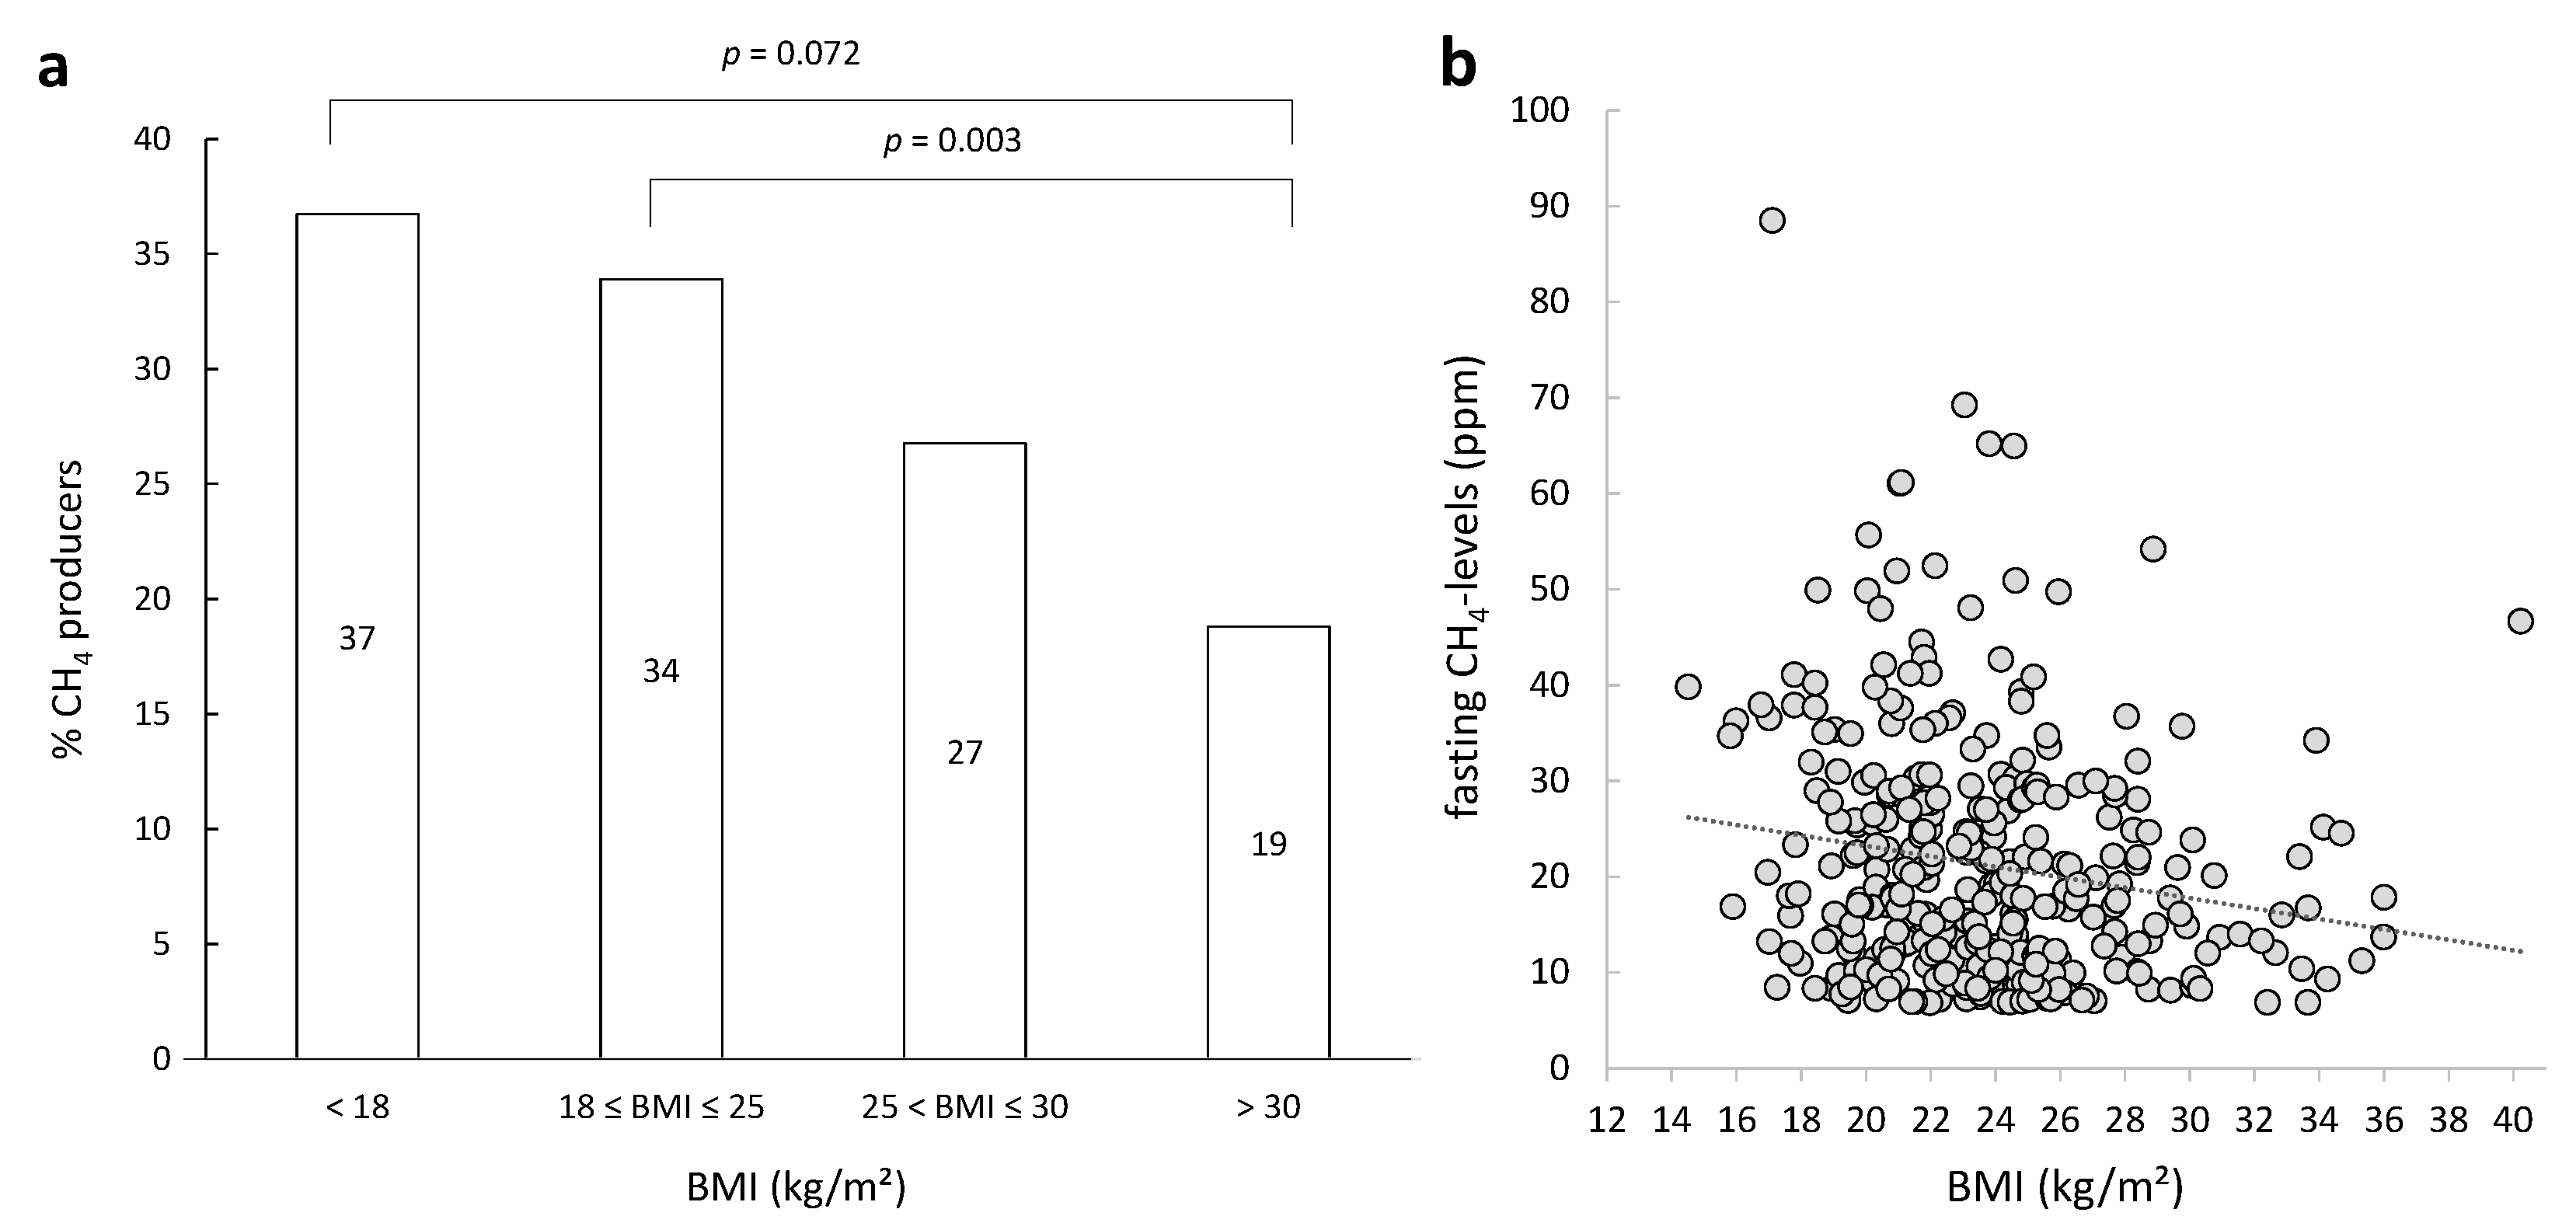
Between January 2014 and June 2014, 1355 breath tests were analysed in the University Hospital Leuven. Sixteen tests (1.2%) were excluded for variable reasons: one subject vomited shortly after intake of the 13C-lactose, two tests were stopped early, and 13 tests were not correctly executed. In addition, 288 subjects that had not reported whether they experienced any discomfort or not on the day of the breath test were excluded from further analysis. Finally, the results of 1051 breath tests were included in this analysis.
The subjects consisted of 313 men (30%) and 738 (70%) females. Of them, 178 were children, aged <18 years. The mean age was 36.2 ± 19.2 years and the mean body mass index amounted to 23.2 ± 5.1 kg/m², children excluded. Four percent of the adults were underweight and had a BMI < 18%, 59% had a normal BMI (18 ≤ BMI ≤ 25), 25% had overweight (25 < BMI ≤ 30) and 12% were obese (BMI>30).
Of the total cohort, 34% of the subjects had fasting levels of CH4 ≥5 ppm above baseline and 15% had fasting H2 levels >20 ppm. Significantly more patients with normal weight produced CH4 in fasting state compared to obese patients (p = 0.003). Similarly, more underweight than obese subjects produced CH4 (p = 0.072, Figure 1a). In addition, the extent of CH4 excretion was significantly negatively correlated to BMI within the group of subjects with baseline CH4 excretion >5 ppm (Spearman’s rho = −0.185, p = 0.000678). (Figure 1b).
Figure 1. Percentage of CH4 producers in fasting state as function of body mass index (BMI) (a) and correlation between fasting CH4 and BMI (b).
Nutrients 07 05348 g001

3.2. Diagnosis

Of all the cases, 599 were diagnosed with normal lactose digestion (57.0%), 314 (29.9%) with lactase deficiency and 138 (13.1%) tests were suggestive of lactose malabsorption or SIBO.
Overall, 25% (265/1051) of the subjects produced H2 but no CH4, 12% (122/1051) produced CH4 but no H2, 3% (33/1051) produced both H2 and CH4, whereas 60% (631/1051) did not produce H2 nor CH4.

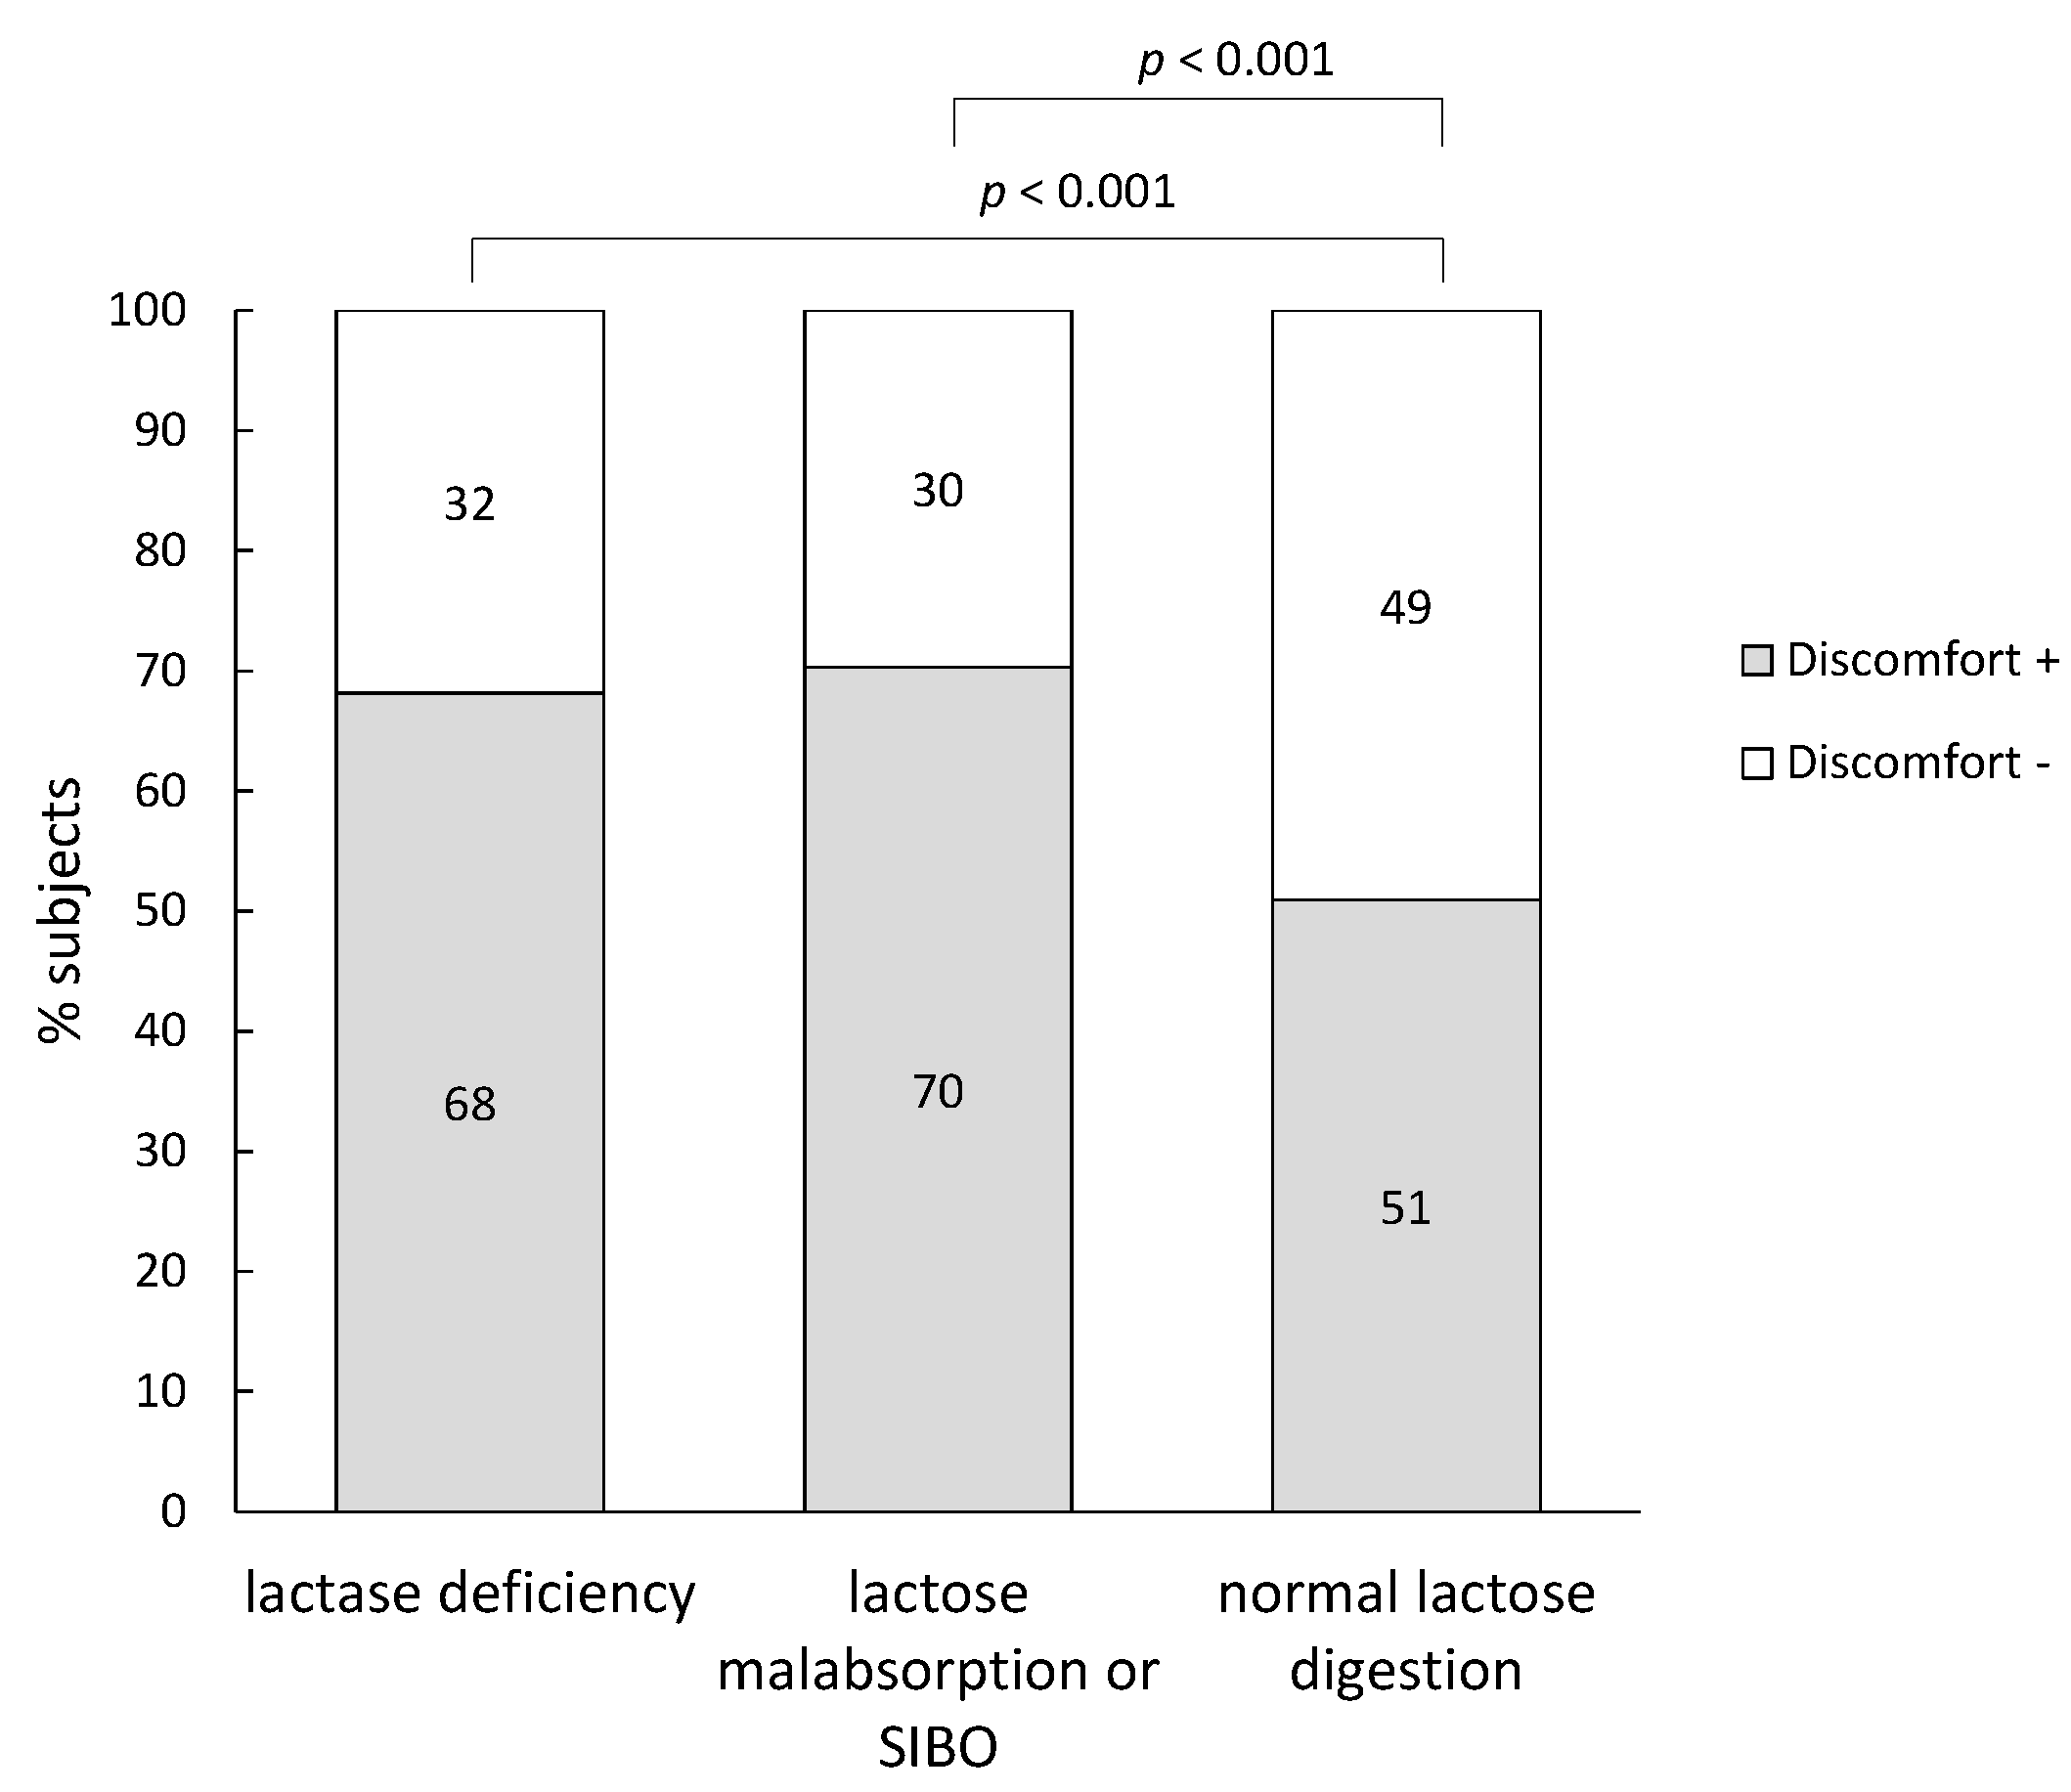
3.3. Occurrence of Symptoms on the Day of the Breath Test

Forty-one percent (435/1051) of all subjects did not experience any discomfort during or after the lactose breath test, whereas 59% (616/1051) reported one or more symptoms. Overall, 1216 symptoms were reported of which 93% were gastrointestinal complaints. Of these, cramps were present in 269 subjects (44%), flatulence in 240 subjects (39%), diarrhea in 196 subjects (32%), nausea in 104 subjects (17%), abdominal pain in 94 subjects (15%), bloating in 75 subjects (12%), eructations in 47 subjects (8%) and borborygmi in 40 subjects (6%). Besides gastrointestinal complaints, also systemic complaints were reported such as headache in 42/616 subjects (7%) and tiredness in 16/616 subjects (3%).
Figure 2 shows that subjects with lactase deficiency and subjects with lactose malabsorption or SIBO reported significantly more discomfort than subjects with normal lactose digestion (p < 0.001 and p = 0.0009, respectively). Remarkably, also about half of the subjects with normal lactose digestion reported discomfort.
In addition, hydrogen production was significantly higher in those subjects (Table 1). Subjects with lactase deficiency that reported symptoms produced significantly more H2 than subjects without symptoms (p < 0.0001). Also in individuals with lactose malabsorption or SIBO, the H2-production was significantly higher when symptoms were present (p = 0.001). CH4-production was not related to the occurrence of symptoms.
Figure 2. Percentage of subjects that reported discomfort after performing a 13C/H2 breath test.
Nutrients 07 05348 g002
Table 1. 13CO2, H2 and CH4 excretion according to diagnose.
DiagnosisNumber of SubjectsCumulative 13C-Excretion after 4 h (%)Maximum H2-Excretion (ppm)Maximum CH4-Excretion (ppm)
Lactase deficiencyAll subjects (314)11.2 (8.4–13.0)21.8 (3.7–96.5)0.3 (0.1–1.7)
Discomfort + (214)10.7 (7.6–12.5) a60.9 (6.9–116.0) b0.3 (0.1–1.6)
Discomfort − (100)12.1 (9.4–13.7) a4.4 (1.8–17.6) b0.5 (0.1–2.0)
Lactose malabsorption/SIBOAll subjects (138)19.0 (16.7–21.8)48.1 (31.2–91.3)0.2 (0.1–0.7)
Discomfort + (97)18.7 (16.5–21.4)53.0 (34.3–103.0) c0.2 (0.1–0.8)
Discomfort − (41)20.1 (18.0–22.2)37.0 (27.0–57.3) c0.2 (0.1–0.5)
Normal testAll subjects (599)19.6 (17.4–33.2)3.9 (1.5–9.5)0.3 (0.1–2.4)
Discomfort + (305)20.2 (17.4–32.1)3.5 (1.5–9.6)0.3 (0.1–2.1)
Discomfort − (294)19.1 (17.2–33.2)4.1 (1.4–9.1)0.3 (0.1–2.5)
a,b,c values with an identical subscript are significantly different (a p = 0.00023; b p < 0.00001; c p = 0.001); values are median (IQR).

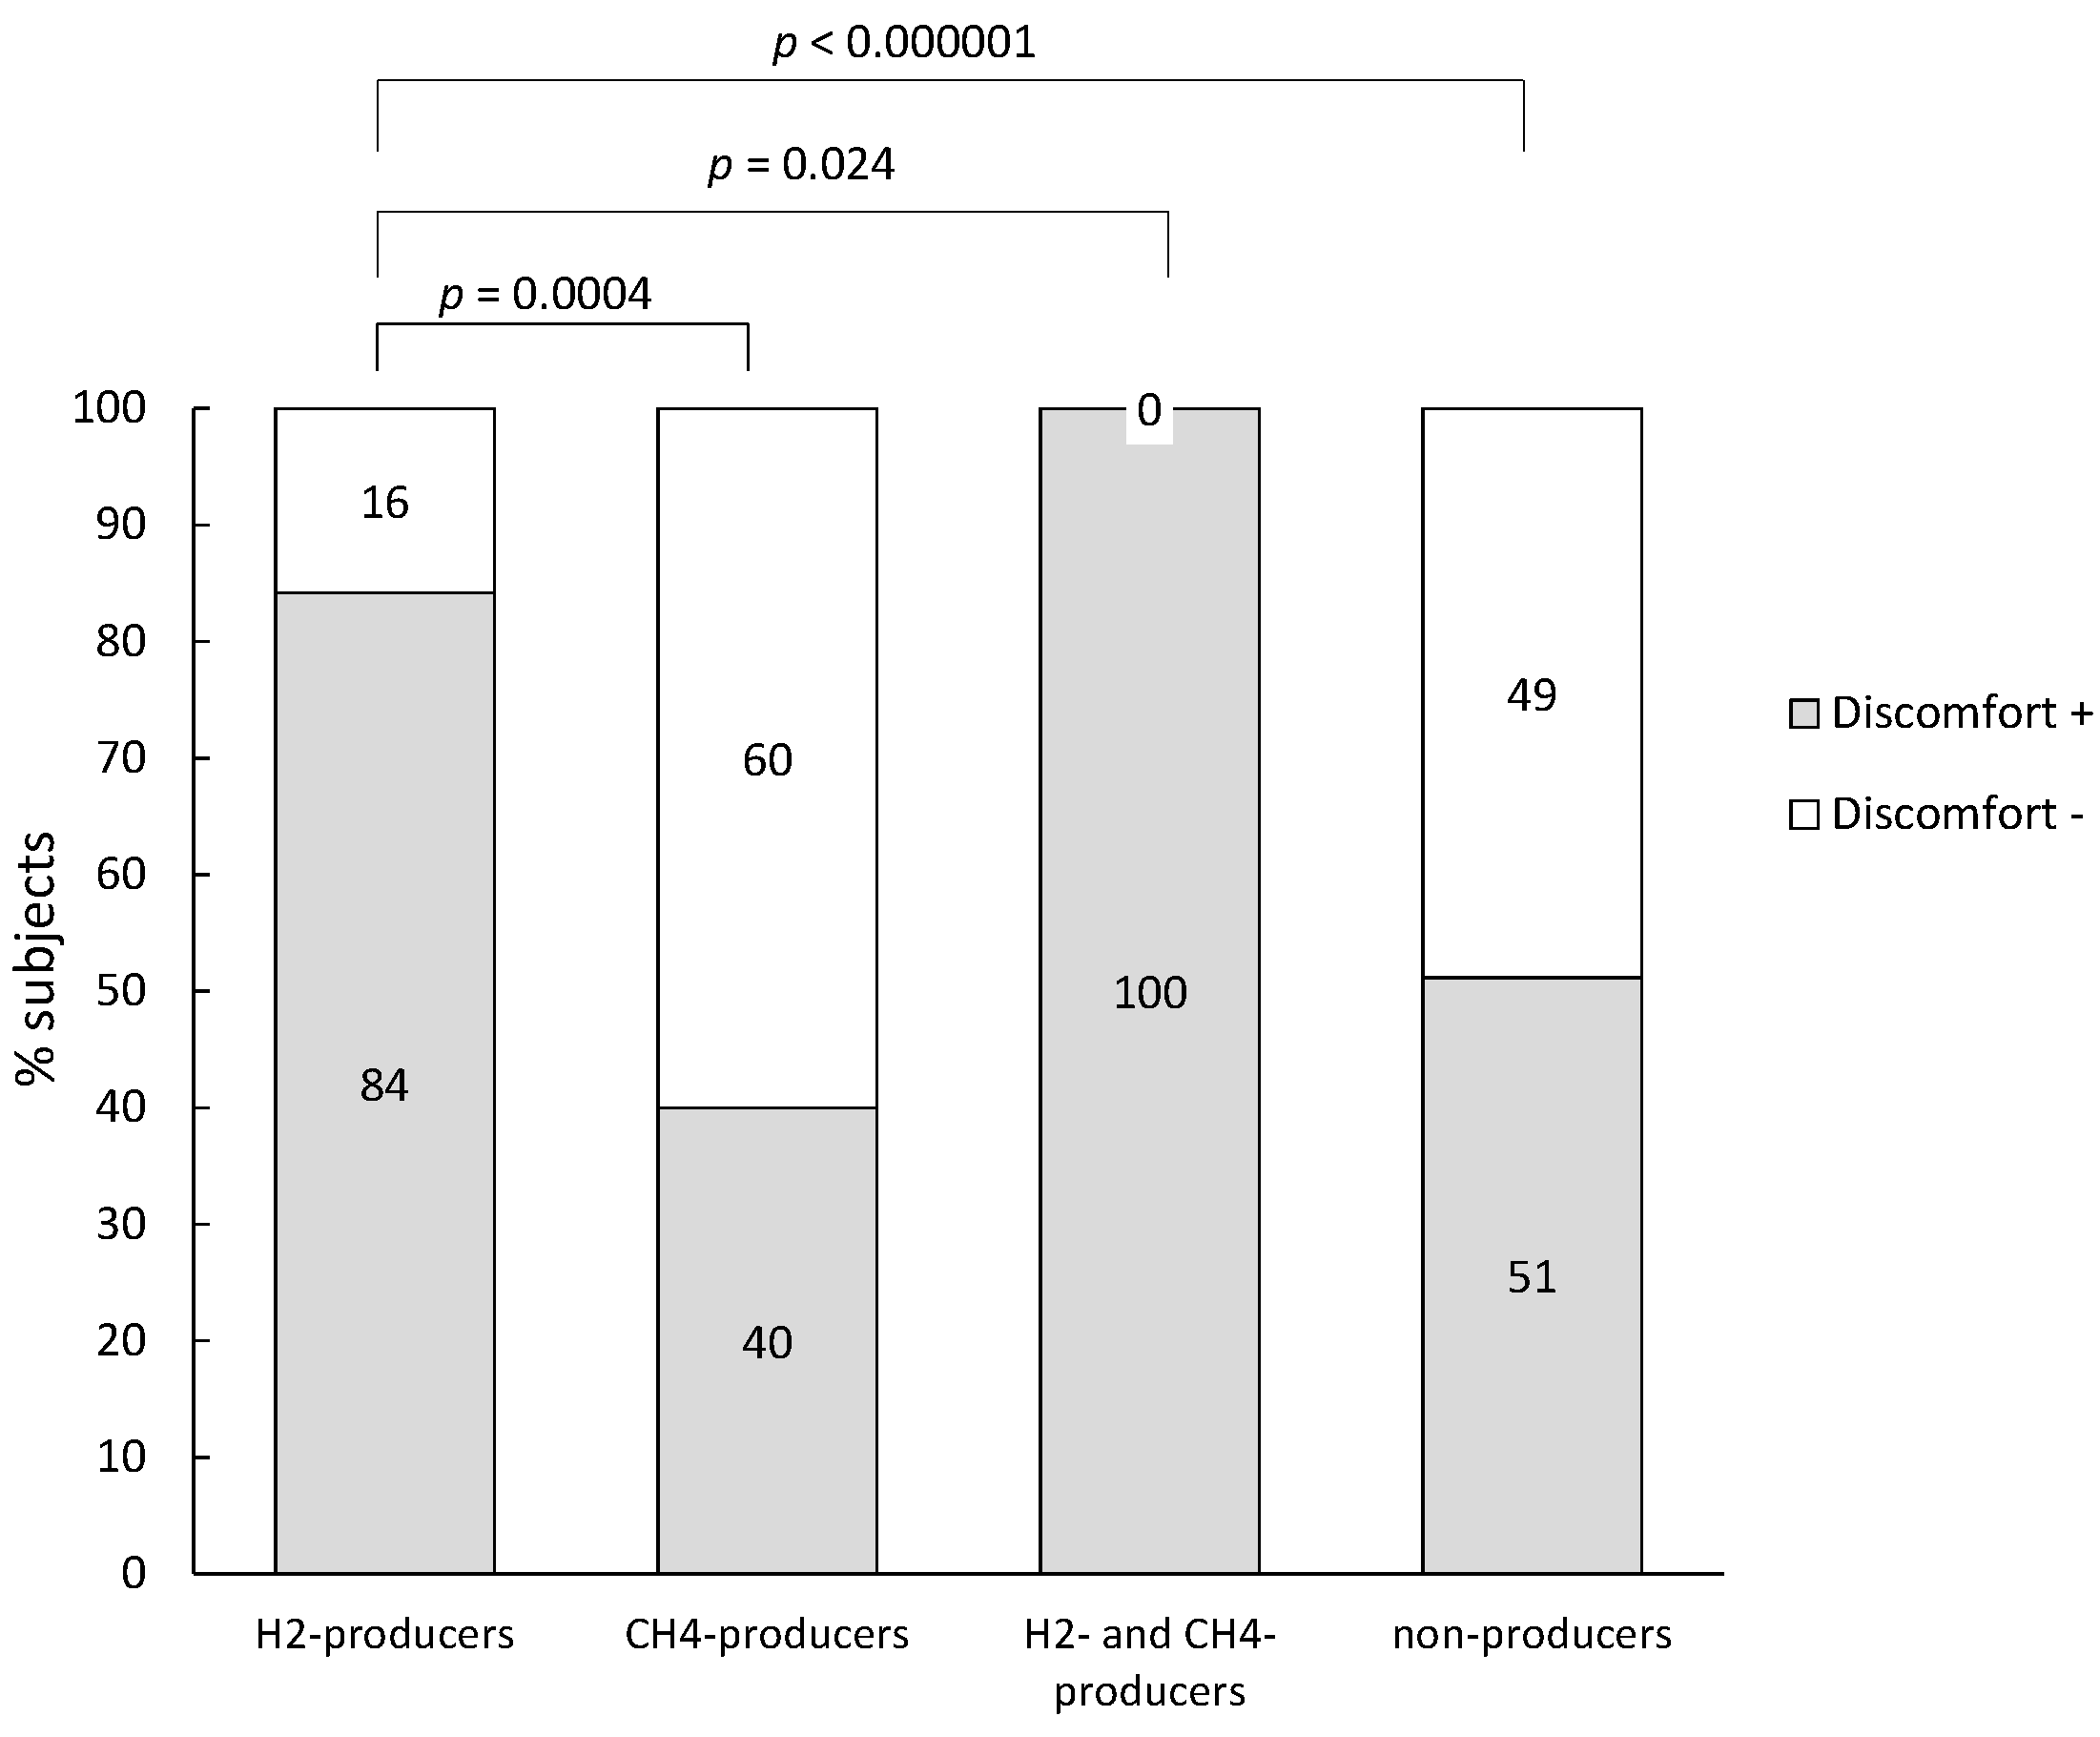
3.4. Subjects Diagnosed with Lactase Deficiency

A total of 314 subjects had a cumulative 13C-excretion <14.5% of administered 13C and were diagnosed with lactase deficiency. Remarkably, only 44% of these subjects were H2-producers (n = 139), whereas 8% were CH4-producers (n = 25), 7% produced H2 and CH4 (n = 21) and 41% were non-producers (n = 129). The extent of lactose digestion (cumulative 13C-excretion after 4 h) differed between the subgroups according to gas production (K-W, p < 0.001) (Table 2). The cumulative 13C-excretion was significantly lower in H2-producers compared to CH4-producers (M-W, p = 0.0004), the H2- and CH4-producers (p = 0.024) and the non-producers (p < 0.001).
Levels of H2-excretion in H2-producers were not different from that in H2- and CH4-producers (p = 0.952) and neither was CH4-production different in pure CH4-producers compared to H2- and CH4-producers (p = 0.316) (Table 2).
Table 2. 13CO2, H2 and CH4 excretion in patients with lactase deficiency.
Gas productionNumber of SubjectsCumulative 13C-Excretion after 4 h (%)Maximum H2-Excretion (ppm)Maximum CH4-Excretion (ppm)
H2-producersAll subjects (139)9.4 (6.3–11.7)95.5 (52.3–144.5)0.2 (0.1–0.6)
Discomfort + (117)9.58 (6.0–12.7)101.5 (64.7–148.3) a0.2 (0.1–0.5)
Discomfort − (22)8.8 (6.0–12.7)50.7 (30.6–90.6) a0.3 (0.1–0.9)
CH4-producersAll subjects (25)11.8 (11.1–13.4)3.0 (1.0–9.2)11.2 (6.8–15.6)
Discomfort + (10)11.6 (11.1–12.5)3.2 (0.6–8.4)11.3 (6.9–14.8)
Discomfort − (15)12.7 (10.9–13.5)2.5 (1.6–8.2)11.2 (7.4–19.8)
H2- and CH4-producersAll subjects (21)12.4 (9.4–13.0)94.5 (74.5–116.0)14.8 (7.7–24.2)
Discomfort + (21)12.4 (9.4–13.1)94.5 (74.5–116.0)14.8 (7.7–24.2)
Discomfort − (0)---
Non-producersAll subjects (129)12.2 (10.1–13.6)3.7 (1.5–7.5)0.2 (0.1–0.9)
Discomfort + (66)11.8 (9.7–13.1)4.6 (1.5–8.1)0.2 (0.1–0.6)
Discomfort − (63)12.5 (10.3–13.8)3.0 (1.3–7.3)0.3 (0.1–1.0)
a significantly different (p = 0.002); values are median (IQR).
H2-producers reported significantly more discomfort compared to patients that produced no H2 (Chi Square, p < 0.001) (Figure 3).Within the group of subjects that only produced H2, H2-concentration was significantly higher for subjects that reported symptoms compared to subjects that did not experience symptoms (M-W, p = 0.002) (Table 2).
Figure 3. Percentage of subjects that reported discomfort within the subjects with lactase deficiency.
Nutrients 07 05348 g003

3.5. Subjects Diagnosed with Lactose Malabsorption or Bacterial Overgrowth
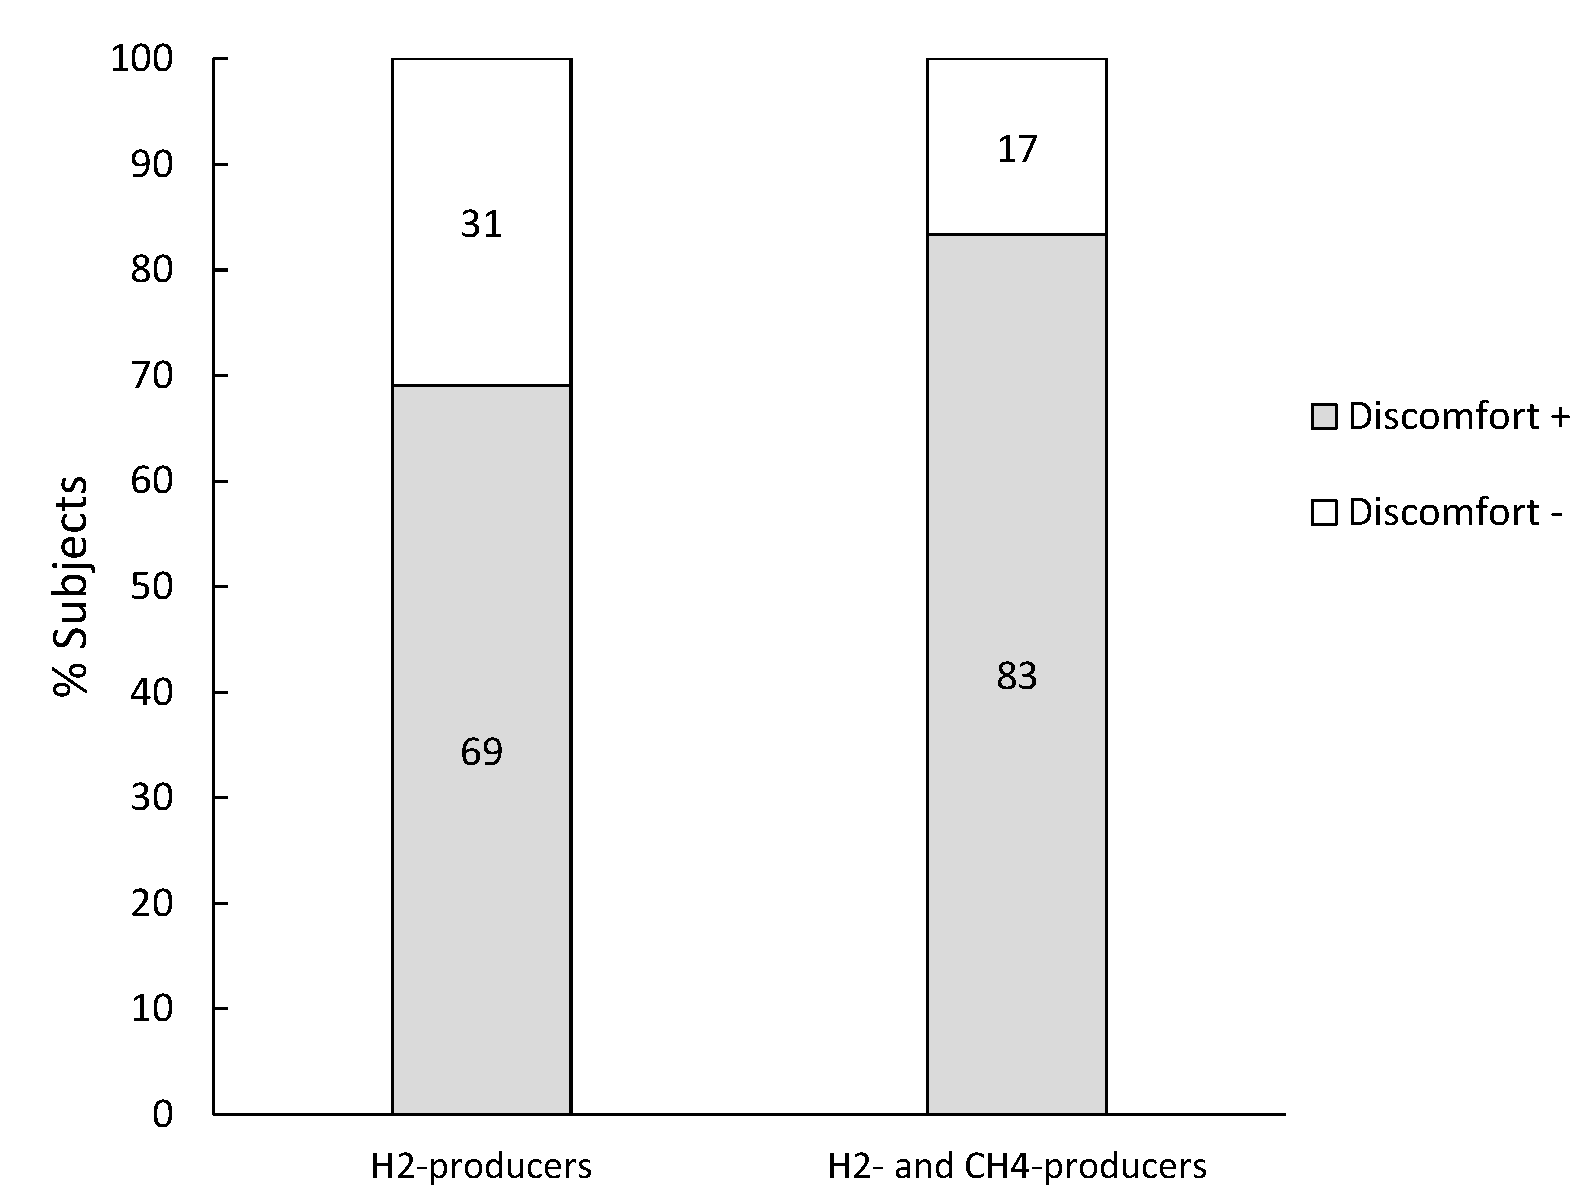
Subjects (n = 138) that produced at least 20 ppm H2 in combination with a normal lactose digestion were diagnosed with lactose malabsorption or SIBO. Only 12 of them (9%) produced both H2 and CH4 whereas the majority (126; 91%) produced only H2. No difference in percentage of patients that reported symptoms was observed between the H2-producers vs. H2- and CH4-producers (Figure 4).
Figure 4. Percentage of subjects diagnosed with lactose malabsorption or SIBO that reported discomfort.
Nutrients 07 05348 g004
Again, H2-excretion was significantly higher when symptoms were reported, both in the pure H2 producers (p = 0.003) as in the H2 and CH4-producers (p = 0.032) whereas complaints were not related to CH4-production (p = 0.470 and p = 0.273 for H2-producers and both H2- and CH4- producers, respectively) (Table 3).
Table 3. 13CO2, H2 and CH4 excretion in subjects diagnosed with lactose malabsorption/SIBO.
Gas productionNumber of SubjectsCumulative 13C-Excretion after 4 h (%)Maximum H2-Excretion (ppm)Maximum CH4-Excretion (ppm)
H2-producersAll subjects (126)19.0 (16.7–21.6)48.5 (31.2–91.3)0.2 (0.1–0.4)
Discomfort + (87)18.3 (16.4–21.0) a57.7 (35.2–103.2) b0.2 (0.1–0.4)
Discomfort − (39)20.1 (18.1–22.1) a38.3 (27.5–57.6) b0.2 (0.1–0.4)
H2- and CH4-producersAll subjects (12)20.8 (18.2–23.8)41.0 (31.8–100.0)20.9 (11.5–31.1)
Discomfort + (10)20.8 (19.1–24.0)47.0 (35.1–100.0) c17.3 (10.5–29.9)
Discomfort − (2)19.3 (17.1–21.5)25.0 (24.3–25.8) c46.8 (34.3–59.3)
a,b,c values with an identical subscript are significantly different (a p = 0.030; b p = 0.003; c p = 0.032); values are median (IQR).

3.6. Subjects Diagnosed with a Normal Lactose Digestion and H2 ≤ 20 ppm

Of the 599 subjects with normal lactose digestion, 97 (16%) produced CH4 (Table 4). Remarkably, about half of these subjects reported discomfort, irrespective of whether they produced methane or not (Figure 5).
Table 4. 13CO2, H2 and CH4 excretion in subjects with normal lactose digestion and H2 levels below 20 ppm.
Gas ProductionNumber of SubjectsCumulative 13C-Excretion after 4 h (%)Maximum H2-Excretion (ppm)Maximum CH4-Excretion (ppm)
CH4-producersAll subjects (97)19.2 (17.2–21.6)3.5 (2.0–7.6)10.2 (7.4–16.9)
Discomfort + (48)19.6 (17.2–21.7)3.4 (2.0–7.7)10.2 (7.8–16.6)
Discomfort − (49)18.9 (17.2–21.5)4.7 (1.8–7.6)10.2 (7.1–16.9)
non producersAll subjects (502)19. 7 (17.4–22.4)4.0 (1.5–9.5)0.2 (0.1–0.6)
Discomfort + (257)20.3 (17.4–22.8)4.0 (1.5–9.6)0.2 (0.1–0.5)
Discomfort − (245)19.2 (17.5–21.9)4.1 (1.3–9.2)0.2 (0.1–0.8)
Figure 5. Percentage of subjects with normal lactose digestion that report discomfort.
Nutrients 07 05348 g005

3.7. Increase in Methane versus Hydrogen in Breath

The cohort comprised 33 subjects that produced both H2 and CH4. H2-concentrations increased in breath at a slightly earlier time point (62 ± 40 min) than methane (67 ± 52 min) although this difference was not statistically significant (p = 0.786).
When comparing the raise in H2-production between CH4-producers (n = 41) and non CH4- producers (n = 320), no difference (p = 0.984) was observed (62 ± 40 min versus 65 ± 44 min).

3.8. Additional Value of CH4 Measurements

Addition of CH4 measurement to the current combined 13C/H2 lactose breath test yielded concordant results for 954/1051 (90.2%) tests. Discordant results were obtained in 97 patients with normal lactose digestion and no H2-production but with CH4-excretion in breath.

4. Discussion

Hydrogen breath testing is currently considered to be the diagnostic method of choice for the phenotypic detection of lactose malabsorption. It is a reliable, non-invasive and easy-to-perform test that offers the advantage over the genotypic test of including also secondary causes of lactose malabsorption. Nevertheless, false positive tests are possible in case of SIBO [19] whereas false negative tests might occur in methanogenic individuals that harbor a microbiota that avidly converts H2 into CH4. It is important to realize that the lactose breath test identifies lactose malabsorption rather than lactose intolerance and that not all individuals with lactose malabsorption experience discomfort. The mechanisms that provoke symptoms in some subjects and not in others are not well understood. Factors like fermentation characteristics of the microbiota [20], visceral hypersensitivity [21] and psychological factors [22] may be involved. Jellema et al. included the results of 18 studies that investigated the relationship between symptoms after lactose ingestion and the results of the lactose breath test in a systematic review and found that 33%–97% of the patients with a positive breath test reported symptoms [23]. In the present study, up to 68% of subjects diagnosed with lactase deficiency and a similar proportion of the individuals in which lactose malabsorption could not be differentiated from SIBO reported discomfort. Those subjects had significantly higher breath H2-excretion compared to the subjects without discomfort suggesting that high levels of gas production might contribute to symptom generation. Also, Hermans et al. found a strong correlation between gastrointestinal symptoms and extent of hydrogen excretion [24]. In a study in IBS (Irritable Bowel Syndrome) patients, both gas production and visceral hypersensitivity contributed to the development of digestive symptoms after oral lactose load, although hydrogen excretion was not associated with abdominal distention [25].
In addition, about half of the subjects with a normal lactose digestion reported discomfort. It is possible that the high dose of lactose used in this study (50 g), at least partially, explains the high rate of discomfort. As the combined 13C/H2 test was originally validated against jejunal lactase activity using 50 g of lactose [12], this dose was continued in the clinical routine. However, also other studies report that some individuals attribute abdominal symptoms erroneously to the intake of lactose and consider themselves as severely lactose intolerant although they are able to normally digest lactose [26]. Those symptoms may be due to other underlying disorders such as irritable bowel syndrome [27,28], or to a “nocebo effect” [29]. A nocebo effect is the effect of an inactive substance or procedure (placebo) suggesting that it will negatively modify a symptom or sensation. In those subjects, dietary measures and exclusion of lactose are unnecessary and will not improve the symptoms.
Symptom registration during a hydrogen breath test has been shown to have a good negative predictive value [30] as absence of symptoms excludes lactose intolerance. Also, lactose malabsorbers do not need further treatment in case they are lactose-tolerant. On the other hand, the diagnostic performance of the presence of symptoms (diarrhea, abdominal pain, bloating, flatulence and self-reported milk intolerance) was highly variable with positive predictive values ranging from 0.54–1.0 [23].
It is important to realize that the lactose breath tests performed in this study made use of 13C-lactose and estimated both the digestion of lactose (from exhaled 13CO2) and the malabsorption (from exhaled H2). The combined 13CO2/H2 breath test was more sensitive (0.84 versus 0.68) and more specific (0.96 versus 0.89) than the H2 breath test in detecting low jejunal lactase activity [12]. In the combined test, a diagnosis of low lactose digestion is based on a low cumulative 13CO2-excretion, irrespective of the presence of increased H2 which reduces the prevalence of false negative tests due to H2 non-producers. As a consequence, 154 subjects with low lactose digestion would have been classified as normal lactose absorbers on a standard H2 breath test. Twenty-five of them produced CH4 whereas the majority neither exhaled H2 nor CH4. Again, the prevalence of discomfort was higher in the subgroups that produced either H2 or H2 and CH4 compared to the subgroups that did not produce H2. The proportion of subjects that did not produce H2 nor CH4 despite a low lactose digestion was clearly higher that the proportion of non-H2-producers reported in most studies using the lactulose hydrogen breath test (2%–43% with <10% in most studies [11]). A potential explanation for this discrepancy might involve so-called colonic adaption. Several studies have indicated that breath H2-excretion decreases in subjects with lactose malabsorption after chronic consumption of lactose due to adaptation of the colonic microbiota [31,32,33,34]. Szilagyi et al. showed that the H2-output in a lactose breath test inversely varied with the lactose intake whereas there was no cross-adaptation to lactulose [35]. A radical decrease in lactose intake prior to the lactose hydrogen breath test was required to unmask lactose malabsorption. As a consequence, it is possible that a higher proportion of the population does not produce gas in a lactose breath test than in a lactulose breath test. An alternative explanation might be that the combined 13C/H2 lactose breath test in its current form is too sensitive and that subjects with a cumulative 13CO2 excretion below 14.5% that do not produce gas have a normal lactose digestion. However, when we reanalyzed our data using a cut off of 13.5% and 12.5% for normal lactose digestion, respectively, 37% and 35% of the subjects with low lactose digestion did not produce gas. This proportion remains far from the 10% proportion commonly found using a lactulose breath test.
Several studies have investigated the usefulness of combined measurement of H2 and CH4 to increase the accuracy of the H2 breath test. The rationale is based on the fact that methanogenesis is an efficient H2-consuming process that might reduce available H2 and prevent a rise in breath H2 by 20 ppm. Indeed, breath H2-production is significantly higher in subjects that do not excrete CH4 compared to CH4-excreters, both in the present study as in studies reported in literature [36,37]. However, the latest report of the Rome Consensus Conference published in 2009 does not recommend measuring breath CH4 excretion to improve diagnostic accuracy of the hydrogen breath test, due to insufficient evidence and conflicting results [11]. More recently, additional studies evaluating the usefulness of CH4 testing in addition to H2 observed better diagnostic properties for the combined H2 and CH4 test to detect lactose malabsorption [14,15,38]. Addition of CH4 measurement to the 13CO2/H2 breath test also further improved the accuracy of the test as 97/599 subjects with normal lactose digestion and no H2 excretion were found to excrete CH4. These subjects should have been classified as subjects with lactose malabsorption or SIBO. Nevertheless, the usefulness of breath CH4 measurements has been criticized as both false negative and false positive breath CH4 results are possible. McKay et al. showed that all healthy subjects may produce methane, but that only when the production reaches a threshold, it appears in the breath [39]. A recent studies in healthy subjects and IBS (Irritable Bowel Syndrome) patients showed that breath CH4-excretion is not a reliable marker for its colonic generation [40]. Methane was only detectable in breath when a significant amount was produced during colonic fermentation. In addition, some studies suggest that breath CH4-excretion is relatively stable during the day and is not responsive to changes in the diet because its generation depends on endogenous substrates although exogenous substrates like lactulose can significantly increase breath hydrogen [41]. False positive results may occur due to the release of CH4 entrapped in stool. Poor diffusion of gasses through the dense intestinal liquid allows the formation of gas bubbles that get entrapped along the colon where the content is becoming more solid [42]. It has been shown that in severely constipated patients, the entrapped gas can be released during a lactulose H2 breath test due to mixing of the intestinal content [43].
There is considerable evidence that methane production is positively associated with slow intestinal transit and constipation [44,45]. In addition, recent data from animal experiments supported by human observations [46] indicate a causal relationship between both conditions although the exact mechanism by which methane slows intestinal transit remains currently unknown [47]. To verify this observation, we investigated whether the orocecal transit time (OCTT), defined as the time that elapsed between intake of lactose and a rise in breath hydrogen excretion, was shorter in the subgroup of individuals that did not excrete CH4 compared to the CH4-excretors. In the present study, the OCTT was not different between both groups although a significantly shorter OCTT was found in non-CH4 excretors compared to CH4-excretors in a comparable study [37]. This discrepancy might be explained by the fact that our study was not designed to evaluate this observation and that the frequency of breath sampling (every 30 min) was too low to detect potential differences in OCTT.
Recently, some studies found an association between intestinal methane production and obesity with higher levels of methane in subjects with a higher BMI [48,49]. Within the subgroup of subjects that produced CH4 in response to a lactose challenge, there was no correlation between their BMI and the extent of CH4-production. Similarly, baseline levels of CH4 were not correlated to BMI in the complete study cohort (lactose absorbers and malabsorbers). In contrast, subjects that were underweight (BMI < 18) displayed even slightly higher CH4-levels compared to normal weight and obese subjects. This is in agreement with the fact that levels of Methanobrevibacter smithii, the dominant methanogen in the human intestine [16], were much higher in anorexic patients than in a lean population [50]. Similarly, a recent cross-sectional study that determined the association between fecal levels of Archaea (to which methanogens belong), methane production, fecal SCFA and BMI, concluded that colonic Archaea levels are not associated with obesity in healthy humans [41]. Two other studies found negative correlations between M. smithii levels and BMI [51,52]. Overall, the role of methane production in obesity remains inconclusive.
The cost of a combined 13C/H2 lactose breath test is higher than the cost of the standard H2 breath test due to the higher cost of the 13C-labelled substrate (700 €/kg). Due to the high capacity of the IRMS-system, allowing us to analyze up to 400 samples per 24 h (not limited to lactose breath tests), the cost of the additional analysis (including additional test tubes) is limited to €4.3. In Belgium, the social security system reimburses the cost of the breath test so that the additional contribution of the patient compared to a H2 breath test amounts to €9–11, depending on the insurance status of the patient.

5. Conclusions

This retrospective analysis confirms the poor correlation between abdominal discomfort reported during or after a lactose breath test and lactose malabsorption (32% of lactose malabsorbers did not report discomfort) or lactose intolerance (50% of normal lactose digesters reported discomfort). Measurement of 13CO2-excretion in addition to H2-excretion provides an added value to the standard hydrogen lactose breath test as it allowed detecting 154 non-hydrogen producers that would have been classified as normal lactose digesters using a standard test. Additional measurement of CH4 further improved the accuracy of the test and allowed identifying 97 methanogenic subjects with normal lactose digestion. Those subjects should have been classified as lactose malabsorption or SIBO patients.

Author Contributions

Els Houben and Kristin Verbeke designed the study. Jaak Billen and Kristin Verbeke protocolled the 13C/H2 breath tests. Els Houben and Vicky de Preter analyzed the data and performed the statistics. Els Houben, Vicky de Preter, Marc Van Ranst and Kristin Verbeke wrote the manuscript.

Conflicts of Interest

The authors declare no conflict of interest.

References

  1. Misselwitz, B.; Pohl, D.; Fruhauf, H.; Fried, M.; Vavricka, S.R.; Fox, M. Lactose malabsorption and intolerance: Pathogenesis, diagnosis and treatment. UEG J. 2013, 1, 151–159. [Google Scholar] [CrossRef] [PubMed]
  2. Enattah, N.S.; Sahi, T.; Savilahti, E.; Terwilliger, J.D.; Peltonen, L.; Jarvela, I. Identification of a variant associated with adult-type hypolactasia. Nat. Genet. 2002, 30, 233–237. [Google Scholar] [CrossRef] [PubMed]
  3. Waud, J.P.; Matthews, S.B.; Campbell, A.K. Measurement of breath hydrogen and methane, together with lactase genotype, defines the current best practice for investigation of lactose sensitivity. Ann. Clin. Biochem. 2008, 45, 50–58. [Google Scholar] [CrossRef] [PubMed]
  4. Wedlake, L.; Thomas, K.; McGough, C.; Andreyev, H.J. Small bowel bacterial overgrowth and lactose intolerance during radical pelvic radiotherapy: An observational study. Eur. J. Cancer 2008, 44, 2212–2217. [Google Scholar] [CrossRef]
  5. Matthews, S.B.; Waud, J.P.; Roberts, A.G.; Campbell, A.K. Systemic lactose intolerance: A new perspective on an old problem. Postgrad. Med. J. 2005, 81, 167–173. [Google Scholar] [CrossRef] [PubMed]
  6. Vesa, T.H.; Marteau, P.; Korpela, R. Lactose intolerance. J. Am. Coll. Nutr. 2000, 19, 165S–175S. [Google Scholar] [CrossRef] [PubMed]
  7. Peuhkuri, K.; Vapaatalo, H.; Korpela, R.; Teuri, U. Lactose intolerance—A confusing clinical diagnosis. Am. J. Clin. Nutr. 2000, 71, 600–602. [Google Scholar] [PubMed]
  8. Newcomer, A.D.; McGill, D.B.; Thomas, P.J.; Hofmann, A.F. Prospective comparison of indirect methods for detecting lactase deficiency. N. Engl. J. Med. 1975, 293, 1232–1236. [Google Scholar] [CrossRef] [PubMed]
  9. Maiuri, L.; Raia, V.; Potter, J.; Swallow, D.; Ho, M.W.; Fiocca, R.; Finzi, G.; Cornaggia, M.; Capella, C.; Quaroni, A.; et al. Mosaic pattern of lactase expression by villous enterocytes in human adult-type hypolactasia. Gastroenterology 1991, 100, 359–369. [Google Scholar] [PubMed]
  10. Gasbarrini, A.; Corazza, G.R.; Gasbarrini, G.; Montalto, M.; di Stefano, M.; Basilisco, G.; Parodi, A.; Usai-Satta, P.; Vernia, P.; Anania, C.; et al. Methodology and indications of H2-breath testing in gastrointestinal diseases: The Rome Consensus Conference. Aliment. Pharmacol. Ther. 2009, 29, 1–49. [Google Scholar] [PubMed]
  11. Hiele, M.; Ghoos, Y.; Rutgeerts, P.; Vantrappen, G.; Carchon, H.; Eggermont, E. 13CO2 breath test using naturally 13C-enriched lactose for detection of lactase deficiency in patients with gastrointestinal symptoms. J. Lab. Clin. Med. 1988, 112, 193–200. [Google Scholar] [PubMed]
  12. Corazza, G.R.; Benati, G.; Strocchi, A.; Malservisi, S.; Gasbarrini, G. The possible role of breath methane measurement in detecting carbohydrate malabsorption. J. Lab. Clin. Med. 1994, 124, 695–700. [Google Scholar] [PubMed]
  13. Hovde, O.; Farup, P.G. A comparison of diagnostic tests for lactose malabsorption—Which one is the best? BMC Gastroenterol. 2009, 9, 82. [Google Scholar] [CrossRef] [PubMed]
  14. Knudsen, C.D.; di Palma, J.A. Carbohydrate challenge tests: Do you need to measure methane? South. Med. J. 2012, 105, 251–253. [Google Scholar] [CrossRef] [PubMed]
  15. Triantafyllou, K.; Chang, C.; Pimentel, M. Methanogens, methane and gastrointestinal motility. J. Neurogastroenterol. Motil. 2014, 20, 31–40. [Google Scholar] [CrossRef] [PubMed]
  16. Haycock, G.B.; Schwartz, G.J.; Wisotsky, D.H. Geometric method for measuring bodysurface area: A height-weight formula validated in infants, children, and adults. J. Pediatr. 1978, 93, 62–66. [Google Scholar] [CrossRef]
  17. Altman, P.; Dittmer, D. Metabolic rate of boys and girls according to weight in different age classes. In Biological Data Book; Federation of American Societies for Experimental Biology: Bethesda, MD, USA, 1974; p. 1527. [Google Scholar]
  18. Geypens, B.; Bennink, R.; Peeters, M.; Evenepoel, P.; Mortelmans, L.; Maes, B.; Ghoos, Y.; Rutgeerts, P. Validation of the lactose-[13 C] ureide breath test for determination of orocecal transit time by scintigraphy. J. Nucl. Med. 1999, 40, 1451–1455. [Google Scholar] [PubMed]
  19. Nucera, G.; Gabrielli, M.; Lupascu, A.; Lauritano, E.C.; Santoliquido, A.; Cremonini, F.; Cammarota, G.; Tondi, P.; Pola, P.; Gasbarrini, G.; et al. Abnormal breath tests to lactose, fructose and sorbitol in irritable bowel syndrome may be explained by small intestinal bacterial overgrowth. Aliment. Pharmacol. Ther. 2005, 21, 1391–1395. [Google Scholar] [CrossRef] [PubMed]
  20. Lomer, M.C.; Parkes, G.C.; Sanderson, J.D. Review article: Lactose intolerance in clinical practice—Myths and realities. Aliment. Pharmacol. Ther. 2008, 27, 93–103. [Google Scholar] [CrossRef] [PubMed]
  21. Di Stefano, M.; Miceli, E.; Mazzocchi, S.; Tana, P.; Moroni, F.; Corazza, G.R. Visceral hypersensitivity and intolerance symptoms in lactose malabsorption. Neurogastroenterol. Motil. 2007, 19, 887–895. [Google Scholar] [CrossRef] [PubMed]
  22. Tomba, C.; Baldassarri, A.; Coletta, M.; Cesana, B.M.; Basilisco, G. Is the subjective perception of lactose intolerance influenced by the psychological profile? Aliment. Pharmacol. Ther. 2012, 36, 660–669. [Google Scholar] [CrossRef] [PubMed]
  23. Jellema, P.; Schellevis, F.; van der Windt, D.; Kneepkens, C.M.F.; van der Horst, H.E. Lactose malabsorption and intolerance: A systematic review on the diagnostic value of gastrointestinal symptoms and self-reported milk intolerance. QJM 2010, 103, 555–572. [Google Scholar] [CrossRef] [PubMed]
  24. Hermans, M.M.; Brummer, R.J.; Ruijgers, A.M.; Stockbrugger, R.W. The relationship between lactose tolerance test results and symptoms of lactose intolerance. Am. J. Gastroenterol. 1997, 92, 981–984. [Google Scholar] [PubMed]
  25. Zhu, Y.; Zheng, X.; Cong, Y.; Chu, H.; Fried, M.; Dai, N.; Fox, M. Bloating and distention in irritable bowel syndrome: The role of gas production and visceral sensation after lactose ingestion in a population with lactase deficiency. Am. J. Gastroenterol. 2013, 108, 1516–1525. [Google Scholar] [CrossRef] [PubMed]
  26. Suarez, F.L.; Savaiano, D.A.; Levitt, M.D. A comparison of symptoms after the consumption of milk or lactose-hydrolyzed milk by people with self-reported severe lactose-intolerance. N. Engl. J. Med. 1995, 333, 1–4. [Google Scholar] [CrossRef] [PubMed]
  27. Farup, P.G.; Monsbakken, K.W.; Vandvik, P.O. Lactose malabsorption in a population with irritable bowel syndrome: Prevalence and symptoms. A case-control study. Scand. J. Gastroenterol. 2004, 39, 645–649. [Google Scholar] [CrossRef] [PubMed]
  28. Dainese, R.; Casellas, F.; Marine-Barjoan, E.; Vivinus-Nebot, M.; Schneider, S.M.; Hebuterne, X.; Piche, T. Perception of lactose intolerance in irritable bowel syndrome patients. Eur. J. Gastroenterol. Hepatol. 2014, 26, 1167–1175. [Google Scholar] [CrossRef] [PubMed]
  29. Vernia, P.; di Camillo, M.; Foglietta, T.; Avallone, V.E.; de Carolis, A. Diagnosis of lactose intolerance and the “nocebo” effect: The role of negative expectations. Dig. Liver Dis. 2010, 42, 616–619. [Google Scholar] [CrossRef] [PubMed]
  30. Beyerlein, L.; Pohl, D.; Delco, F.; Stutz, B.; Fried, M.; Tutuian, R. Correlation between symptoms developed after the oral ingestion of 50 g lactose and results of hydrogen breath testing for lactose intolerance. Aliment. Pharmacol. Ther. 2008, 27, 659–665. [Google Scholar] [CrossRef] [PubMed] [Green Version]
  31. Hertzler, S.R.; Savaiano, D.A. Colonic adaptation to daily lactose feeding in lactose maldigesters reduces lactose intolerance. Am. J. Clin. Nutr. 1996, 64, 232–236. [Google Scholar] [PubMed]
  32. Hertzler, S.R.; Savaiano, D.A.; Levitt, M.D. Fecal hydrogen production and consumption measurements (response to daily lactose ingestion by lactose maldigesters). Dig. Dis. Sci. 1997, 42, 348–353. [Google Scholar] [CrossRef] [PubMed]
  33. Briet, F.; Pochart, P.; Marteau, P.; Flourie, B.; Arrigoni, E.; Rambaud, J.C. Improved clinical tolerance to chronic lactose ingestion in subjects with lactose intolerance: A placebo effect? Gut 1997, 41, 632–635. [Google Scholar] [CrossRef] [PubMed]
  34. Szilagyi, A. Adaptation to lactose in lactase non persistent people: Effects on intolerance and the relationship between dairy food consumption and evalution of diseases. Nutrients 2015, 7, 6751–6779. [Google Scholar] [CrossRef] [PubMed]
  35. Szilagyi, A.; Cohen, A.; Vinokuroff, C.; Ahmad, D.; Nathwani, U.; Yesovitch, S. Deadaption and readaptation with lactose, but no cross-adaptation to lactulose: A case of occult colonic bacterial adaptation. Can. J. Gastroenterol. 2004, 18, 677–680. [Google Scholar] [PubMed]
  36. Montes, R.G.; Saavedra, J.M.; Perman, J.A. Relationship between methane production and breath hydrogen excretion in lactose-malabsorbing individuals. Dig. Dis. Sci. 1993, 38, 445–448. [Google Scholar] [CrossRef] [PubMed]
  37. Cloarec, D.; Bornet, F.; Gouilloud, S.; Barry, J.L.; Salim, B.; Galmiche, J.P. Breath hydrogen response to lactulose in healthy subjects: Relationship to methane producing status. Gut 1990, 31, 300–304. [Google Scholar] [CrossRef] [PubMed]
  38. Moran, S.; Mina, A.; Duque, X.; Anaya, S.; San-Martin, U.; Yanez, P.; Rodriguez-Leal, G. Prevalence of lactose malabsorption in mexican children: Importance of measuring methane in expired air. Arch. Med. Res. 2013, 44, 291–295. [Google Scholar] [CrossRef] [PubMed]
  39. McKay, L.F.; Eastwood, M.A.; Brydon, W.G. Methane excretion in man—A study of breath, flatus, and faeces. Gut 1985, 26, 69–74. [Google Scholar] [CrossRef] [PubMed]
  40. Di Stefano, M.; Mengoli, C.; Bergonzi, M.; Klersy, C.; Pagani, E.; Miceli, E.; Corazza, G.R. Breath methane excretion is not an accurate marker of colonic methane production in irritable bowel syndrome. Am. J. Gastroenterol. 2015, 110, 891–898. [Google Scholar] [CrossRef] [PubMed]
  41. Fernandes, J.; Wang, A.; Su, W.; Rozenbloom, S.R.; Taibi, A.; Comelli, E.M.; Wolever, T.M. Age, dietary fiber, breath methane, and fecal short chain fatty acids are interrelated in archaea-positive humans. J. Nutr. 2013, 143, 1269–1275. [Google Scholar] [CrossRef] [PubMed]
  42. Kurbel, S.; Kurbel, B.; Vcev, A. Intestinal gases and flatulence: Possible causes of occurrence. Med. Hypotheses 2006, 67, 235–239. [Google Scholar] [CrossRef] [PubMed]
  43. Di Stefano, M.; Mengoli, C.; Bergonzi, M.; Miceli, E.; Pagani, E.; Corazza, G.R. Hydrogen breath test in patients with severe constipation: The interference of the mixing of intestinal content. Neurogastroenterol. Motil. 2014, 26, 1754–1760. [Google Scholar] [CrossRef] [PubMed]
  44. Pimentel, M.; Mayer, A.G.; Park, S.; Chow, E.J.; Hasan, A.; Kong, Y. Methane production during lactulose breath test is associated with gastrointestinal disease presentation. Dig. Dis. Sci. 2003, 48, 86–92. [Google Scholar] [CrossRef] [PubMed]
  45. Chatterjee, S.; Park, S.; Low, K.; Kong, Y.; Pimentel, M. The degree of breath methane production in ibs correlates with the severity of constipation. Am. J. Gastroenterol. 2007, 102, 837–841. [Google Scholar] [CrossRef] [PubMed]
  46. Pimentel, M.; Lin, H.C.; Enayati, P.; van den Burg, B.; Lee, H.R.; Chen, J.H.; Park, S.; Kong, Y.; Conklin, J. Methane, a gas produced by enteric bacteria, slows intestinal transit and augments small intestinal contractile activity. Am. J. Physiol. Gastrointest. Liver Physiol. 2006, 290, G1089–G1095. [Google Scholar] [CrossRef] [PubMed]
  47. Pimentel, M.; Mathur, R.; Chang, C. Gas and the microbiome. Curr. Gastroenterol. Rep. 2013, 15, 356. [Google Scholar] [CrossRef] [PubMed]
  48. Basseri, R.J.; Basseri, B.; Pimentel, M.; Chong, K.; Youdim, A.; Low, K.; Hwang, L.; Soffer, E.; Chang, C.; Mathur, R. Intestinal methane production in obese individuals is associated with a higher body mass index. Gastroenterol. Hepatol. 2012, 8, 22–28. [Google Scholar]
  49. Mathur, R.; Amichai, M.; Chua, K.S.; Mirocha, J.; Barlow, G.M.; Pimentel, M. Methane and hydrogen positivity on breath test is associated with greater body mass index and body fat. J. Clin. Endocrinol. MeTable 2013, 98, E698–E702. [Google Scholar] [CrossRef] [PubMed]
  50. Armougom, F.; Henry, M.; Vialettes, B.; Raccah, D.; Raoult, D. Monitoring bacterial community of human gut microbiota reveals an increase in lactobacillus in obese patients and methanogens in anorexic patients. PLoS ONE 2009, 4, e7125. [Google Scholar] [CrossRef] [PubMed]
  51. Million, M.; Angelakis, E.; Maraninchi, M.; Henry, M.; Giorgi, R.; Valero, R.; Vialettes, B.; Raoult, D. Correlation between body mass index and gut concentrations of lactobacillus reuteri, bifidobacterium animalis, methanobrevibacter smithii and escherichia coli. Int. J. Obes. (Lond.) 2013, 37, 1460–1466. [Google Scholar] [CrossRef] [PubMed]
  52. Million, M.; Maraninchi, M.; Henry, M.; Armougom, F.; Richet, H.; Carrieri, P.; Valero, R.; Raccah, D.; Vialettes, B.; Raoult, D. Obesity-associated gut microbiota is enriched in lactobacillus reuteri and depleted in bifidobacterium animalis and methanobrevibacter smithii. Int. J. Obes. (Lond.) 2012, 36, 817–825. [Google Scholar] [CrossRef] [PubMed]

