1. Introduction
Although treatments are available, tuberculosis still remains a leading cause of death worldwide [
1]. The revised estimate in the latest 2014 World Health Organization global tuberculosis report states that almost half a million more cases of tuberculosis occurred worldwide compared with the 2013 estimate; moreover, 1.5 million people died (up from 1.3 million in 2012) out of the estimated nine million people who developed tuberculosis in 2013 [
1]. Tuberculosis and malnutrition are linked in a complex relationship. Specifically, tuberculosis infection may cause malnutrition through increased metabolic demands and decreased nutrient intake, while nutritional deficiencies may worsen the disease or delay recovery by inhibiting important immune functions [
2]. People with tuberculosis are often malnourished, and malnourished people are also at a higher risk of developing tuberculosis since their immune systems are weakened [
2]. Micronutrient environments are key contributors to immune function and cytokine kinetics. Thus, such environments have been increasingly suggested to play an essential role in the individual response to infectious diseases [
3]. Trace elements that are essential micronutrients are known to play a variety of important roles, including as structural components of vitamins (e.g., cobalt); as co-factors in metalloenzymes, such as glutathione peroxidase (e.g., selenium); as catalytic components of numerous enzymes (e.g., zinc and copper); and as structural components of other proteins important for immune reactions (also zinc and copper) [
4,
5]. Due to their immunomodulatory functions, trace elements have been hypothesized to influence the susceptibility of the human body to the courses and outcomes of various infections [
3]. Deficiencies in various essential trace elements have been associated with decreased immunity against tuberculosis infection; moreover, trace elements are believed to have an impact on clinical outcome and are thus related to disease control [
2]. Altered profiles of trace elements have been reported in different populations of patients with tuberculosis [
6,
7,
8]. Trace element concentrations in serum depend not only on external factors, including micronutrient status, but also on many internal factors; profiles are believed to be influenced by the host physiology, pathogen physiology, and host diet [
4]. However, the availability of these trace elements for digestion, absorption, and utilization, in addition to their clinical impacts on patient outcomes, are still under investigation [
6,
7,
8]. Moreover, no study has yet obtained a reliable estimate of the trace element concentrations in the serum of Korean patients with tuberculosis.
Among the various techniques used to analyze trace element concentrations in human biological fluids (e.g., serum and plasma) and tissues, inductively coupled plasma-mass spectrometry (ICP-MS) is widely used. This technique has been used to compare normal with disease conditions, to detect potentially toxic metals, and to diagnose trace element deficiency states and trace element-related diseases. Moreover, ICP-MS has the advantage of being able to screen multiple elements with high sensitivity [
9].
Therefore, this study aimed to investigate the serum concentrations of four trace elements (cobalt, copper, zinc, and selenium) in Korean adult patients with tuberculosis and to compare these values with those of control patients (not infected with tuberculosis). Trace element concentrations were measured using a standard ICP-MS procedure, and potential associations between micronutrient concentrations and basal characteristics were assessed. Furthermore, the impact of trace element concentrations in serum on clinical outcomes after an intensive phase of antituberculosis therapy in patients with tuberculosis was assessed.
3. Results
The demographic characteristics, nutritional statuses, serum chemistry results, and concentrations of the four trace elements for patients and controls are shown in
Table 1,
Table 2 and
Table 3. In the control group, age, BMI, total serum proteins, total cholesterols, and selenium concentrations were normally distributed. In the tuberculosis patient group, BMI, total serum protein, total cholesterol, and selenium concentrations were normally distributed. BMI and total cholesterol were significantly higher in the control group, whereas the total protein, ALP, and CRP were significantly higher in the tuberculosis group (
p < 0.05). No significant differences between the two groups were observed regarding any of the other parameters measured, including serum albumin concentration.
Table 1.
Demographic characteristics and trace element concentrations in the control group without pulmonary tuberculosis (n = 79).
Table 1.
Demographic characteristics and trace element concentrations in the control group without pulmonary tuberculosis (n = 79).
| Parameter | Mean | SD | Median | 25th ‰ | 75th ‰ | Min | Max | p-Value * |
|---|
| Age (years) | 46.9 | 11.8 | 46.0 | 38.0 | 55.0 | 21.0 | 72.0 | 0.3076 |
| BMI (kg/m2) | 23.3 | 3.0 | 23.8 | 21.1 | 25.4 | 16.4 | 31.2 | 0.6420 |
| Total protein (g/dL) | 7.1 | 0.4 | 7.1 | 6.7 | 7.4 | 6.3 | 7.9 | 0.1241 |
| Albumin (g/dL) | 4.3 | 0.2 | 4.3 | 4.2 | 4.4 | 3.9 | 5.1 | 0.0064 |
| Total cholesterol (mg/dL) | 208 | 33 | 208 | 181 | 235 | 138 | 274 | 0.1688 |
| AST (U/L) | 23 | 9 | 21 | 17 | 26 | 9.0 | 55 | 0.0000 † |
| ALT (U/L) | 24 | 20 | 18 | 13 | 25 | 7 | 127 | 0.0000 † |
| ALP (U/L) | 61 | 17 | 58 | 48 | 71.0 | 34 | 125 | 0.0012 |
| CRP (mg/dL) | 0.1 | 0.0 | 0.0 | 0.0 | 0.1 | 0.0 | 0.3 | 0.0000 † |
| Cobalt (µg/L) | 0.23 | 0.20 | 0.15 | 0.12 | 0.24 | 0.07 | 1.20 | 0.0000 † |
| Copper (µg/dL) | 85 | 17 | 83 | 74 | 90 | 54 | 189 | 0.0000 † |
| Zinc (µg/dL) | 107 | 21 | 104 | 91 | 116 | 67 | 178 | 0.0060 |
| Selenium (µg/L) | 114 | 15 | 113 | 102 | 123 | 84 | 157 | 0.3013 |
Table 2.
Demographic characteristics and trace element concentrations in pulmonary tuberculosis patients (n = 135).
Table 2.
Demographic characteristics and trace element concentrations in pulmonary tuberculosis patients (n = 135).
| Parameter | Mean | SD | Median | 25th ‰ | 75th ‰ | Min | Max | p-Value * |
|---|
| Age (years) | 50.0 | 15.2 | 50.0 | 38.0 | 63.0 | 19.0 | 80.0 | 0.0052 |
| BMI (kg/m2) | 22.0 | 2.9 | 21.8 | 20.0 | 24.3 | 15.8 | 30.7 | 0.3659 |
| Total protein (g/dL) | 7.3 | 0.6 | 7.4 | 7.0 | 7.7 | 5.6 | 9.0 | 0.2572 |
| Albumin (g/dL) | 4.3 | 0.4 | 4.3 | 4.1 | 4.6 | 2.8 | 5.0 | 0.0007 |
| Total cholesterol(mg/dL) | 170 | 34 | 172 | 149 | 192 | 47 | 249 | 0.3821 |
| AST (U/L) | 29 | 36 | 23 | 19 | 29 | 11 | 416 | 0.0000 † |
| ALT (U/L) | 23 | 20 | 17 | 13 | 27 | 5 | 144 | 0.0000 † |
| ALP (U/L) | 72 | 31 | 67 | 56 | 80 | 9 | 289 | 0.0000 † |
| CRP (mg/dL) | 1.0 | 2.1 | 0.2 | 0.1 | 0.7 | 0.0 | 15 | 0.0000 † |
| Cobalt (µg/L) | 0.29 | 0.14 | 0.25 | 0.21 | 0.33 | 0.10 | 0.80 | 0.0000 † |
| Copper (µg/dL) | 122 | 34 | 115 | 102 | 139 | 65 | 294 | 0.0000 † |
| Zinc (µg/dL) | 67 | 13 | 66 | 59 | 73 | 30 | 128 | 0.0000 † |
| Selenium (µg/L) | 104 | 19 | 103 | 91 | 115 | 62 | 168 | 0.10028 |
Table 3.
Comparison of demographic characteristics and trace element concentrations of pulmonary tuberculosis patients (n = 135) and the control group without pulmonary tuberculosis (n = 79).
Table 3.
Comparison of demographic characteristics and trace element concentrations of pulmonary tuberculosis patients (n = 135) and the control group without pulmonary tuberculosis (n = 79).
| Parameter | Controls (n = 79) | TB (n = 135) | p-Value * |
|---|
| Mean | Median | Mean | Median |
|---|
| Age (years) | 46.9 | 46.0 | 50.0 | 50.0 | 0.1393 † |
| Sex (n) | | | | | 0.0678 ‡ |
| Male (n) | 44 | | 92 | | |
| Female (n) | 35 | | 43 | | |
| BMI (kg/m2) | 23.3 | 23.8 | 22.0 | 21.8 | 0.0017 § |
| Total protein (g/dL) | 7.1 | 7.1 | 7.3 | 7.4 | 0.0004 § |
| Albumin (g/dL) | 4.3 | 4.3 | 4.3 | 4.3 | 0.7824 † |
| Total cholesterol (mg/dL) | 208 | 208 | 170.2 | 172 | 0.0000 § ¶ |
| AST (U/L) | 23 | 21 | 29 | 23 | 0.0178 † |
| ALT (U/L) | 24 | 18 | 23 | 17 | 0.9781 † |
| ALP (U/L) | 61 | 58 | 72 | 67 | 0.0009 † |
| CRP (mg/dL) | 0.1 | 0.0 | 1.0 | 0.2 | 0.0000 † ¶ |
| Cobalt (µg/L) | 0.23 | 0.15 | 0.29 | 0.25 | 0.0000 † ¶ |
| Copper (µg/dL) | 85 | 83 | 122 | 115 | 0.0000 † ¶ |
| Zinc (µg/dL) | 107 | 104 | 67 | 66 | 0.0000 † ¶ |
| Selenium (µg/L) | 114 | 113 | 104 | 103 | 0.0000 § ¶ |
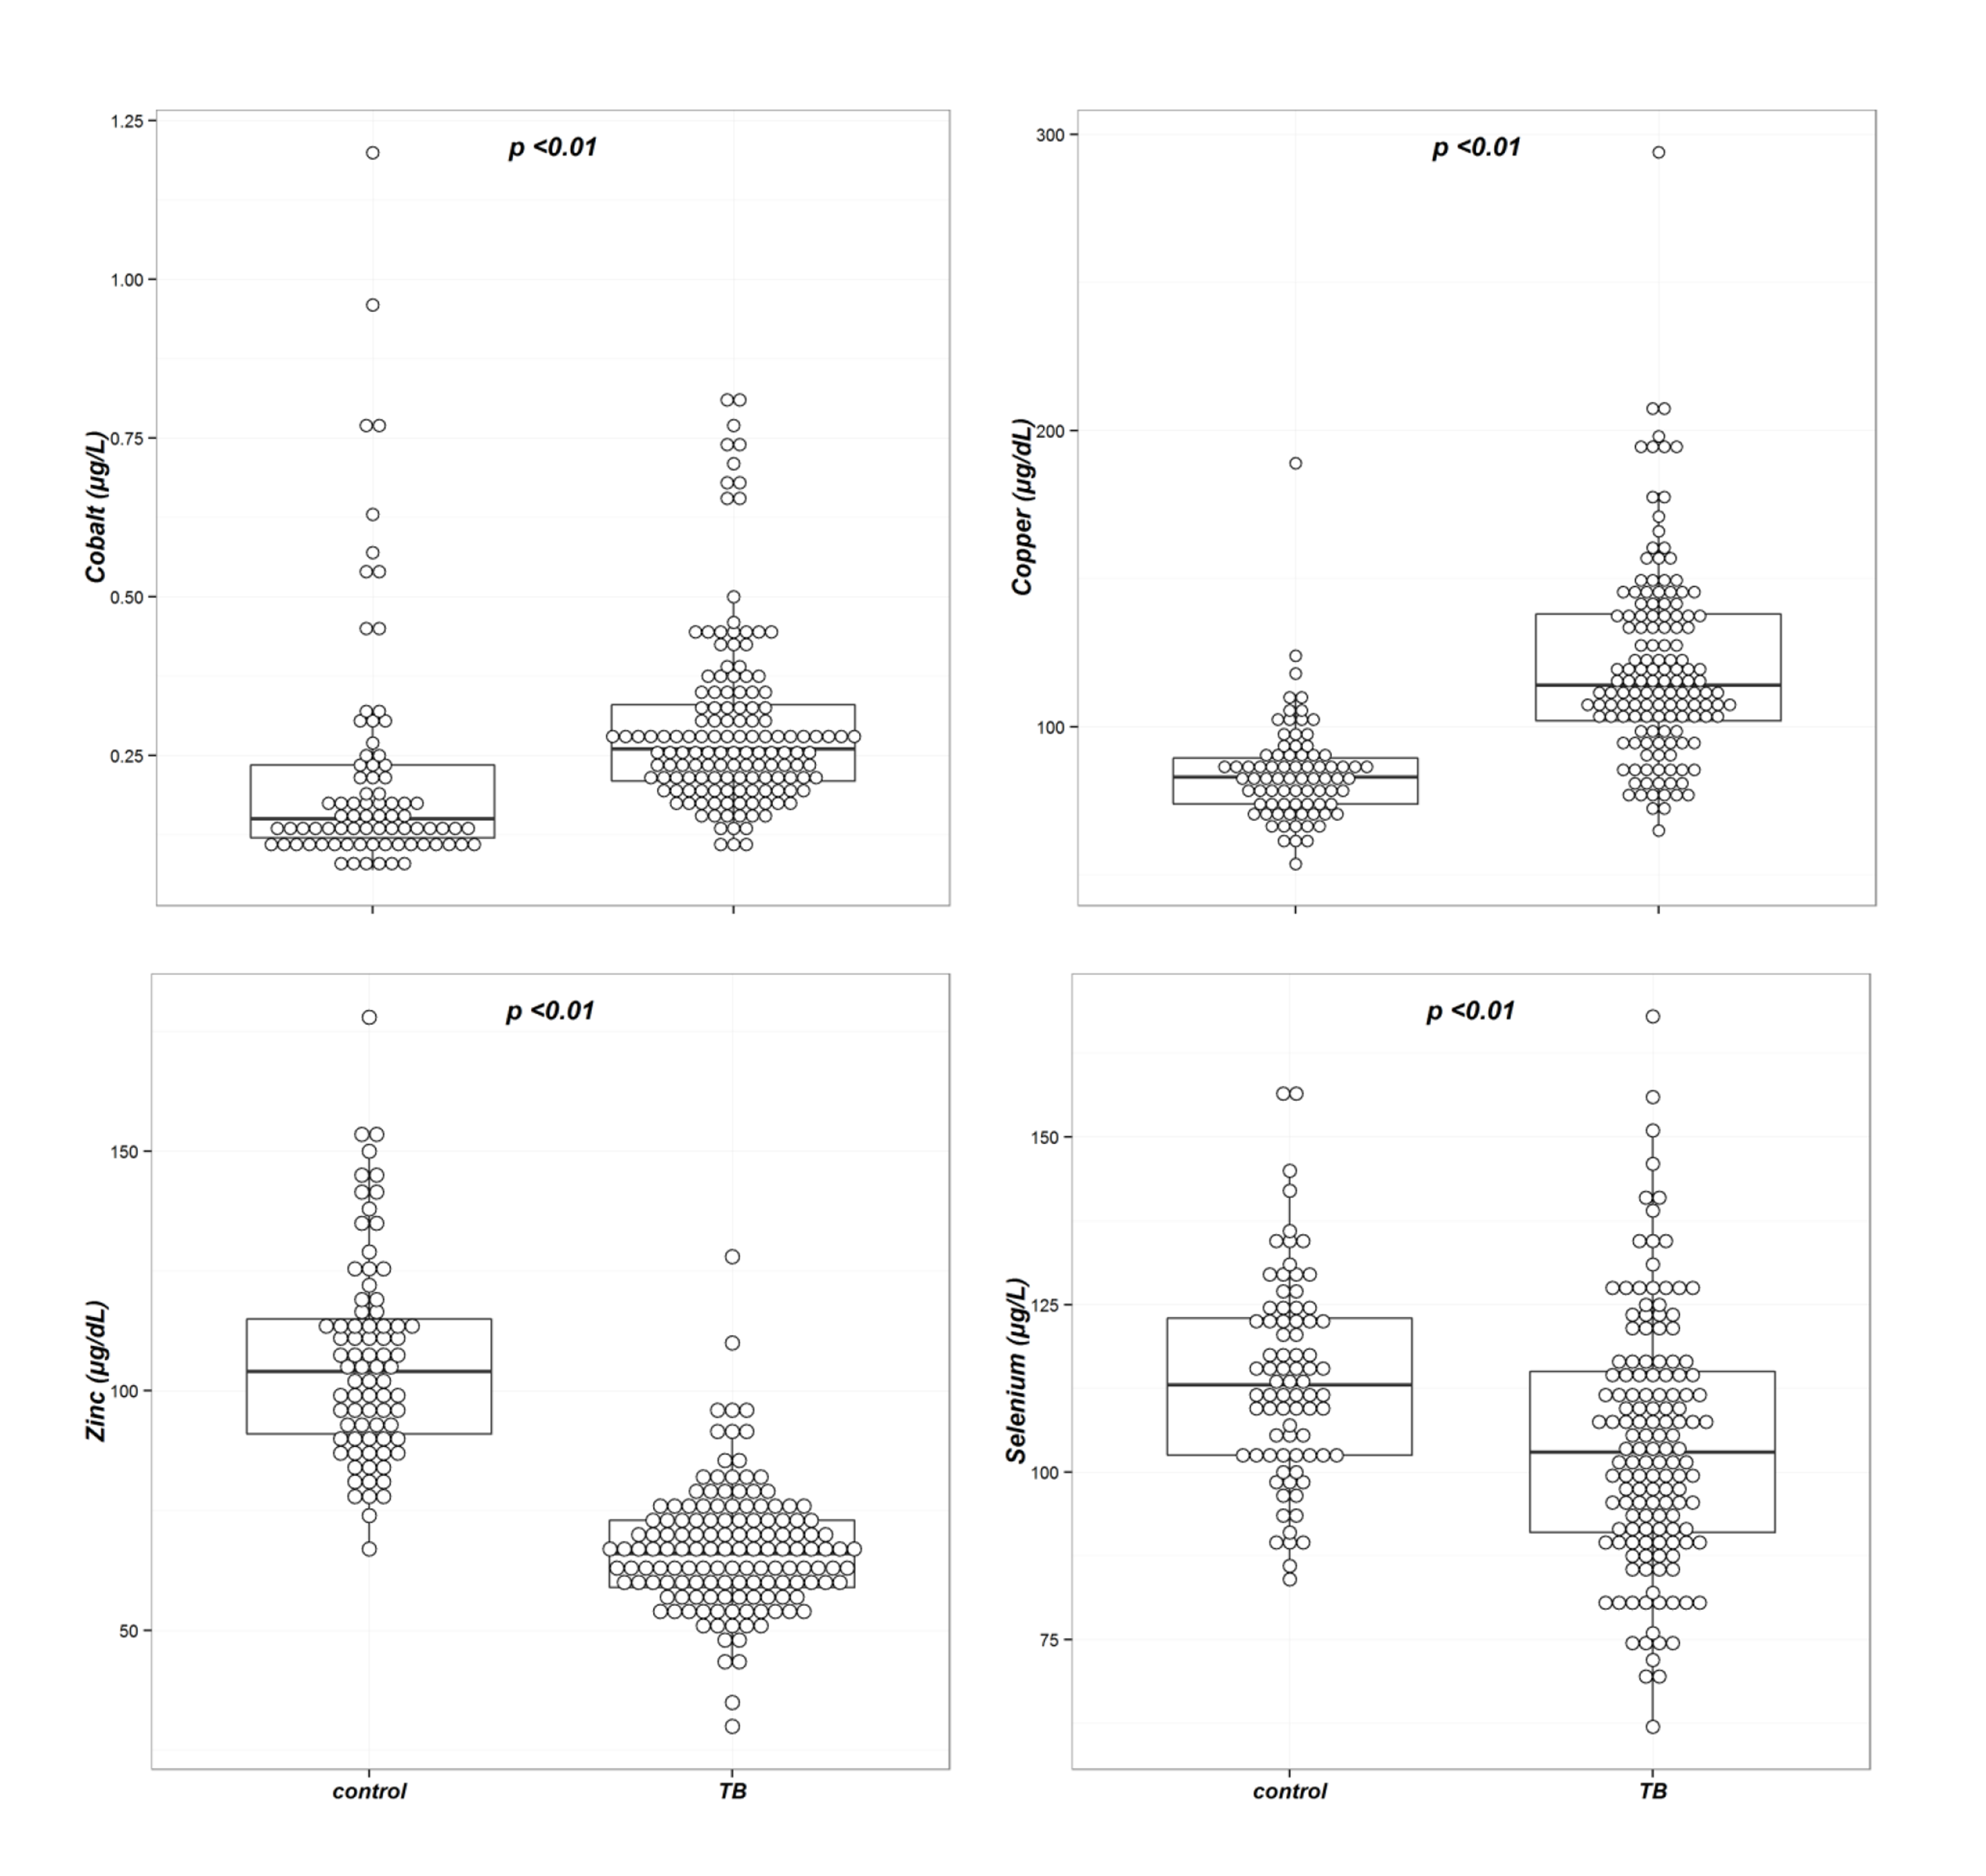
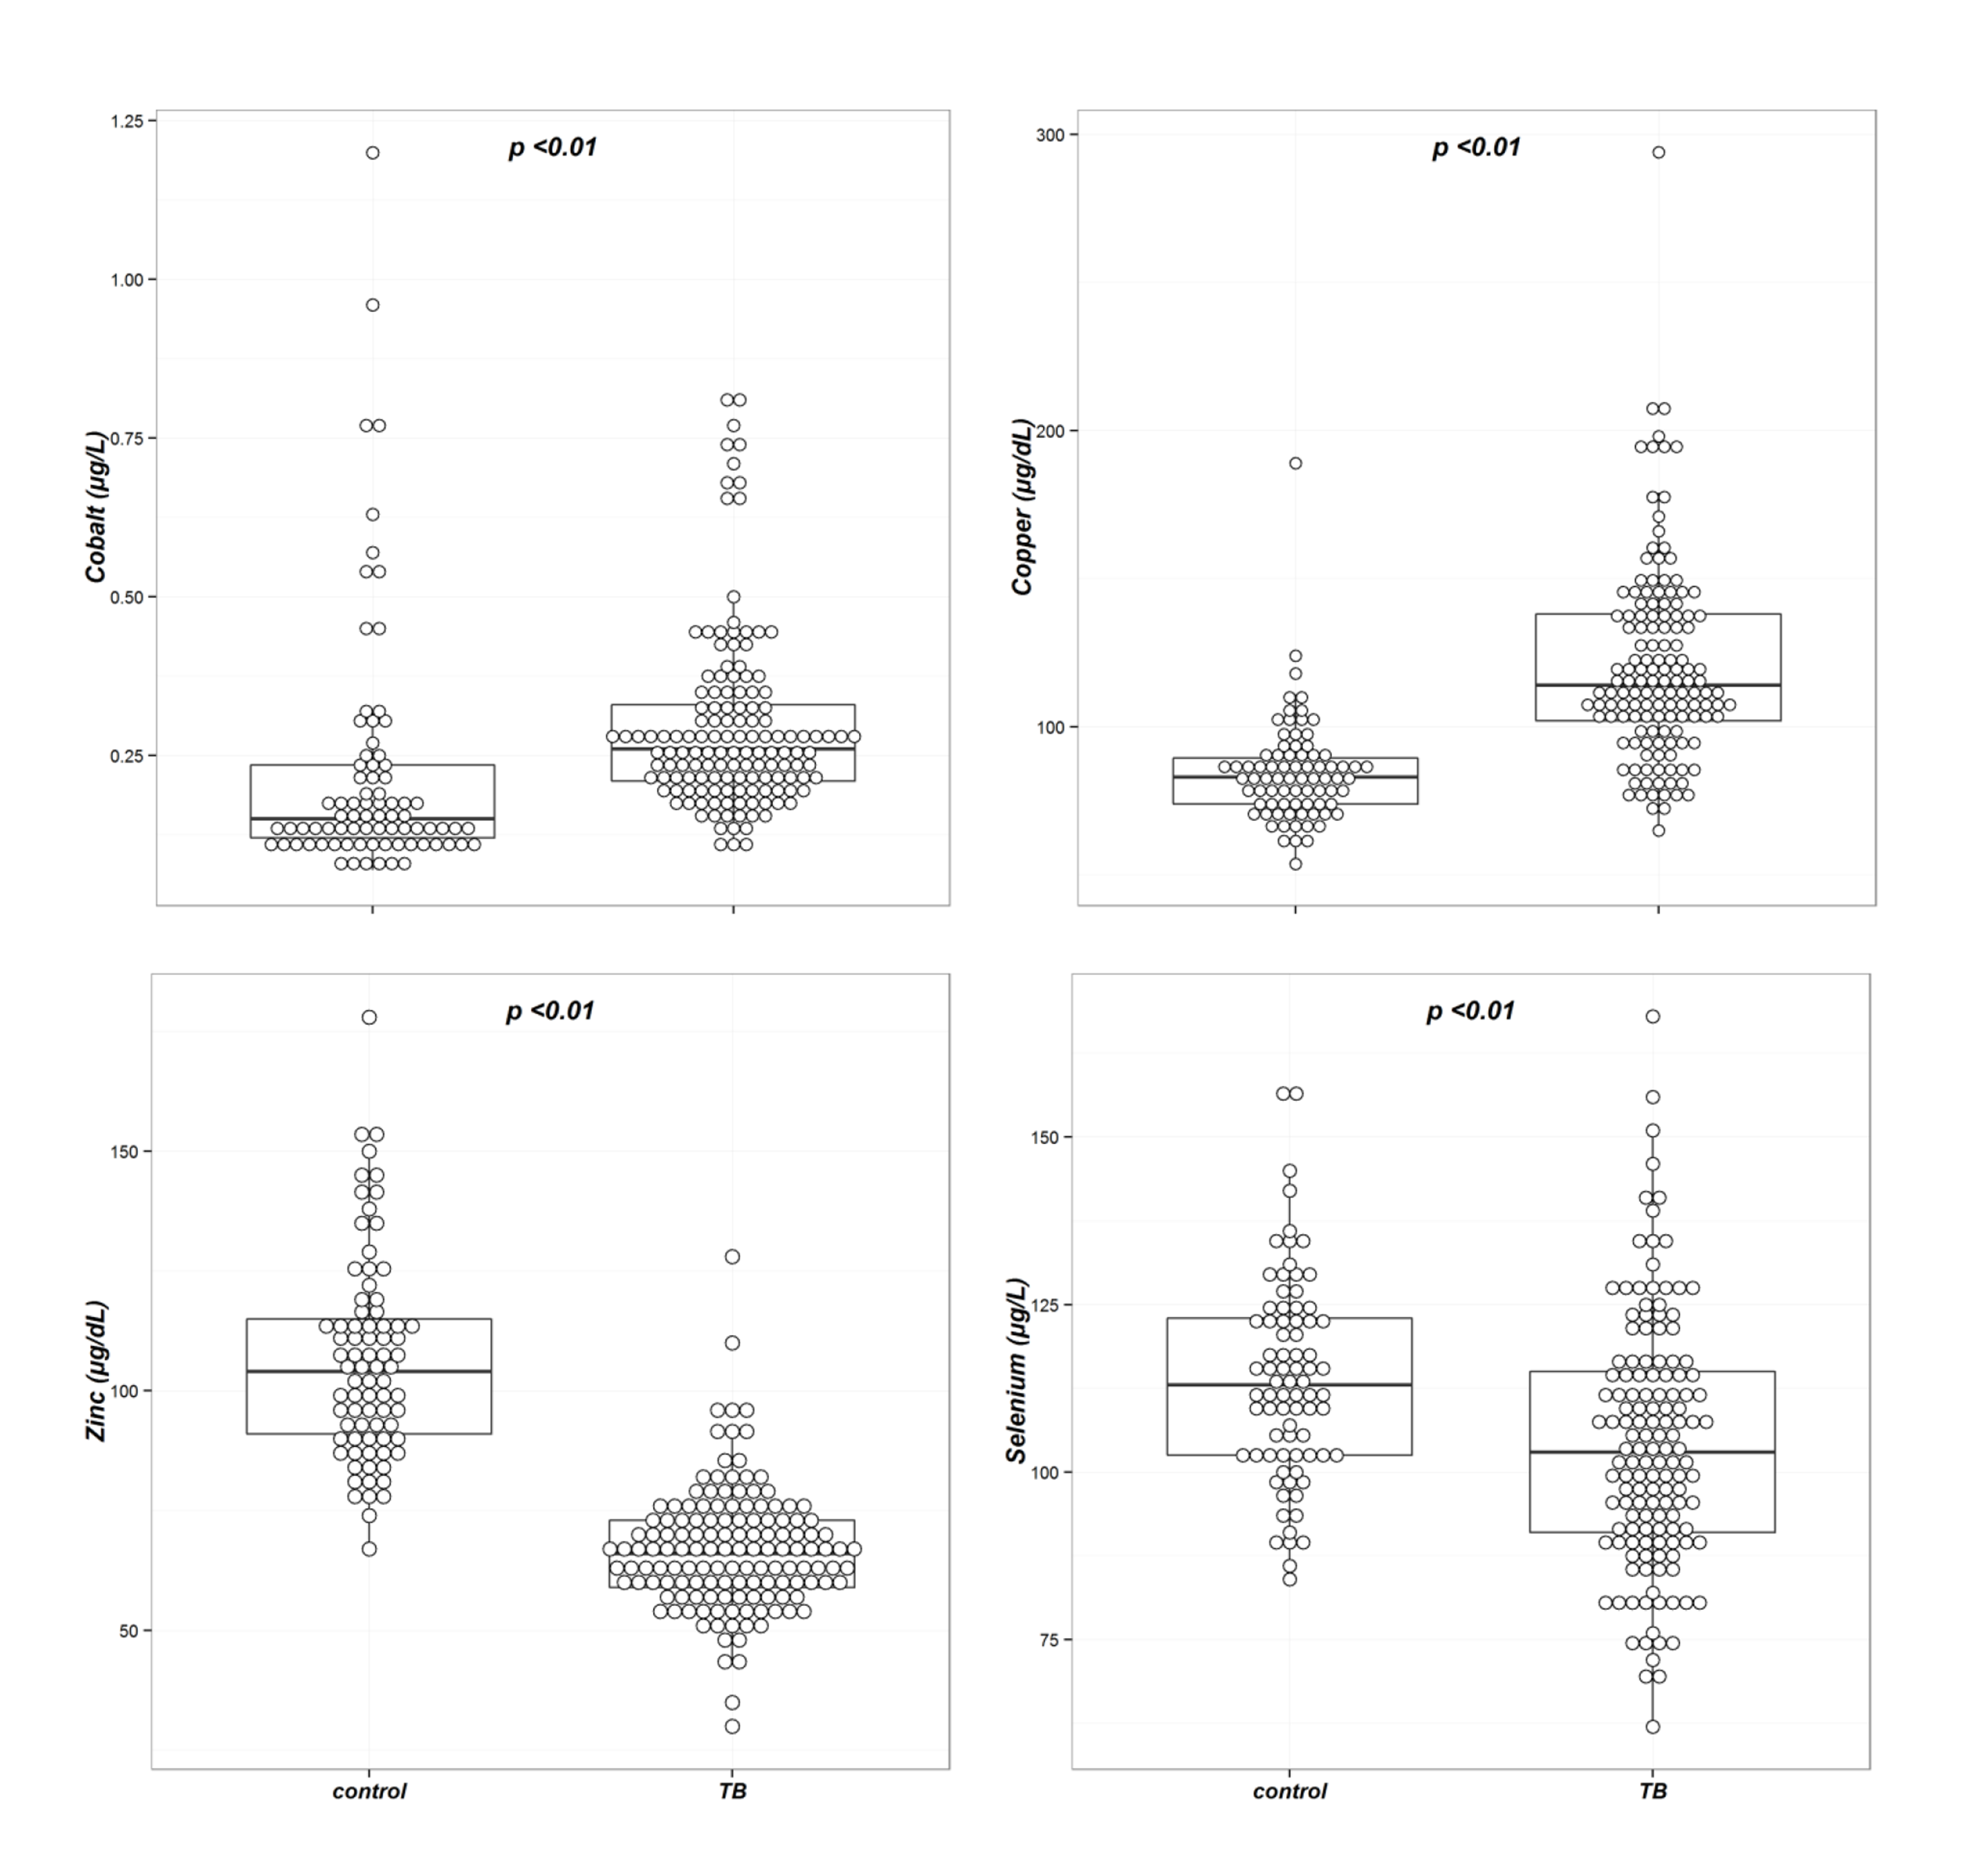
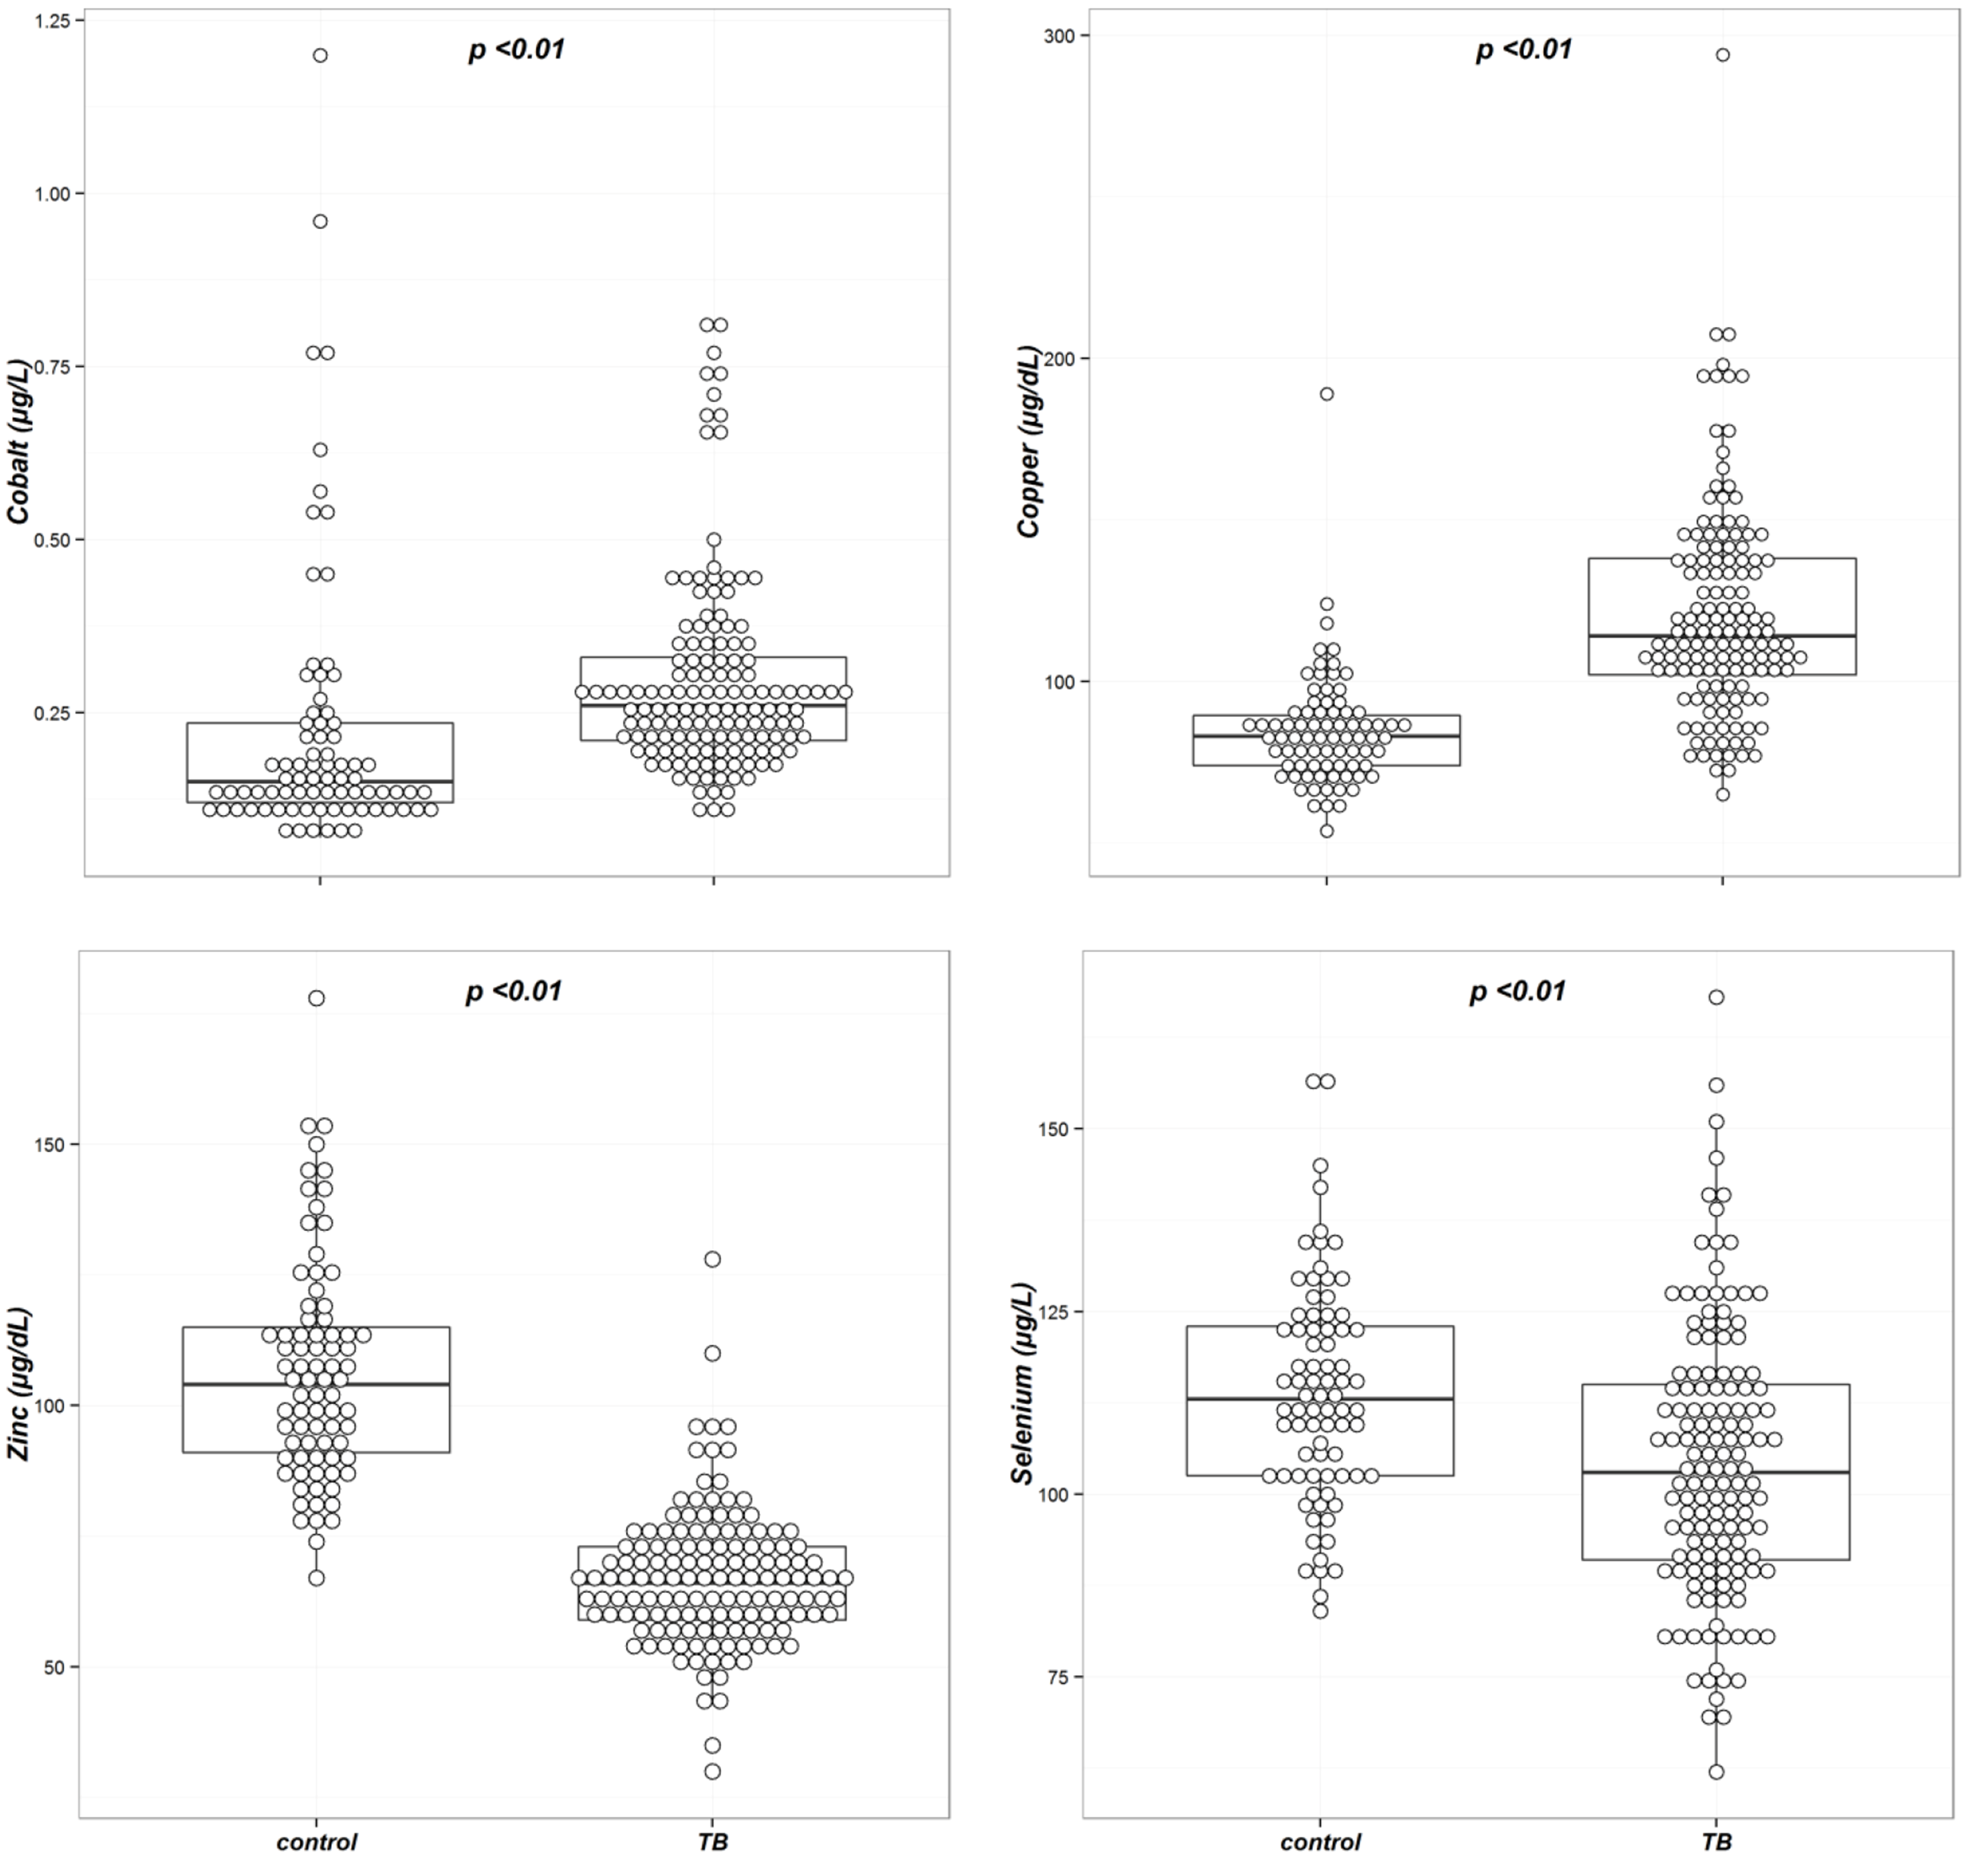
The concentrations of all four trace elements were significantly different between the two groups (
Table 3 and
Figure 1). In univariable analysis, the mean serum concentration ± SD (standard deviation) of selenium was significantly lower in the tuberculosis group compared with the control group (114 ± 15
vs. 104 ± 19 µg/L,
p < 0.01). The median serum cobalt and copper concentrations were significantly higher in the tuberculosis group compared with the control group (0.15
vs. 0.25 µg/L,
p < 0.01 for cobalt, and 83
vs. 115 µg/dL,
p < 0.01 for copper, respectively); the median zinc concentration was significantly lower in the tuberculosis group (104
vs. 66 µg/dL,
p < 0.01).
Multivariable analysis was performed to investigate factors associated with trace element concentrations; variables with a
p-value of less than 0.05 in univariable analysis were included in multivariable analysis. Copper and zinc concentrations were log-transformed for multivariable analysis, the results of which are summarized in
Table 4. In multivariable analysis, serum cobalt, copper, and zinc concentrations were significantly different between controls and tuberculosis patients (
p < 0.01), while serum selenium concentrations were not (
p = 0.14). Multivariable analysis revealed that BMI was associated with cobalt and zinc concentration, total protein, ALP, and CRP were associated with copper centration, and BMI, total protein, and total cholesterol were associated with selenium concentration (
p < 0.05).
Figure 1.
Box plots of the trace element concentrations in the tuberculosis and control groups. The concentrations of all four trace elements were significantly different between the two groups.
Figure 1.
Box plots of the trace element concentrations in the tuberculosis and control groups. The concentrations of all four trace elements were significantly different between the two groups.
Table 4.
Factors associated with four trace element concentrations: p-values for multivariable analysis.
Table 4.
Factors associated with four trace element concentrations: p-values for multivariable analysis.
| Parameter | Cobalt | Copper * | Zinc * | Selenium |
|---|
| Presence of tuberculosis | 0.0000 † | 0.0000 † | 0.0000 † | 0.1411 |
| BMI | 0.0000 † | 0.1800 | 0.0004 | 0.0003 |
| Total protein | 0.5739 | 0.0004 | 0.1641 | 0.0074 |
| Total cholesterol | 0.2103 | 0.6184 | 0.4125 | 0.0032 |
| AST | 0.0783 | 0.2198 | 0.2528 | 0.7848 |
| ALP | 0.2826 | 0.0115 | 0.0808 | 0.5724 |
| CRP | 0.0840 | 0.0000 † | 0.3127 | 0.1111 |
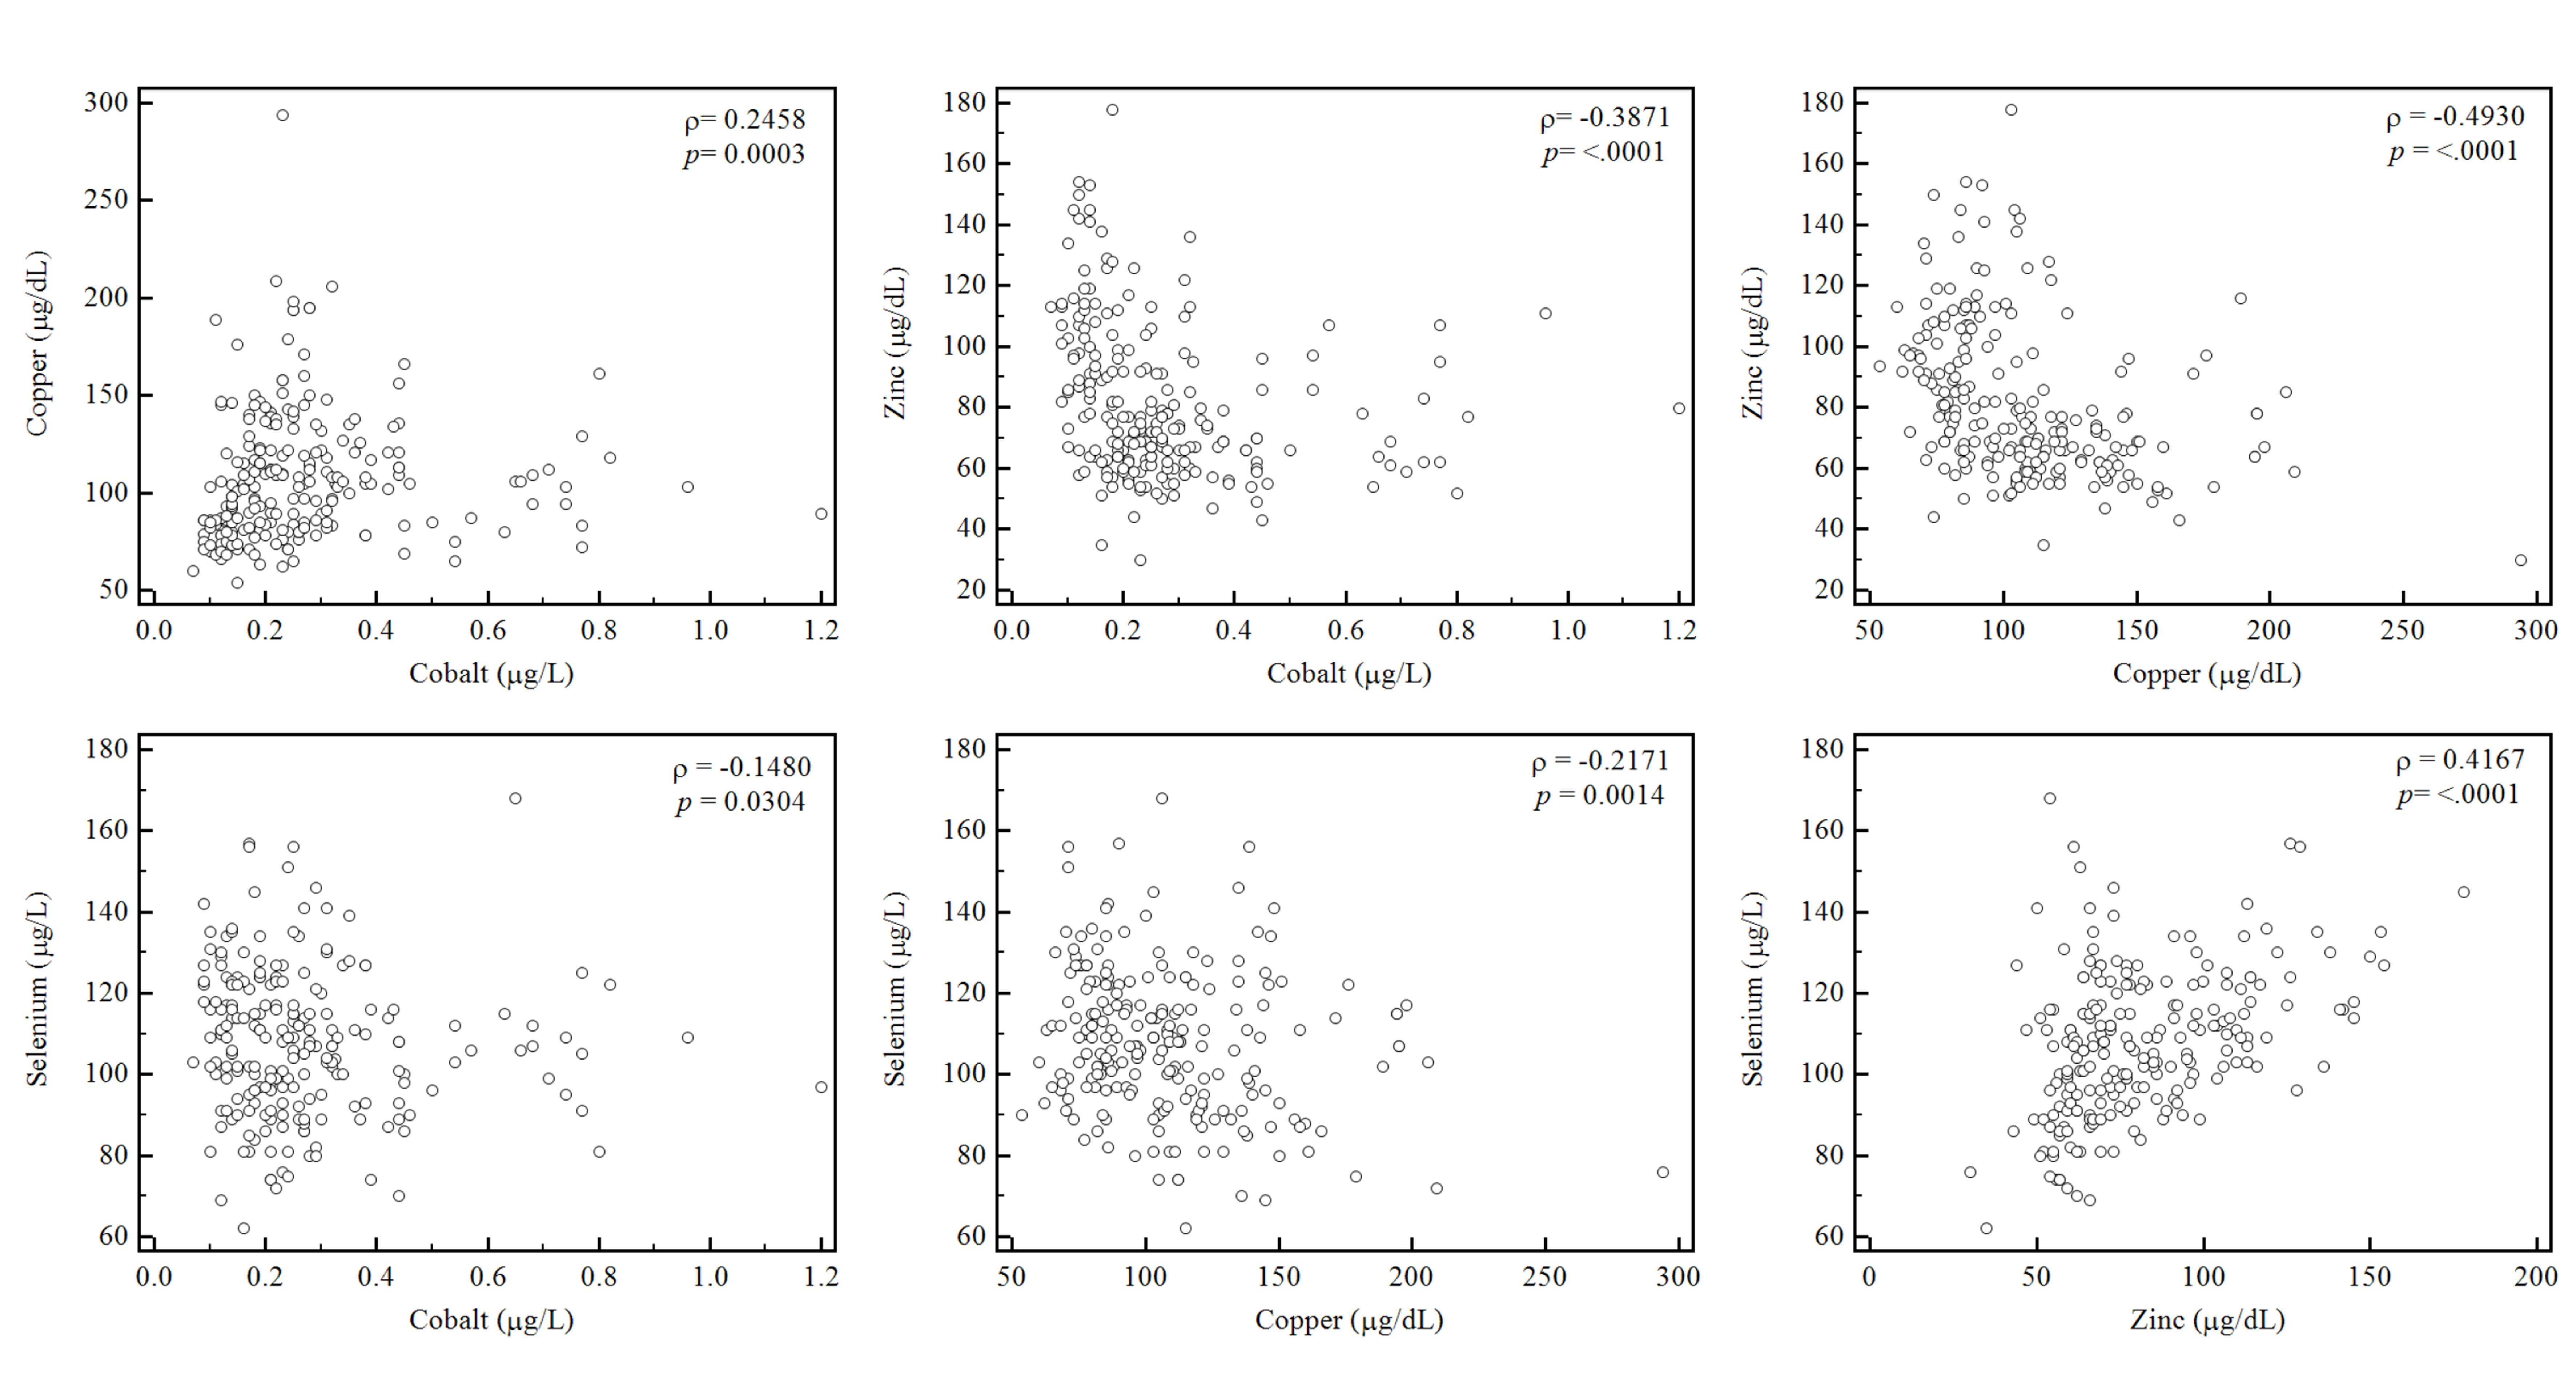
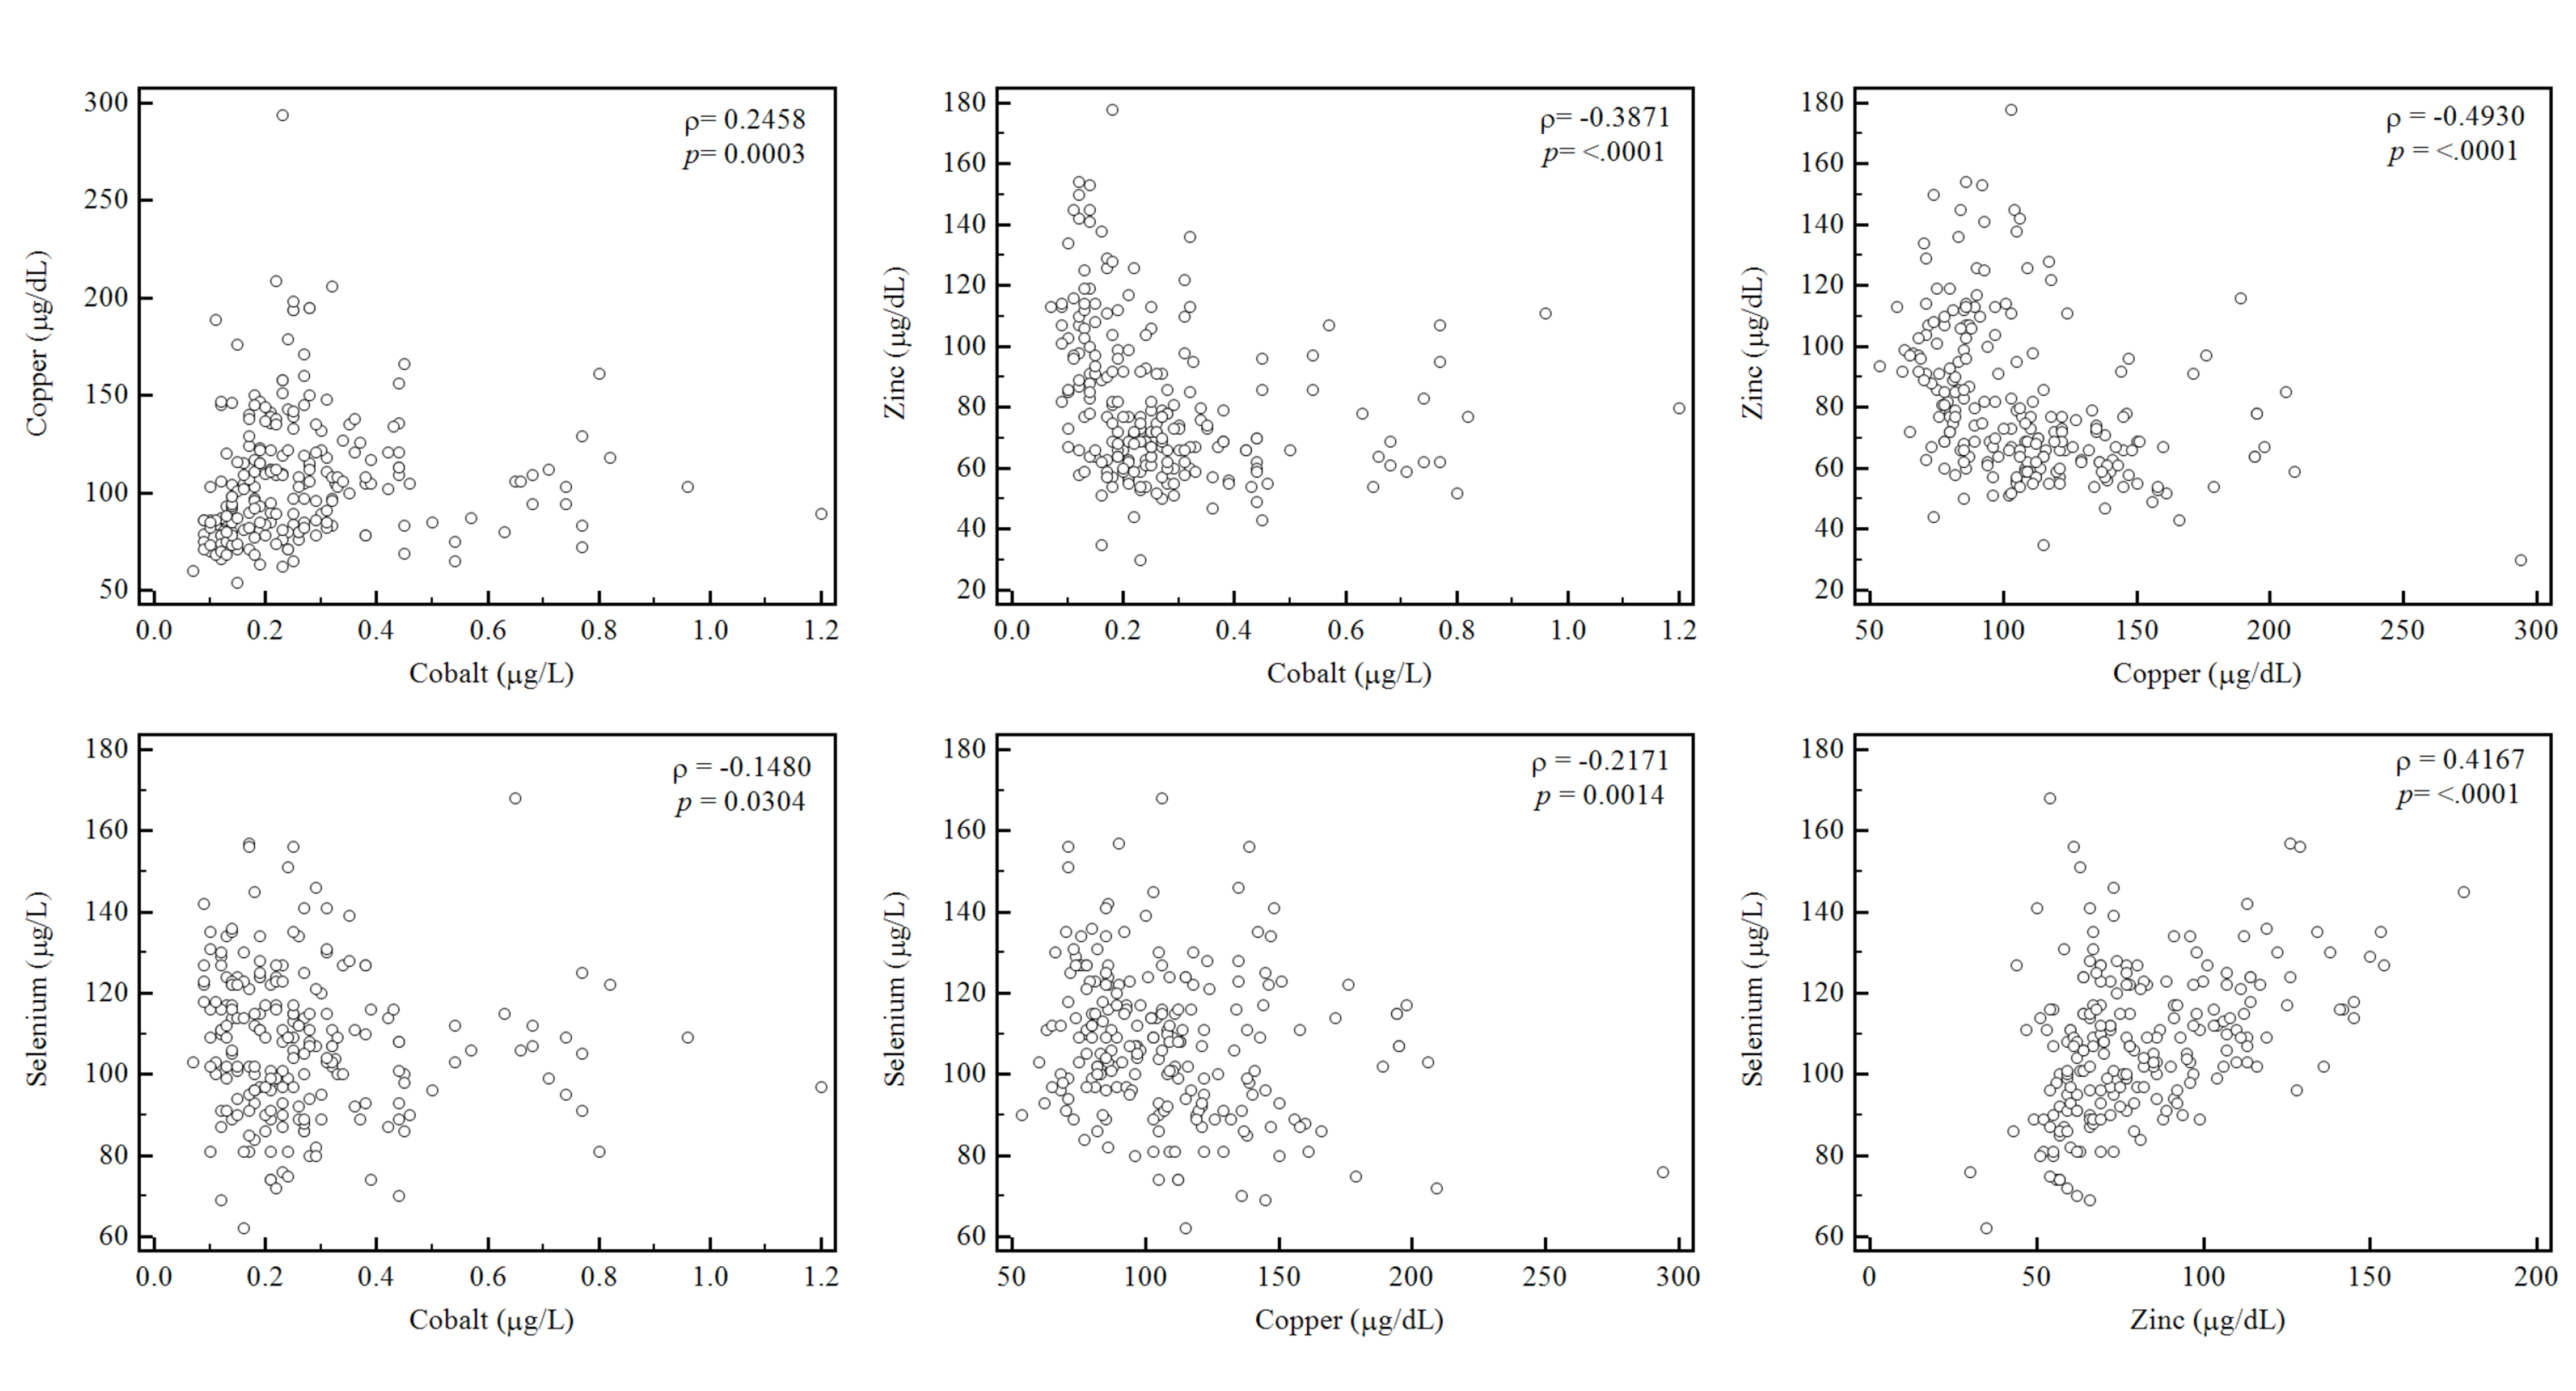
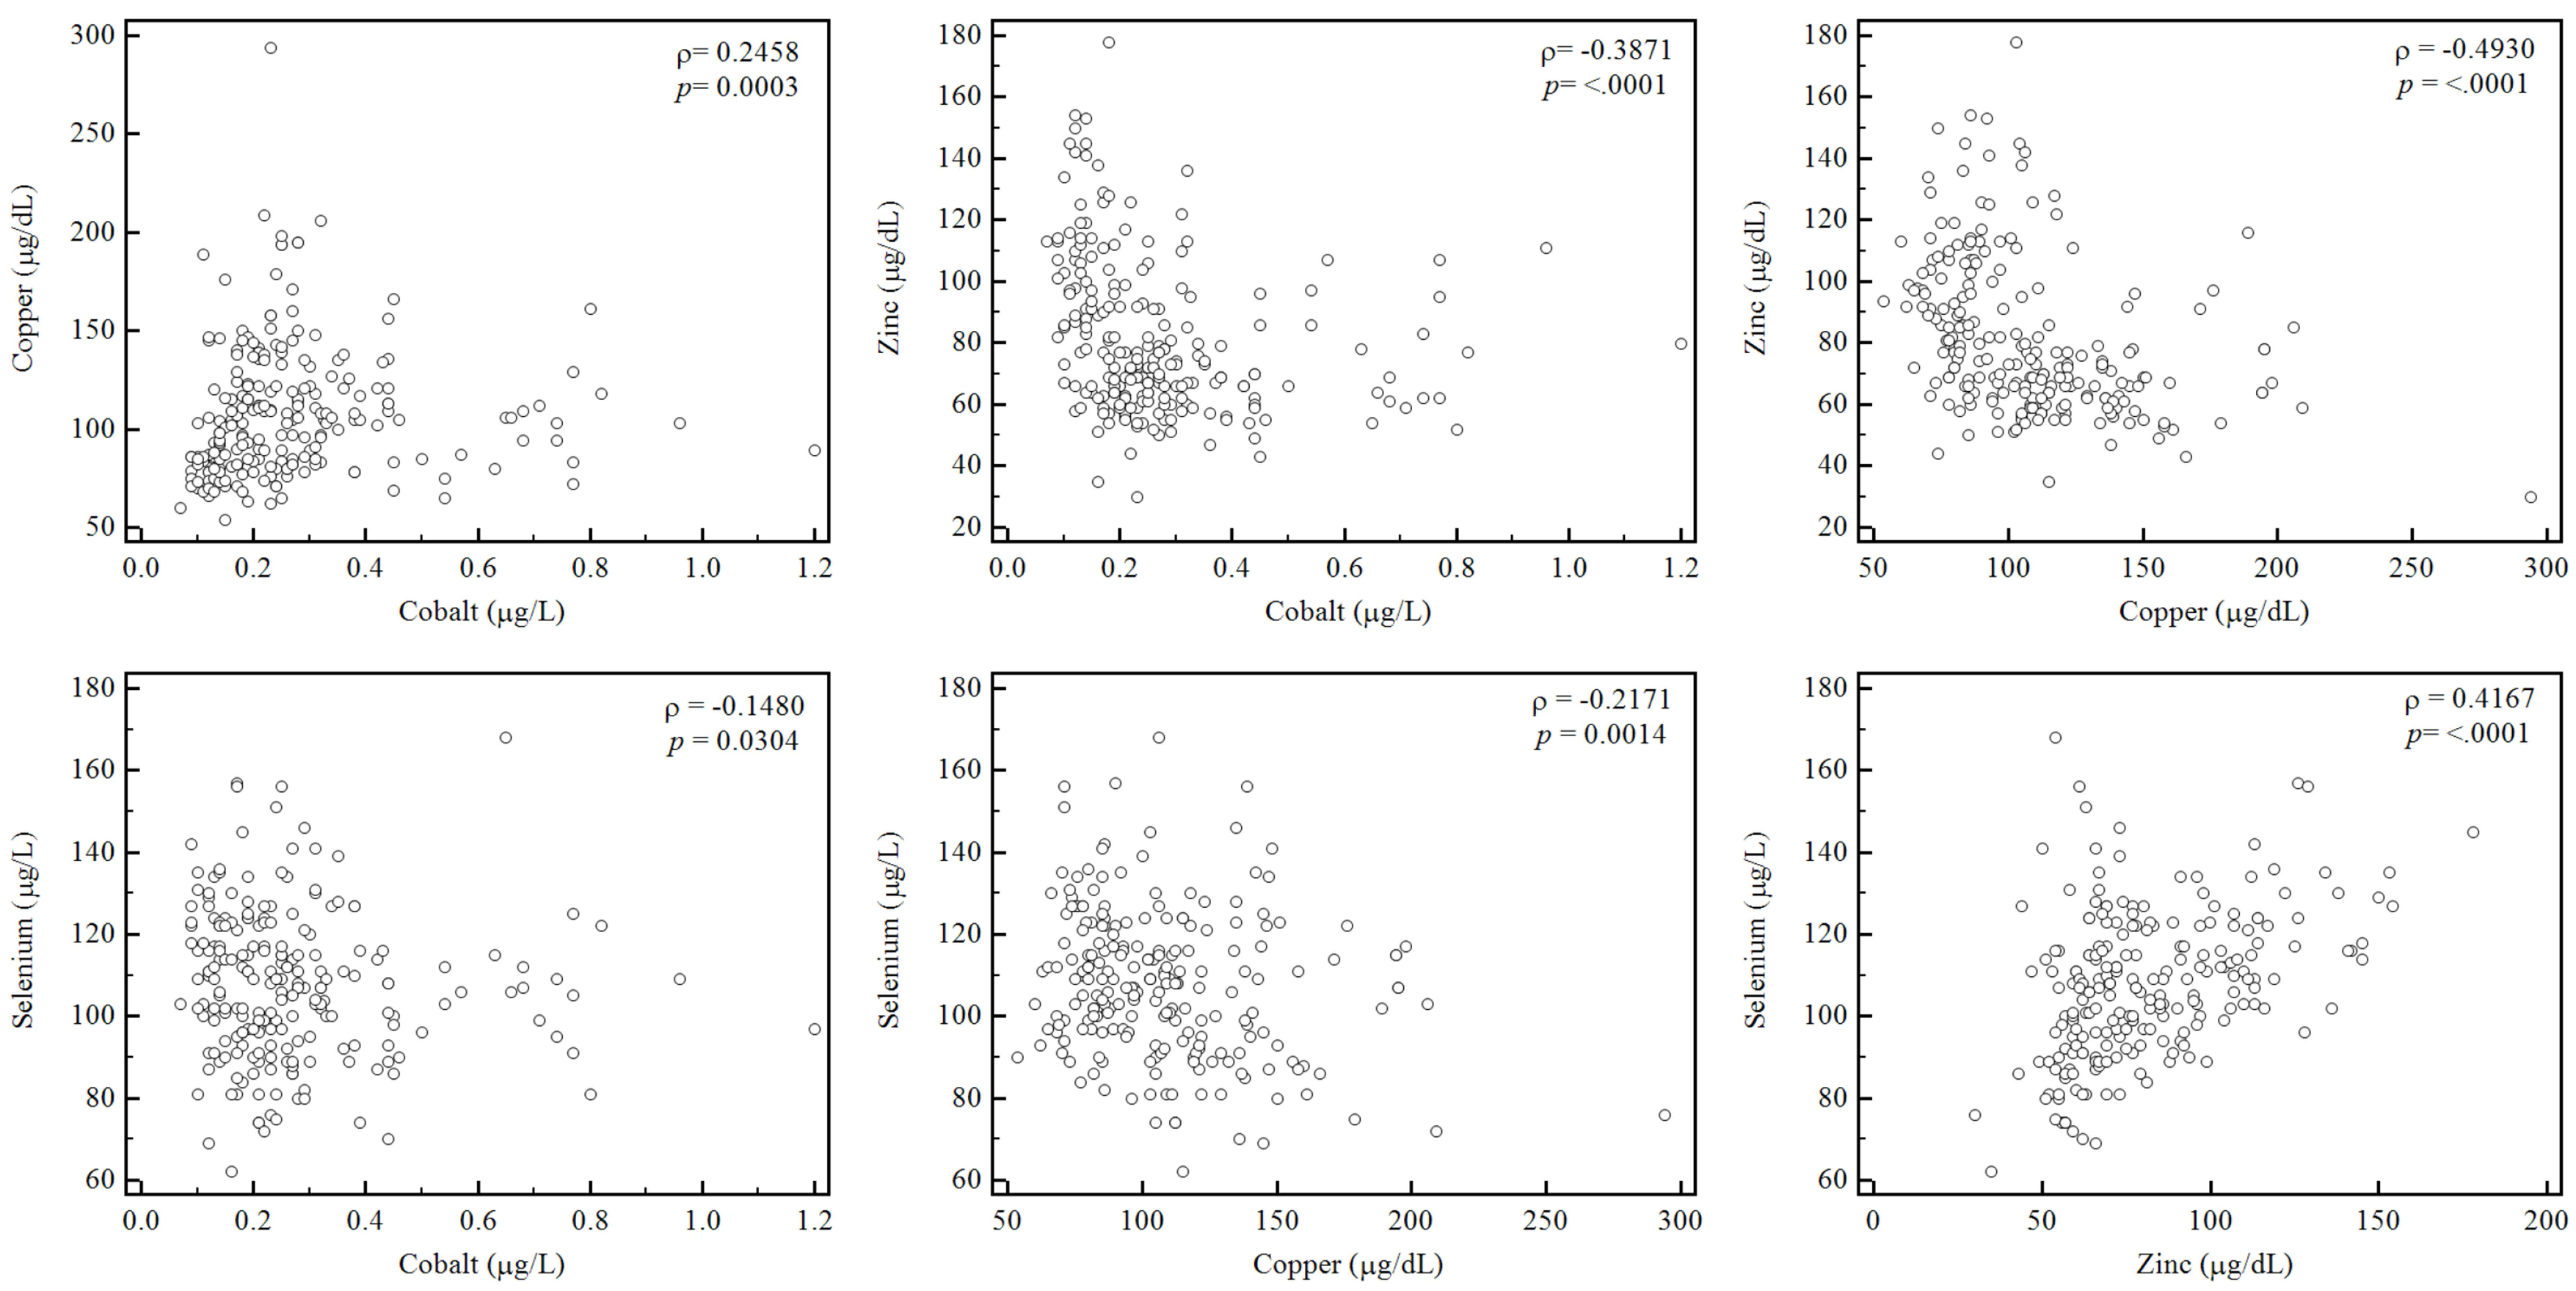
Correlations among four trace elements (Spearman correlation analysis) demonstrated a negative relationship between serum zinc and copper concentrations (ρ = 0.49,
p < 0.05), and a positive correlation between serum zinc and selenium concentrations (ρ = 0.41,
p < 0.05,
Figure 2). The analysis of the relationship between trace element concentrations and CRP level revealed a moderate positive correlation with copper (ρ = 0.41,
p < 0.01), a weak negative correlation with zinc (ρ = −0.15,
p = 0.02), and a weak negative correlation with selenium (ρ = −0.16,
p < 0.01).
Figure 2.
Correlations among concentrations of four trace elements. Serum copper and zinc showed a moderate negative correlation (ρ = −0.4930, p < 0.001) and serum zinc and selenium concentration showed a moderate positive correlation (ρ = 0.4167, p < 0.05).
Figure 2.
Correlations among concentrations of four trace elements. Serum copper and zinc showed a moderate negative correlation (ρ = −0.4930, p < 0.001) and serum zinc and selenium concentration showed a moderate positive correlation (ρ = 0.4167, p < 0.05).
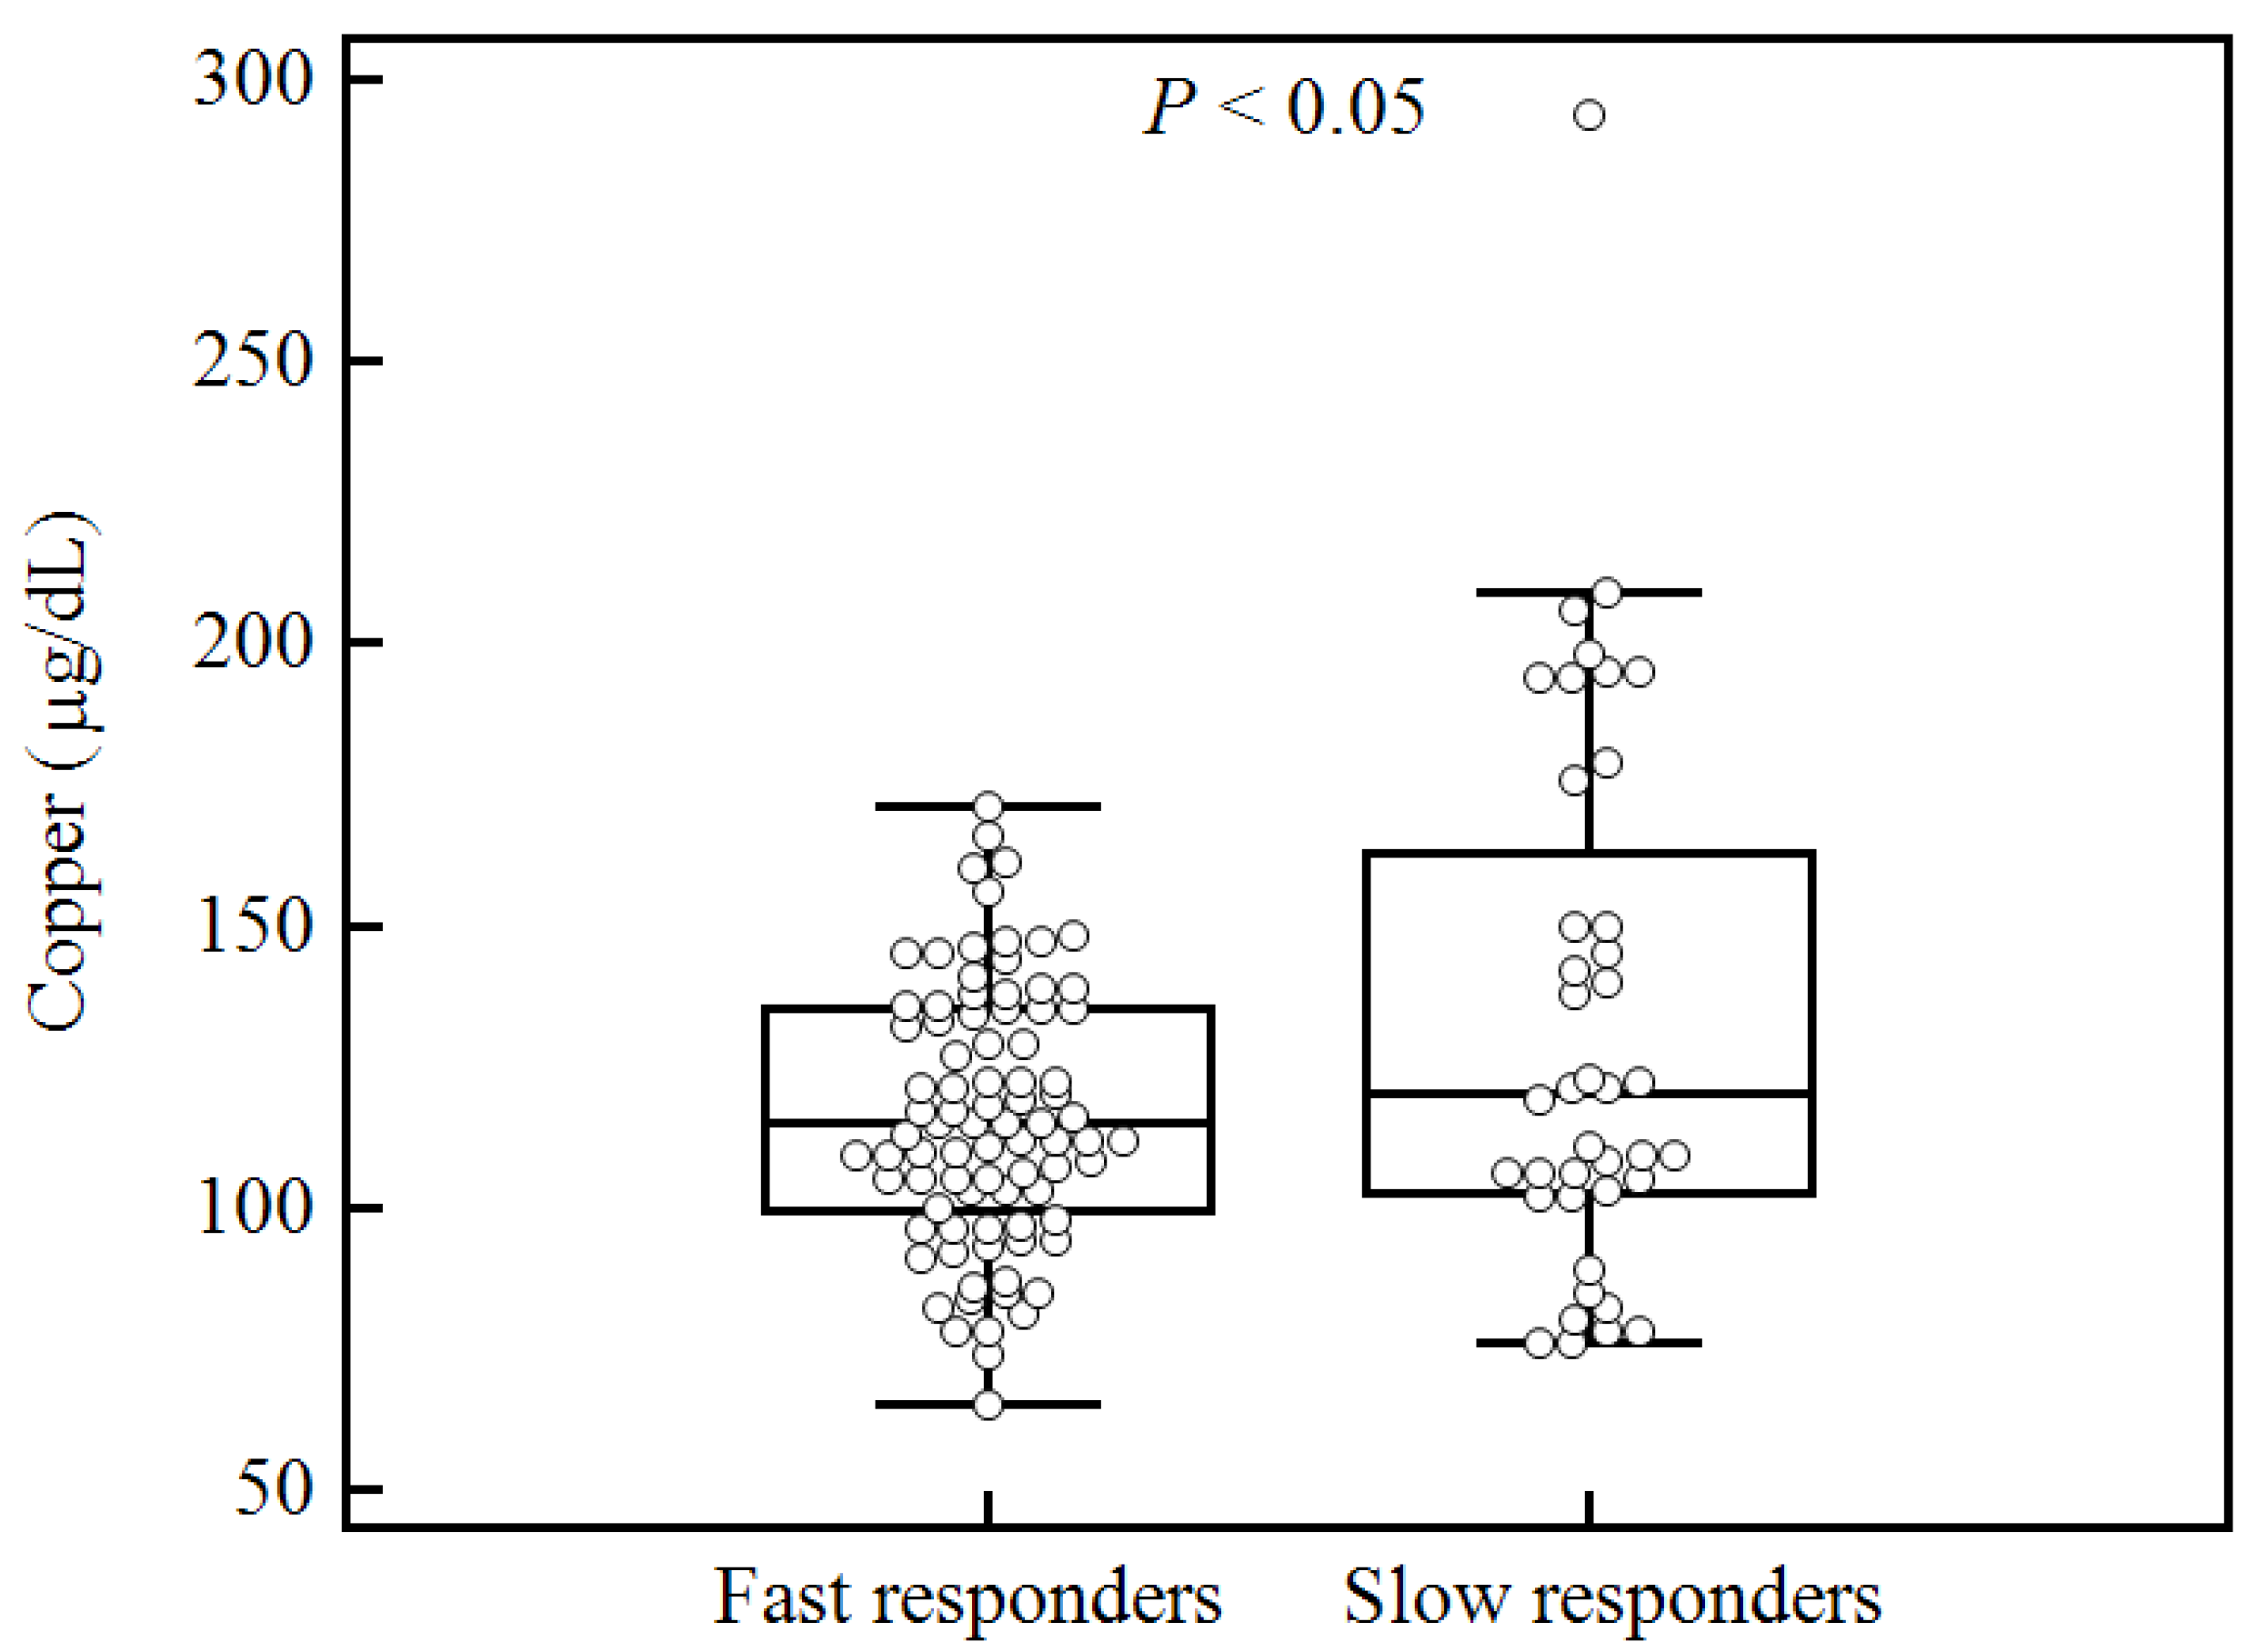
We next determined whether trace element concentrations were associated with clinical outcomes. Patients with tuberculosis underwent antituberculosis treatment and follow-up smear tests. Trace element concentrations were then compared and examined for correlation with treatment outcomes. Among 141 patients with tuberculosis, 40 (28.4%) had positive follow-up culture tests or smear tests after one month of antituberculosis treatment. Of the four trace elements, only serum copper level (at the time of diagnosis) was correlated with treatment outcome; specifically, culture-positive patients tended to have higher serum copper concentrations (
p < 0.05,
Figure 3).
4. Discussion
In this study, we investigated the concentrations of four serum trace elements in healthy controls compared with tuberculosis patients. The serum trace element concentrations (mean ± SD) in this study were 0.23 ± 0.20 μg/L for cobalt, 85 ± 17 μg/L for copper, 107 ± 21 μg/dL for zinc, and 114 ± 15 μg/dL for selenium in controls without tuberculosis. Only a few studies have reported serum trace elements concentrations identified using ICP-MS in healthy Korean subjects. The serum cobalt concentration has been reported to range from 0.29 ± 0.15 μg/L in 51 healthy Korean subjects [
12] to 0.47 ± 0.27 μg/L in 103 healthy subjects [
11]. Serum copper and zinc concentrations had reported averages of 91.32 ± 21.65 μg/dL and 80.45 ± 15.08 μg/dL, respectively, in 103 healthy subjects [
11]. The mean serum selenium concentration was 112.05 ± 30.42 μg/L in 100 healthy subjects [
13] and 81.20 ± 31.47 μg/L in 103 healthy subjects [
11]. The differences in trace element concentrations between previous studies and the present study could be related to variation in the age and sex distribution of participants [
11,
13].
Figure 3.
Comparison of serum copper levels at the time of diagnosis between fast responders and slow responders defined by the culture-positive and culture-negative results after one month of standard antituberculosis therapy.
Figure 3.
Comparison of serum copper levels at the time of diagnosis between fast responders and slow responders defined by the culture-positive and culture-negative results after one month of standard antituberculosis therapy.
This study found that the serum zinc and selenium concentrations were significantly lower in patients with tuberculosis compared with control patients, while the copper concentrations were higher. These findings are comparable with those of previous studies performed in Ethiopia, Italy, and Indonesia [
6,
7,
8]. Furthermore, the present study identified a positive correlation between the serum zinc and selenium concentrations. Zinc has been implicated in antioxidant defense via the antioxidant metalloenzyme copper-zinc superoxide dismutase. Specifically, zinc binds to the redox active sites and prevents the binding of more damaging metals. Zinc also regulates metallothioneins, which have roles in free radical scavenging and inflammatory processes [
14]. Selenium has direct antioxidant activity as a result of its incorporation into selenoproteins, such as glutathione peroxidases, thioredoxin reductase, and some isoforms of methionine sulfoxide reductase [
15]. Zinc and selenium are both essential for cell-mediated and humoral immunity, and their statuses have been shown to affect the function of adaptive and innate immune cells [
16,
17,
18]. Zinc and selenium deficiencies can increase susceptibility to tuberculosis infection and leave individuals vulnerable to oxidative stress. Although a recent systematic review reported that the plasma concentrations of zinc and selenium can be improved by supplementation during the early stages of tuberculosis treatment, a consistent benefit from supplementation on tuberculosis treatment outcome and/or nutritional recovery has not been demonstrated [
2]. Future research is needed to determine the extent to which these trace elements impact clinical outcomes and also to establish whether the routine administration of supplements results in better tuberculosis treatment outcomes and/or improved life quality.
Copper is involved in the natural defense system against reactive oxygen species [
19]. Moreover, iron and copper are interlinked via ceruloplasmins, which exhibit ferroxidase activity and are suitable for assessing free radical activity [
20]. The maintenance of copper homeostasis, which involves redistribution and mobilization, has been reported to be key in the immune response to tuberculosis infection [
20]. In this study, the mean serum copper concentration was significantly higher in patients with tuberculosis compared with control patients. This finding is comparable with those of previous studies performed in Ethiopia, Italy, and Canada [
6,
7,
21]. The negative correlation between copper and zinc concentrations observed in this study was comparable to the results presented in previous literature, and could be explained by the ability of zinc ions to block copper absorption, possibly by formation of intestinal metallothionein, which strongly binds copper [
4]. Among the four trace elements investigated here, only the copper concentration was significantly correlated with the serum CRP level (ρ = 0.41,
p < 0.05). Changes in CRP concentration have previously been reported to be associated with decreased serum zinc concentrations and increased serum copper concentrations [
6,
22]. The association of elevated serum copper with elevated CRP observed in the present study may reflect nonspecific increases in the serum concentrations of copper-binding proteins, such as ceruloplasmin, during the acute-phase response to tuberculosis infection [
6]. In the present study, serum copper concentrations were correlated with treatment outcomes as assessed after one month of standard antituberculosis therapy; specifically, culture-positive patients tended to have higher serum copper concentrations compared with culture-negative patients (
p < 0.05). This finding is comparable to that of a previous study performed in Canada [
21]. Considering the positive correlation between copper concentrations and CRP levels, increased copper concentrations could reflect host inflammation in response to live tuberculosis bacteria. Thus, serum copper and CRP concentrations may be important parameters for evaluating the persistence of nonconversion after one month of tuberculosis treatment [
21].
Cobalt is required for the biosynthesis of vitamin B12 and is also an essential micronutrient for both
Mycobacterium tuberculosis and its host [
20]. A recent study reported a novel antituberculosis treatment that employed metal-based drugs by utilizing coordination complexes of copper and cobalt with the pyrophosphate ligand. This study reported notable selectivity and marked potency against
M. tuberculosis, which implicates these metals as important for controlling tuberculosis infection [
23]. However, our knowledge of the role of cobalt in tuberculosis is incomplete [
20]. In the present study, serum cobalt concentrations were not significantly different between patients with tuberculosis and control patients. Moreover, no significant relationship was observed between cobalt concentration and the clinical outcome after antituberculosis treatment. Future studies are needed to define the role of cobalt in tuberculosis pathogenesis and to elucidate its potential antimycobacterial effects.
Interestingly, we observed a number of differences in trace element concentrations and demographic characteristics between patients with tuberculosis and noninfected control patients. For instance, BMI and total cholesterol were significantly lower in patients with tuberculosis compared with control patients, while the serum albumin levels of the two groups were not significantly different. Thus, total serum cholesterol appears to be a more sensitive parameter for assessing trace element concentrations in serum than serum albumin. A previous study in another Asian population (China) reported no significant differences in cholesterol concentration between patients with tuberculosis and control patients, although a significant difference in albumin level was observed [
24]. This difference could be explained by the smaller sample size, which resulted in a lack of statistical significance. Further studies are needed to assess whether albumin or total cholesterol is a better indicator of trace element concentrations in the serum in patients with tuberculosis.
This study has several strengths. Firstly, this study was prospectively designed. Secondly, it is the first study to assess trace element concentrations in the serum in an ethnically homogeneous population of Korean adults. Thirdly, the study sample sizes of the case and control arms were the largest than ever reported in the literature. Finally, trace element concentrations were analyzed using a state-of-the-art ICP-MS method by which multiple elements can be screened simultaneously and with high sensitivity.
This study also had a few limitations. For instance, it was a single-center study and no information was collected regarding dietary supplementation of trace elements. Moreover, the trace element concentrations were not determined before antituberculosis treatment, thus precluding the comparison and assessment of changes in trace element concentrations and their effects on clinical outcomes. However, the current study is valuable because it is the first to assess trace element concentrations in the serum in a Korean population. It is also the first to examine potential associations between trace element concentrations and clinical outcomes after antituberculosis treatment, which will potentially inform future research.


