Dietary Nitrates, Nitrites, and Nitrosamines Intake and the Risk of Gastric Cancer: A Meta-Analysis

Abstract
:1. Introduction
2. Methods
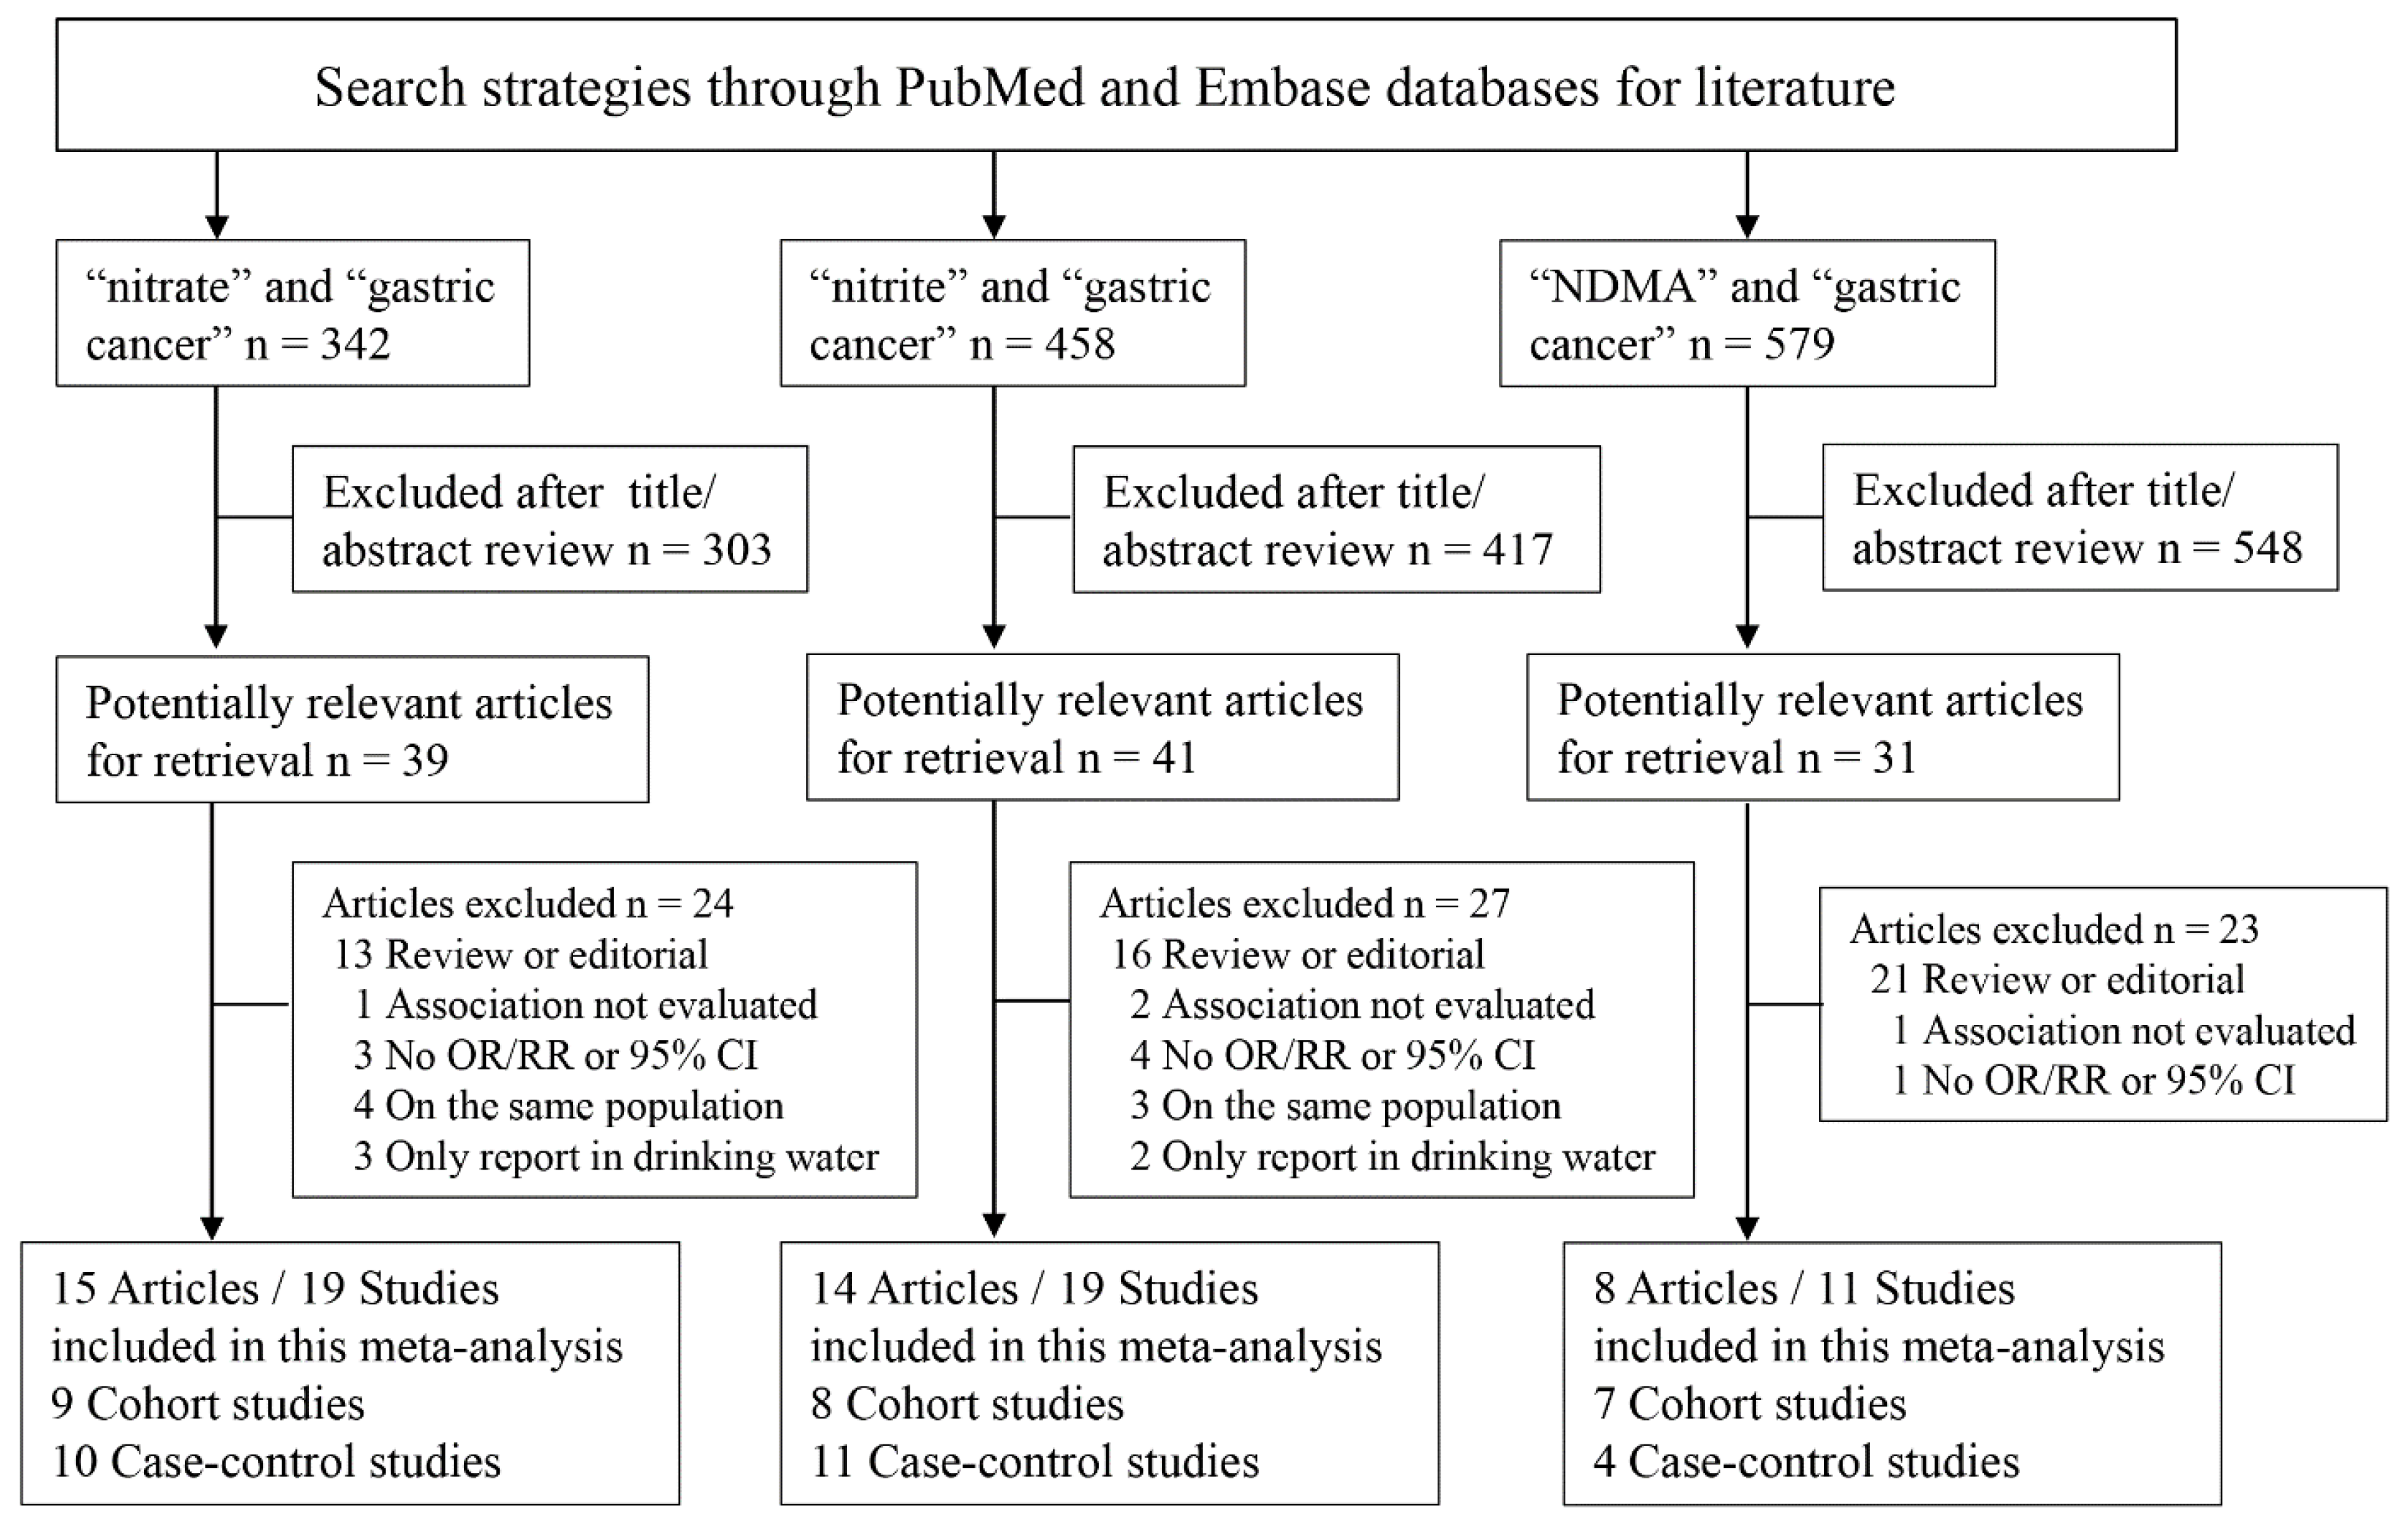
2.1. Literature Search and Selection
2.2. Data Extraction and Quality Assessment
2.3. Statistical Analysis
2.4. Disease Assessment and Dietary Assessment
3. Results
3.1. Literature Search and Quality Assessment

| First Author, Year, Location | Cohort Size | Follow-up (Years) | No. of Cases (Age/Definition) | Intake Assessment | Analytical Category | Definition/Nutrient Content Values | Consumption Categories | Adjusted RR (95% CI) | Adjusted Variables |
|---|---|---|---|---|---|---|---|---|---|
| Galanis, 1998 [15], Hawaii | 5610 men and 6297 women | 14.8 | 108 (NA/form Hawaii Tumor Registry, a member of the Surveillance, Epidemiology, and End Results (SEER) program of the National Cancer Institute) | short questionnarire (weekly frequency of intake of 13 foods and food groups, and the daily frequency of intake of 6 beverages) | Nitrates times/week | combined frequency of intake of dried fish, pickled vegetables and processed meats/based on previous published literature | 0–3 | 1.0 (Referent) | Age, years of education, Japanese place of birth, gender. Analyses among men were also adjusted for cigarette smoking and alcohol intake status |
| 4–7 | 1.30 (0.80–2.00) | ||||||||
| ≥8 | 0.90 (0.50–1.40) | ||||||||
| Van Loon, 1998 [16], the Netherlands | 1688 men and 1812 women | 6.3 | 282 (mean: 63.0 years, SD: 4.1/exclude cases self-reported, in situ carcinoma, or without microscopically confirmed diagnosis) | 150-item semiquantitative FFQ | Nitrates mg/day | derived from vegetables (considered loss during preparation) and drinking water/from State Institute for Quality Control of Agricultural Products solely on the intake of cured meat/from TNO Nutrition and Food Research Institute | 59.8 | 1.0 (Referent) | Age, sex, smoking, education, coffee consumption, intake of vitamin C and beta-carotene, family history of stomach cancer, prevalence of stomach disorders, use of refrigerator or freezer |
| 84.7 | 1.25 (0.84–1.86) | ||||||||
| 104.4 | 0.74 (0.47–1.15) | ||||||||
| 127.3 | 0.92 (0.59–1.44) | ||||||||
| 179.8 | 0.90 (0.53–1.55) | ||||||||
| Nitrites mg/day | 0.01 | 1.0 (Referent) | |||||||
| 0.04 | 1.20 (0.78–1.86) | ||||||||
| 0.09 | 1.18 (0.77–1.82) | ||||||||
| 0.16 | 0.88 (0.56–1.37) | ||||||||
| 0.35 | 1.44 (0.95–2.18) | ||||||||
| Knekt, 1999 [17], Finnish | 9985 men and women | 24 | 68 (15–49 years: 18 cases, 50–59 years: 28, cases, 60–99 years: 22 cases/through the nationwide Finnish Cancer Registry) | pre-formed qeustionnaire | Nitrates Quartiles | derived from vegetables (91.9%)/based on foods tables in Finland and other countries in northern Europe | Q1 | 1.0 (Referent) | Age, sex, municipality, smoking and energy intake |
| Q2 | 1.01 (0.56–1.84) | ||||||||
| Q3 | 0.52 (0.25–1.08) | ||||||||
| Q4 | 0.56 (0.27–1.18) | ||||||||
| Nitrites Quartiles | derived mainly from cured meats and sausages (94.2%)/based on foods tables in Finland and other countries in northern Europe | Q1 | 1.0 (Referent) | ||||||
| Q2 | 1.10 (0.58–2.11) | ||||||||
| Q3 | 1.88 (1.01–3.49) | ||||||||
| Q4 | 0.71 (0.28–1.78) | ||||||||
| NDMA Quartiles | derived from smoked and salted fish (51.9%), cured meats and susages(48.1%)/based on foods tables in Finland and other countries in northern Europe | Q1 | 1.0 (Referent) | ||||||
| Q2 | 1.03 (0.55–1.95) | ||||||||
| Q3 | 0.78 (0.39–1.56) | ||||||||
| Q4 | 0.75 (0.37–1.51) | ||||||||
| Jakszyn, 2006 [8], European | 153,447 men and 368,010 women | 6.6 | 314 (mean: 59.2 years, SD: 7.48/confirmed by a panel of pathologists) | country-specific validated questionnaires | NDMA Tertiles | matched food items on the country-specific questionnaires with a food database of potential carcinogens/based on country-specific values | T1 T2 T3 | 1.0 (Referent) | Full cohort analysis: stratified center and age. Sex, height, weight, education level, tobacco smoking, cigarette smoking intensity, work and leisure physical activity, citrus and non-citrus fruits intake, vegetables intake, energy intake and nitrites |
| 0.87 (0.64–1.20) | |||||||||
| 0.99 (0.69–1.41) | |||||||||
| Cardia | |||||||||
| 1.0 (Referent) | |||||||||
| 0.74 (0.41–1.34) | |||||||||
| 0.68 (0.34–1.37) | |||||||||
| Non-cardia | |||||||||
| 1.0 (Referent) | |||||||||
| 1.04 (0.66–1.63) | |||||||||
| 1.09 (0.65–1.81) | |||||||||
| Larsson, 2006 [18], Sweden | 61,433 women | 18 | 156 (NA/through linkage of the study population with the national and regional Swedish Cancer registers) | 67-item FFQ (before 1997) 97-item FFQ (after 1997) | NDMA μg/day | estimated by matching questionnaire food items/based on foods tables on the Swedish market | <0.041 | 1.0 (Referent) | Age, education, body mass index, intakes of total energy, alcohol, fruits and vegetables |
| 0.041–0.078 | 1.03 (0.61–1.77) | ||||||||
| 0.079–0.120 | 1.66 (1.00–2.75) | ||||||||
| 0.121–0.193 | 1.60 (0.93–2.76) | ||||||||
| ≥0.194 | 1.96 (1.08–3.58) | ||||||||
| Cross, 2011 [19], USA | 295,305 men and 199,674 women | 10 | 532 (NA/through probabilistic linkage with state cancer registries) | 124-item FFQ | Nitrates μg/1000kcals | derived from processed meats/using a database of measured values from ten types of processed meats in US | 24.2 66.9 112.7 174.5 298.0 | Cardia | Age, education, sex, BMI, ethnicity, smoking, alcohol drinking, physical activity daily intake of fruits , vegetables, saturated fat and calories |
| 1.0 (Referent) | |||||||||
| 1.17 (0.77–1.77) | |||||||||
| 0.64 (0.40–1.02) | |||||||||
| 0.94 (0.61–1.45) | |||||||||
| 0.81 (0.52–1.25) | |||||||||
| Non-cardia | |||||||||
| 1.0 (Referent) | |||||||||
| 0.90 (0.60–1.35) | |||||||||
| 0.89 (0.59–1.33) | |||||||||
| 0.91 (0.61–1.37) | |||||||||
| 1.04 (0.69–1.55) | |||||||||
| Nitrites μg/1000kcals | processed meats/using a database of measured values from ten types of processed meats in US | 12.1 34.6 61.4 102.9 199.2 | Cardia | ||||||
| 1.0 (Referent) | |||||||||
| 0.72 (0.47–1.11) | |||||||||
| 0.88 (0.58–1.32) | |||||||||
| 0.87 (0.58–1.31) | |||||||||
| 0.71 (0.47–1.08) | |||||||||
| Non-cardia | |||||||||
| 1.0 (Referent) | |||||||||
| 0.77 (0.51–1.15) | |||||||||
| 0.79 (0.53–1.18) | |||||||||
| 1.04 (0.71–1.52) | |||||||||
| 0.93 (0.63–1.37) | |||||||||
| Keszei, 2013 [20], the Netherlands | 120,852 men and women | 16.3 | 663 (Women, Cardia, mean: 62.6 years, SD: 4.2; Women, Non-cardia, mean: 62.6 years, SD: 4.3; Men, Cardia, mean: 61.4 years, SD: 4.1; Men, Non-cardia, mean: 62.4 years, SD: 4.0/through linkage to the | questionnaire including 150 items on food | Nitrates Tertiles (mg/day) | derived from summing dietary intake (considered loss during preparation) and nitrate from water/based on databank of the State Institute for Quality Control of Agricultural Products | T1: women 66.4; men, 68.1 T2: women, 98.5; men 100.8 T3: women 142.7; men 146.2 | Women, Cardia | Age, smoking status, years of cigarette smoking, number of cigarettes smoked per day, total energy intake, BMI, alcoholic intake, vegetable intake, fruit intake, level of education, and nonoccupational physical activity |
| 1.0 (Referent) | |||||||||
| 1.01 (0.30–3.42) | |||||||||
| 1.61 (0.32–8.06) | |||||||||
| Women, Non-cardia | |||||||||
| 1.0 (Referent) | |||||||||
| 0.73 (0.47–1.11) | |||||||||
| 0.78 (0.44–1.39) | |||||||||
| Men, Cardia | |||||||||
| 1.0 (Referent) | |||||||||
| 1.06 (0.68–1.65) | |||||||||
| 1.01 (0.57–1.77) | |||||||||
| Men, Non-cardia | |||||||||
| 1.0 (Referent) | |||||||||
| 1.23 (0.90–1.68) | |||||||||
| 1.05 (0.70–1.59) | |||||||||
| Netherlands Cancer Registry and the Nationwide Network and Registry of Histo- and Cytopathology in the Netherlands) | Nitrites Tertiles (mg/day) | processed meat/based on analyses conducted by the National Public Health Institute in 1984 | T1: women, 0.02; men 0.03 T2: women, 0.08; men 0.12 T3: women, 0.20; men 0.28 | Women, Cardia | Age, smoking status, years of cigarette smoking, number of cigarettes smoked per day, total energy intake, BMI, alcoholic intake, vegetable intake, fruit intake, level of education, and nonoccupational physical activity | ||||
| 1.0 (Referent) | |||||||||
| 0.97 (0.36–2.58) | |||||||||
| 0.62 (0.20–1.90) | |||||||||
| Women, Non-cardia | |||||||||
| 1.0 (Referent) | |||||||||
| 0.94 (0.62–1.41) | |||||||||
| 1.08 (0.71–1.63) | |||||||||
| Men, Cardia | |||||||||
| 1.0 (Referent) | |||||||||
| 0.80 (0.51–1.27) | |||||||||
| 1.18 (0.75–1.86) | |||||||||
| Men, Non-cardia | |||||||||
| 1.0 (Referent) | |||||||||
| 1.10 (0.80–1.50) | |||||||||
| 1.23 (0.89–1.70) | |||||||||
| NDMA Tertiles (μg/day) | N-nitrosodimethylamine values in food items together with the frequency of consumption and serving sizes/N-nitrosodimethylamine value for food items used in the Netherlands Cohort Study | T1: women, 0.03; men 0.04 T2: women, 0.04; men 0.08 T3: women, 0.07; men 0.25 | Women, Cardia | Age, smoking status, years of cigarette smoking, number of cigarettes smoked per day, total energy intake, BMI, alcoholic beverages not including beer, vegetable intake, fruit intake, level of education, and nonoccupational physical activity. | |||||
| 1.0 (Referent) | |||||||||
| 0.97 (0.34–2.78) | |||||||||
| 1.02 (0.33–3.14) | |||||||||
| Women, Non-cardia | |||||||||
| 1.0 (Referent) | |||||||||
| 1.37 (0.92–2.02) | |||||||||
| 0.90 (0.58–1.42) | |||||||||
| Men, Cardia | |||||||||
| 1.0 (Referent) | |||||||||
| 1.00 (0.64–1.56) | |||||||||
| 0.94 (0.59–1.49) | |||||||||
| Men, Non-cardia | |||||||||
| 1.0 (Referent) | |||||||||
| 1.09 (0.79–1.50) | |||||||||
| 1.31 (0.95–1.81) |
| First Author, Year, Location | No. of Cases (Age/Definition) | No. and Type of Controls | Study Period | Intake Assessment | Analytical Category | Definition/Nutrient Content Values | Consumption Categories | Adjusted OR (95% CI) | Adjusted Variables |
|---|---|---|---|---|---|---|---|---|---|
| Risch, 1985 [21], Canada | 246 (35–79 years/by province-wide tumor registries, and surgical, pathology, and medical records) | 246 population-based | 1979–1982 | diet frequent questionnaire | Nitrates mg/day | estimated by matching FFQ food items/food composition tables were modified and extended to Canadian items | NA | 1.0 (Referent) | NA |
| 0.66 (0.54–0.81) | |||||||||
| Nitrites mg/day | 1.0 (Referent) | ||||||||
| 1.71 (1.24–2.37) | |||||||||
| Buiatti, 1990 [22], Italy | 1016 (≤75 years/histologic confirmation) | 1159 population-based | 1985–1987 | 146-item questionnaire | Nitrates mg/day | estimated by matching questionnaire food items/using several Italian sources | 53 | 1.0 (Referent) | Non-dietary variables and kilocalories |
| 81 | 0.90 (0.70–1.10) | ||||||||
| 103 | 0.90 (0.60–1.10) | ||||||||
| 130 | 0.70 (0.50–0.90) | ||||||||
| 193 | 0.90 (0.70–1.20) | ||||||||
| Nitrites mg/day | 2.1 | 1.0 (Referent) | |||||||
| 2.8 | 1.00 (0.80–1.40) | ||||||||
| 3.4 | 1.20 (0.90–1.70) | ||||||||
| 4.1 | 1.40 (1.00–2.00) | ||||||||
| 5.9 | 1.90 (1.30–2.70) | ||||||||
| Boeing, 1991 [23], Germany | 143 (32–80 years/histologically confirmed) | 579 hospital-based | 1985–1988 | 74-item standardized questionnaire | Nitrates Quintiles | estimated by matching questionnaire food items/German Federal Agency of Nutrition | Q1 | 1.0 (Referent) | Age, sex, and hospital |
| Q2 | 0.93 (0.53–1.64) | ||||||||
| Q3 | 0.61 (0.32–1.19) | ||||||||
| Q4 | 0.61 (0.30–1.27) | ||||||||
| Q5 | 1.26 (0.59–2.70) | ||||||||
| Hansson, 1994 [24], Sweden | 338 (40–79 years/histologically confirmed) | 679 population-based | 1989–1992 | 45-item FFQ | Nitrates mg/day | estimated by matching FFQ food items (considered loss in cooked dishes)/based on data from several Swedish sources | 23 | 1.0 (Referent) | Age, gender, ascorbic acid, β-carotene. and α-tocopherol |
| 34 | 0.85 (0.57–1.25) | ||||||||
| 45 | 0.99 (0.65–1.52) | ||||||||
| 69 | 0.97 (0.60–1.59) | ||||||||
| La Vecchia, 1994 [25], Italy | 723 (19–74 years/histologically confirmed) | 2024 hospital-based | 1985–1992 | 29-item standard questionnaire | Nitrates mg/die | estimated by matching questionnaire food items/based on Italian tables of food composition | 62.95 | 1.0 (Referent) | Age, sex, education, family history of gastric cancer, body mass index, and total energy intake |
| 80.70 | 0.64 (0.49–0.83) | ||||||||
| 96.33 | 0.50 (0.38–0.67) | ||||||||
| 116.88 | 0.52 (0.39–0.70) | ||||||||
| >116.88 | 0.43 (0.32–0.59) | ||||||||
| Nitrites mg/die | 1.91 | 1.0 (Referent) | |||||||
| 2.41 | 0.98 (0.72–1.33) | ||||||||
| 2.94 | 0.99 (0.72–1.36) | ||||||||
| 3.64 | 1.15 (0.84–1.59) | ||||||||
| >3.64 | 1.35 (0.96–1.88) | ||||||||
| Pobel, 1995 [26], France | 92 (mean: 66.6 years, SD: 10.4/histologically confirmed) | 128 hospital-based | 1985–1988 | diet history questionnaire | Nitrates Tertiles | derived from dairy products, meat and eggs, fish, flour products, fruit, vegetables, beverages/using a composition table based on literature data | T1 | 1.0 (Referent) | Age, sex, occupation and total calorie intake |
| T2 | 0.49 (0.24–1.01) | ||||||||
| T3 | 0.76 (0.38–1.50) | ||||||||
| Nitrites Tertiles | T1 | 1.0 (Referent) | |||||||
| T2 | 0.83 (0.41–1.67) | ||||||||
| T3 | 0.88 (0.44–1.79) | ||||||||
| NDMA Tertiles | T1 | 1.0 (Referent) | |||||||
| T2 | 4.13 (0.93–18.27) | ||||||||
| T3 | 7.00 (1.85–26.46) | ||||||||
| La Vecchia, 1995 [27], Italy | 746 (19–74 years/histologically confirmed) | 2053 hospital-based | 1985–1993 | 29-item structured questionnaire | NDMA μg/day | estimated by matching questionnaire food items/based Italian survey on selected foods or from other published data | ≤0.13 | 1.0 (Referent) | Age, sex, education, family history of gastric cancer, combined food score index, intake of β-carotene, vitamin C, total calories, nitrite and nitrate intake |
| 0.13–0.19 | 1.11 (0.90–1.40) | ||||||||
| >0.19 | 1.37 (1.10–1.70) | ||||||||
| De Stefani, 1998 [28], Uruguay | 340 (25–84 years/microscopically confirmed) | 698 hospital-based | 1993–1996 | FFQ | NDMA μg/day | derived from fried, broiled, or salted meat/according to previous literature data | ≤0.14 | 1.0 (Referent) | Age, sex, residence, urban/rural status, tobacco duration, total alcohol consumption |
| 0.15–0.18 | 2.07 (1.36–3.18) | ||||||||
| 0.19–0.26 | 3.23 (2.13–4.89) | ||||||||
| ≥0.27 | 3.62 (2.38–5.51) | ||||||||
| Palli, 2001 [29], Italy | 382 (<50 years, 30 cases; 50–64 years, 130 cases; > 64 years, 222 cases/histologically confirmed) | 561 population-based | 1985–1987 | 181-item FFQ | Nitrates mg/day | estimated by matching FFQ food items/based on Italian food composition tables estimated by matching FFQ food items/based on Italian food composition tables | 62.6 | 1.0 (Referent) | Age, sex, social class, family history of gastric cancer, area of rural residence, BMI, total energy and the residuals of each nutrient of interest. |
| 93.2 | 0.70 (0.50–1.00) | ||||||||
| 132.9 | 0.60 (0.40–0.90) | ||||||||
| Nitrites mg/day | 2.5 | 1.0 (Referent) | |||||||
| 3.5 | 1.40 (1.00–2.00) | ||||||||
| 5.4 | 1.40 (1.00–2.00) | ||||||||
| NDMA | 0.12 | 1.0 (Referent) | |||||||
| 0.20 | 1.10 (0.80–1.60) | ||||||||
| 0.33 | 1.10 (0.80–1.50) | ||||||||
| Engel, 2003 [30], USA | 629 (30–79 years/histologic reports from surgery, radiology, and endoscopy) | 695 population-based | 1993–1995 | FFQ | Nitrites mg/day | estimated by matching FFQ food items/based on a nitrite database used in North America | Men, Women 1.7–5.8, 1.9–5.3 5.9–7.5, 5.4–6.9 7.6–9.9, 7.0–9.1 10–39.2, 9.2–31.2 | 1.0 (Referent) | NA |
| 1.50 (1.00–2.40) | |||||||||
| 1.80 (1.10–3.00) | |||||||||
| 2.50 (1.40–4.30) | |||||||||
| López-Carrillo, 2004 [31], Mexico | 211 (≥20 years/histologically confirmed) | 454 hospital-based | 1994–1996 | semi-quantitative questionnaire | Nitrites portions/day | derived from specific food consumption that is typical of each geographical region | 0–0.11 | 1.0 (Referent) | Age, gender, residence, energy change in socioeconomic level, years of education, Hp/CagA status, and ascorbic acid |
| 0.12–0.26 | 0.95 (0.62–1.46) | ||||||||
| 0.27–2.25 | 1.24 (0.81–1.90) | ||||||||
| Kim, 2007 [32], Korea | 136 (mean: 57.2 years, SD: 13.9/histologically confirmed) | 136 hospital-based | 1997–1998 | 84-item semiquantitative FFQ | Nitrates mg/day | estimated by matching FFQ food items/base on National Nutrition Survey Report in Koera | 240 | 1.0 (Referent) | Age, sex, socioeconomic status, family history, refrigerator use, H. pylori infection, and foods |
| 458 | 1.13 (0.54–2.36) | ||||||||
| 811 | 1.13 (0.42–3.06) | ||||||||
| Ward, 2008 [33], USA | 79 (≥21 years/histologically confirmed) | 321 population-based | 1988–1994 | short Health Habits and History Questionnaire | Nitrates mg/day | derived from vegetables, processed meats, and water/based on previous published literature | <16.9 | 1.0 (Referent) | Year of birth, gender, education, smoking, alcohol, total calories, vitamin C, fiber, and carbohydrate |
| 16.9–26.2 | 1.20 (0.60–2.50) | ||||||||
| 26.2–38.8 | 1.40 (0.70–2.90) | ||||||||
| >38.8 | 1.60 (0.70–3.60) | ||||||||
| Nitrites mg/day | derived from breads, cereals, processed meats/based on previous published literature | <0.36 | 1.0 (Referent) | ||||||
| 0.36–0.52 | 1.10 (0.40–2.70) | ||||||||
| 0.52–0.67 | 0.80 (0.30–2.20) | ||||||||
| >0.67 | 1.10 (0.30–3.40) | ||||||||
| Hernández-Ramírez, 2009 [34], Mexico | 228 (median: 59 years, P25-P75: 49–67 years/histologically confirmed) | 467 population-based | 2004–2005 | 127-item FFQ | Nitrates mg/day | estimated by matching FFQ food items/based on several published literature | ≤90.4 | 1.0 (Referent) | Energy, age, gender, Hp/CagA status, schooling and consumptions of salt, chili, and alcohol |
| >90.4–141.7 | 0.93 (0.62–1.39) | ||||||||
| >141.7 | 0.61 (0.39–0.96) | ||||||||
| Nitrites mg/day | ≤1.0 | 1.0 (Referent) | |||||||
| >1.0–1.2 | 1.07 (0.69–1.65) | ||||||||
| >1.2 | 1.52 (0.99–2.34) | ||||||||
| Navarro Silvera, 2011 [35], USA | 255 cardia, 352 non-cardia (30–79 years/pathology reports) | 687 population-based | 1993–1995 | 104-item FFQ | Nitrites Quartiles | estimated by matching FFQ food items/based on Nutrition Coding Center Nutrient Data system | Q1 Q2 Q3 Q4 | Cardia | Gender, age, site, race, income, education, proxy status, and energy intake |
| 1.0 (Referent) | |||||||||
| 1.13 (0.70–1.82) | |||||||||
| 1.75 (1.03–2.96) | |||||||||
| 1.82 (0.91–3.65) | |||||||||
| Non-Cardia | |||||||||
| 1.0 (Referent) | |||||||||
| 1.89 (1.23–2.92) | |||||||||
| 2.03 (1.23–3.35) | |||||||||
| 2.40 (1.25–4.62) |

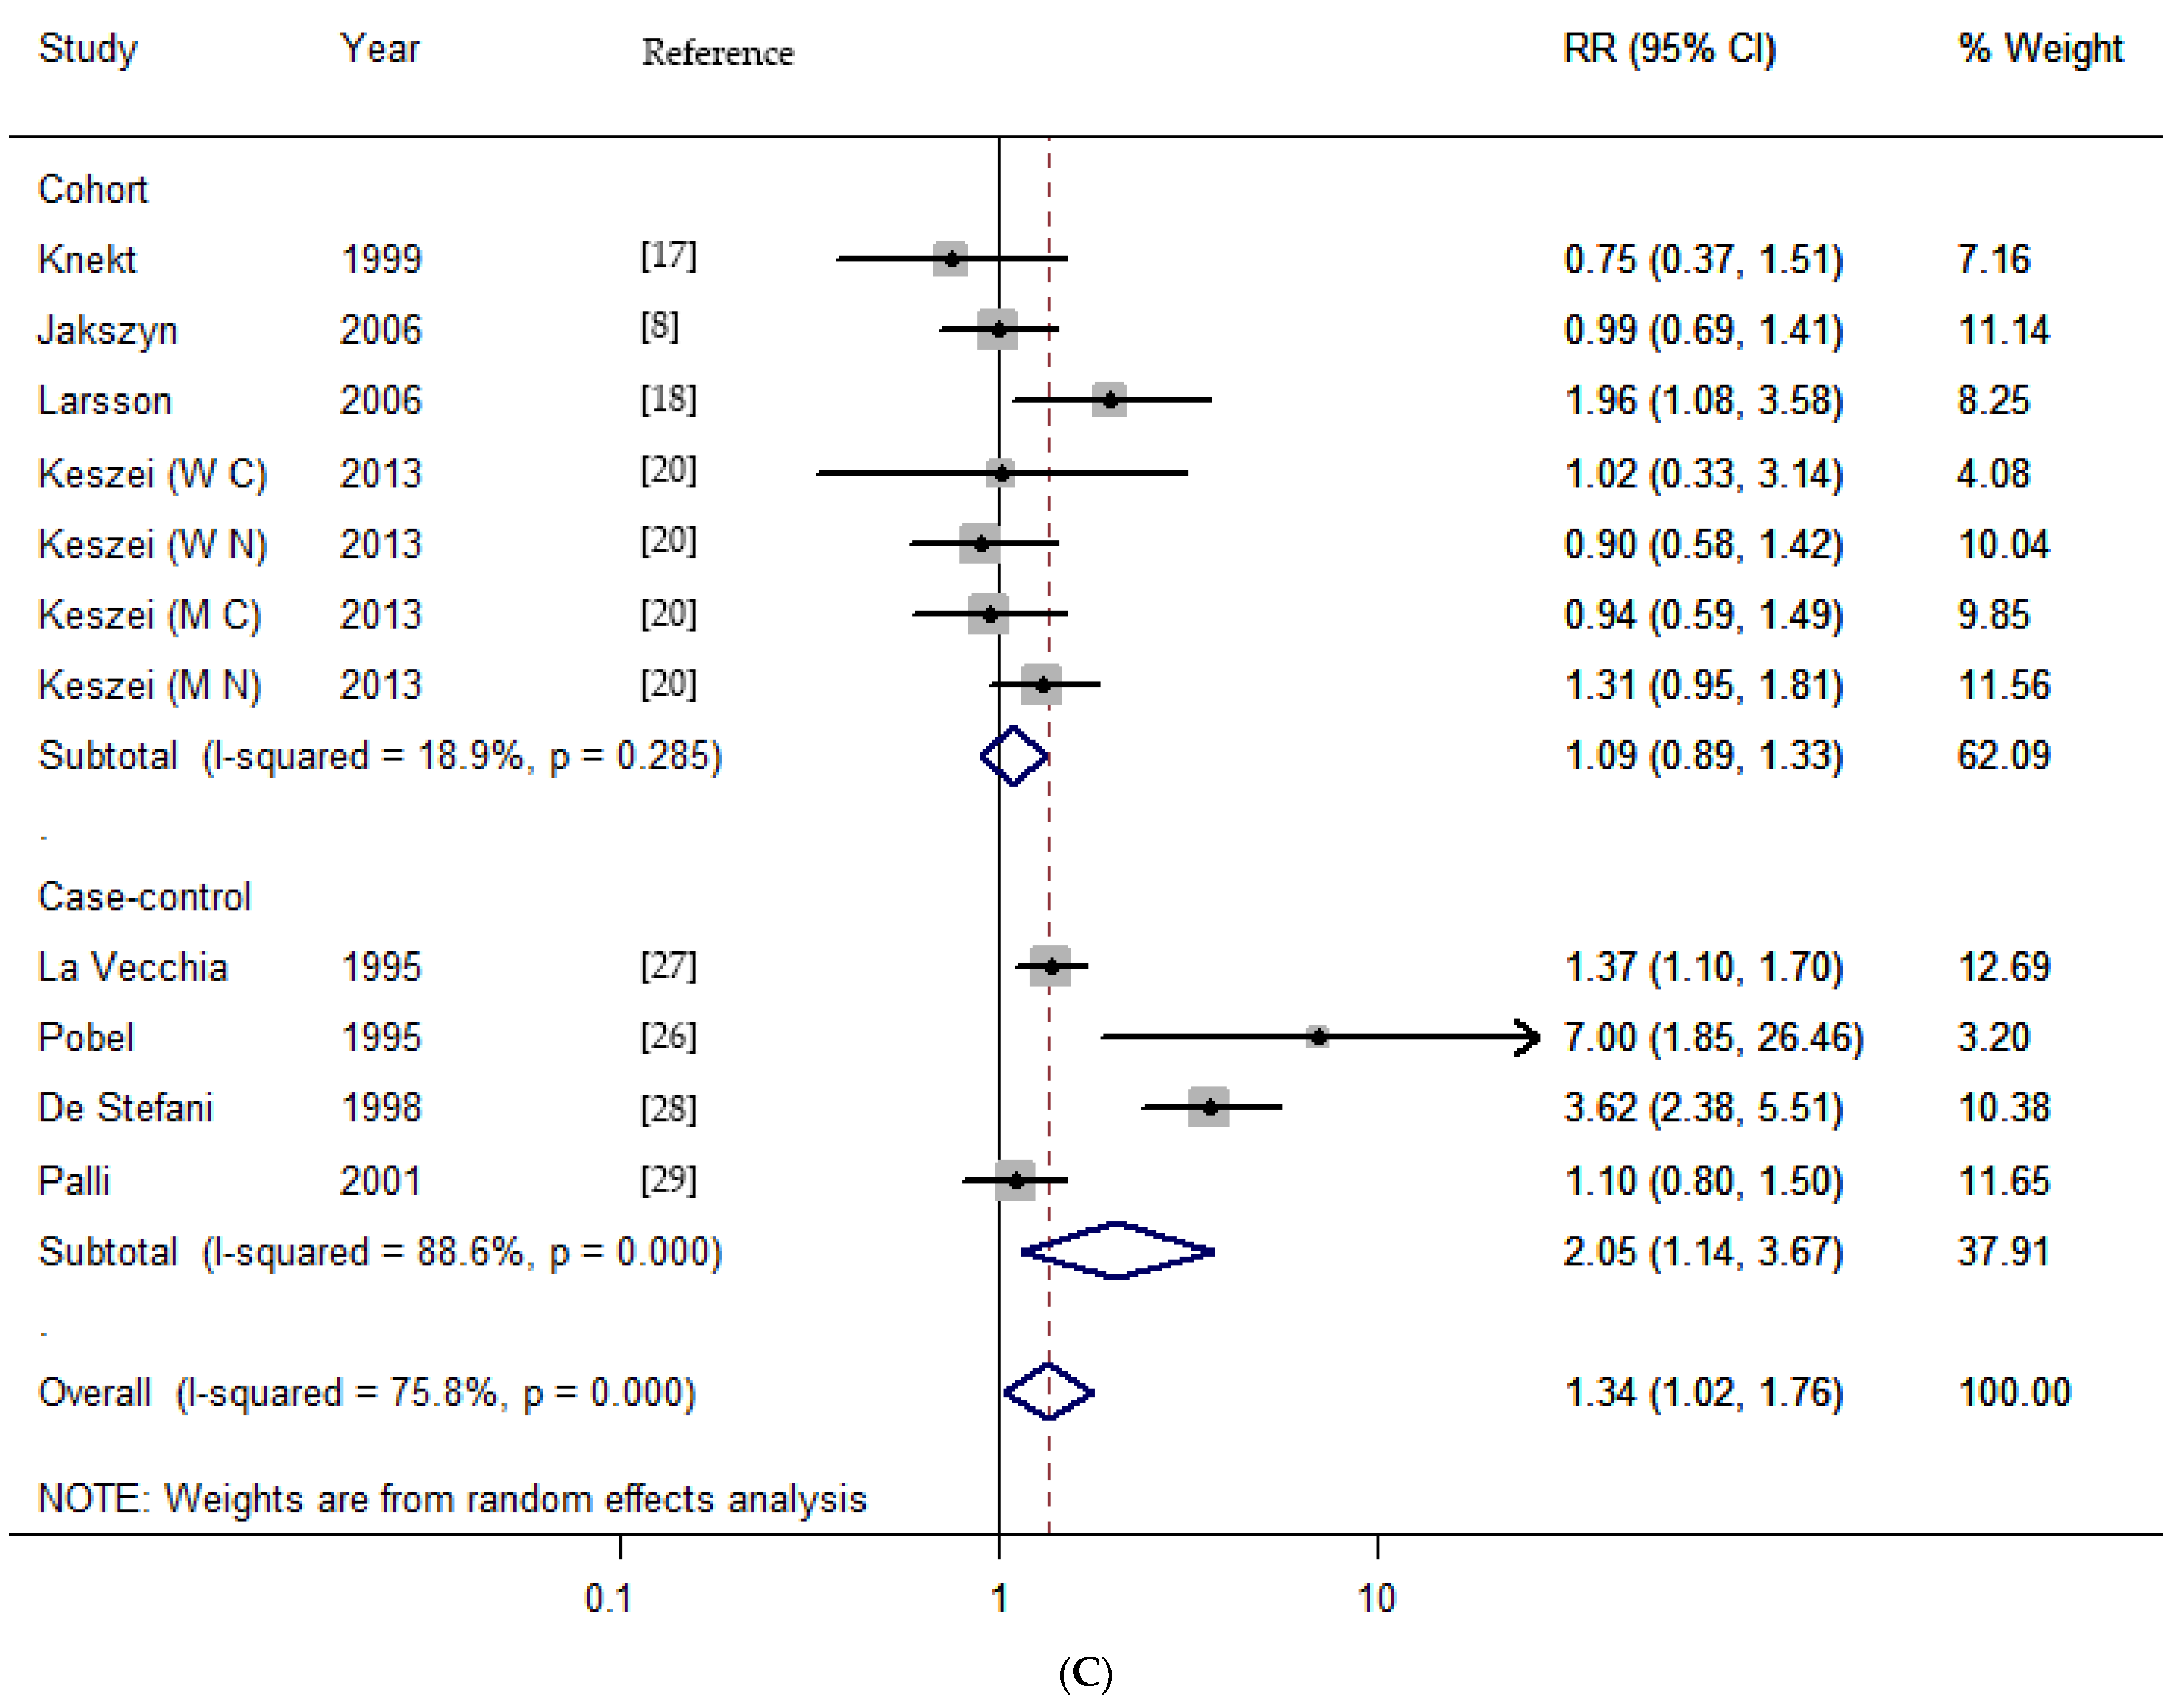
3.2. Dietary Nitrates, Nitrites, and NDMA Intake and the Risk of Gastric Cancer

| Variable | Nitrates | Nitrites | NDMA | ||||||||||||
|---|---|---|---|---|---|---|---|---|---|---|---|---|---|---|---|
| n a | RR (95% CI) | Heterogeneity Test | n a | RR (95% CI) | Heterogeneity Test | n a | RR (95% CI) | Heterogeneity Test | |||||||
| Q | p b | I2% | Q | p b | I2% | Q | p b | I2% | |||||||
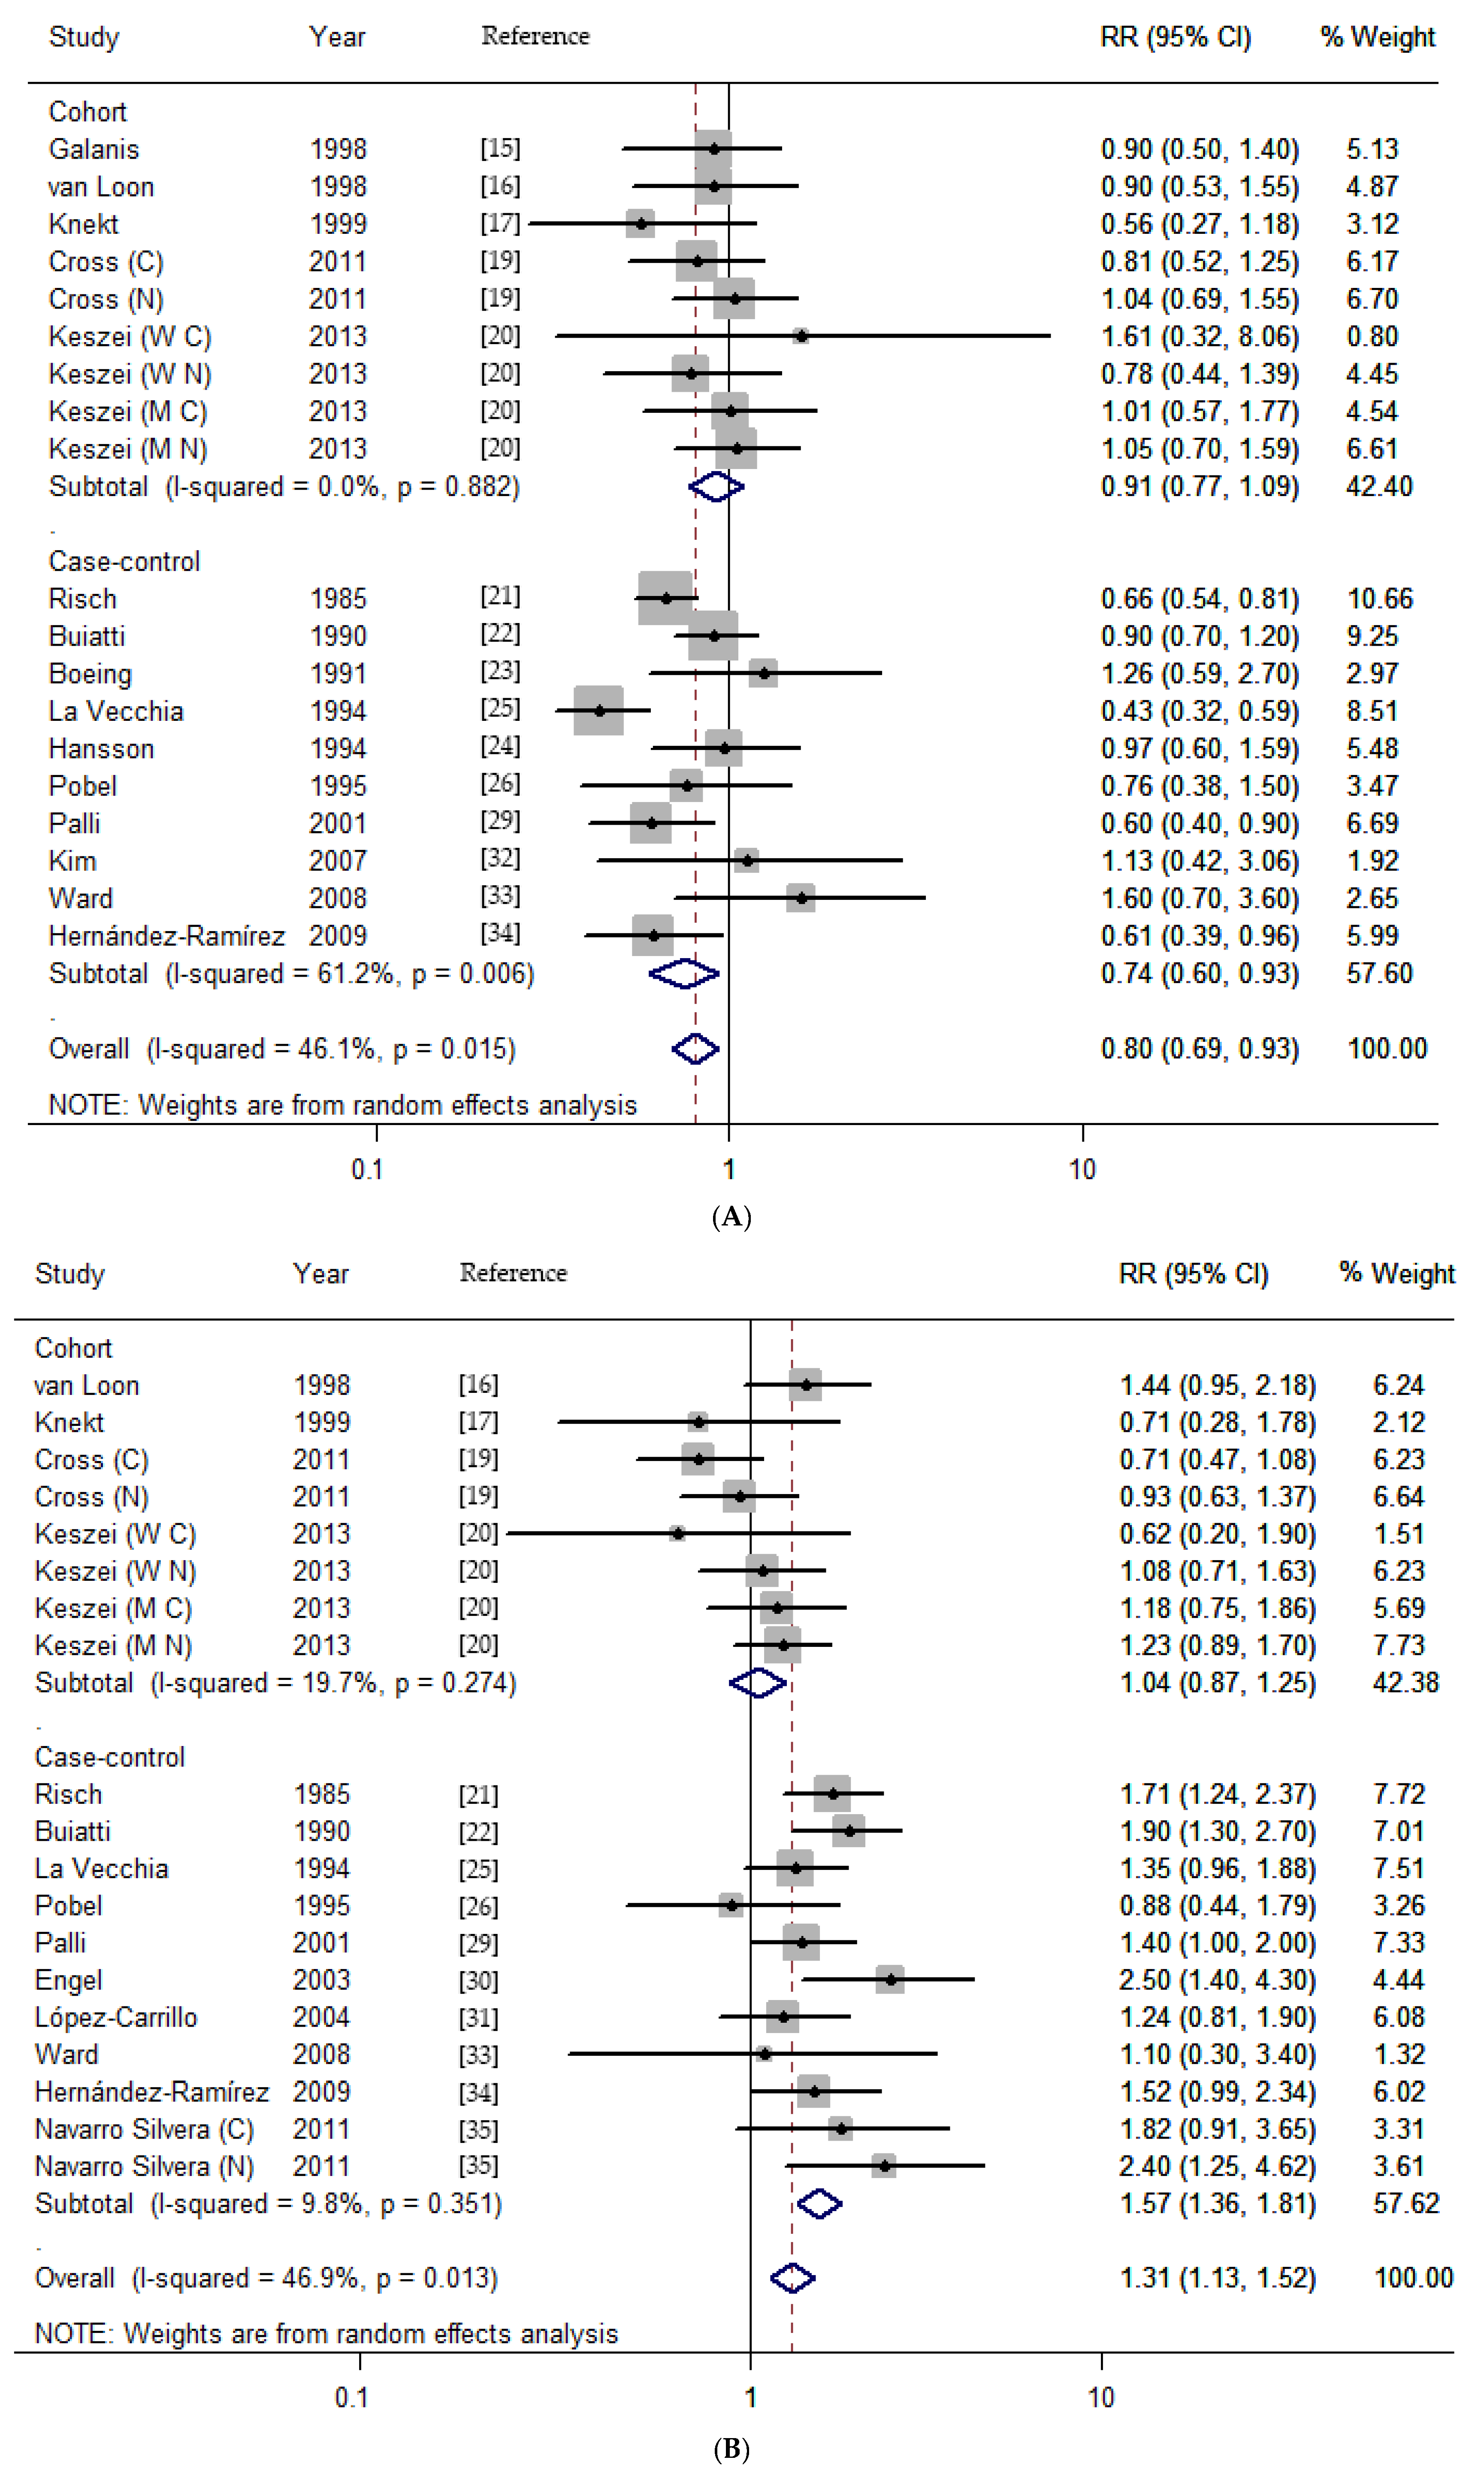
| Total | 19 | 0.80 (0.69–0.93) | 31.39 | 0.015 | 46.1 | 19 | 1.31 (1.13–1.52) | 33.87 | 0.013 | 46.9 | 11 | 1.34 (1.02–1.76) | 41.35 | <0.001 | 75.8 |
| Study design | |||||||||||||||
| Cohort | 9 | 0.91 (0.77–1.09) | 3.71 | 0.882 | 0.0 | 8 | 1.04 (0.87–1.25) | 8.71 | 0.274 | 19.7 | 7 | 1.09 (0.89–1.33) | 7.4 | 0.258 | 18.9 |
| Case-control | |||||||||||||||
| Population based | 6 | 0.76 (0.62–0.94) | 9.58 | 0.088 | 47.8 | 8 | 1.72 (1.47–2.02) | 5.21 | 0.634 | 0.0 | 1 | 1.10 (0.80–1.50) | NA | NA | NA |
| Hospital based | 4 | 0.75 (0.42–1.35) | 9.91 | 0.019 | 69.7 | 3 | 1.25 (1.09–1.44) | 1.16 | 0.559 | 0.0 | 3 | 2.81 (1.16–6.80) | 20.54 | <0.001 | 90.3 |
| Geographic area | |||||||||||||||
| Europe | 12 | 0.79 (0.64–0.98) | 24.03 | 0.013 | 54.2 | 10 | 1.30 (1.12–1.50) | 10.14 | 0.339 | 11.3 | 10 | 1.18 (0.97–1.43) | 16.89 | 0.050 | 46.7 |
| North America | 5 | 0.80 (0.62–1.04) | 8.22 | 0.084 | 51.3 | 9 | 1.41 (1.06–1.87) | 23.62 | 0.003 | 66.1 | 0 | NA | NA | NA | NA |
| Other | 2 | 0.94 (0.60–1.49) | 0.16 | 0.690 | 0.0 | 0 | NA | NA | NA | NA | 1 | 3.62 (2.38–5.51) | NA | NA | NA |
| Cancer type | |||||||||||||||
| cardia | 3 | 0.90 (0.64–1.27) | 0.88 | 0.644 | 0.0 | 4 | 1.01 (0.65–1.58) | 6.64 | 0.084 | 54.8 | 3 | 0.87 (0.60–1.25) | 0.66 | 0.718 | 0.0 |
| non-cardia | 3 | 0.99 (0.76–1.28) | 0.79 | 0.672 | 0.0 | 4 | 1.22 (0.90–1.65) | 6.21 | 0.102 | 51.7 | 3 | 1.14 (0.90–1.44) | 1.81 | 0.404 | 0.0 |
| Publication year | |||||||||||||||
| <2000 | 9 | 0.75 (0.60–0.93) | 19.56 | 0.012 | 59.1 | 6 | 1.46 (1.17–1.81) | 7.38 | 0.194 | 32.3 | 4 | 2.02 (0.96–4.24) | 25.62 | <0.001 | 88.3 |
| ≥2000 | 10 | 0.86 (0.72–1.03) | 10.59 | 0.305 | 15.0 | 13 | 1.26 (1.05–1.53) | 23.40 | 0.025 | 48.7 | 7 | 1.12 (0.95–1.31) | 6.22 | 0.399 | 3.6 |
| Sample size | |||||||||||||||
| <2000 | 8 | 0.76 (0.62–0.94) | 9.99 | 0.189 | 29.9 | 9 | 1.56 (1.31–1.87) | 9.26 | 0.321 | 13.6 | 3 | 2.69 (0.95–7.60) | 24.06 | <0.001 | 91.7 |
| ≥2000 | 11 | 0.82 (0.66–1.01) | 22.50 | 0.013 | 55.6 | 10 | 1.15 (0.95–1.40) | 17.85 | 0.037 | 49.6 | 8 | 1.16 (0.97–1.39) | 9.84 | 0.198 | 28.9 |
| Quality score | |||||||||||||||
| <7 stars | 7 | 0.70 (0.54–0.90) | 16.83 | 0.010 | 64.3 | 6 | 1.58 (1.11–1.49) | 7.76 | 0.170 | 35.6 | 2 | 2.47 (0.41–14.91) | 7.04 | 0.008 | 85.8 |
| ≥7 stars | 12 | 0.90 (0.77–1.04) | 8.59 | 0.660 | 0.0 | 13 | 1.18 (0.99–1.40) | 18.12 | 0.112 | 33.8 | 9 | 1.30 (0.97–1.75) | 34.01 | <0.001 | 76.5 |
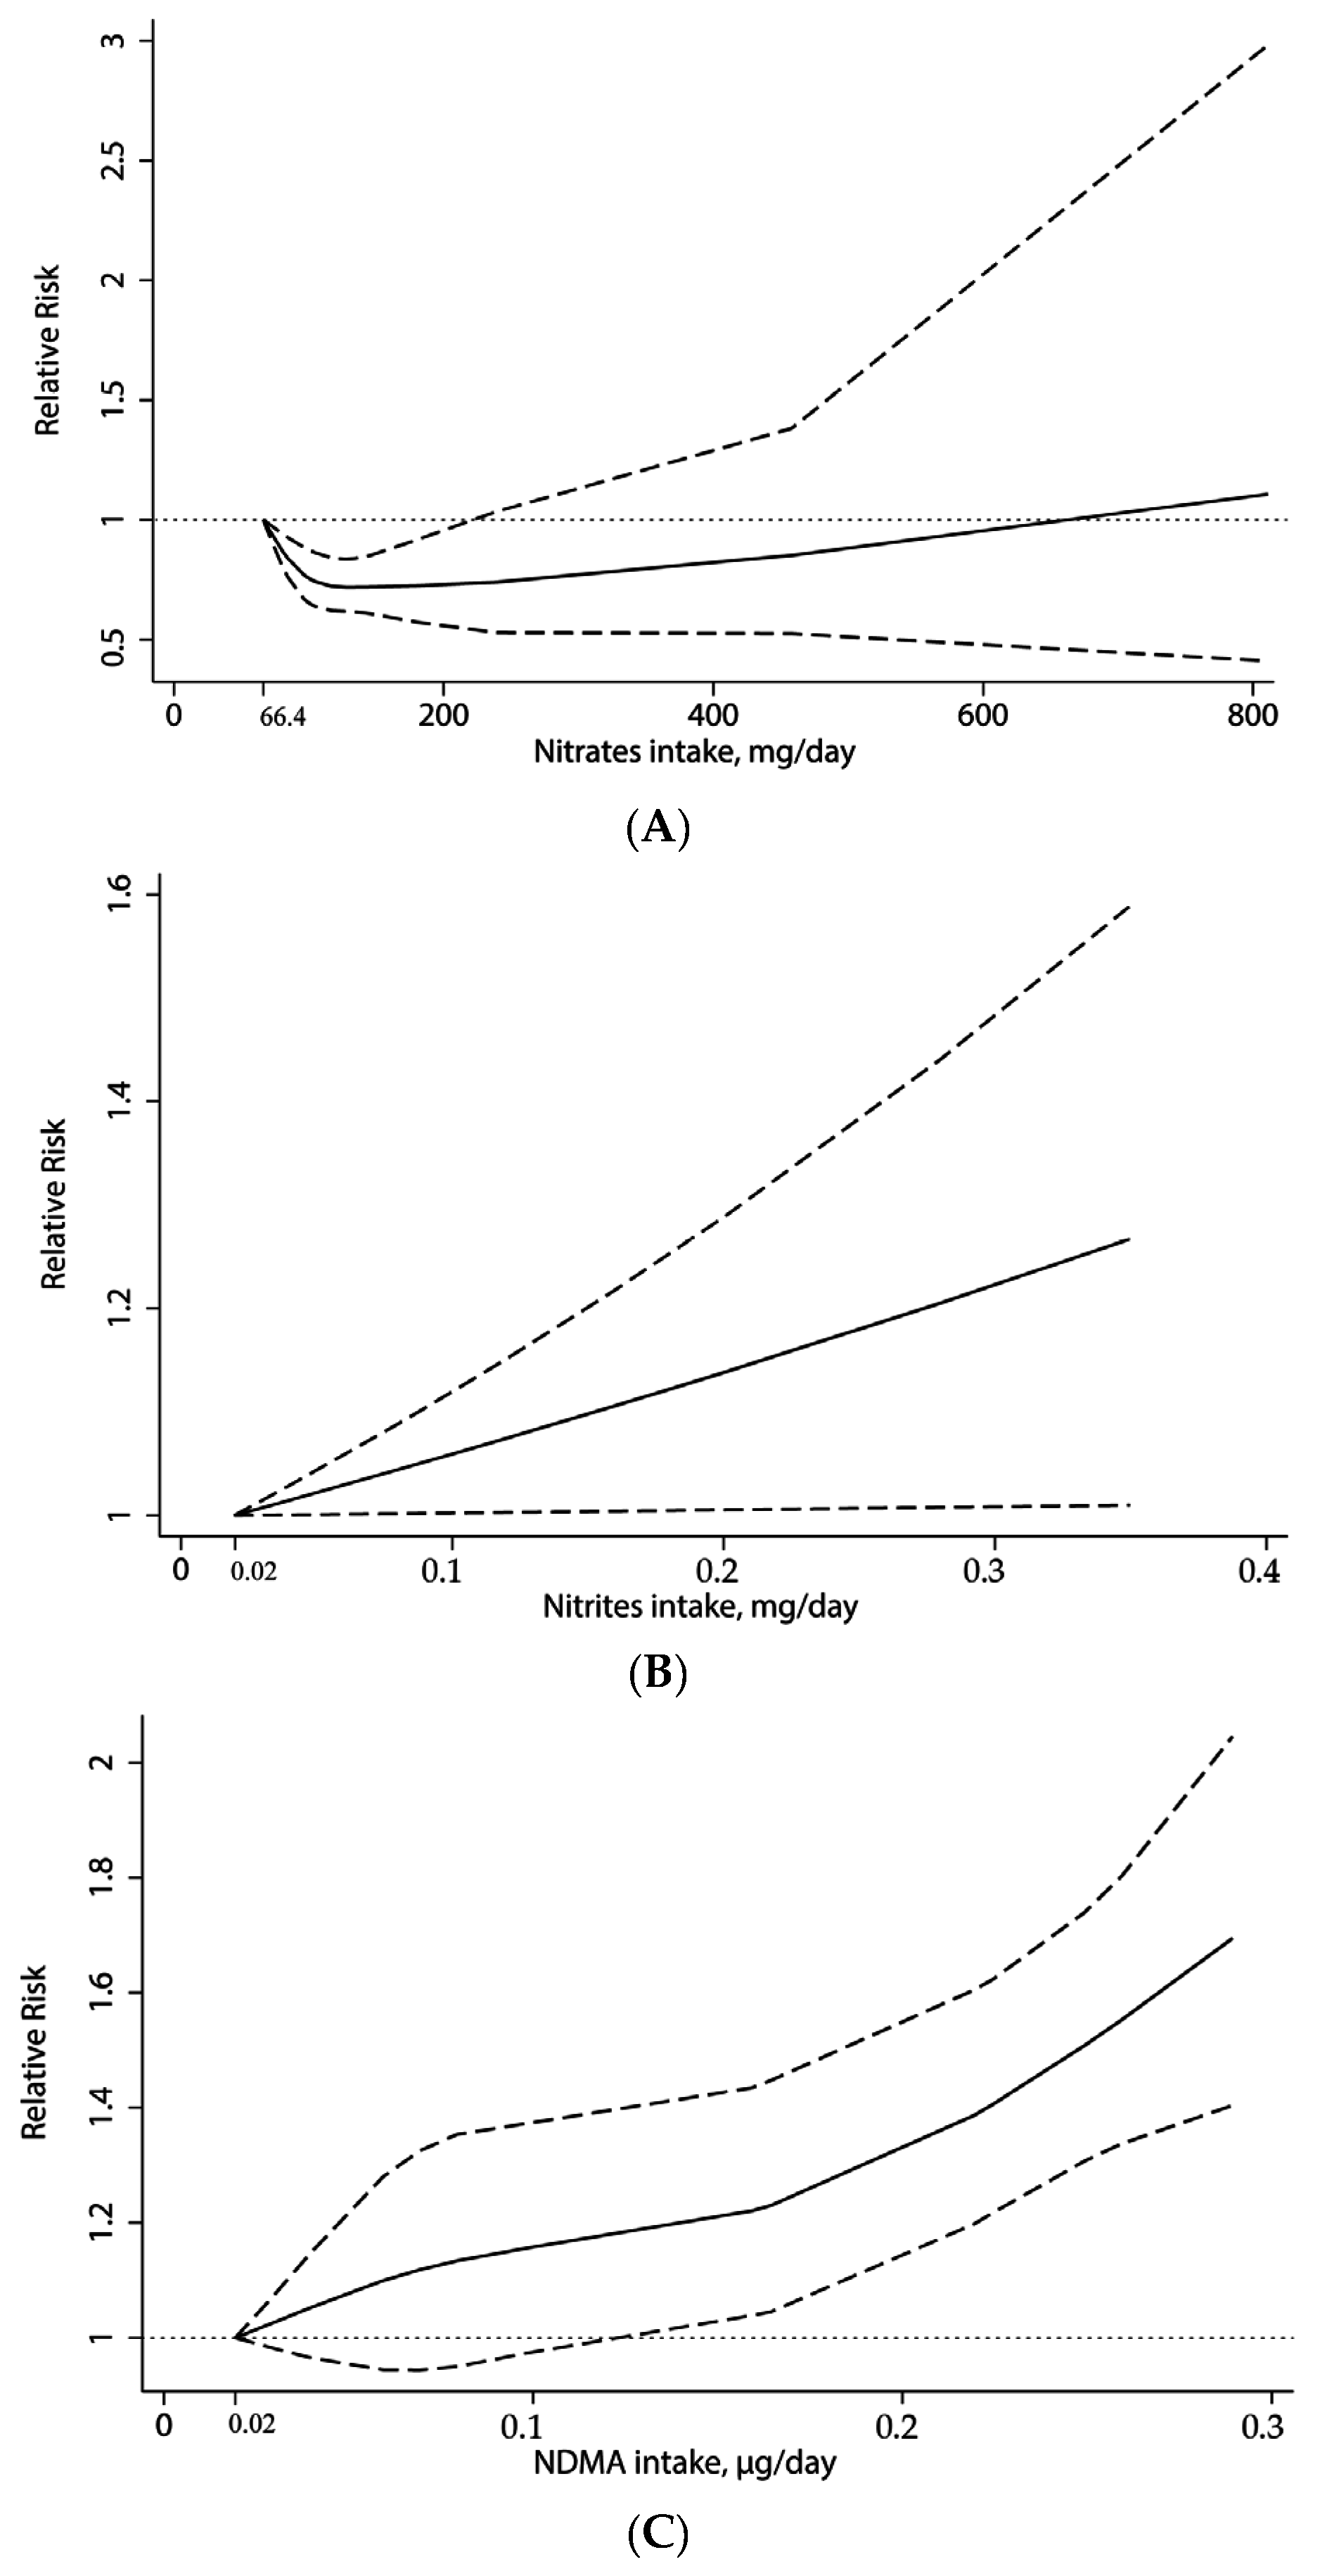
3.3. Dose-Response Analysis

3.4. Meta-Regression
| Variable | Nitrates | Nitrites | NDMA | ||||||
|---|---|---|---|---|---|---|---|---|---|
| Coefficient | p Value | 95% CI | Coefficient | p Value | 95% CI | Coefficient | p Value | 95% CI | |
| Study design | −0.154 | 0.184 | −0.390 to 0.082 | 0.406 | 0.011 | 0.106 to 0.705 | 0.200 | 0.363 | −0.286 to 0.686 |
| Geographic area | 0.023 | 0.846 | −0.225 to 0.271 | −0.030 | 0.831 | −0.326 to 0.265 | 0.912 | 0.057 | −0.035 to 1.860 |
| Publication year | 0.063 | 0.696 | −0.275 to 0.400 | −0.029 | 0.845 | −0.343 to 0.285 | 0.097 | 0.807 | −0.806 to 0.999 |
3.5. Sensitivity Analysis
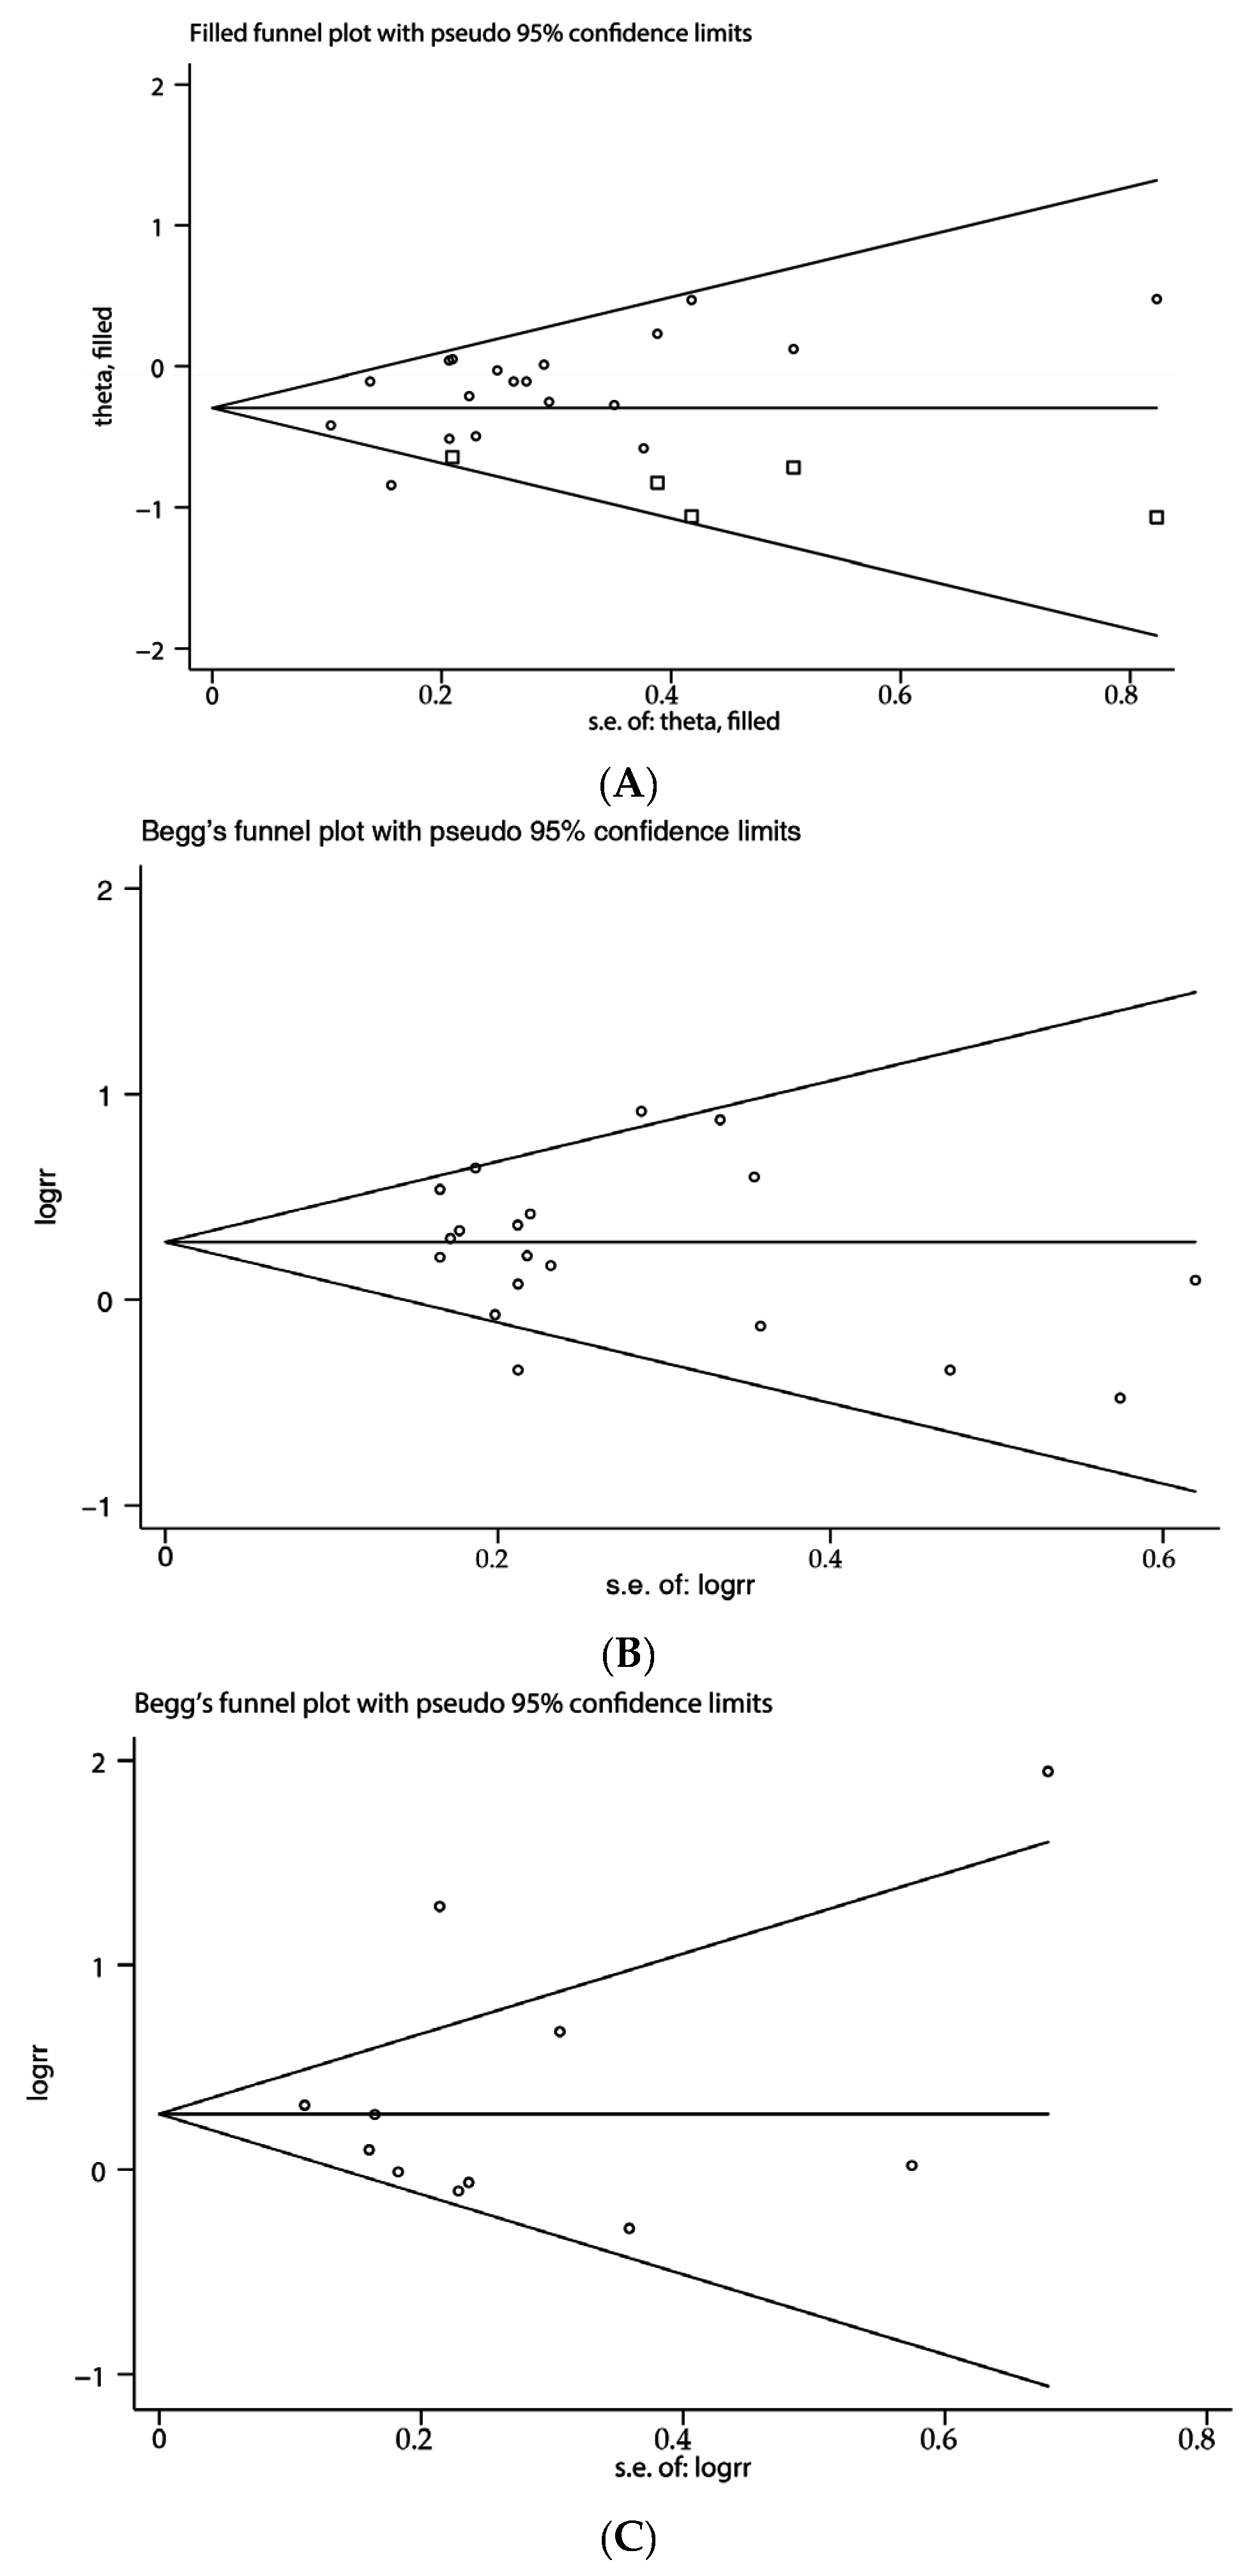
3.6. Publication Bias

4. Discussion
5. Conclusions
Supplementary Materials
Acknowledgments
Conflict of Interest
References
- Torre, L.A.; Bray, F.; Siegel, R.L.; Ferlay, J.; Lortet-Tieulent, J.; Jemal, A. Global cancer statistics, 2012. CA Cancer J. Clin. 2015, 65, 87–108. [Google Scholar] [CrossRef] [PubMed]
- Abnet, C.C.; Corley, D.A.; Freedman, N.D.; Kamangar, F. Diet and upper gastrointestinal malignancies. Gastroenterology 2015, 148, 1234–1243. [Google Scholar] [CrossRef] [PubMed]
- Petrick, J.L.; Steck, S.E.; Bradshaw, P.T.; Trivers, K.F.; Abrahamson, P.E.; Engel, L.S.; He, K.; Chow, W.H.; Mayne, S.T.; Risch, H.A.; et al. Dietary intake of flavonoids and oesophageal and gastric cancer: Incidence and survival in the United States of America (USA). Br. J. Cancer 2015, 112, 1291–1300. [Google Scholar] [CrossRef] [PubMed]
- Bradbury, K.E.; Appleby, P.N.; Key, T.J. Fruit, vegetable, and fiber intake in relation to cancer risk: Findings from the European prospective investigation into cancer and nutrition (EPIC). Am. J. Clin. Nutr. 2014, 100 (Suppl. S1), 394S–398S. [Google Scholar] [CrossRef] [PubMed]
- Gonzalez, C.A.; Lujan-Barroso, L.; Bueno-de-Mesquita, H.B.; Jenab, M.; Duell, E.J.; Agudo, A.; Tjonneland, A.; Boutron-Ruault, M.C.; Clavel-Chapelon, F.; Touillaud, M.; et al. Fruit and vegetable intake and the risk of gastric adenocarcinoma: A reanalysis of the European prospective investigation into cancer and nutrition (EPIC-EURGAST) study after a longer follow-up. Int. J. Cancer 2012, 131, 2910–2919. [Google Scholar] [CrossRef] [PubMed]
- Larsson, S.C.; Orsini, N.; Wolk, A. Processed meat consumption and stomach cancer risk: A meta-analysis. J. Natl. Cancer Inst. 2006, 98, 1078–1087. [Google Scholar] [CrossRef] [PubMed]
- Tricker, A.R.; Pfundstein, B.; Theobald, E.; Preussmann, R.; Spiegelhalder, B. Mean daily intake of volatile N-nitrosamines from foods and beverages in west Germany in 1989–1990. Food Chem. Toxicol. 1991, 29, 729–732. [Google Scholar] [CrossRef]
- Jakszyn, P.; Agudo, A.; Berenguer, A.; Ibanez, R.; Amiano, P.; Pera, G.; Ardanaz, E.; Barricarte, A.; Chirlaque, M.D.; Dorronsoro, M.; et al. Intake and food sources of nitrites and N-nitrosodimethylamine in Spain. Public Health Nutr. 2006, 9, 785–791. [Google Scholar] [CrossRef] [PubMed]
- Tricker, A.R.; Preussmann, R. Carcinogenic N-nitrosamines in the diet: Occurrence, formation, mechanisms and carcinogenic potential. Mutat. Res. 1991, 259, 277–289. [Google Scholar] [CrossRef]
- Anderson, L.M.; Souliotis, V.L.; Chhabra, S.K.; Moskal, T.J.; Harbaugh, S.D.; Kyrtopoulos, S.A. N-nitrosodimethylamine-derived O(6)-methylguanine in DNA of monkey gastrointestinal and urogenital organs and enhancement by ethanol. Int. J. Cancer 1996, 66, 130–134. [Google Scholar] [CrossRef]
- Stang, A. Critical evaluation of the newcastle-ottawa scale for the assessment of the quality of nonrandomized studies in meta-analyses. Eur. J. Epidemiol. 2010, 25, 603–605. [Google Scholar] [CrossRef] [PubMed]
- Greenland, S. Quantitative methods in the review of epidemiologic literature. Epidemiol. Rev. 1987, 9, 1–30. [Google Scholar] [PubMed]
- Orsini, N.; Li, R.; Wolk, A.; Khudyakov, P.; Spiegelman, D. Meta-analysis for linear and nonlinear dose-response relations: Examples, an evaluation of approximations, and software. Am. J. Epidemiol. 2012, 175, 66–73. [Google Scholar] [CrossRef] [PubMed]
- Duval, S.; Tweedie, R. Trim and fill: A simple funnel-plot-based method of testing and adjusting for publication bias in meta-analysis. Biometrics 2000, 56, 455–463. [Google Scholar] [CrossRef] [PubMed]
- Galanis, D.J.; Kolonel, L.N.; Lee, J.; Nomura, A. Intakes of selected foods and beverages and the incidence of gastric cancer among the Japanese residents of hawaii: A prospective study. Int. J. Epidemiol. 1998, 27, 173–180. [Google Scholar] [CrossRef] [PubMed]
- Van Loon, A.J.; Botterweck, A.A.; Goldbohm, R.A.; Brants, H.A.; van Klaveren, J.D.; van den Brandt, P.A. Intake of nitrate and nitrite and the risk of gastric cancer: A prospective cohort study. Br. J. Cancer 1998, 78, 129–135. [Google Scholar] [CrossRef] [PubMed]
- Knekt, P.; Jarvinen, R.; Dich, J.; Hakulinen, T. Risk of colorectal and other gastro-intestinal cancers after exposure to nitrate, nitrite and N-nitroso compounds: A follow-up study. Int. J. Cancer 1999, 80, 852–856. [Google Scholar] [CrossRef]
- Larsson, S.C.; Bergkvist, L.; Wolk, A. Processed meat consumption, dietary nitrosamines and stomach cancer risk in a cohort of Swedish women. Int. J. Cancer 2006, 119, 915–919. [Google Scholar] [CrossRef] [PubMed]
- Cross, A.J.; Freedman, N.D.; Ren, J.; Ward, M.H.; Hollenbeck, A.R.; Schatzkin, A.; Sinha, R.; Abnet, C.C. Meat consumption and risk of esophageal and gastric cancer in a large prospective study. Am. J. Gastroenterol. 2011, 106, 432–442. [Google Scholar] [CrossRef] [PubMed]
- Keszei, A.P.; Goldbohm, R.A.; Schouten, L.J.; Jakszyn, P.; van den Brandt, P.A. Dietary N-nitroso compounds, endogenous nitrosation, and the risk of esophageal and gastric cancer subtypes in the Netherlands cohort study. Am. J. Clin. Nutr. 2013, 97, 135–146. [Google Scholar] [CrossRef] [PubMed]
- Risch, H.A.; Jain, M.; Choi, N.W.; Fodor, J.G.; Pfeiffer, C.J.; Howe, G.R.; Harrison, L.W.; Craib, K.J.; Miller, A.B. Dietary factors and the incidence of cancer of the stomach. Am. J. Epidemiol. 1985, 122, 947–959. [Google Scholar] [PubMed]
- Buiatti, E.; Palli, D.; Decarli, A.; Amadori, D.; Avellini, C.; Bianchi, S.; Bonaguri, C.; Cipriani, F.; Cocco, P.; Giacosa, A.; et al. A case-control study of gastric cancer and diet in Italy: II. Association with nutrients. Int. J. Cancer 1990, 45, 896–901. [Google Scholar] [CrossRef] [PubMed]
- Boeing, H.; Frentzel-Beyme, R.; Berger, M.; Berndt, V.; Gores, W.; Korner, M.; Lohmeier, R.; Menarcher, A.; Mannl, H.F.; Meinhardt, M.; et al. Case-control study on stomach cancer in germany. Int. J. Cancer 1991, 47, 858–864. [Google Scholar] [CrossRef] [PubMed]
- Hansson, L.E.; Nyren, O.; Bergstrom, R.; Wolk, A.; Lindgren, A.; Baron, J.; Adami, H.O. Nutrients and gastric cancer risk. A population-based case-control study in sweden. Int. J. Cancer 1994, 57, 638–644. [Google Scholar] [CrossRef] [PubMed]
- La Vecchia, C.; Ferraroni, M.; D’Avanzo, B.; Decarli, A.; Franceschi, S. Selected micronutrient intake and the risk of gastric cancer. Cancer Epidemiol. Biomarkers Prev. 1994, 3, 393–398. [Google Scholar] [PubMed]
- Pobel, D.; Riboli, E.; Cornee, J.; Hemon, B.; Guyader, M. Nitrosamine, nitrate and nitrite in relation to gastric cancer: A case-control study in marseille, france. Eur. J. Epidemiol. 1995, 11, 67–73. [Google Scholar] [CrossRef] [PubMed]
- La Vecchia, C.; D’Avanzo, B.; Airoldi, L.; Braga, C.; Decarli, A. Nitrosamine intake and gastric cancer risk. Eur. J. Cancer Prev. 1995, 4, 469–474. [Google Scholar] [CrossRef] [PubMed]
- De Stefani, E.; Boffetta, P.; Mendilaharsu, M.; Carzoglio, J.; Deneo-Pellegrini, H. Dietary nitrosamines, heterocyclic amines, and risk of gastric cancer: A case-control study in Uruguay. Nutr. Cancer 1998, 30, 158–162. [Google Scholar] [CrossRef] [PubMed]
- Palli, D.; Russo, A.; Decarli, A. Dietary patterns, nutrient intake and gastric cancer in a high-risk area of italy. Cancer Causes Control 2001, 12, 163–172. [Google Scholar] [CrossRef] [PubMed]
- Engel, L.S.; Chow, W.H.; Vaughan, T.L.; Gammon, M.D.; Risch, H.A.; Stanford, J.L.; Schoenberg, J.B.; Mayne, S.T.; Dubrow, R.; Rotterdam, H.; et al. Population attributable risks of esophageal and gastric cancers. J. Natl. Cancer Inst. 2003, 95, 1404–1413. [Google Scholar] [CrossRef] [PubMed]
- López-Carrillo, L.; Torres-López, J.; Galván-Portillo, M.; Muñoz, L.; López-Cervantes, M. Helicobacter pylori-caga seropositivity and nitrite and ascorbic acid food intake as predictors for gastric cancer. Eur. J. Cancer 2004, 40, 1752–1759. [Google Scholar] [CrossRef] [PubMed]
- Kim, H.J.; Lee, S.S.; Choi, B.Y.; Kim, M.K. Nitrate intake relative to antioxidant vitamin intake affects gastric cancer risk: A case-control study in korea. Nutr. Cancer 2007, 59, 185–191. [Google Scholar] [CrossRef] [PubMed]
- Ward, M.H.; Heineman, E.F.; Markin, R.S.; Weisenburger, D.D. Adenocarcinoma of the stomach and esophagus and drinking water and dietary sources of nitrate and nitrite. Int. J. Occup. Environ. Health 2008, 14, 193–197. [Google Scholar] [CrossRef] [PubMed]
- Hernández-Ramírez, R.U.; Galván-Portillo, M.V.; Ward, M.H.; Agudo, A.; González, C.A.; Oñate-Ocaña, L.F.; Herrera-Goepfert, R.; Palma-Coca, O.; López-Carrillo, L. Dietary intake of polyphenols, nitrate and nitrite and gastric cancer risk in Mexico city. Int. J. Cancer 2009, 125, 1424–1430. [Google Scholar] [CrossRef] [PubMed]
- Navarro Silvera, S.A.; Mayne, S.T.; Risch, H.A.; Gammon, M.D.; Vaughan, T.; Chow, W.H.; Dubin, J.A.; Dubrow, R.; Schoenberg, J.; Stanford, J.L.; et al. Principal component analysis of dietary and lifestyle patterns in relation to risk of subtypes of esophageal and gastric cancer. Ann. Epidemiol. 2011, 21, 543–550. [Google Scholar] [CrossRef] [PubMed]
- Jakszyn, P.; Bingham, S.; Pera, G.; Agudo, A.; Luben, R.; Welch, A.; Boeing, H.; del Giudice, G.; Palli, D.; Saieva, C.; et al. Endogenous versus exogenous exposure to N-nitroso compounds and gastric cancer risk in the European prospective investigation into cancer and nutrition (EPIC-EURGAST) study. Carcinogenesis 2006, 27, 1497–1501. [Google Scholar] [CrossRef] [PubMed]
- Kobayashi, J.; Ohtake, K.; Uchida, H. No-rich diet for lifestyle-related diseases. Nutrients 2015, 7, 4911–4937. [Google Scholar] [CrossRef] [PubMed]
- World Health Oganization; International Agency for Research on Cancer. IARC Monographs on the Evaluation of Carcinogenic Risks to Humans, Volume 94, Ingested Nitrate and Nitrite, and Cyanobacterial Peptide Toxins; International Agency for Research on Cancer: Lyon, France, 2010. [Google Scholar]
- Bryan, N.S.; Alexander, D.D.; Coughlin, J.R.; Milkowski, A.L.; Boffetta, P. Ingested nitrate and nitrite and stomach cancer risk: An updated review. Food Chem. Toxicol. 2012, 50, 3646–3665. [Google Scholar] [CrossRef] [PubMed]
- Loh, Y.H.; Jakszyn, P.; Luben, R.N.; Mulligan, A.A.; Mitrou, P.N.; Khaw, K.T. N-nitroso compounds and cancer incidence: The European prospective investigation into cancer and nutrition (EPIC)-norfolk study. Am. J. Clin. Nutr. 2011, 93, 1053–1061. [Google Scholar] [CrossRef] [PubMed]
- Kipnis, V.; Subar, A.F.; Midthune, D.; Freedman, L.S.; Ballard-Barbash, R.; Troiano, R.P.; Bingham, S.; Schoeller, D.A.; Schatzkin, A.; Carroll, R.J. Structure of dietary measurement error: Results of the open biomarker study. Am. J. Epidemiol. 2003, 158, 14–21. [Google Scholar] [CrossRef] [PubMed]
- Marmot, M.; Atinmo, T.; Byers, T.; Chen, J.; Hirohata, T.; Jackson, A.; James, W. Food, Nutrition, Physical Activity, and the Prevention of Cancer: A Global Perspective; WCRF/AICR Expert Report; World Cancer Research Fund/American Institute for Cancer Research: Washington, DC, USA, 2007. [Google Scholar]
© 2015 by the authors; licensee MDPI, Basel, Switzerland. This article is an open access article distributed under the terms and conditions of the Creative Commons by Attribution (CC-BY) license (http://creativecommons.org/licenses/by/4.0/).
Share and Cite
Song, P.; Wu, L.; Guan, W. Dietary Nitrates, Nitrites, and Nitrosamines Intake and the Risk of Gastric Cancer: A Meta-Analysis. Nutrients 2015, 7, 9872-9895. https://doi.org/10.3390/nu7125505
Song P, Wu L, Guan W. Dietary Nitrates, Nitrites, and Nitrosamines Intake and the Risk of Gastric Cancer: A Meta-Analysis. Nutrients. 2015; 7(12):9872-9895. https://doi.org/10.3390/nu7125505
Chicago/Turabian StyleSong, Peng, Lei Wu, and Wenxian Guan. 2015. "Dietary Nitrates, Nitrites, and Nitrosamines Intake and the Risk of Gastric Cancer: A Meta-Analysis" Nutrients 7, no. 12: 9872-9895. https://doi.org/10.3390/nu7125505
APA StyleSong, P., Wu, L., & Guan, W. (2015). Dietary Nitrates, Nitrites, and Nitrosamines Intake and the Risk of Gastric Cancer: A Meta-Analysis. Nutrients, 7(12), 9872-9895. https://doi.org/10.3390/nu7125505