Impact of Health Labels on Flavor Perception and Emotional Profiling: A Consumer Study on Cheese

 , , , and
Abstract
:1. Introduction
2. Material and Methods
2.1. Participants
2.2. Materials
2.2.1. Cheese
2.2.2. Health Labels and Experimental Design
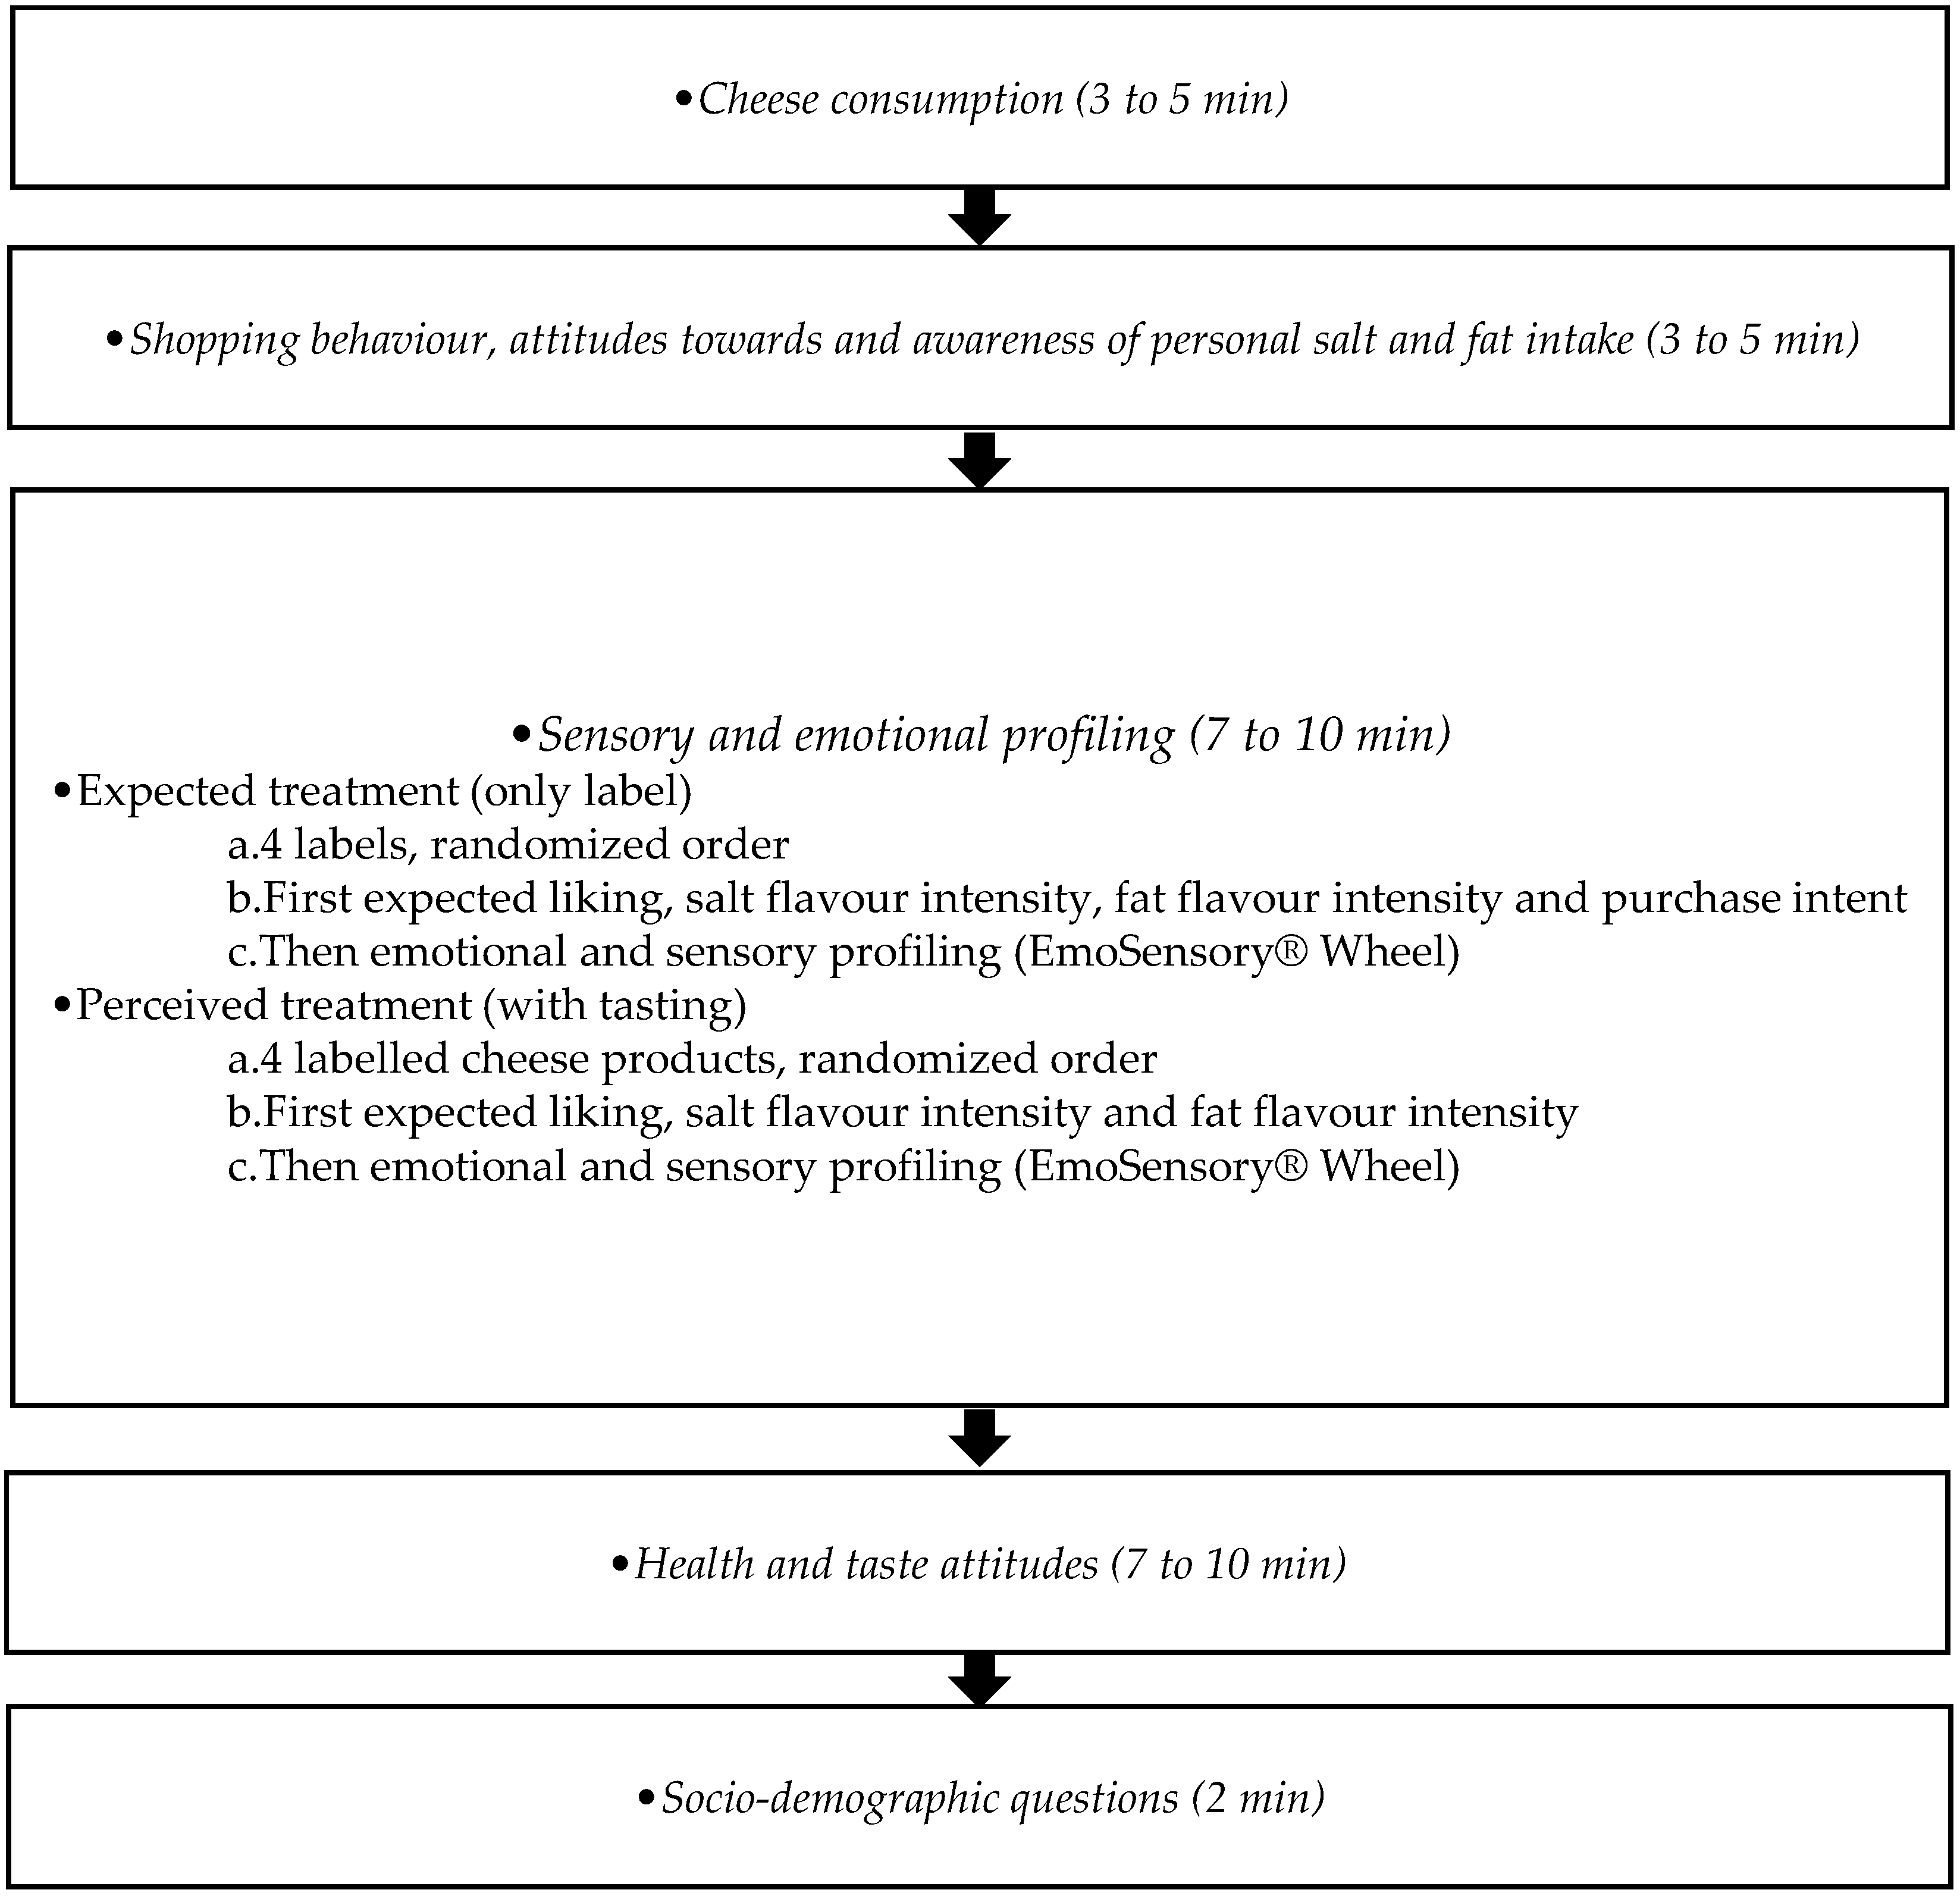
2.3. Procedures


| Emotional Terms | Sensory Terms |
|---|---|
| Glad + | Dry |
| Enthusiastic + | Yellow |
| Irritated − | Firm |
| Happy + | Grainy |
| Good + | Aftertaste |
| Calm u | Pungent |
| Unpleasant surprise − | Untasty |
| Discontented − | Creamy |
| Disinterested − | Soft |
| Dissatisfaction − | Salty |
| Pleasant + | Acid |
| Disappointed − | |
| Merry + |
2.4. Statistical Analyses
3. Results
3.1. Cheese Consumption, Shopping Behaviour, Attitudes and Awareness of Personal Salt and Fat Intake
3.1.1. Cheese Consumption
| Consumption (%) | Consumption of Cheeses (%) | Preference (%) | |||
|---|---|---|---|---|---|
| Once a month | 3.9 | Soft cheese | 72.1 | Soft cheese | 11.6 |
| Once a week | 14.7 | Hard cheese | 88.4 | Hard cheese | 47.3 |
| 2 to 3 times a week | 27.1 | Creamy cheese | 63.6 | Creamy cheese | 14.0 |
| 4 to 6 times a week | 25.6 | Light cheese | 26.4 | Light cheese | 0.8 |
| Daily | 28.7 | Goat cheese | 67.4 | Goat cheese | 16.3 |
| Other | 0.8 | ||||
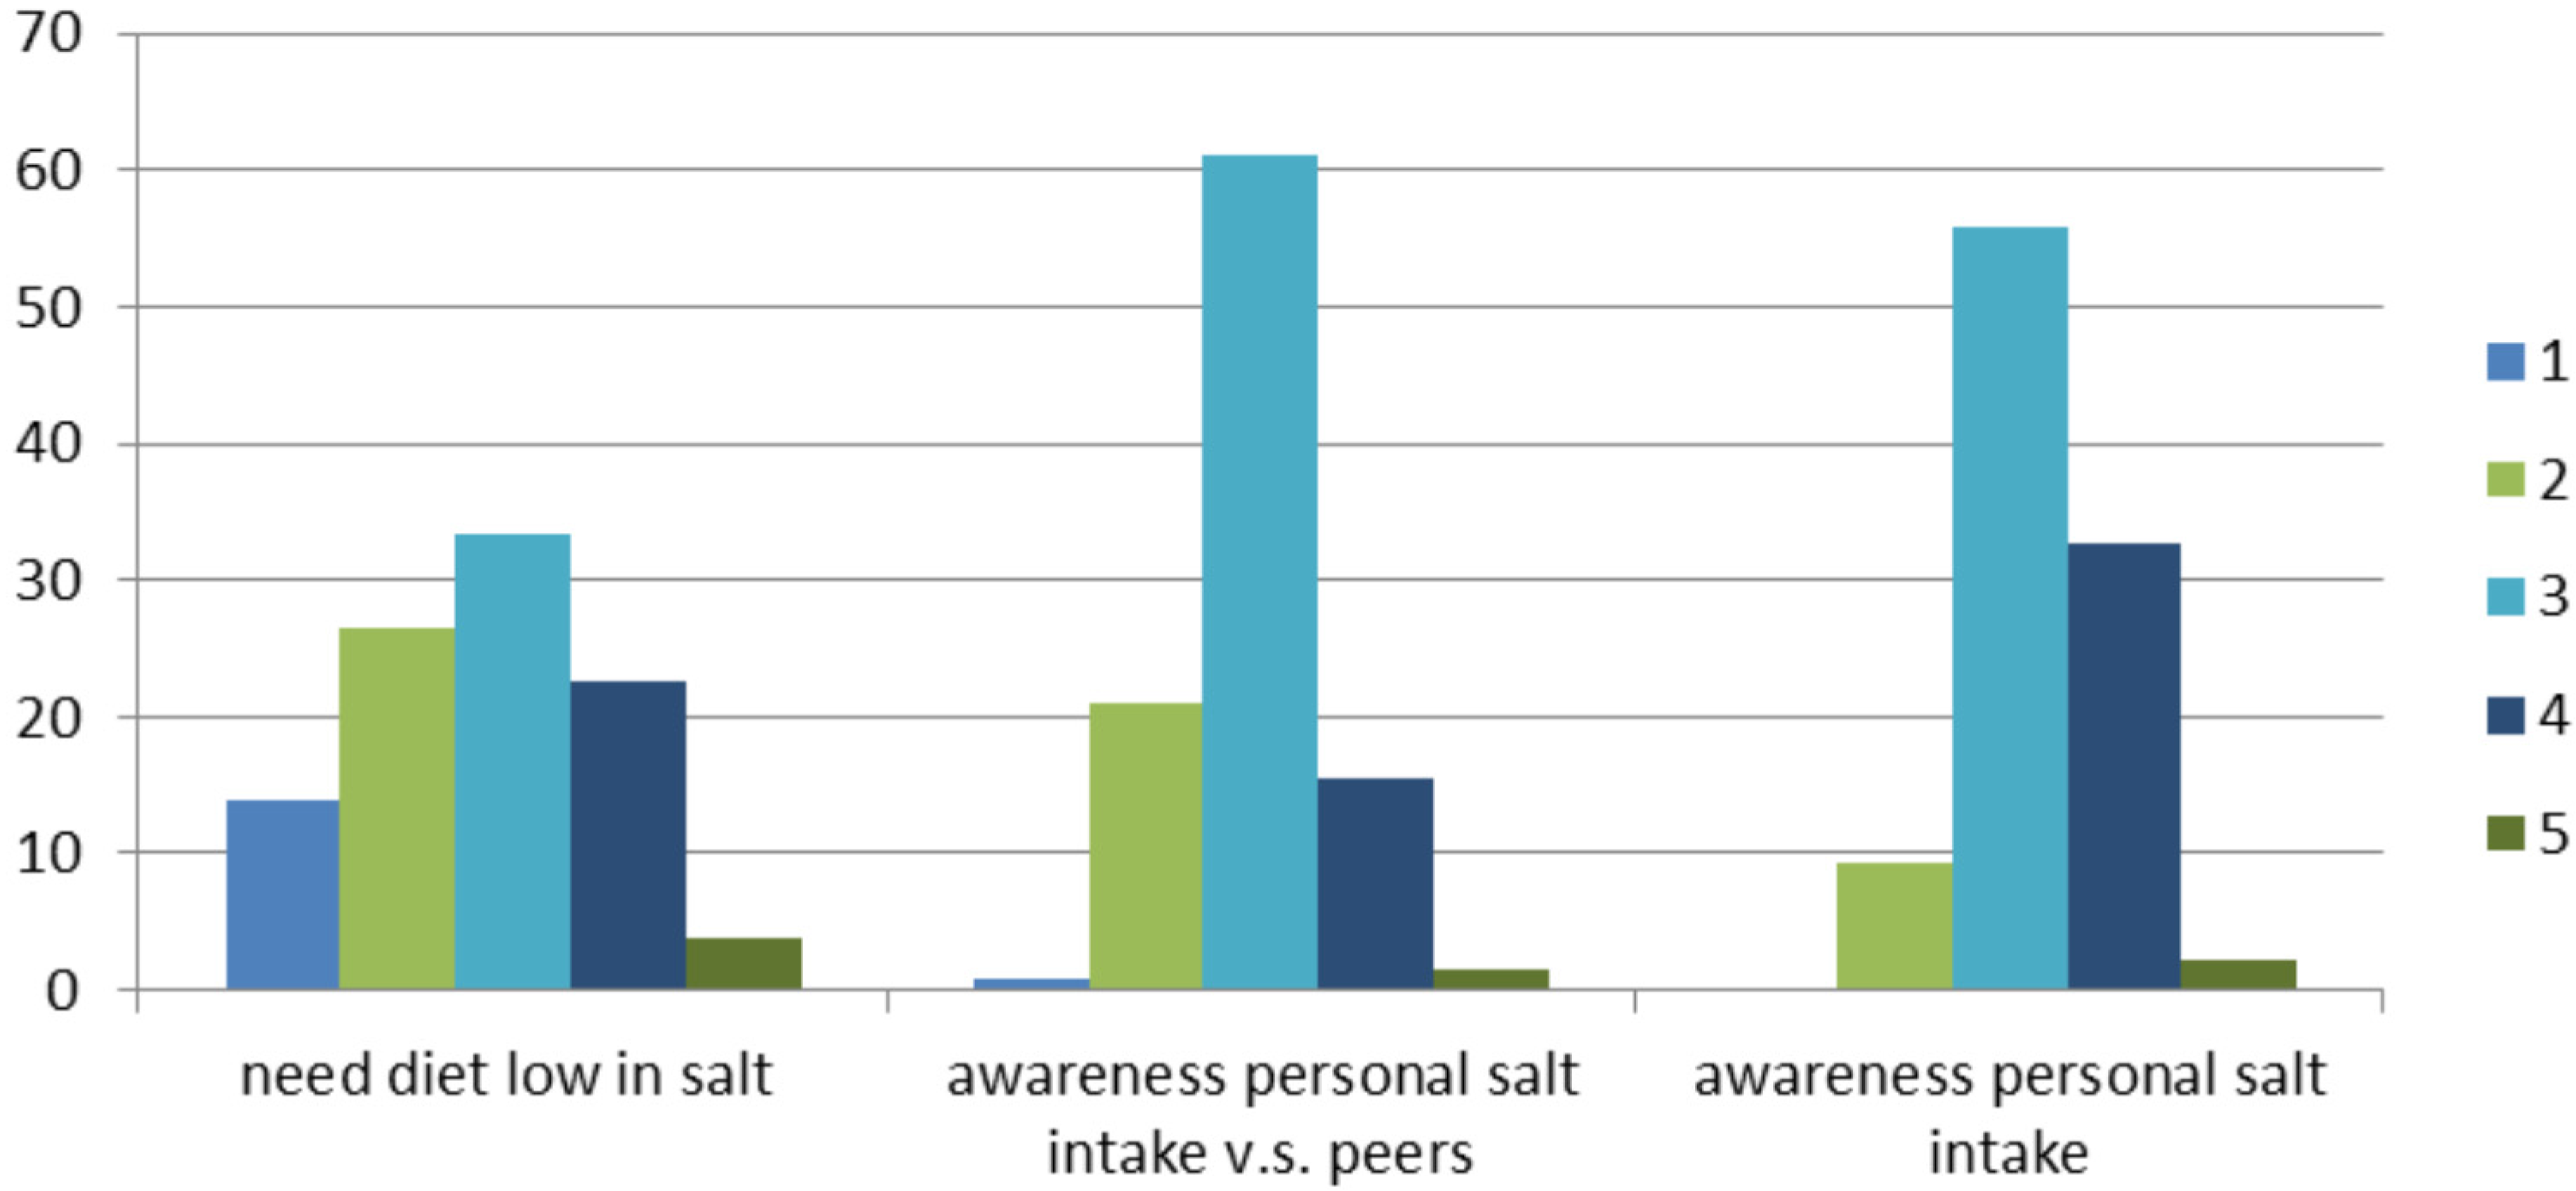
3.1.2. Salt

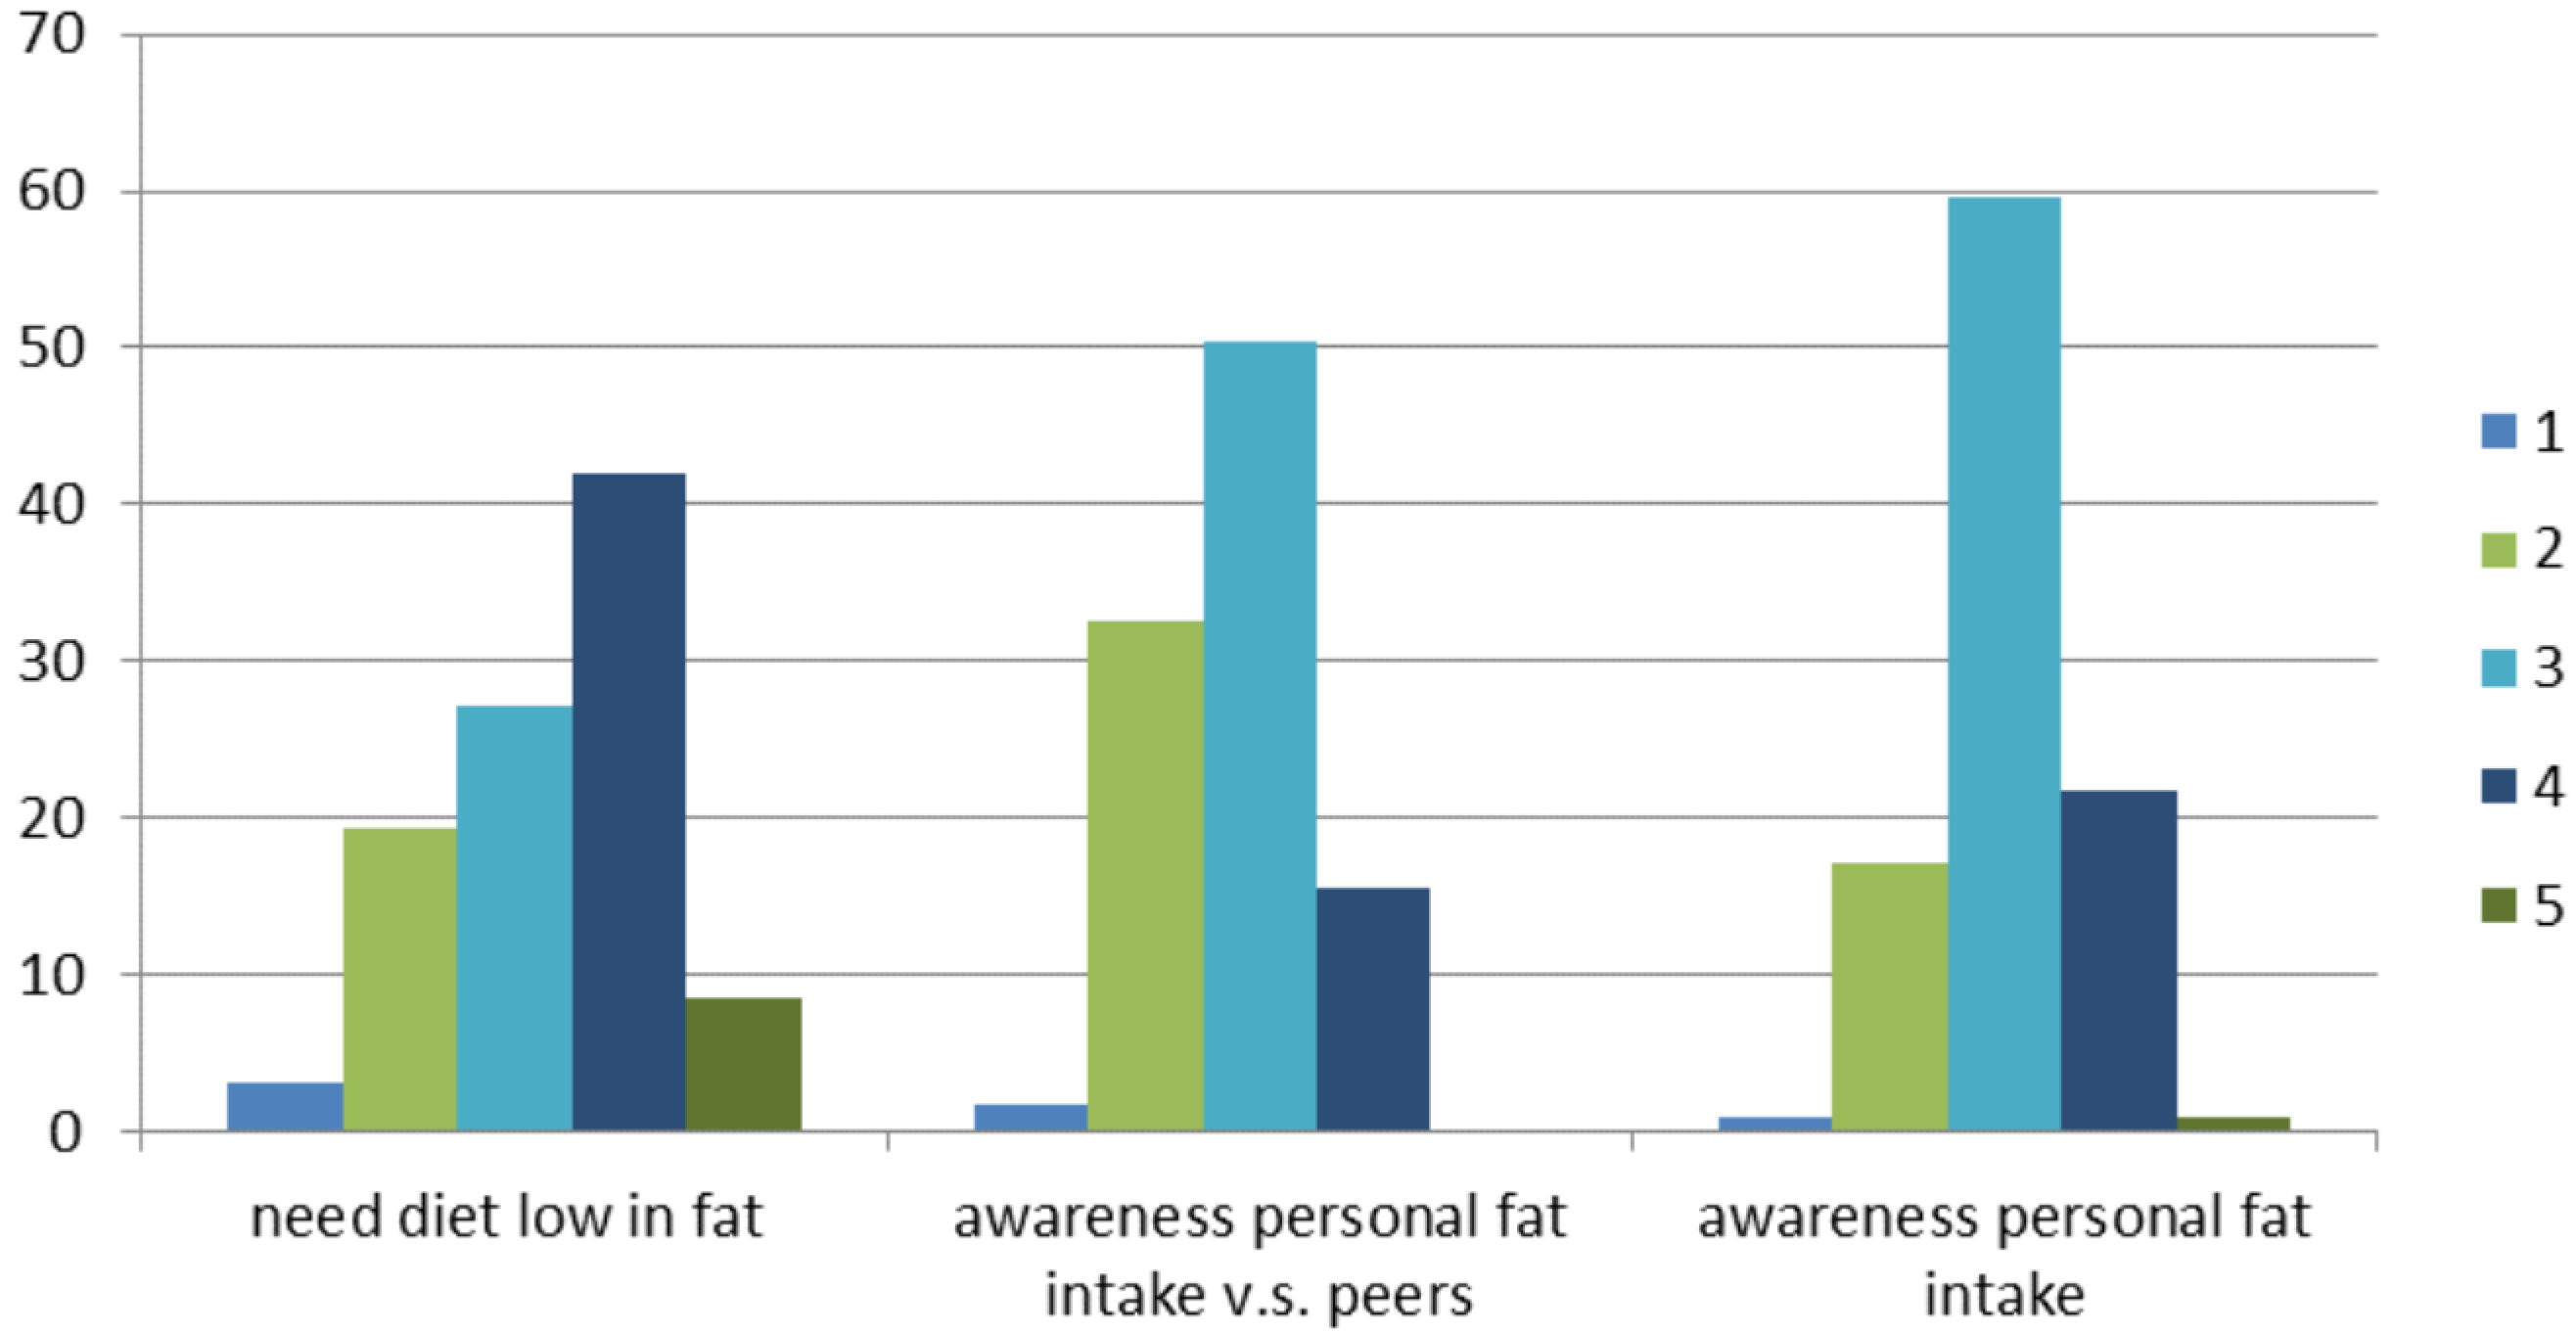
3.1.3. Fat
3.2. Liking, Salt Intensity, Fat Flavor Intensity and Desire
3.2.1. Expected Condition

3.2.2. Perceived Condition
| One-Way Repeated Measures ANOVA (n = 129) | |||||
|---|---|---|---|---|---|
| F | df | p | Number of Levels | η2 | |
| Expected liking | 81.846 | 2.803,358.788 | <0.001 | 4 | 0.610 |
| Expected salt flavor intensity | 101.478 | 2.712,347.167 | <0.001 | 4 | 0.728 |
| Expected fat flavor intensity | 90.889 | 3,384 | <0.001 | 4 | 0.667 |
| Perceived liking | 8.518 | 3,384 | <0.001 | 4 | 0.155 |
| Perceived salt flavor intensity | 16.655 | 3,384 | <0.001 | 4 | 0.255 |
| Perceived fat flavor intensity | 21.671 | 3,384 | <0.001 | 4 | 0.338 |
3.3. EmoSensory® Characterization of the Labeled Cheeses
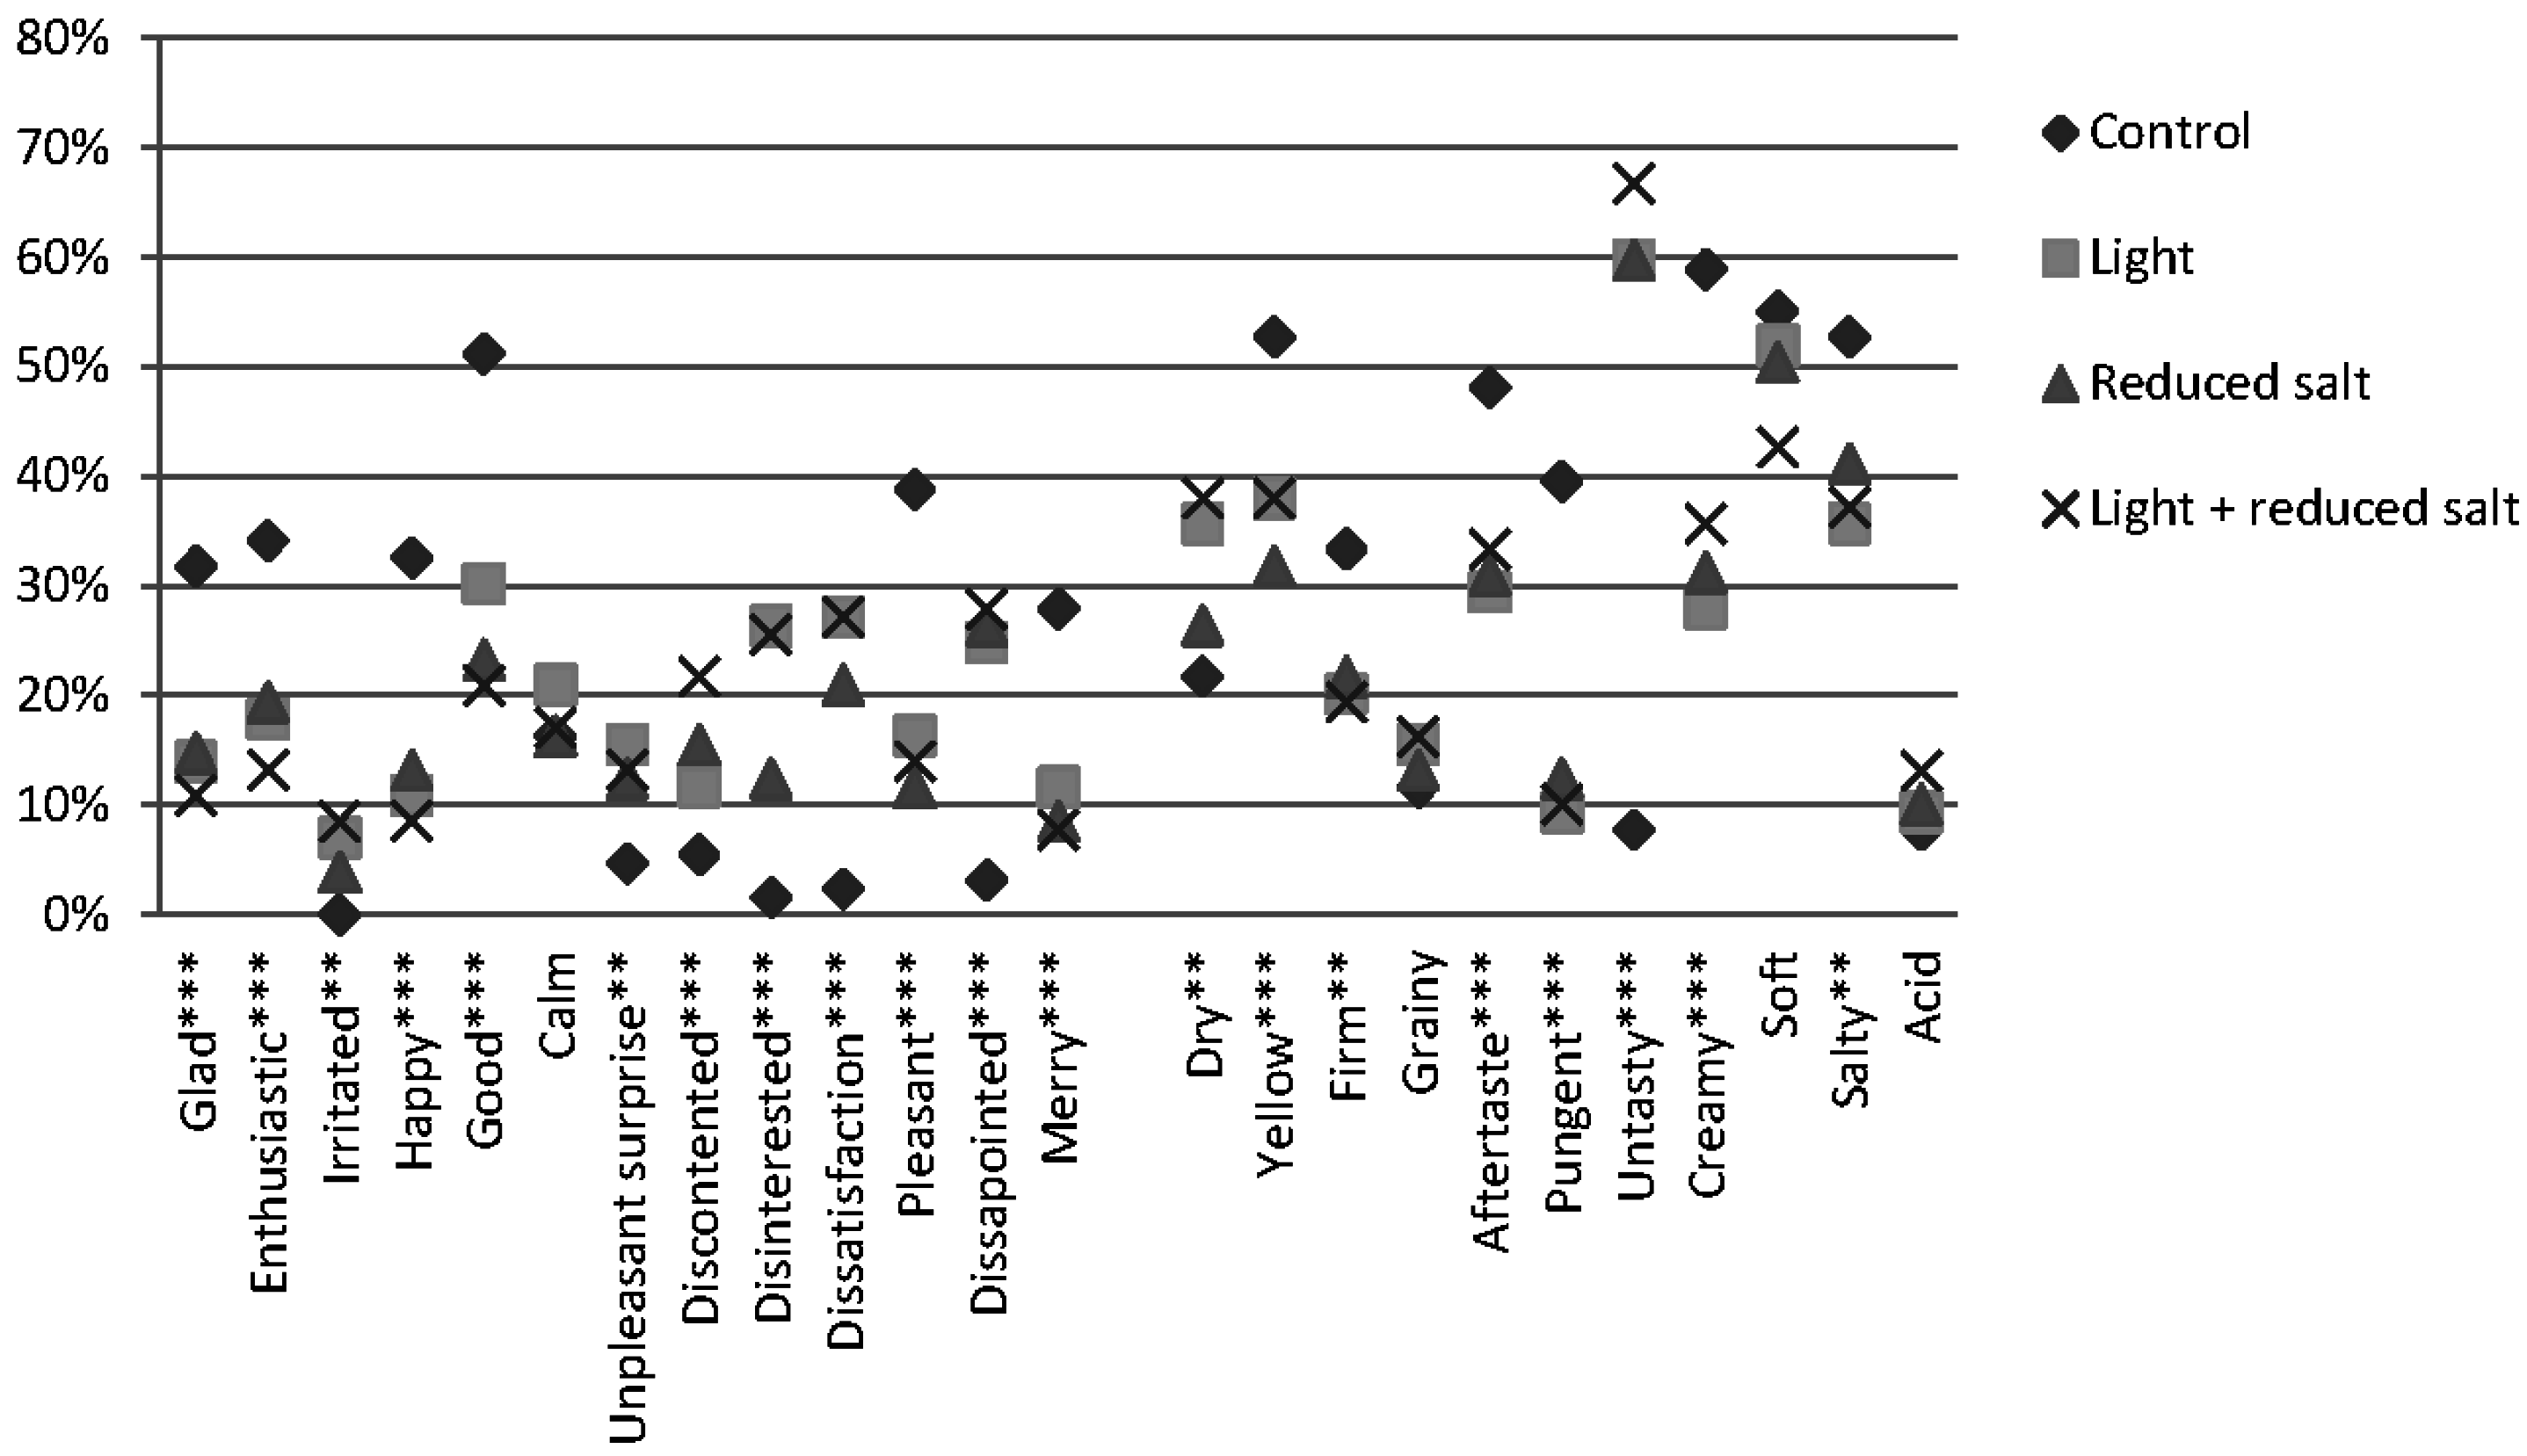
3.3.1. Expected

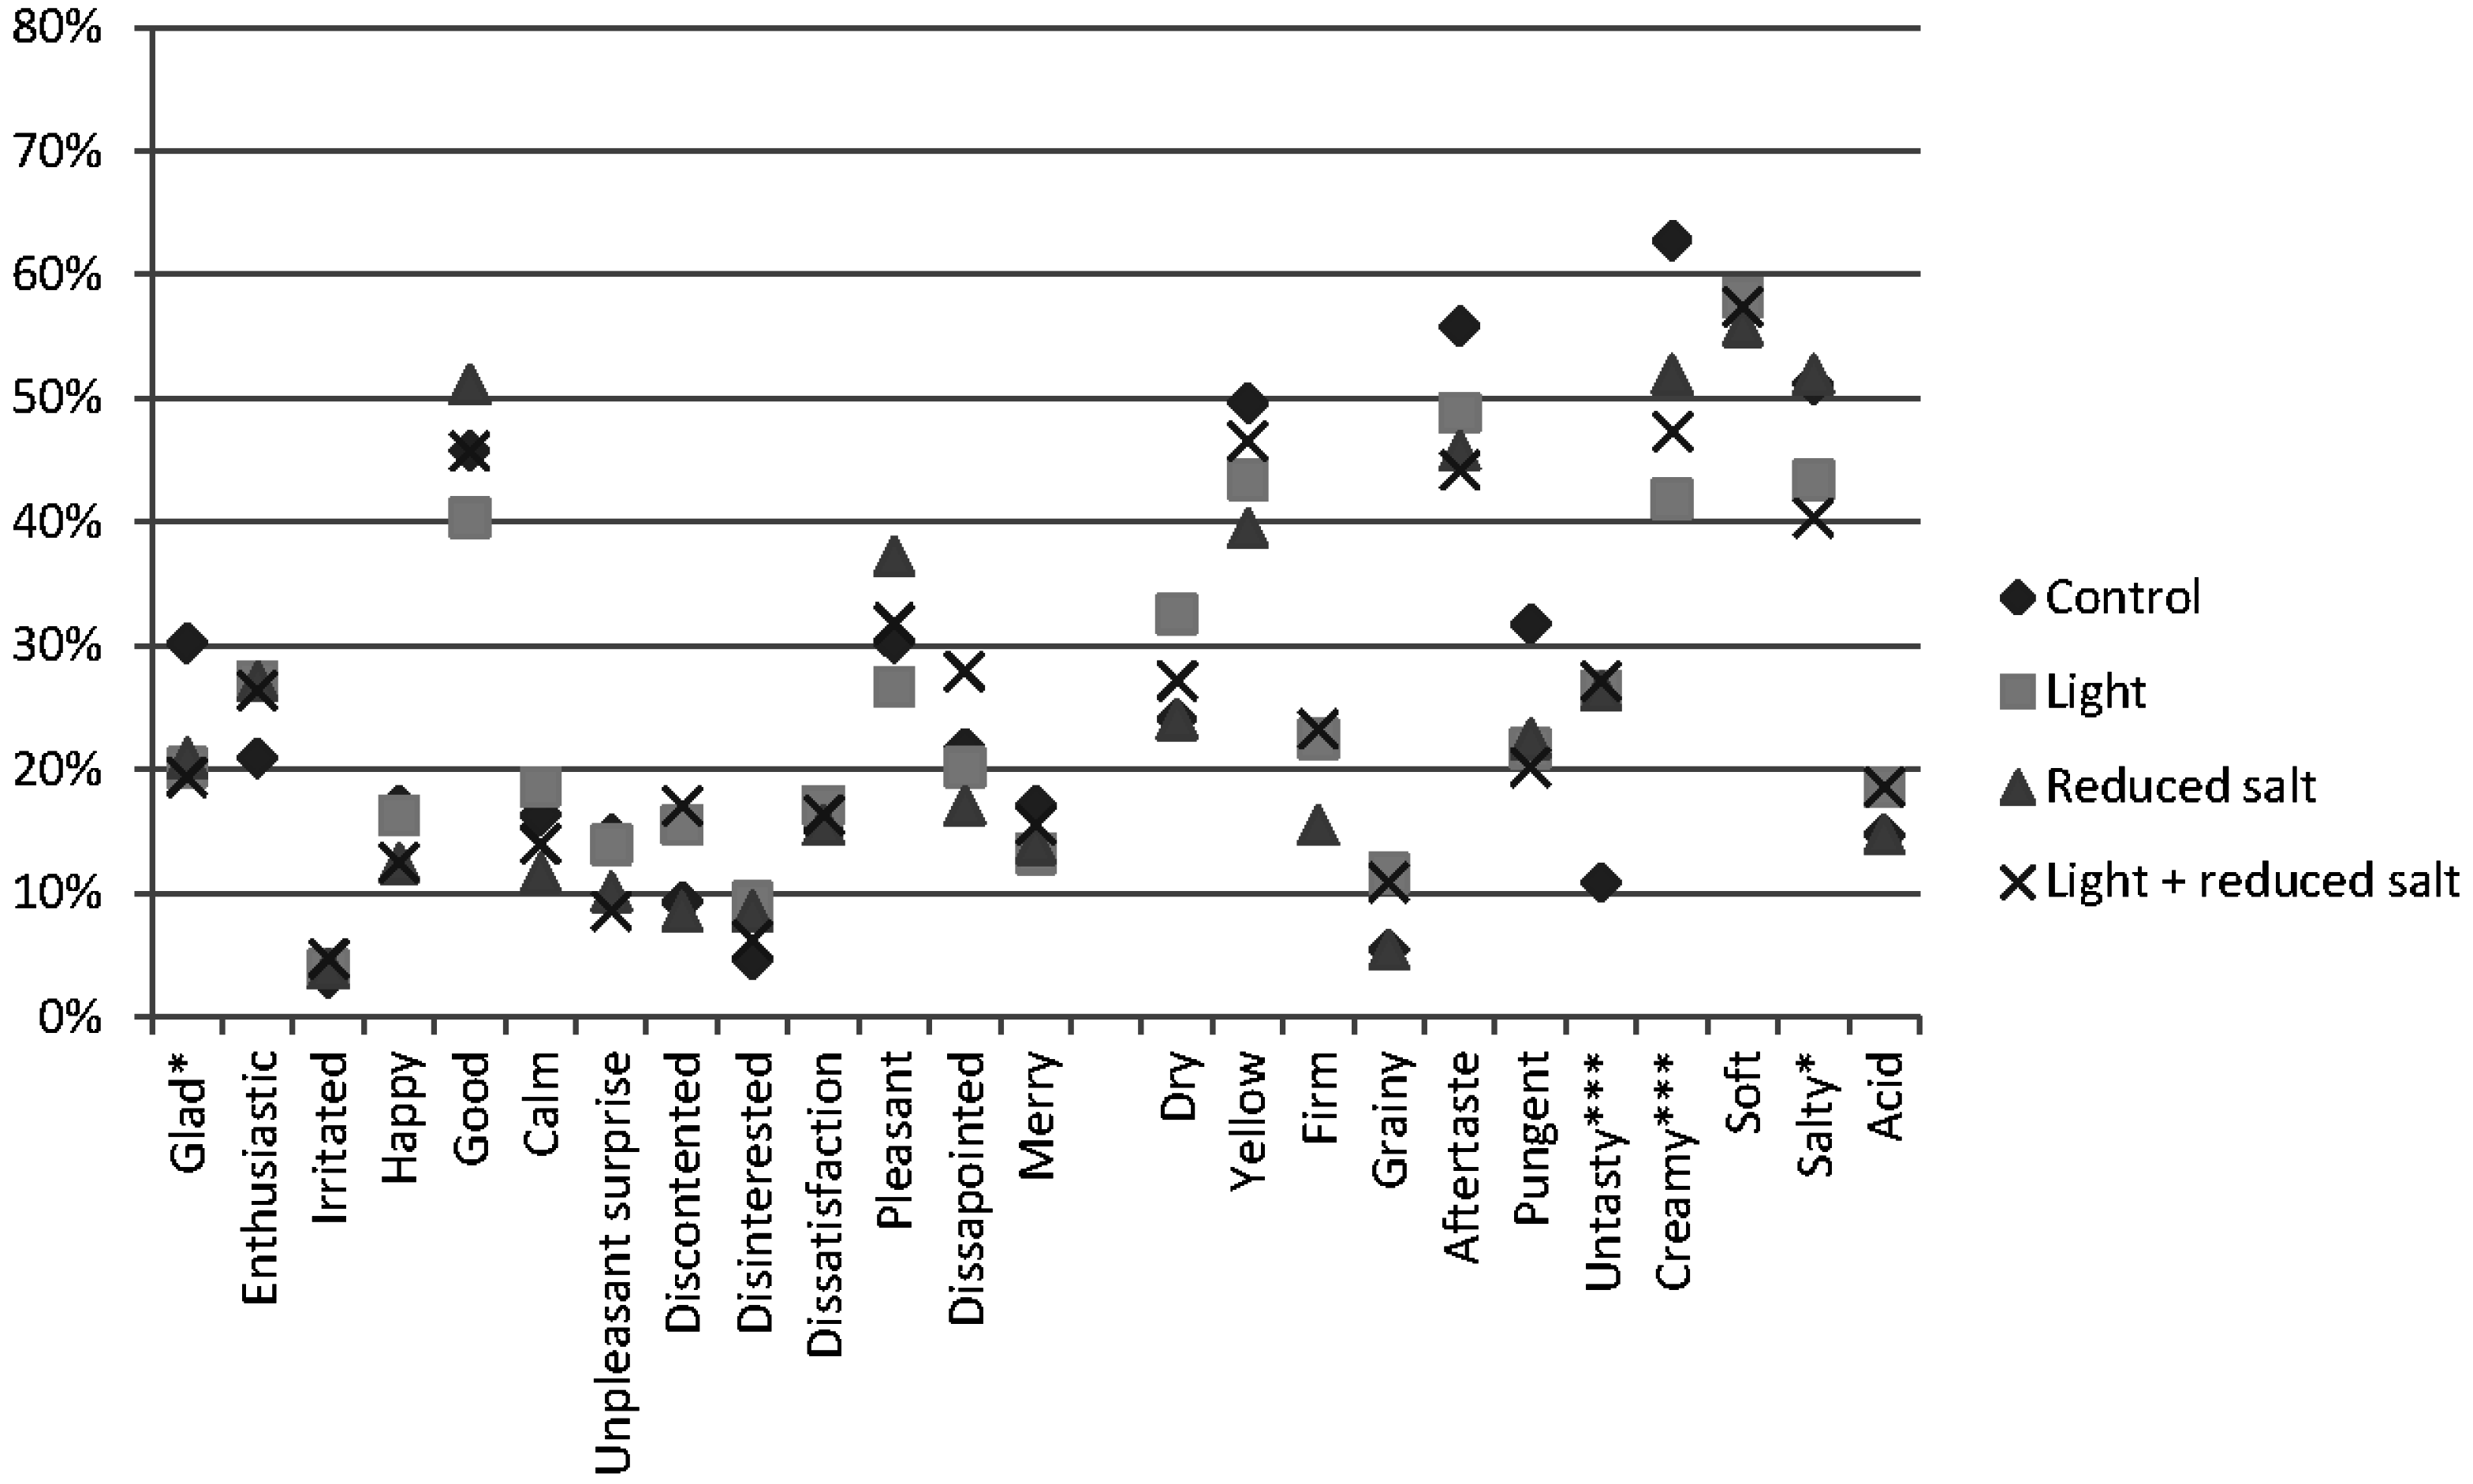
3.3.2. Perceived
| Cochran’s Q Test (RATA) and Friedman Test (RATA Scoring) (n = 129) | |
|---|---|
| Expected Evaluation | |
| Emotional terms with significant differences between samples | RATA: disappointed ***, discontented ***, disinterested ***, dissatisfied ***, enthusiastic ***, glad ***, good ***, happy ***, irritated ***, merry ***, pleasant ***, unpleasant surprise ** |
| RATA scoring: disappointed ***, discontented ***, dissatisfied ***, enthusiastic ***, glad ***, good ***, pleasant ***, happy ***, irritated **, merry ***, unpleasant surprise ** | |
| Sensory terms with significant differences between samples | RATA: aftertaste ***, dry **, creamy ***, firm **, pungent ***, salty **, untasty ***, yellow *** |
| RATA scoring: aftertaste ***, dry ***, creamy ***, firm *, pungent ***, salty ***, untasty ***, yellow *** | |
| Perceived evaluation | |
| Emotional terms with significant differences between samples | RATA: glad * |
| RATA scoring: glad *** | |
| Sensory terms with significant differences between samples | RATA: creamy ***, salty *, untasty *** |
| RATA scoring: aftertaste *, creamy ***, salty **, untasty ***, yellow ** | |

4. Discussion
Acknowledgments
Author Contributions
Conflicts of Interest
References
- Doyle, M.E.; Glass, K.A. Sodium reduction and its effect on food safety, food quality, and human health. Compr. Rev. Food Sci. Food Saf. 2010, 9, 44–56. [Google Scholar] [CrossRef]
- Hooper, L.; Summerbell, C.D.; Higgins, J.P.T.; Thompson, R.L.; Capps, N.E.; Smith, G.D.; Riemersma, R.A.; Ebrahim, S. Dietary fat intake and prevention of cardiovascular disease: Systematic review. BMJ 2001, 322, 757–763. [Google Scholar] [CrossRef] [PubMed] [Green Version]
- Mente, A.; de Koning, L.; Shannon, H.S.; Anand, S.S. A systematic review of the evidence supporting a causal link between dietary factors and coronary heart disease. Arch. Intern. Med. 2009, 169, 659–669. [Google Scholar] [CrossRef] [PubMed]
- Monro, D.; Mhurchu, C.; Jiang, Y.; Gorton, D.; Eyles, H. Changes in the sodium content of New Zealand processed foods: 2003–2013. Nutrients 2015, 7, 4054–4067. [Google Scholar] [CrossRef] [PubMed]
- Lim, S.S.; Vos, T.; Flaxman, A.D.; Danaei, G.; Shibuya, K.; Adair-Rohani, H.; AlMazroa, M.A.; Amann, M.; Anderson, H.R.; Andrews, K.G.; et al. A comparative risk assessment of burden of disease and injury attributable to 67 risk factors and risk factor clusters in 21 regions, 1990–2010: A systematic analysis for the global burden of disease study 2010. Lancet 2012, 380, 2224–2260. [Google Scholar] [CrossRef]
- Drake, S.L.; Lopetcharat, K.; Drake, M.A. Salty taste in dairy foods: Can we reduce the salt? J. Dairy Sci. 2011, 94, 636–645. [Google Scholar] [CrossRef] [PubMed]
- Egger, G.; Swinburn, B. An “ecological” approach to the obesity pandemic. Br. Med. J. 1997, 315, 477–480. [Google Scholar] [CrossRef]
- Norton, J.E.; Fryer, P.J.; Parkinson, J.A. The effect of reduced-fat labelling on chocolate expectations. Food Qual. Preference 2013, 28, 101–105. [Google Scholar] [CrossRef]
- Guh, D.P.; Zhang, W.; Bansback, N.; Amarsi, Z.; Birmingham, C.L.; Anis, A.H. The incidence of co-morbidities related to obesity and overweight: A systematic review and meta-analysis. BMC Public Health 2009, 9, 88. [Google Scholar] [CrossRef] [PubMed]
- Van Gaal, L.F.; Mertens, I.L.; de Block, C.E. Mechanisms linking obesity with cardiovascular disease. Nature 2006, 444, 875–880. [Google Scholar] [CrossRef] [PubMed]
- Januszewska, R.; Pieniak, Z.; Verbeke, W.; de Pelsmaeker, S.; Delbaere, C.; Depypere, F.; Kuti, T.; Hegyi, A.; Dewettinck, K.; Gellynck, X. Food choice questionnaire revisited in four countries. Does it still measure the same? Appetite 2012, 58, 776. [Google Scholar] [CrossRef]
- Guerrero, L.; Guàrdia, M.D.; Xicola, J.; Verbeke, W.; Vanhonacker, F.; Zakowska-Biemans, S.; Sajdakowska, M.; Sulmont-Rosse, C.; Issanchou, S.; Contel, M. Consumer-driven definition of traditional food products and innovation in traditional foods. A qualitative cross-cultural study. Appetite 2009, 52, 345–354. [Google Scholar] [CrossRef] [PubMed]
- Kühne, B.; Vanhonacker, F.; Gellynck, X.; Verbeke, W. Innovation in traditional food products in Europe: Do sector innovation activities match consumers’ acceptance? Food Qual. Preference 2010, 21, 629–638. [Google Scholar] [CrossRef]
- Liem, D.G.; Toraman Aydin, N.; Zandstra, E.H. Effects of health labels on expected and actual taste perception of soup. Food Qual. Preference 2012, 25, 192–197. [Google Scholar] [CrossRef]
- Fernqvist, F.; Ekelund, L. Credence and the effect on consumer liking of food—A review. Food Qual. Preference 2014, 32, 340–353. [Google Scholar] [CrossRef]
- Aaron, J.I.; Mela, D.J.; Evans, R.E. The influences of attitudes, beliefs and label information on perceptions of reduced-fat spread. Appetite 1994, 22, 25–37. [Google Scholar] [CrossRef] [PubMed]
- Wansink, B.; Park, S.B. Sensory suggestiveness and labeling: Do soy labels bias taste? J. Sens. Stud. 2002, 17, 483–491. [Google Scholar] [CrossRef]
- Schacter, D.L. Implicit memory: History and current status. J. Exp. Psychol. Learn. Mem. Cogn. 1987, 13, 501–518. [Google Scholar] [CrossRef]
- Tulving, E.; Schacter, D.L. Priming and human memory systems. Science 1990, 247, 301–306. [Google Scholar] [CrossRef] [PubMed]
- Shiffrin, R.M.; Schneider, W. Controlled and automatic human information processing: II. Perceptual learning, automatic attending and a general theory. Psychol. Rev. 1977, 84, 127–190. [Google Scholar] [CrossRef]
- Forwood, S.E.; Ahern, A.L.; Hollands, G.J.; Ng, Y.-L.; Marteau, T.M. Priming healthy eating. You can’t prime all the people all of the time. Appetite 2015, 89, 93–102. [Google Scholar] [CrossRef] [PubMed] [Green Version]
- Chambaron, S.; Chisin, Q.; Chabanet, C.; Issanchou, S.; Brand, G. Impact of olfactory and auditory priming on the attraction to foods with high energy density. Appetite 2015, 95, 74–80. [Google Scholar] [CrossRef] [PubMed]
- Cardello, A.V. Consumer expectations and their role in food acceptance. In Measurement of Food Preference; MacFie, H.J.H., Thomson, D.M.H., Eds.; Blackie Academic Professional: Glasgow, UK, 1994; pp. 253–297. [Google Scholar]
- Cardello, A.V. Measuring consumer expectations to improve food product development. In Consumer-Led Food Product Development; MacFie, H.J.H., Ed.; Woodhead: Cambridge, UK, 2007; pp. 223–261. [Google Scholar]
- Piqueras-Fiszman, B.; Spence, C. Sensory expectations based on product-extrinsic food cues: An interdisciplinary review of the empirical evidence and theoretical accounts. Food Qual. Preference 2015, 40, 165–179. [Google Scholar] [CrossRef]
- Apaolaza, V.; Hartmann, P.; López, C.; Barrutia, J.M.; Echebarria, C. Natural ingredients claim’s halo effect on hedonic sensory experiences of perfumes. Food Qual. Preference 2014, 36, 81–86. [Google Scholar] [CrossRef]
- Sütterlin, B.; Siegrist, M. Simply adding the word “fruit” makes sugar healthier: The misleading effect of symbolic information on the perceived healthiness of food. Appetite 2015, 95, 252–261. [Google Scholar] [CrossRef] [PubMed]
- Cardello, A.V.; Meiselman, H.L.; Schutz, H.G.; Craig, C.; Given, Z.; Lesher, L.L.; Eicher, S. Measuring emotional responses to foods and food names using questionnaires. Food Qual. Preference 2012, 24, 243–250. [Google Scholar] [CrossRef]
- Thomson, D.M.H.; Crocker, C.; Marketo, C.G. Linking sensory characteristics to emotions: An example using dark chocolate. Food Qual. Preference 2010, 21, 1117–1125. [Google Scholar] [CrossRef]
- Köster, E.P.; Mojet, J. From mood to food and from food to mood: A psychological perspective on the measurement of food-related emotions in consumer research. Food Res. Int. 2015, 76, 180–191. [Google Scholar] [CrossRef]
- King, S.C.; Meiselman, H.L. Development of a method to measure consumer emotions associated with foods. Food Qual. Preference 2010, 21, 168–177. [Google Scholar] [CrossRef]
- Spinelli, S.; Masi, C.; Zoboli, G.P.; Prescott, J.; Monteleone, E. Emotional responses to branded and unbranded foods. Food Qual. Preference 2015, 42, 1–11. [Google Scholar] [CrossRef]
- Ng, M.; Chaya, C.; Hort, J. Beyond liking: Comparing the measurement of emotional response using essense profile and consumer defined check-all-that-apply methodologies. Food Qual. Preference 2013, 28, 193–205. [Google Scholar] [CrossRef]
- Dalenberg, J.R.; Gutjar, S.; ter Horst, G.J.; de Graaf, K.; Renken, R.J.; Jager, G. Evoked emotions predict food choice. PLoS ONE 2014, 9, e115388. [Google Scholar] [CrossRef] [PubMed]
- De Pelsmaeker, S.; Schouteten, J.; Gellynck, X. The consumption of flavored milk among a children population. The influence of beliefs and the association of brands with emotions. Appetite 2013, 71, 279–286. [Google Scholar] [CrossRef] [PubMed]
- Meiselman, H.L. The future in sensory/consumer research: Evolving to a better science. Food Qual. Preference 2013, 27, 208–214. [Google Scholar] [CrossRef]
- Moussaoui, K.A.; Varela, P. Exploring consumer product profiling techniques and their linkage to a quantitative descriptive analysis. Food Qual. Preference 2010, 21, 1088–1099. [Google Scholar] [CrossRef]
- Varela, P.; Ares, G. Sensory profiling, the blurred line between sensory and consumer science. A review of novel methods for product characterization. Food Res. Int. 2012, 48, 893–908. [Google Scholar] [CrossRef]
- Worch, T.; Lê, S.; Punter, P. How reliable are the consumers? Comparison of sensory profiles from consumers and experts. Food Qual. Preference 2010, 21, 309–318. [Google Scholar] [CrossRef]
- O’Neil, C.E.; Keast, D.R.; Fulgoni, V.L.; Nicklas, T.A. Food sources of energy and nutrients among adults in the US: Nhanes 2003–2006. Nutrients 2012, 4, 2097–2120. [Google Scholar] [CrossRef] [PubMed]
- Keast, D.R.; Fulgoni, V.L.; Nicklas, T.A.; O’Neil, C.E. Food sources of energy and nutrients among children in the United States: National health and nutrition examination survey 2003–2006. Nutrients 2013, 5, 283–301. [Google Scholar] [CrossRef] [PubMed]
- Lucas, A.; Rock, E.; Chamba, J.-F.; Verdier-Metz, I.; Brachet, P.; Coulon, J.-B. Respective effects of milk composition and the cheese-making process on cheese compositional variability in components of nutritional interest. Le Lait 2006, 86, 21–41. [Google Scholar] [CrossRef]
- Czarnacka-Szymani, J.; Jezewska-Zychowicz, M. Impact of nutritional information on consumers’ acceptance of cheese with reduced sodium chloride content. Int. Dairy J. 2015, 40, 47–53. [Google Scholar] [CrossRef]
- Santillo, A.; Caroprese, M.; Ruggieri, D.; Marino, R.; Sevi, A.; Albenzio, M. Consumer acceptance and sensory evaluation of Monti Dauni Meridionali Caciocavallo cheese. J. Dairy Sci. 2012, 95, 4203–4208. [Google Scholar] [CrossRef] [PubMed]
- Hersleth, M.; Ueland, Ø.; Allain, H.; Næs, T. Consumer acceptance of cheese, influence of different testing conditions. Food Qual. Preference 2005, 16, 103–110. [Google Scholar] [CrossRef]
- Lee, W.-C.J.; Shimizu, M.; Kniffin, K.M.; Wansink, B. You taste what you see: Do organic labels bias taste perceptions? Food Qual. Preference 2013, 29, 33–39. [Google Scholar] [CrossRef]
- Macfie, H.J.; Bratchell, N.; Greenhoff, K.; Vallis, L.V. Designs to balance the effect of order of presentation and first-order carry-over effects in hall tests. J. Sens. Stud. 1989, 4, 129–148. [Google Scholar] [CrossRef]
- Meilgaard, M.C.; Carr, B.T.; Civille, G.V. Sensory Evaluation Techniques, 4th ed.; CRC Press: Boca Raton, FL, USA, 2006; p. 464. [Google Scholar]
- Lawless, H.T.; Heymann, H. Sensory Evaluation of Food: Principles and Practices, 2nd ed.; Springer: New York, NY, USA, 2010. [Google Scholar]
- Grimes, C.A.; Riddell, L.J.; Nowson, C.A. Consumer knowledge and attitudes to salt intake and labelled salt information. Appetite 2009, 53, 189–194. [Google Scholar] [CrossRef] [PubMed]
- Webster, J.L.; Li, N.; Dunford, E.K.; Nowson, C.A.; Neal, B.C. Consumer awareness and self-reported behaviours related to salt consumption in Australia. Asia Pac. J. Clin. Nutr. 2010, 19, 550–554. [Google Scholar] [PubMed]
- North, S.L.; Neale, R.J. Knowledge, attitudes and eating habits of teenagers with respect to salt in their diet. Br. Food J. 1995, 97, 3–11. [Google Scholar] [CrossRef]
- Brug, J.; van Assema, P.; Kok, G.; Lenderink, T.; Glanz, K. Self-rated dietary fat intake: Association with objective assessment of fat, psychosocial factors, and intention to change. J. Nutr. Educ. 1994, 26, 218–223. [Google Scholar] [CrossRef]
- De Bourdeaudhuij, I.; Brug, J.; Vandelanotte, C.; van Oost, P. Differences in impact between a family versus an individual-based tailored intervention to reduce fat intake. Health Educ. Res. 2002, 17, 435–449. [Google Scholar] [CrossRef] [PubMed]
- Running, C.A.; Craig, B.A.; Mattes, R.D. Oleogustus: The unique taste of fat. Chem. Senses 2015. [Google Scholar] [CrossRef] [PubMed]
- Keast, R.; Costanzo, A. Is fat the sixth taste primary? Evidence and implications. Flavour 2015, 4, 5. [Google Scholar] [CrossRef]
- Ares, G.; Barreiro, C.; Deliza, R.; Giménez, A.N.A.; Gambaro, A. Application of a check-all-that-apply question to the development of chocolate milk desserts. J. Sens. Stud. 2010, 25, 67–86. [Google Scholar] [CrossRef]
- Desmet, P.M.A.; Schifferstein, H.N.J. Sources of positive and negative emotions in food experience. Appetite 2008, 50, 290–301. [Google Scholar] [CrossRef] [PubMed]
- Thomson, D.M.H.; Crocker, C. A data-driven classification of feelings. Food Qual. Preference 2013, 27, 137–152. [Google Scholar] [CrossRef]
- Laros, F.J.M.; Steenkamp, J. Emotions in consumer behavior: A hierarchical approach. J. Bus. Res. 2005, 58, 1437–1445. [Google Scholar] [CrossRef]
- Szczesniak, A.S. Texture is a sensory property. Food Qual. Preference 2002, 13, 215–225. [Google Scholar] [CrossRef]
- Salles, C.; Dalmas, S.; Septier, C.; Issanchou, S.; Noël, Y.; Etiévant, P.; le Quéré, J. Production of a cheese model for sensory evaluation of flavour compounds. Le Lait 1995, 75, 535–549. [Google Scholar] [CrossRef]
- Mcewan, J.A.; Moore, J.D.; Colwill, J.S. The sensory characteristics of cheddar cheese and their relationship with acceptability. Int. J. Dairy Technol. 1989, 42, 112–117. [Google Scholar] [CrossRef]
- Manzocco, L.; Rumignani, A.; Lagazio, C. Emotional response to fruit salads with different visual quality. Food Qual. Preference 2013, 28, 17–22. [Google Scholar] [CrossRef]
- Ferrarini, R.; Carbognin, C.; Casarotti, E.M.; Nicolis, E.; Nencini, A.; Meneghini, A.M. The emotional response to wine consumption. Food Qual. Preference 2010, 21, 720–725. [Google Scholar] [CrossRef]
- Ng, M.; Chaya, C.; Hort, J. The influence of sensory and packaging cues on both liking and emotional, abstract and functional conceptualisations. Food Qual. Preference 2013, 29, 146–156. [Google Scholar] [CrossRef]
- Ares, G.; Bruzzone, F.; Vidal, L.; Cadena, R.S.; Giménez, A.; Pineau, B.; Hunter, D.C.; Paisley, A.G.; Jaeger, S.R. Evaluation of a rating-based variant of check-all-that-apply questions: Rate-all-that-apply (RATA). Food Qual. Preference 2014, 36, 87–95. [Google Scholar] [CrossRef]
- Jaeger, S.R.; Ares, G. Rata questions are not likely to bias hedonic scores. Food Qual. Preference 2015, 44, 157–161. [Google Scholar] [CrossRef]
- Schouteten, J.J.; de Steur, H.; de Pelsmaeker, S.; Lagast, S.; de Bourdeaudhuij, I.; Gellynck, X. An integrated method for the emotional conceptualization and sensory characterization of food products: The EmoSensory® Wheel. Food Res. Int. 2015, 78C, 96–107. [Google Scholar] [CrossRef]
- King, S.C.; Meiselman, H.L.; Carr, B.T. Measuring emotions associated with foods: Important elements of questionnaire and test design. Food Qual. Preference 2013, 28, 8–16. [Google Scholar] [CrossRef]
- Ares, G.; Jaeger, S.R. Check-all-that-apply questions: Influence of attribute order on sensory product characterization. Food Qual. Preference 2013, 28, 141–153. [Google Scholar] [CrossRef]
- Jaeger, S.R.; Chheang, S.L.; Yin, J.; Bava, C.M.; Gimenez, A.; Vidal, L.; Ares, G. Check-all-that-apply (CATA) responses elicited by consumers: Within-assessor reproducibility and stability of sensory product characterizations. Food Qual. Preference 2013, 30, 56–67. [Google Scholar] [CrossRef]
- Faul, F.; Erdfelder, E.; Lang, A.-G.; Buchner, A. G* power 3: A flexible statistical power analysis program for the social, behavioral, and biomedical sciences. Behav. Res. Methods 2007, 39, 175–191. [Google Scholar] [CrossRef] [PubMed]
- Engell, D.; Bordi, P.; Borja, M.; Lambert, C.; Rolls, B. Effects of information about fat content on food preferences in pre-adolescent children. Appetite 1998, 30, 269–282. [Google Scholar] [CrossRef] [PubMed]
- Kähkönen, P.; Hakanpää, P.; Tuorila, H. The effect of information related to fat content and taste on consumer responses to a reduced-fat frankfurter and a reduced-fat chocolate bar. J. Sens. Stud. 1999, 14, 35–46. [Google Scholar] [CrossRef]
- Ebneter, D.S.; Latner, J.D.; Nigg, C.R. Is less always more? The effects of low-fat labeling and caloric information on food intake, calorie estimates, taste preference, and health attributions. Appetite 2013, 68, 92–97. [Google Scholar] [CrossRef] [PubMed]
- Kihlberg, I.; Johansson, L.; Langsrud, Ø.; Risvik, E. Effects of information on liking of bread. Food Qual. Preference 2005, 16, 25–35. [Google Scholar] [CrossRef]
- Bayarri, S.; Carbonell, I.; Barrios, E.X.; Costell, E. Acceptability of yogurt and yogurt-like products: Influence of product information and consumer characteristics and preferences. J. Sens. Stud. 2010, 25, 171–189. [Google Scholar] [CrossRef]
- Carrillo, E.; Varela, P.; Fiszman, S. Effects of food package information and sensory characteristics on the perception of healthiness and the acceptability of enriched biscuits. Food Res. Int. 2012, 48, 209–216. [Google Scholar] [CrossRef]
- Hawley, K.L.; Roberto, C.A.; Bragg, M.A.; Liu, P.J.; Schwartz, M.B.; Brownell, K.D. The science on front-of-package food labels. Public Health Nutr. 2013, 16, 430–439. [Google Scholar] [CrossRef] [PubMed]
- Verbeke, W. Functional foods: Consumer willingness to compromise on taste for health? Food Qual. Preference 2006, 17, 126–131. [Google Scholar] [CrossRef]
- Viaene, J. Consumer behaviour towards light products in Belgium. Br. Food J. 1997, 99, 105–113. [Google Scholar] [CrossRef]
- Gravel, K.; Doucet, É.; Herman, C.P.; Pomerleau, S.; Bourlaud, A.-S.; Provencher, V. “Healthy”, “diet”, or “hedonic”. How nutrition claims affect food-related perceptions and intake? Appetite 2012, 59, 877–884. [Google Scholar] [CrossRef] [PubMed]
- Wansink, B.; Ittersum, K.V.; Painter, J.E. How diet and health labels influence taste and satiation. J. Food Sci. 2004, 69, S340–S346. [Google Scholar] [CrossRef]
- Chrea, C.; Grandjean, D.; Delplanque, S.; Cayeux, I.; le Calvé, B.; Aymard, L.; Velazco, M.I.; Sander, D.; Scherer, K.R. Mapping the semantic space for the subjective experience of emotional responses to odors. Chem. Senses 2009, 34, 49–62. [Google Scholar] [CrossRef] [PubMed]
- Gibson, E.L. Emotional influences on food choice: Sensory, physiological and psychological pathways. Physiol. Behav. 2006, 89, 53–61. [Google Scholar] [CrossRef] [PubMed]
- Porcherot, C.; Delplanque, S.; Raviot-Derrien, S.; Calvé, B.L.; Chrea, C.; Gaudreau, N.; Cayeux, I. How do you feel when you smell this? Optimization of a verbal measurement of odor-elicited emotions. Food Qual. Preference 2010, 21, 938–947. [Google Scholar] [CrossRef]
- Porcherot, C.; Delplanque, S.; Planchais, A.; Gaudreau, N.; Accolla, R.; Cayeux, I. Influence of food odorant names on the verbal measurement of emotions. Food Qual. Preference 2012, 23, 125–133. [Google Scholar] [CrossRef]
- Stolzenbach, S.; Bredie, W.L.P.; Christensen, R.H.B.; Byrne, D.V. Impact of product information and repeated exposure on consumer liking, sensory perception and concept associations of local apple juice. Food Res. Int. 2013, 52, 91–98. [Google Scholar] [CrossRef]
- Vidal, L.; Barreiro, C.; Gómez, B.; Ares, G.; Giménez, A. Influence of information on consumers’ evaluations using check-all-that-apply questions and sorting: A case study with milk desserts. J. Sens. Stud. 2013, 28, 125–137. [Google Scholar] [CrossRef]
- Wansink, B.; Sonka, S.T.; Hasler, C.M. Front-label health claims: When less is more. Food Policy 2004, 29, 659–667. [Google Scholar] [CrossRef]
- Edwards, J.S.A.; Meiselman, H.L.; Edwards, A.; Lesher, L. The influence of eating location on the acceptability of identically prepared foods. Food Qual. Preference 2003, 14, 647–652. [Google Scholar] [CrossRef]
- Köster, E.P. The psychology of food choice: Some often encountered fallacies. Food Qual. Preference 2003, 14, 359–373. [Google Scholar] [CrossRef]
- Porcherot, C.; Petit, E.; Giboreau, A.; Gaudreau, N.; Cayeux, I. Measurement of self-reported affective feelings when an aperitif is consumed in an ecological setting. Food Qual. Preference 2015, 39, 277–284. [Google Scholar] [CrossRef]
© 2015 by the authors; licensee MDPI, Basel, Switzerland. This article is an open access article distributed under the terms and conditions of the Creative Commons by Attribution (CC-BY) license (http://creativecommons.org/licenses/by/4.0/).
Share and Cite
Schouteten, J.J.; De Steur, H.; De Pelsmaeker, S.; Lagast, S.; De Bourdeaudhuij, I.; Gellynck, X. Impact of Health Labels on Flavor Perception and Emotional Profiling: A Consumer Study on Cheese. Nutrients 2015, 7, 10251-10268. https://doi.org/10.3390/nu7125533
Schouteten JJ, De Steur H, De Pelsmaeker S, Lagast S, De Bourdeaudhuij I, Gellynck X. Impact of Health Labels on Flavor Perception and Emotional Profiling: A Consumer Study on Cheese. Nutrients. 2015; 7(12):10251-10268. https://doi.org/10.3390/nu7125533
Chicago/Turabian StyleSchouteten, Joachim J., Hans De Steur, Sara De Pelsmaeker, Sofie Lagast, Ilse De Bourdeaudhuij, and Xavier Gellynck. 2015. "Impact of Health Labels on Flavor Perception and Emotional Profiling: A Consumer Study on Cheese" Nutrients 7, no. 12: 10251-10268. https://doi.org/10.3390/nu7125533