Inhibitory Effects of Quercetin and Its Main Methyl, Sulfate, and Glucuronic Acid Conjugates on Cytochrome P450 Enzymes, and on OATP, BCRP and MRP2 Transporters

 ,
, 
Abstract
: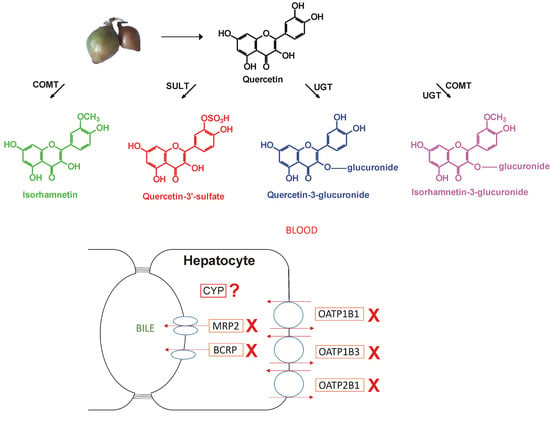
1. Introduction
2. Materials and Methods
2.1. Reagents
2.2. CYP Assays
2.3. HPLC Analyses
2.4. OATP Overexpressing Cell Lines and OATP Interaction Tests
2.5. Transport Activity Measurements for MRP2 and BCRP Transporters
2.6. ATPase Activity Assays for BCRP Transporter Interaction
2.7. Statistics
3. Results
3.1. Inhibition of CYP Enzymes by Q and Its Conjugates
3.2. Inhibition of OATP Activity by Q and Its Conjugates
3.3. Effects of Q and Its Conjugates on ABC Transporters
4. Discussion
Supplementary Materials
Author Contributions
Funding
Acknowledgments
Conflicts of Interest
References
- Guo, Y.; Bruno, R.S. Endogenous and Exogenous Mediators of Quercetin Bioavailability. J. Nutr. Biochem. 2015, 26, 201–210. [Google Scholar] [CrossRef]
- Andres, S.; Pevny, S.; Ziegenhagen, R.; Bakhiya, N.; Schäfer, B.; Hirsh-Ernst, K.I.; Lampen, A. Safety Aspects of the Use of Quercetin as a Dietary Supplement. Mol. Nutr. Food Res. 2018, 62, 1700447. [Google Scholar] [CrossRef] [PubMed]
- Vida, R.G.; Fittler, A.; Somogyi-Végh, A.; Poór, M. Dietary quercetin supplements: Assessment of online product informations and quantitation of quercetin in the products by high-performance liquid chromatography. Phytother. Res. 2019, 33, 1912–1920. [Google Scholar] [CrossRef] [PubMed]
- Egert, S.; Wolffram, S.; Bosy-Westphal, A.; Boesch-Saadatmandi, C.; Wagner, A.E.; Frank, J.; Rimbach, G.; Mueller, M.J. Daily quercetin supplementation dose-dependently increases plasma quercetin concentrations in healthy humans. J. Nutr. 2008, 138, 1615–1621. [Google Scholar] [CrossRef] [PubMed] [Green Version]
- Conquer, J.A.; Maiani, G.; Azzini, E.; Raguzzini, A.; Holub, B.J. Supplementation with quercetin markedly increases plasma quercetin concentration without effect on selected risk factors for heart disease in healthy subjects. J. Nutr. 1998, 128, 593–597. [Google Scholar] [CrossRef] [PubMed]
- Day, A.J.; Mellon, F.; Barron, D.; Sarrazin, G.; Morgan, M.R.; Williamson, G. Human metabolism of dietary flavonoids: Identification of plasma metabolites of quercetin. Free Radic. Res. 2001, 35, 941–952. [Google Scholar] [CrossRef]
- Mullen, W.; Edwards, C.A.; Crozier, A. Absorption, excretion and metabolite profiling of methyl-, glucuronyl-, glucosyl- and sulpho-conjugates of quercetin in human plasma and urine after ingestion of onions. Br. J. Nutr. 2006, 96, 107–116. [Google Scholar] [CrossRef]
- Cialdella-Kam, L.; Nieman, D.C.; Sha, W.; Meaney, M.P.; Knab, A.M.; Shanely, R.A. Dose–response to 3 months of quercetin-containing supplements on metabolite and quercetin conjugate profile in adults. Br. J. Nutr. 2012, 109, 1923–1933. [Google Scholar] [CrossRef] [Green Version]
- Kaushik, D.; O’Fallon, K.; Clarkson, P.M.; Dunne, C.P.; Conca, K.R.; Michniak-Kohn, B. Comparison of Quercetin Pharmacokinetics Following Oral Supplementation in Humans. J. Food Sci. 2012, 77, H231–H238. [Google Scholar] [CrossRef] [PubMed]
- McDonnell, A.M.; Dang, C.H. Basic Review of the Cytochrome P450 System. J. Adv. Pract. Oncol. 2013, 4, 263–268. [Google Scholar] [CrossRef] [PubMed]
- Rastogi, H.; Jana, S. Evaluation of Inhibitory Effects of Caffeic acid and Quercetin on Human Liver Cytochrome P450 Activities. Phytother. Res. 2014, 28, 1873–1878. [Google Scholar] [CrossRef] [PubMed]
- Korobkova, E.A. Effect of Natural Polyphenols on CYP Metabolism: Implications for Diseases. Chem. Res. Toxicol. 2015, 28, 1359–1390. [Google Scholar] [CrossRef] [PubMed]
- Miron, A.; Aprotosoaie, A.C.; Trifan, A.; Xiao, J. Flavonoids as modulators of metabolic enzymes and drug transporters. Ann. N. Y. Acad. Sci. 2017, 1398, 152–167. [Google Scholar] [CrossRef] [PubMed]
- Poór, M.; Boda, G.; Needs, P.W.; Kroon, P.A.; Lemli, B.; Bencsik, T. Interaction of Quercetin and Its Metabolites with Warfarin: Displacement of Warfarin from Serum Albumin and Inhibition of CYP2C9 Enzyme. Biomed. Pharmacother. 2017, 88, 574–581. [Google Scholar] [CrossRef]
- Chang, T.K.H.; Chen, J.; Yeung, E.Y.H. Effect of Ginkgo Biloba Extract on Procarcinogen-Bioactivating Human CYP1 Enzymes: Identification of Isorhamnetin, Kaempferol, and Quercetin as Potent Inhibitors of CYP1B1. Toxicol. Appl. Pharmacol. 2006, 213, 18–26. [Google Scholar] [CrossRef]
- Kimura, Y.; Ito, H.; Ohnishi, R.; Hatano, T. Inhibitory effects of polyphenols on human cytochrome P450 3A4 and 2C9 activity. Food Chem. Toxicol. 2010, 48, 429–435. [Google Scholar] [CrossRef]
- Takemura, H.; Itoh, T.; Yamamoto, K.; Sakakibara, H.; Shimoi, K. Selective Inhibition of Methoxyflavonoids on Human CYP1B1 Activity. Bioorgan. Med. Chem. 2010, 18, 6310–6315. [Google Scholar] [CrossRef]
- Johnson, E.J.; Won, C.S.; Köck, K.; Paine, M.F. Prioritizing pharmacokinetic drug interaction precipitants innatural products: Application to OATP inhibitors in grapefruitjuice. Biopharm. Drug Dispos. 2017, 38, 251–259. [Google Scholar] [CrossRef] [Green Version]
- Yu, J.; Zhou, Z.; Tay-Sontheimer, J.; Levy, R.H.; Ragueneau-Majlessi, I. Intestinal Drug Interactions Mediated by OATPs: A Systematic Review of Preclinical and Clinical Findings. J. Pharm. Sci. 2017, 106, 2312–2325. [Google Scholar] [CrossRef] [Green Version]
- Mandery, K.; Balk, B.; Bujok, K.; Schmidt, I.; Fromm, M.F.; Glaeser, H. Inhibition of hepatic uptake transporters by flavonoids. Eur. J. Pharm. Sci. 2012, 46, 79–85. [Google Scholar] [CrossRef]
- Letschert, K.; Faulstich, H.; Keller, D.; Keppler, D. Molecular characterization and inhibition of amanitin uptake into human hepatocytes. Toxicol. Sci. 2006, 91, 140–149. [Google Scholar] [CrossRef] [PubMed] [Green Version]
- Wang, J.; Gan, C.; Qi, X.; Lebre, M.C.; Schinkel, A.H. Human Organic Anion Transporting Polypeptide (OATP) 1B3 and Mouse OATP1A/1B Affect Liver Accumulation of Ochratoxin A in Mice. Toxicol. Appl. Pharmacol. 2020, 401, 115072. [Google Scholar] [CrossRef]
- König, J.; Cui, Y.; Nies, A.T.; Keppler, D. A Novel Human Organic Anion Transporting Polypeptide Localized to the Basolateral Hepatocyte Membrane. Am. J. Physiol. Gastrointest. Liver Physiol. 2000, 278, G156–G164. [Google Scholar] [CrossRef] [PubMed]
- Nakanishi, T.; Tamai, I. Genetic Polymorphisms of OATP Transporters and Their Impact on Intestinal Absorption and Hepatic Disposition of Drugs. Drug Metab. Pharmacokinet. 2012, 27, 106–121. [Google Scholar] [CrossRef] [PubMed]
- Urquhart, B.L.; Kim, R.B. Blood-brain Barrier Transporters and Response to CNS active Drugs. Eur. J. Clin. Pharmacol. 2009, 65, 1063–1070. [Google Scholar] [CrossRef]
- Shitara, Y.; Maeda, K.; Ikejiri, K.; Yoshida, K.; Horie, T.; Sugiyama, Y. Clinical Significance of Organic Anion Transporting Polypeptides (OATPs) in Drug Disposition: Their Roles in Hepatic Clearance and Intestinal Absorption. Biopharm. Drug Dispos. 2013, 34, 45–78. [Google Scholar] [CrossRef]
- Wu, L.-X.; Guo, C.-X.; Qu, Q.; Yu, J.; Chen, W.-Q.; Wang, G.; Fan, L.; Li, Q.; Zhang, W.; Zhou, H.-H. Effects of natural products on the function of human organic anion transporting polypeptide 1B1. Xenobiotica 2011, 42, 339–348. [Google Scholar] [CrossRef]
- Mandery, K.; Bujok, K.; Schmidt, I.; Keiser, M.; Siegmund, W.; Balk, B.; König, J.; Fromma, M.F.; Glaeser, H. Influence of the flavonoids apigenin, kaempferol, and quercetin on the function of organic anion transporting polypeptides 1A2 and 2B1. Biochem. Pharmacol. 2010, 80, 1746–1753. [Google Scholar] [CrossRef] [Green Version]
- Glaeser, H.; Bujok, K.; Schmidt, I.; Fromm, M.F.; Mandery, K. Organic anion transporting polypeptides and organic cation transporter 1 contribute to the cellular uptake of the flavonoid quercetin. Naunyn Schmiedebergs Arch. Pharmacol. 2014, 387, 883–891. [Google Scholar] [CrossRef]
- Duan, J.; Xie, Y.; Luo, H.; Li, G.; Wu, T.; Zhang, T. Transport characteristics of isorhamnetin across intestinal Caco-2 cell monolayers and the effects of transporters on it. Food Chem. Toxicol. 2014, 66, 313–320. [Google Scholar] [CrossRef]
- Fuchikami, H.; Satoh, H.; Tsujimoto, M.; Ohdo, S.; Ohtani, H.; Sawada, Y. Effects of Herbal Extracts on the Function of Human Organic Anion-Transporting Polypeptide OATP-B. Drug Metab. Dispos. 2006, 34, 577–582. [Google Scholar] [CrossRef] [PubMed] [Green Version]
- Roth, M.; Araya, J.J.; Timmermann, B.N.; Hagenbuch, B. Isolation of Modulators of the Liver-Specific Organic Anion-Transporting Polypeptides (OATPs) 1B1 and 1B3 From Rollinia Emarginata Schlecht (Annonaceae). J. Pharmacol. Exp. Ther. 2011, 339, 624–632. [Google Scholar] [CrossRef] [PubMed] [Green Version]
- Szakács, G.; Váradi, A.; Ozvegy-Laczka, C.; Sarkadi, B. The Role of ABC Transporters in Drug Absorption, Distribution, Metabolism, Excretion and Toxicity (ADME-Tox). Drug Discov. Today 2008, 13, 379–393. [Google Scholar] [CrossRef] [PubMed]
- Sarkadi, B.; Homolya, L.; Szakács, G.; Váradi, A. Human Multidrug Resistance ABCB and ABCG Transporters: Participation in a Chemoimmunity Defense System. Physiol. Rev. 2006, 86, 1179–1236. [Google Scholar] [CrossRef] [PubMed]
- Jetter, A.; Kullak-Ublic, G.A. Drugs and hepatic transporters: A review. Pharmacol. Res. 2020, 154, 104234. [Google Scholar] [CrossRef] [PubMed]
- Marquez, B.; Van Bambeke, F. ABC Multidrug Transporters: Target for Modulation of Drug Pharmacokinetics and Drug-Drug Interactions. Curr. Drug Targets 2011, 12, 600–620. [Google Scholar] [CrossRef]
- Wlcek, K.; Stieger, B. ATP-binding Cassette Transporters in Liver. Biofactors 2013, 40, 188–198. [Google Scholar] [CrossRef]
- Alvarez, A.I.; Real, R.; Pérez, M.; Mendoza, G.; Prieto, J.G.; Merino, G. Modulation of the Activity of ABC Transporters (P-glycoprotein, MRP2, BCRP) by Flavonoids and Drug Response. J. Pharm. Sci. 2010, 99, 598–617. [Google Scholar] [CrossRef]
- Ahmed-Belkacem, A.; Pozza, A.; Muñoz-Martínez, F.; Bates, S.E.; Castanys, S.; Gamarro, F.; Di Pietro, A.; Pérez-Victoria, J.M. Flavonoid Structure-Activity Studies Identify 6-prenylchrysin and Tectochrysin as Potent and Specific Inhibitors of Breast Cancer Resistance Protein ABCG2. Cancer Res. 2005, 65, 4852–4860. [Google Scholar] [CrossRef] [Green Version]
- Morris, M.E.; Zhang, S. Flavonoid-drug Interactions: Effects of Flavonoids on ABC Transporters. Life Sci. 2006, 78, 2116–2130. [Google Scholar] [CrossRef]
- An, G.; Gallegos, J.; Morris, M.E. The Bioflavonoid Kaempferol Is an Abcg2 Substrate and Inhibits Abcg2-mediated Quercetin Efflux. Drug Metab. Dispos. 2011, 39, 426–432. [Google Scholar] [CrossRef] [PubMed] [Green Version]
- Sesink, A.L.A.; Arts, I.C.W.; De Boer, V.C.J.; Breedveld, P.; Schellens, J.H.M.; Hollman, P.C.H.; Russel, F.G.M. Breast Cancer Resistance Protein (Bcrp1/Abcg2) Limits Net Intestinal Uptake of Quercetin in Rats by Facilitating Apical Efflux of Glucuronides. Mol. Pharmacol. 2005, 67, 1999–2006. [Google Scholar] [CrossRef] [PubMed] [Green Version]
- Chabane, M.N.; Al Ahmad, A.; Peluso, J.; Muller, C.D.; Ubeaud-Séquier, G. Quercetin and naringenin transport across human intestinal Caco-2 cells. J. Pharm. Pharmacol. 2009, 61, 1473–1483. [Google Scholar] [CrossRef]
- Van Zanden, J.J.; Van der Woude, H.; Vaessen, J.; Usta, M.; Wortelboer, H.M.; Cnubben, N.H.P.; Rietjens, I.M.C.M. The Effect of Quercetin Phase II Metabolism on Its MRP1 and MRP2 Inhibiting Potential. Biochem. Pharmacol. 2007, 15, 345–351. [Google Scholar] [CrossRef]
- Moon, Y.J.; Morris, M.E. Pharmacokinetics and Bioavailability of the Bioflavonoid Biochanin A: Effects of Quercetin and EGCG on Biochanin A Disposition in Rats. Mol. Pharm. 2007, 4, 865–872. [Google Scholar] [CrossRef]
- Needs, P.W.; Kroon, P.A. Convenient synthesis of metabolically important glucuronides and sulfates. Tetrahedron 2006, 62, 6862–6868. [Google Scholar] [CrossRef]
- Fliszár-Nyúl, E.; Mohos, V.; Bencsik, T.; Lemli, B.; Kunsági-Máté, S.; Poór, M. Interactions of 7,8-Dihydroxyflavone with Serum Albumin as well as with CYP2C9, CYP2C19, CYP3A4, and Xanthine Oxidase Biotransformation Enzymes. Biomolecules 2019, 9, 655. [Google Scholar] [CrossRef] [Green Version]
- Mohos, V.; Bencsik, T.; Boda, G.; Fliszár-Nyúl, E.; Lemli, B.; Kunsági-Máté, S.; Poór, M. Interactions of casticin, ipriflavone, and resveratrol with serum albumin and their inhibitory effects on CYP2C9 and CYP3A4 enzymes. Biomed. Pharmacother. 2018, 107, 777–784. [Google Scholar] [CrossRef]
- Mohos, V.; Fliszár-Nyúl, E.; Ungvári, O.; Bakos, É.; Kuffa, K.; Bencsik, T.; Zsidó, B.Z.; Hetényi, C.; Telbisz, Á.; Özvegy-Laczka, C.; et al. Effects of chrysin and its major conjugated metabolites chrysin-7-sulfate and chrysin-7-glucuronide on cytochrome P450 enzymes, and on OATP, P-gp, BCRP and MRP2 transporters. Drug Metab. Dispos. 2020. accepted. [Google Scholar] [CrossRef]
- Patik, I.; Székely, V.; Német, O.; Szepesi, Á.; Kucsma, N.; Várady, G.; Szakács, G.; Bakos, É.; Özvegy-Laczka, C. Identification of Novel Cell-Impermeant Fluorescent Substrates for Testing the Function and Drug Interaction of Organic Anion Transporting Polypeptides, OATP1B1/1B3 and 2B1. Sci. Rep. 2018, 8, 2630. [Google Scholar] [CrossRef] [Green Version]
- Bakos, É.; Német, O.; Patik, I.; Kucsma, N.; Várady, G.; Szakács, G.; Özvegy-Laczka, C. A Novel Fluorescence-Based Functional Assay for Human OATP1A2 and OATP1C1 Identifies Interaction between Third-Generation P-gp Inhibitors and OATP1A2. FEBS J. 2020, 287, 2468–2485. [Google Scholar] [CrossRef] [PubMed]
- Székely, V.; Patik, I.; Ungvári, O.; Telbisz, Á.; Szakács, G.; Bakos, É.; Özvegy-Laczka, C. Fluorescent Probes for the Dual Investigation of MRP2 and OATP1B1 Function and Drug Interactions. Eur. J. Pharm. Sci. 2020, 151, 105395. [Google Scholar] [CrossRef] [PubMed]
- Sarkadi, B.; Price, E.M.; Boucher, R.C.; Germann, U.A.; Scarborough, G.A. Expression of the Human Multidrug Resistance cDNA in Insect Cells Generates a High Activity Drug-Stimulated Membrane ATPase. J. Biol. Chem. 1992, 267, 4854–4858. [Google Scholar] [PubMed]
- Bodó, A.; Bakos, E.; Szeri, F.; Váradi, A.; Sarkadi, B. The Role of Multidrug Transporters in Drug Availability, Metabolism and Toxicity. Toxicol. Lett. 2003, 140, 133–143. [Google Scholar] [CrossRef]
- Ozvegy, C.; Litman, T.; Szakács, G.; Nagy, Z.; Bates, S.; Váradi, A.; Sarkadi, B. Functional Characterization of the Human Multidrug Transporter, ABCG2, Expressed in Insect Cells. Biochem. Biophys. Res. Commun. 2001, 285, 111–117. [Google Scholar] [CrossRef]
- Ozvegy, C.; Váradi, A.; Sarkadi, B. Characterization of Drug Transport, ATP Hydrolysis, and Nucleotide Trapping by the Human ABCG2 Multidrug Transporter. Modulation of Substrate Specificity by a Point Mutation. J. Biol. Chem. 2002, 277, 47980–47990. [Google Scholar] [CrossRef] [Green Version]
- Telbisz, A.; Müller, M.; Ozvegy-Laczka, C.; Homolya, L.; Szente, L.; Váradi, A.; Sarkadi, B. Membrane Cholesterol Selectively Modulates the Activity of the Human ABCG2 Multidrug Transporter. Biochim. Biophys. Acta 2007, 1768, 2698–2713. [Google Scholar] [CrossRef] [Green Version]
- Nguyen, M.A.; Staubach, P.; Wolffram, S.; Langguth, P. The Influence of Single-Dose and Short-Term Administration of Quercetin on the Pharmacokinetics of Midazolam in Humans. J. Pharm. Sci. 2015, 104, 3199–3207. [Google Scholar] [CrossRef]
- Kim, K.-A.; Park, P.-W.; Park, J.-Y. Short-term Effect of Quercetin on the Pharmacokinetics of Fexofenadine, a Substrate of P-glycoprotein, in Healthy Volunteers. Eur. J. Clin. Pharmacol. 2009, 65, 609–614. [Google Scholar] [CrossRef]
- Nguyen, M.A.; Staubach, P.; Wolffram, S.; Langguth, P. Effect of single-dose and short-term administration of quercetin on the pharmacokinetics of talinolol in humans-Implications for the evaluation of transporter-mediated flavonoid-drug interactions. Eur. J. Pharm. Sci. 2014, 61, 54–60. [Google Scholar] [CrossRef]
- He, N.; Xie, H.-G.; Collins, X.; Edeki, T.; Yan, Z. Effects of individual ginsenosides, ginkgolides and flavonoids on cyp2c19 and cyp2d6 activity in human liver microsomes. Clin. Exp. Pharmacol. Physiol. 2006, 33, 813–815. [Google Scholar] [CrossRef] [PubMed]
- Cao, L.; Kwara, A.; Greenblatt, D.J. Metabolic interactions between acetaminophen (paracetamol) and two flavonoids, luteolin and quercetin, through in-vitro inhibition studies. J. Pharm. Pharmacol. 2017, 69, 1762–1772. [Google Scholar] [CrossRef] [PubMed]
- Sharma, R.; Gatchie, L.; Williams, I.S.; Jain, S.K.; Vishwakarma, R.A.; Chaudhuri, B.; Bharate, S.B. Glycyrrhiza glabra extract and quercetin reverses cisplatin resistance in triple-negative MDA-MB-468 breast cancer cells via inhibition of cytochrome P450 1B1 enzyme. Bioorg. Med. Chem. Lett. 2017, 27, 5400–5403. [Google Scholar] [CrossRef]
- Ekstrand, B.; Rasmussen, M.K.; Woll, F.; Zlabek, V.; Zamaratskaia, G. In Vitro Gender-Dependent Inhibition of Porcine Cytochrome P450 Activity by Selected Flavonoids and Phenolic Acids. BioMed Res. Int. 2015, 2015, 387918. [Google Scholar] [CrossRef] [Green Version]
- Östlund, J.; Zlabek, V.; Zamaratskaia, G. In vitro inhibition of human CYP2E1 and CYP3A by quercetin and myricetin in hepatic microsomes is not gender dependent. Toxicology 2017, 381, 10–18. [Google Scholar] [CrossRef] [PubMed]
- Bojic, M.; Kondža, M.; Rimac, H.; Benkovic, G.; Maleš, Ž. The Effect of Flavonoid Aglycones on the CYP1A2, CYP2A6, CYP2C8 and CYP2D6 Enzymes Activity. Molecules 2019, 24, 3174. [Google Scholar] [CrossRef] [PubMed] [Green Version]
- Bedada, S.K.; Neerati, P. Evaluation of the Effect of Quercetin Treatment on CYP2C9 Enzyme Activity of Diclofenac in Healthy Human Volunteers. Phytother. Res. 2018, 32, 305–311. [Google Scholar] [CrossRef]
- Mohos, V.; Pánovics, A.; Fliszár-Nyúl, E.; Schilli, G.; Hetényi, C.; Mladěnka, P.; Needs, P.W.; Kroon, P.A.; Pethő, G.; Poór, M. Inhibitory Effects of Quercetin and Its Human and Microbial Metabolites on Xanthine Oxidase Enzyme. Int. J. Mol. Sci. 2019, 20, 2681. [Google Scholar] [CrossRef] [Green Version]
- Janisch, K.M.; Williamson, G.; Needs, P.; Plumb, G.W. Properties of Quercetin Conjugates: Modulation of LDL Oxidation and Binding to Human Serum Albumin. Free Radic. Res. 2004, 38, 877–884. [Google Scholar] [CrossRef]
- Wong, C.C.; Akiyama, Y.; Abe, T.; Lippiat, J.D.; Orfila, C.; Williamson, G. Carrier-mediated transport of quercetin conjugates: Involvement of organic anion transporters and organic anion transporting polypeptides. Biochem. Pharmac. 2012, 84, 564–570. [Google Scholar] [CrossRef]
- Notas, G.; Nifli, A.-P.; Kampa, M.; Pelekanou, V.; Alexaki, V.-I.; Theodoropoulos, P.; Vercauteren, J.; Castanas, E. Quercetin accumulates in nuclear structures and triggers specific gene expression in epithelial cells. J. Nutr. Biochem. 2012, 23, 656–666. [Google Scholar] [CrossRef] [PubMed]
- O’Leary, K.A.; Day, A.J.; Needs, P.W.; Mellon, F.A.; O’Brien, N.M.; Williamson, G. Metabolism of quercetin-7- and quercetin-3-glucuronides by an in vitro hepatic model: The role of human β-glucuronidase, sulfotransferase, catechol-O-methyltransferase and multi-resistant protein 2 (MRP2) in flavonoid metabolism. Biochem. Pharmacol. 2003, 65, 479–491. [Google Scholar] [CrossRef]
- Wu, L.-X.; Guo, C.-X.; Chen, W.-Q.; Yu, J.; Qu, Q.; Chen, Y.; Tan, Z.-R.; Wang, G.; Fan, L.; Li, Q.; et al. Inhibition of the organic anion-transporting polypeptide 1B1 by quercetin: An in vitro and in vivo assessment. Br. J. Clin. Pharmacol. 2011, 73, 750–757. [Google Scholar] [CrossRef] [PubMed] [Green Version]
- Chen, C.; Zhou, J.; Ji, C. Quercetin: A Potential Drug to Reverse Multidrug Resistance. Life Sci. 2010, 87, 333–338. [Google Scholar] [CrossRef] [PubMed]
- Rozanski, M.; Studzian, M.; Pulaski, L. Direct Measurement of Kinetic Parameters of ABCG2-Dependent Transport of Natural Flavonoids Using a Fluorogenic Substrate. J. Pharmacol. Exp. Ther. 2019, 371, 309–319. [Google Scholar] [CrossRef] [PubMed]
- Williamson, G.; Aeberli, I.; Miguet, L.; Zhang, Z.; Sanchez, M.-B.; Crespy, V.; Barron, D.; Needs, P.; Kroon, P.A.; Glavinas, H.; et al. Interaction of Positional Isomers of Quercetin Glucuronides With the Transporter ABCC2 (cMOAT, MRP2). Drug Metab. Dispos. 2007, 35, 1262–1268. [Google Scholar] [CrossRef]
- Youdim, K.A.; Qaiser, M.Z.; Begley, D.J.; Rice-Evans, C.A.; Abbott, N.J. Flavonoid Permeability Across an in Situ Model of the Blood-Brain Barrier. Free Radic. Biol. Med. 2004, 36, 592–604. [Google Scholar] [CrossRef]
- Zhang, S.; Yang, X.; Morris, M.E. Flavonoids Are Inhibitors of Breast Cancer Resistance Protein (ABCG2)-mediated Transport. Mol. Pharmacol. 2004, 65, 1208–1216. [Google Scholar] [CrossRef] [Green Version]


| Proteins | Q | Q3′S | Q3G | IR | I3G |
|---|---|---|---|---|---|
| IC50 (μM) | IC50 (μM) | IC50 (μM) | IC50 (μM) | IC50 (μM) | |
| CYP2C19 | >30.0 | >30.0 | >30.0 | >30.0 | >30.0 |
| CYP3A4 | >30.0 | >30.0 | >30.0 | >30.0 | >30.0 |
| OATP1A2 | 10.1 | 4.92 | >30.0 | >30.0 | >30.0 |
| OATP1B1 | 1.55 | 0.33 | 4.05 | 3.12 | 5.63 |
| OATP1B3 | 3.22 | 2.50 | 5.71 | 3.10 | 9.62 |
| OATP2B1 | 0.34 | 0.43 | 4.85 | 0.82 | 4.14 |
| BCRP | 0.13 | 3.20 | 13.5 | 0.06 | >30 |
| MRP2 | >30.0 | 19.6 | 24.2 | >30.0 | 14.9 |
© 2020 by the authors. Licensee MDPI, Basel, Switzerland. This article is an open access article distributed under the terms and conditions of the Creative Commons Attribution (CC BY) license (http://creativecommons.org/licenses/by/4.0/).
Share and Cite
Mohos, V.; Fliszár-Nyúl, E.; Ungvári, O.; Kuffa, K.; Needs, P.W.; Kroon, P.A.; Telbisz, Á.; Özvegy-Laczka, C.; Poór, M. Inhibitory Effects of Quercetin and Its Main Methyl, Sulfate, and Glucuronic Acid Conjugates on Cytochrome P450 Enzymes, and on OATP, BCRP and MRP2 Transporters. Nutrients 2020, 12, 2306. https://doi.org/10.3390/nu12082306
Mohos V, Fliszár-Nyúl E, Ungvári O, Kuffa K, Needs PW, Kroon PA, Telbisz Á, Özvegy-Laczka C, Poór M. Inhibitory Effects of Quercetin and Its Main Methyl, Sulfate, and Glucuronic Acid Conjugates on Cytochrome P450 Enzymes, and on OATP, BCRP and MRP2 Transporters. Nutrients. 2020; 12(8):2306. https://doi.org/10.3390/nu12082306
Chicago/Turabian StyleMohos, Violetta, Eszter Fliszár-Nyúl, Orsolya Ungvári, Katalin Kuffa, Paul W. Needs, Paul A. Kroon, Ágnes Telbisz, Csilla Özvegy-Laczka, and Miklós Poór. 2020. "Inhibitory Effects of Quercetin and Its Main Methyl, Sulfate, and Glucuronic Acid Conjugates on Cytochrome P450 Enzymes, and on OATP, BCRP and MRP2 Transporters" Nutrients 12, no. 8: 2306. https://doi.org/10.3390/nu12082306