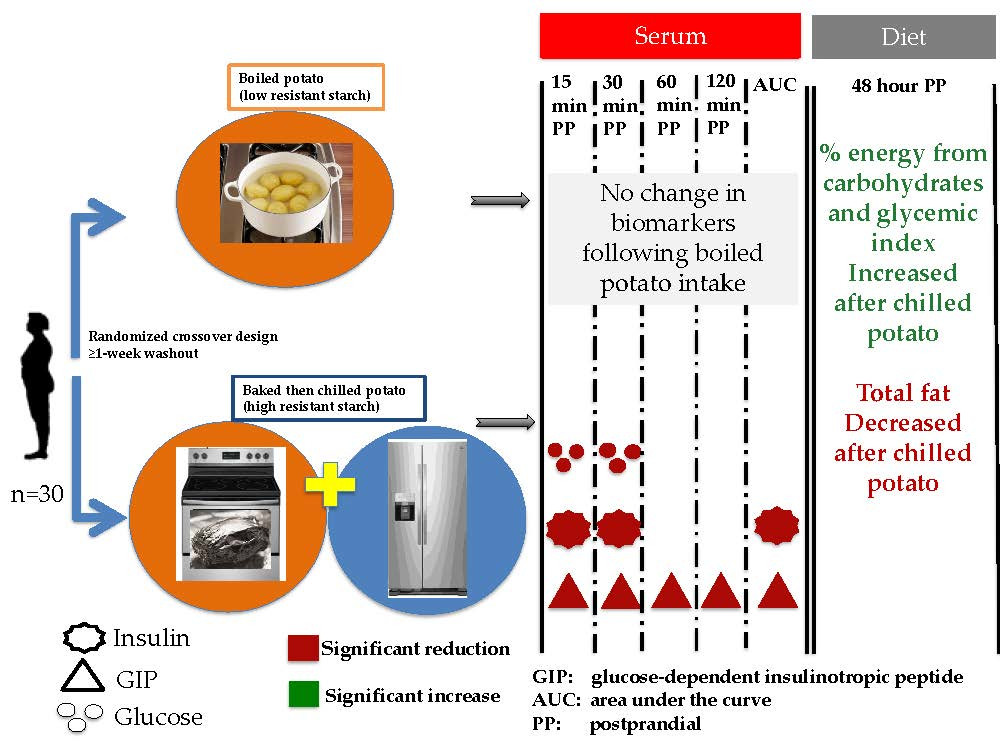
Chilled Potatoes Decrease Postprandial Glucose, Insulin, and Glucose-dependent Insulinotropic Peptide Compared to Boiled Potatoes in Females with Elevated Fasting Glucose and Insulin

 ,
,
Abstract
:
1. Introduction
2. Material and Methods
2.1. Study Design
2.2. Potato Preparation
2.3. Biomarker Analysis
2.4. Statistical Analysis
3. Results
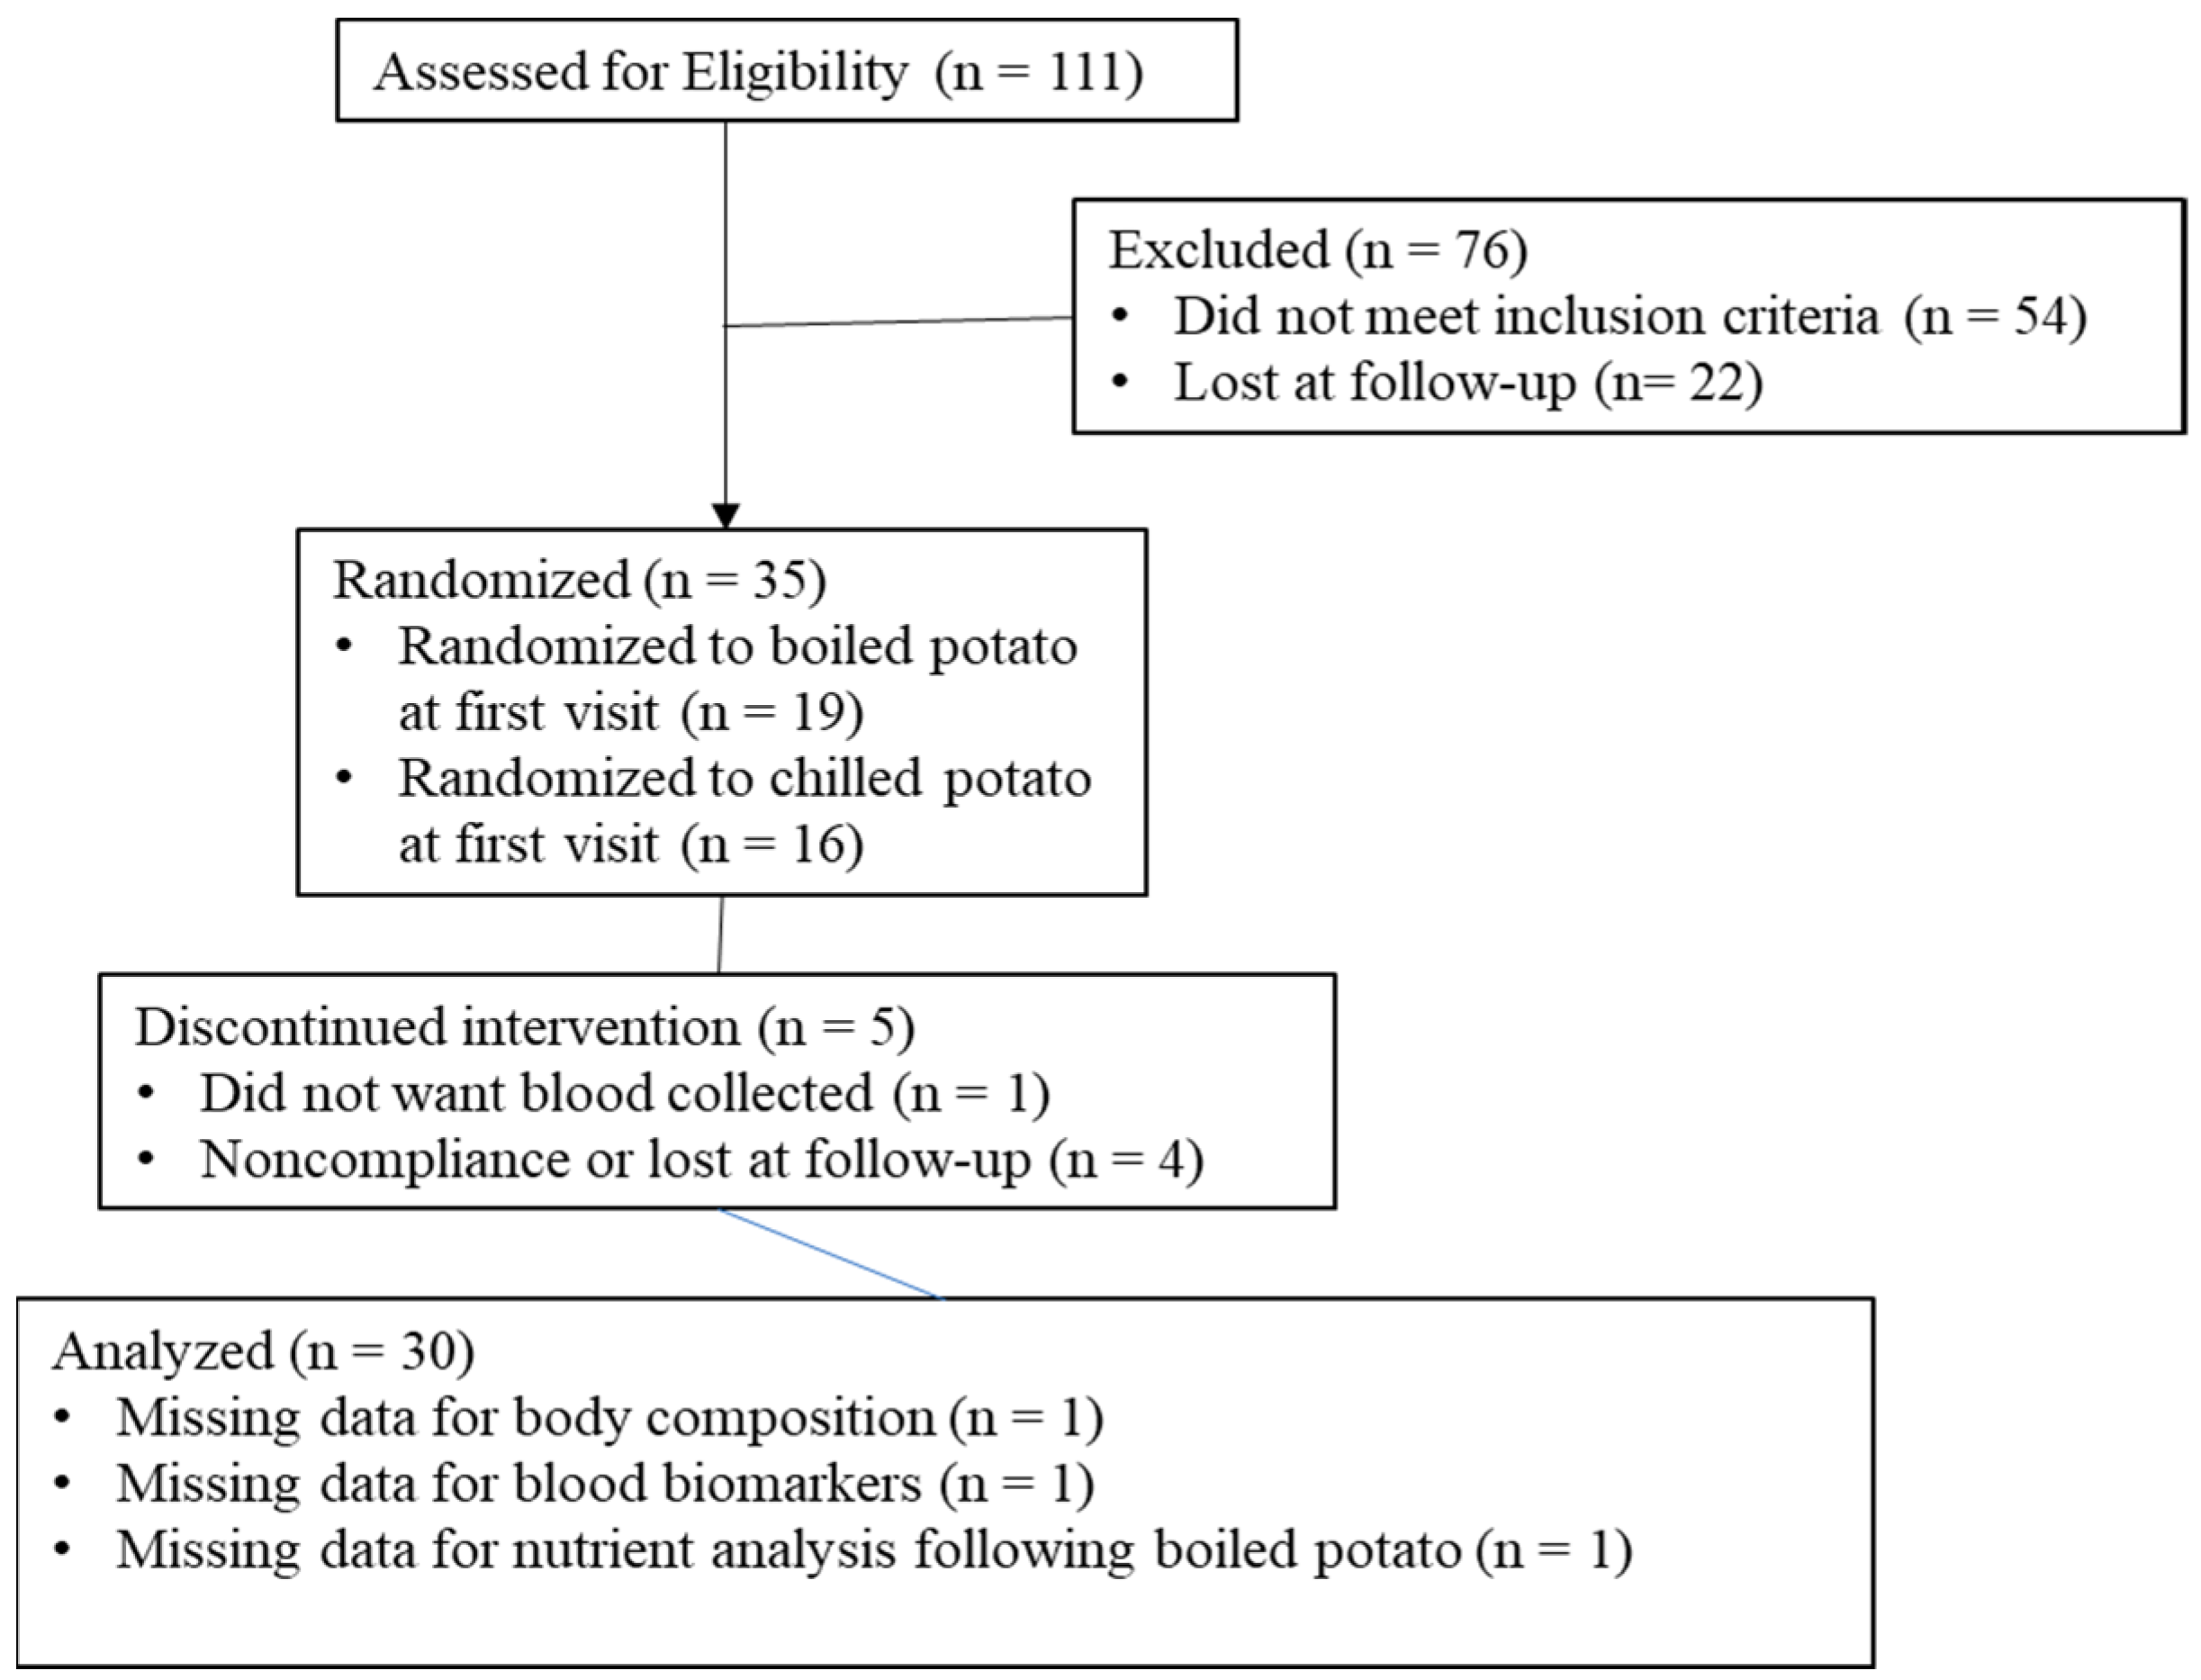
3.1. Subjects
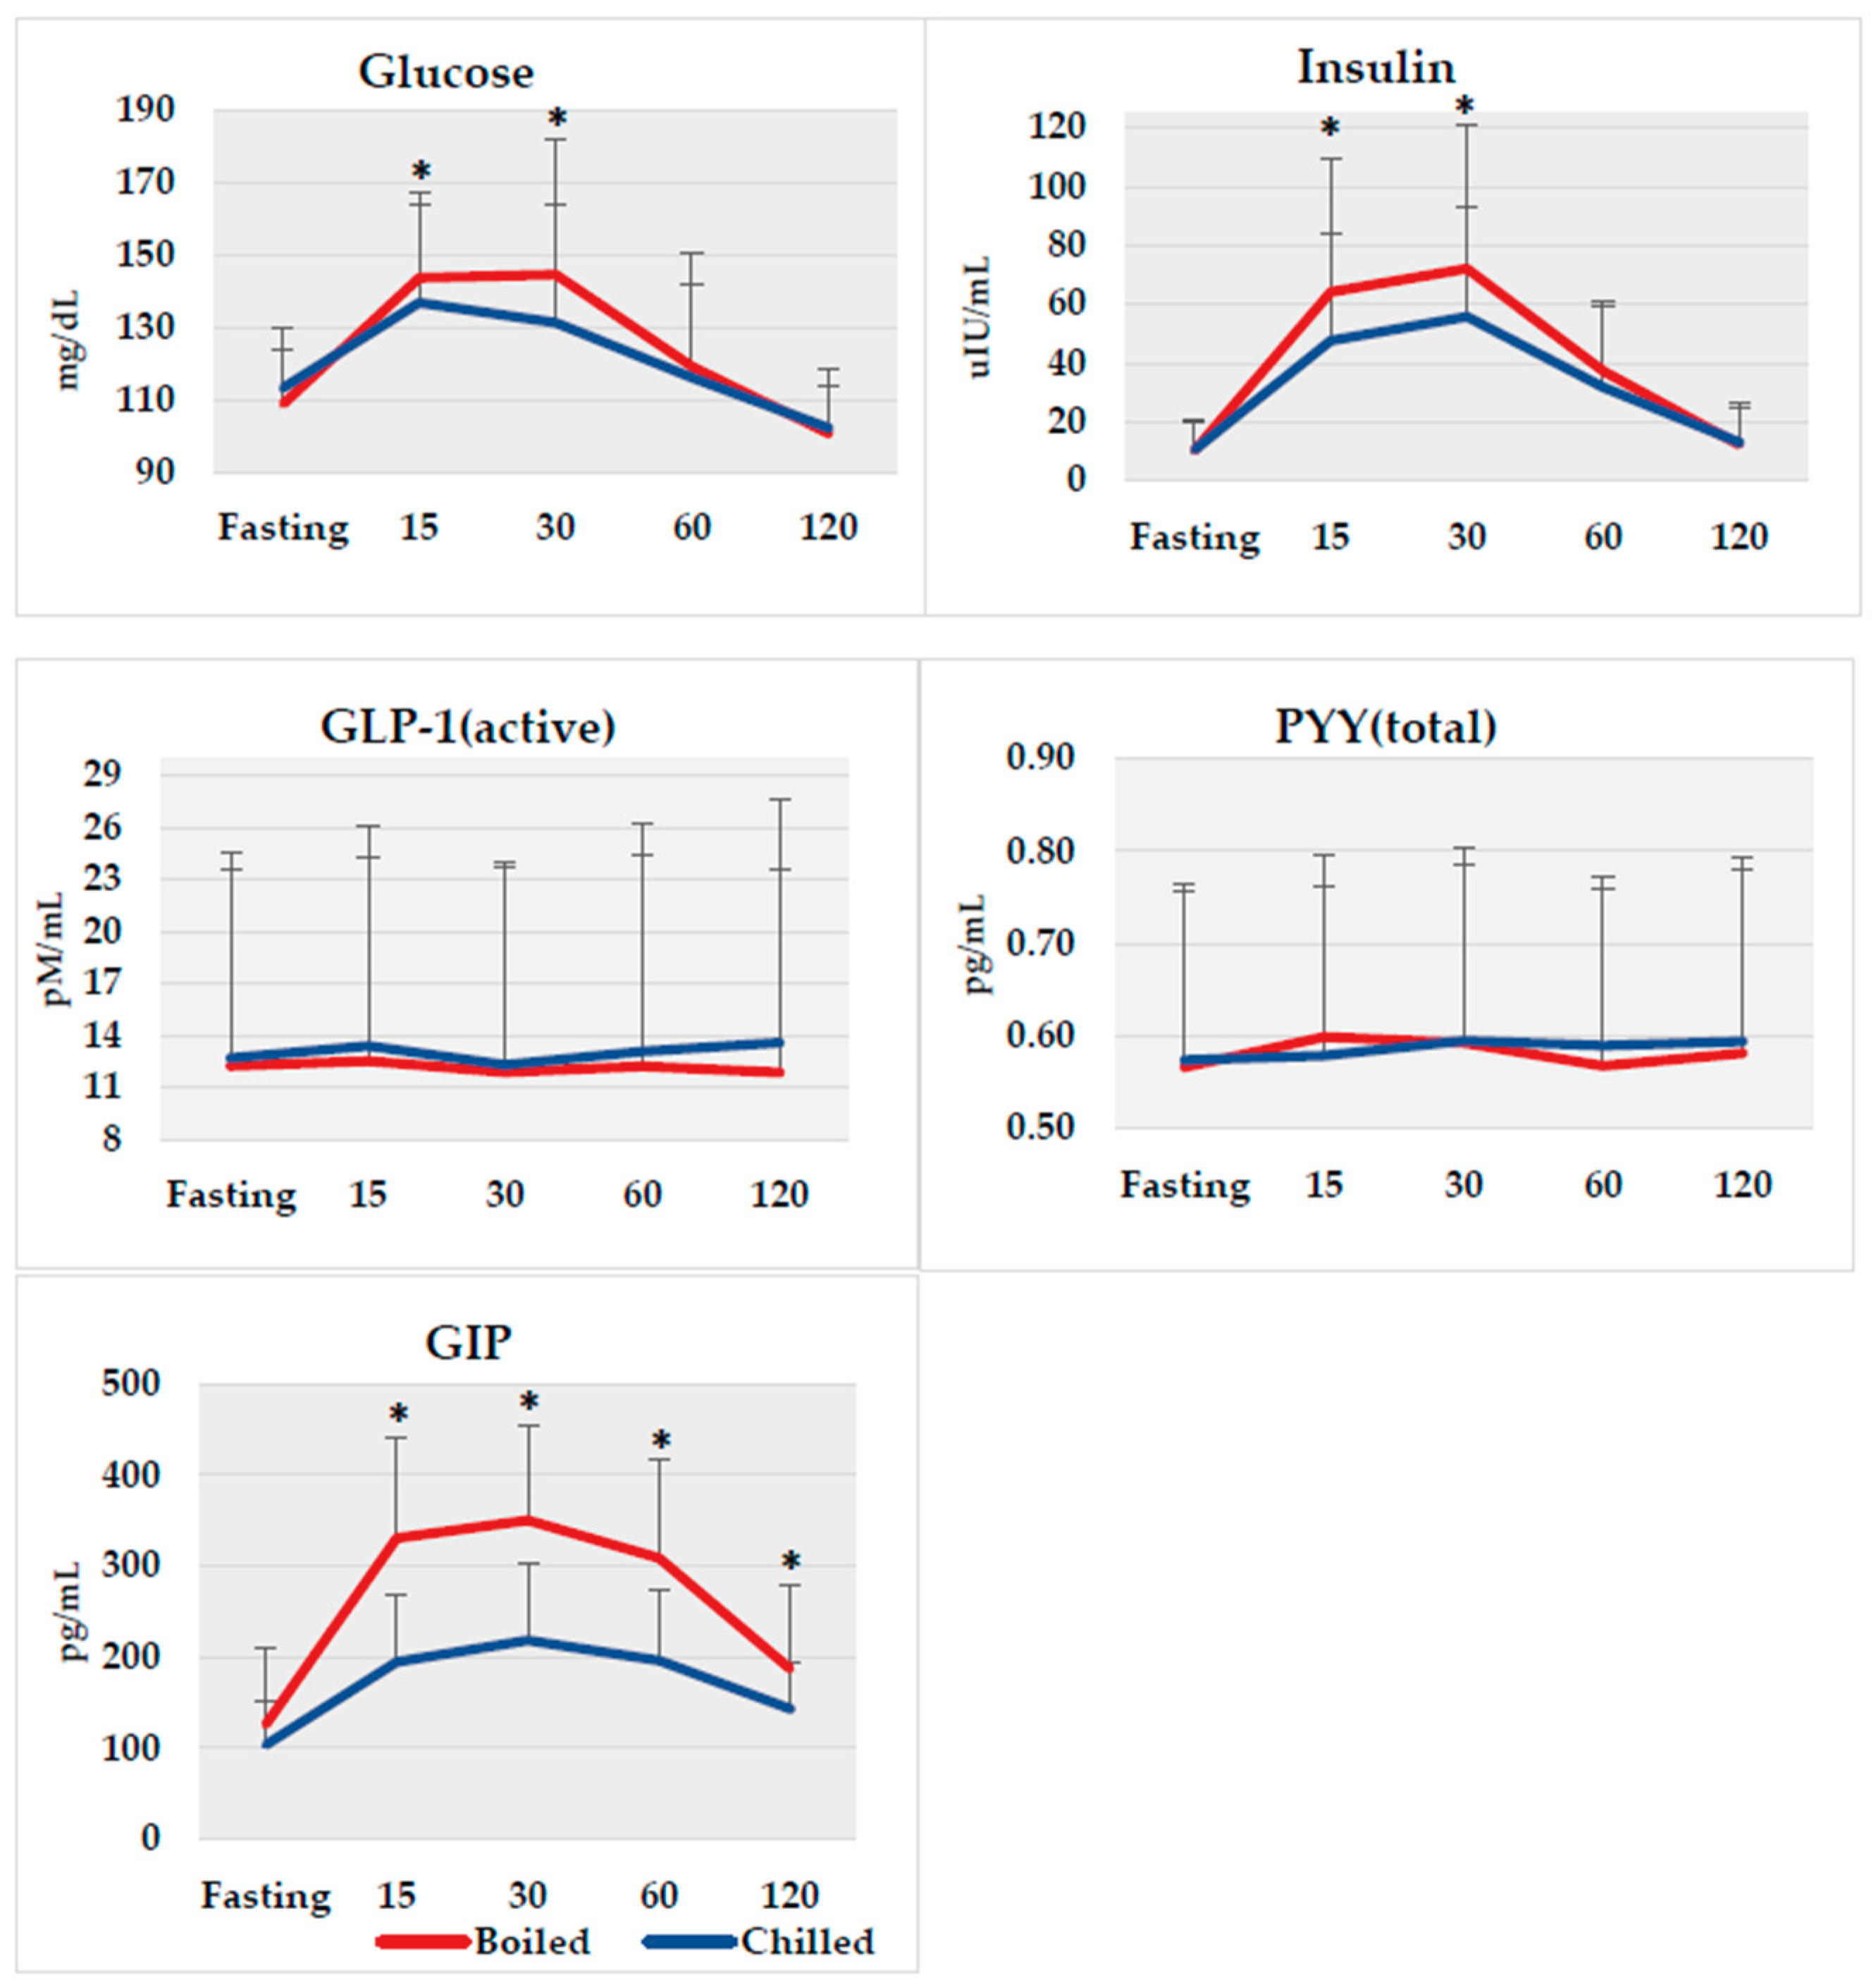
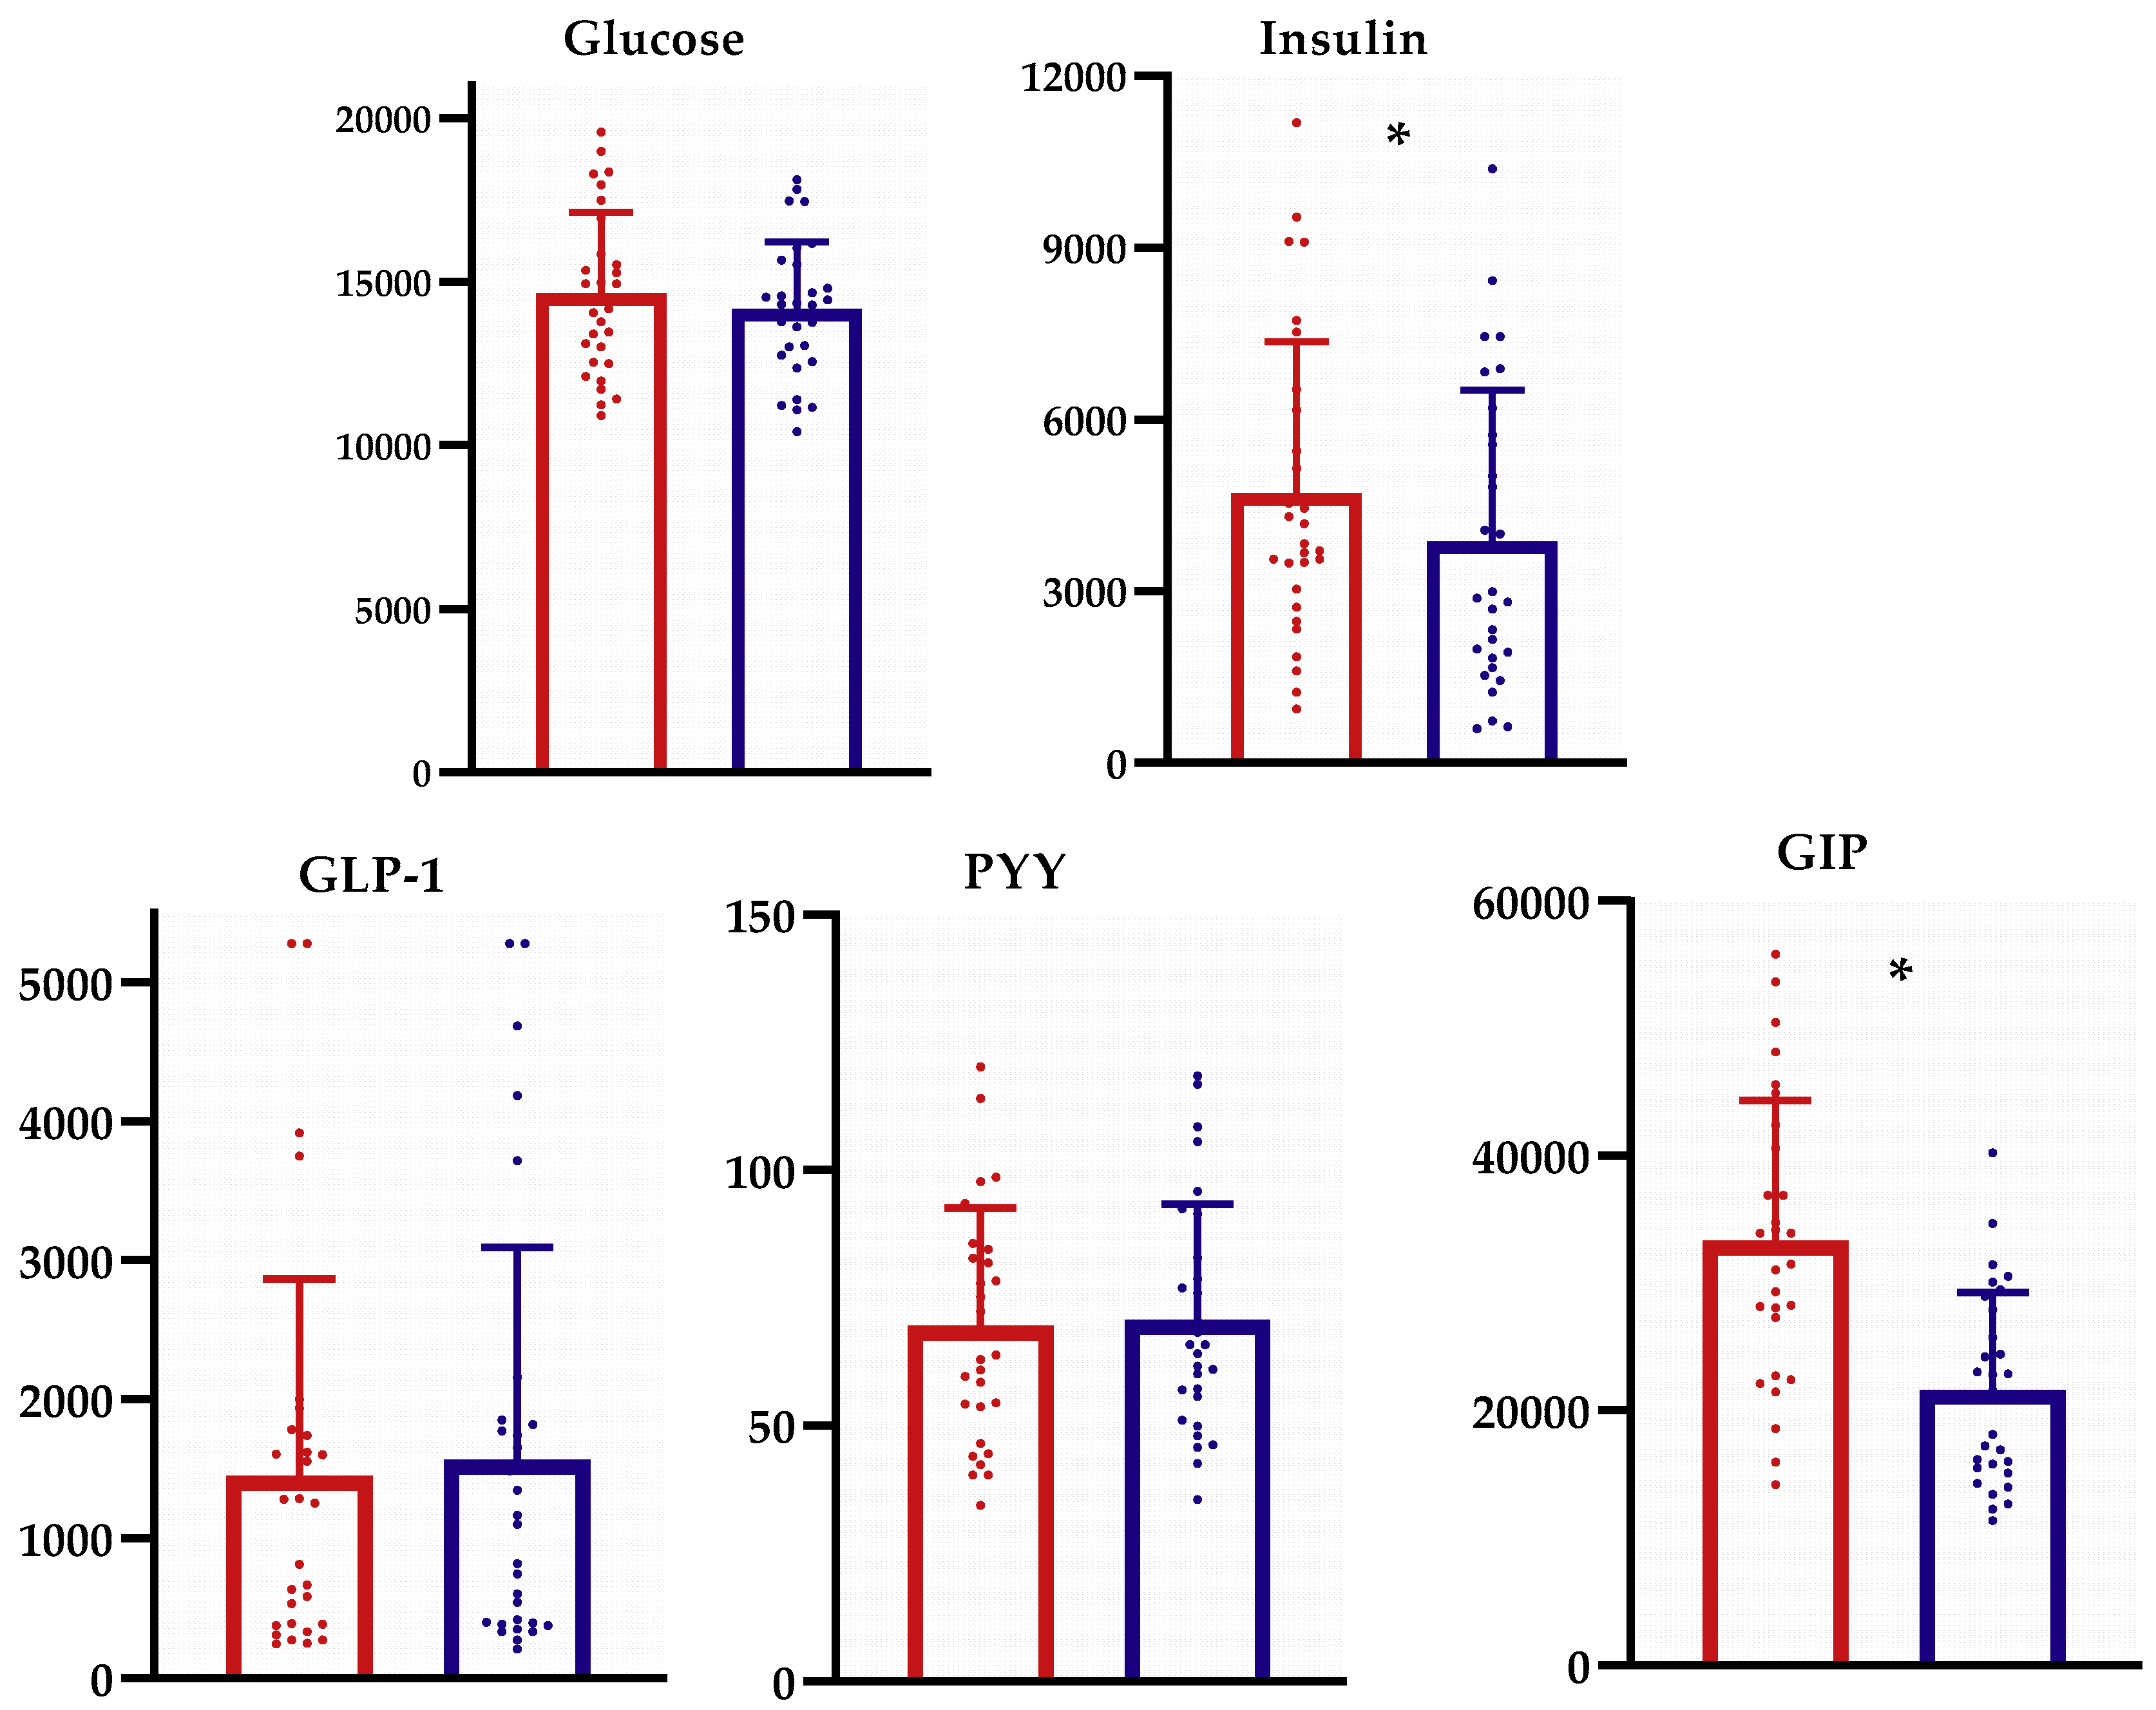
3.2. Biomarker Response between Groups
3.3. Relationship among Body Composition and Biomarker Response between Interventions
3.4. Dietary Intake Before and after each Intervention
3.5. Subjective Satiety
4. Discussion
5. Conclusions
Supplementary Materials
Author Contributions
Funding
Conflicts of Interest
References
- International Potato Center, Potato Facts and Figures. Available online: https://cipotato.org/crops/potato/potato-facts-and-figures/ (accessed on 21 June 2019).
- United States Department of Agriculture. Vegetable and Pulses Yearbook. Economic Research Service; United States Department of Agriculture: Washington, DC, USA, 2016.
- Birt, D.F.; Boylston, T.; Hendrich, S.; Jane, J.L.; Hollis, J.; Li, L.; McClelland, J.; Moore, S.; Phillips, G.J.; Rowling, M.; et al. Resistant starch: Promise for improving human health. Adv. Nutr. 2013, 4, 587–601. [Google Scholar] [CrossRef] [PubMed]
- Patterson, M.A.; Maiya, M.; Stewart, M.L. Resistant starch intake in foods consumed in the United States: A Narrative Review. J. Acad. Nutr. Diet. 2019. Unpublished data. [Google Scholar]
- Fuentes-Zaragoza, E.; Riquelme-Navarrete, M.; Sánchez-Zapata, E.; Pérez-Álvarez, J. Resistant starch as functional ingredient: A review. Food Res. Int. 2010, 43, 931–942. [Google Scholar] [CrossRef]
- Topping, D.L.; Clifton, P.M. Short-chain fatty acids and human colonic function: Roles of resistant starch and nonstarch polysaccharides. Physiol. Rev. 2001, 81, 1031–1064. [Google Scholar] [CrossRef] [PubMed]
- Psichas, A.; Sleeth, M.L.; Murphy, K.G.; Brooks, L.; Bewick, G.A.; Hanyaloglu, A.C.; Ghatei, M.A.; Bloom, S.R.; Frost, G. The short chain fatty acid propionate stimulates GLP-1 and PYY secretion via free fatty acid receptor 2 in rodents. Int. J. Obes. (Lond.) 2015, 39, 424–429. [Google Scholar] [CrossRef] [PubMed]
- Tolhurst, G.; Heffron, H.; Lam, Y.S.; Parker, H.E.; Habib, A.M.; Diakogiannaki, E.; Cameron, J.; Grosse, J.; Reimann, F.; Gribble, F.M. Short-chain fatty acids stimulate glucagon-like peptide-1 secretion via the G-protein-coupled receptor FFAR2. Diabetes 2012, 61, 364–371. [Google Scholar] [CrossRef] [PubMed]
- MacNeil, S.; Rebry, R.M.; Tetlow, I.J.; Emes, M.J.; McKeown, B.; Graham, T.E. Resistant starch intake at breakfast affects postprandial responses in type 2 diabetics and enhances the glucose-dependent insulinotropic polypeptide--insulin relationship following a second meal. Appl. Physiol. Nutr. Metab. 2013, 38, 1187–1195. [Google Scholar] [CrossRef]
- Batterham, R.L.; Cowley, M.A.; Small, C.J.; Herzog, H.; Cohen, M.A.; Dakin, C.L.; Wren, A.M.; Brynes, A.E.; Low, M.J.; Ghatei, M.A.; et al. Gut hormone PYY(3–36) physiologically inhibits food intake. Nature 2002, 418, 650–654. [Google Scholar] [CrossRef]
- Maziarz, M.P.; Preisendanz, S.; Juma, S.; Imrhan, V.; Prasad, C.; Vijayagopal, P. Resistant starch lowers postprandial glucose and leptin in overweight adults consuming a moderate-to-high-fat diet: A randomized-controlled trial. Nutr. J. 2017, 16, 14. [Google Scholar] [CrossRef]
- Maki, K.C.; Pelkman, C.L.; Finocchiaro, E.T.; Kelley, K.M.; Lawless, A.L.; Schild, A.L.; Rains, T.M. Resistant starch from high-amylose maize increases insulin sensitivity in overweight and obese men. J. Nutr. 2012, 142, 717–723. [Google Scholar] [CrossRef]
- Robertson, M.D.; Wright, J.W.; Loizon, E.; Debard, C.; Vidal, H.; Shojaee-Moradie, F.; Russell-Jones, D.; Umpleby, A.M. Insulin-sensitizing effects on muscle and adipose tissue after dietary fiber intake in men and women with metabolic syndrome. J. Clin. Endocrinol. Metab. 2012, 97, 3326–3332. [Google Scholar] [CrossRef] [PubMed]
- Stewart, M.L.; Wilcox, M.L.; Bell, M.; Buggia, M.A.; Maki, K.C. Type-4 Resistant Starch in Substitution for Available Carbohydrate Reduces Postprandial Glycemic Response and Hunger in Acute, Randomized, Double-Blind, Controlled Study. Nutrients 2018, 10, 129. [Google Scholar] [CrossRef] [PubMed]
- Al-Mana, N.M.; Robertson, M.D. Acute Effect of Resistant Starch on Food Intake, Appetite and Satiety in Overweight/Obese Males. Nutrients 2018, 10, 1993. [Google Scholar] [CrossRef]
- Emilien, C.H.; Hsu, W.H.; Hollis, J.H. Effect of resistant wheat starch on subjective appetite and food intake in healthy adults. Nutrition 2017, 43, 69–74. [Google Scholar] [CrossRef] [PubMed]
- Nayak, B.; De, J.; Berrios, J.; Tang, J. Impact of food processing on the glycemic index (GI) of potato products. Food Res. Int. 2014, 56, 35–46. [Google Scholar] [CrossRef]
- Reader, D.; Johnson, M.L.; Hollander, P.; Franz, M. Response of resistant starch in a food bar vs. two commercially available bars in persons with type II diabetes mellitus. Diabetes 1997, 46, 254. [Google Scholar]
- Flint, A.; Raben, A.; Blundell, J.E.; Astrup, A. Reproducibility, power and validity of visual analogue scales in assessment of appetite sensations in single test meal studies. Int. J. Obes. Relat. Metab. Disord. 2000, 24, 38–48. [Google Scholar] [CrossRef] [Green Version]
- Raatz, S.K.; Idso, L.; Johnson, L.K.; Jackson, M.I.; Combs, G.F. Resistant starch analysis of commonly consumed potatoes: Content varies by cooking method and service temperature but not by variety. Food Chem. 2016, 208, 297–300. [Google Scholar] [CrossRef] [Green Version]
- Zhou, J.; Martin, R.J.; Raggio, A.M.; Shen, L.; McCutcheon, K.; Keenan, M.J. The importance of GLP-1 and PYY in resistant starch’s effect on body fat in mice. Mol. Nutr. Food Res. 2015, 59, 1000–1003. [Google Scholar] [CrossRef]
- Ma, T.; Lee, C.D. Effect of Resistant Starch on Postprandial Glucose Levels in Sedentary, Abdominally Obese Persons. Diabetes 2018, 67, 792-P. [Google Scholar] [CrossRef]
- Ble-Castillo, J.L.; Juarez-Rojop, I.E.; Tovilla-Zarate, C.A.; Garcia-Vazquez, C.; Servin-Cruz, M.Z.; Rodriguez-Hernandez, A.; Araiza-Saldana, C.I.; Nolasco-Coleman, A.M.; Diaz-Zagoya, J.C. Acute Consumption of Resistant Starch Reduces Food Intake but Has No Effect on Appetite Ratings in Healthy Subjects. Nutrients 2017, 9, 696. [Google Scholar] [CrossRef] [PubMed]
- Sonia, S.; Witjaksono, F.; Ridwan, R. Effect of cooling of cooked white rice on resistant starch content and glycemic response. Asia Pac. J. Clin. Nutr. 2015, 24, 620–625. [Google Scholar] [CrossRef] [PubMed]
- Fernandes, G.; Velangi, A.; Wolever, T.M. Glycemic index of potatoes commonly consumed in North America. J. Am. Diet. Assoc. 2005, 105, 557–562. [Google Scholar] [CrossRef] [PubMed]
- Herrmann, C.; Goke, R.; Richter, G.; Fehmann, H.C.; Arnold, R.; Goke, B. Glucagon-like peptide-1 and glucose-dependent insulin-releasing polypeptide plasma levels in response to nutrients. Digestion 1995, 56, 117–126. [Google Scholar] [CrossRef] [PubMed]
- Inagaki, N.; Seino, Y.; Takeda, J.; Yano, H.; Yamada, Y.; Bell, G.I.; Eddy, R.L.; Fukushima, Y.; Byers, M.G.; Shows, T.B.; et al. Gastric inhibitory polypeptide: Structure and chromosomal localization of the human gene. Mol. Endocrinol. 1989, 3, 1014–1021. [Google Scholar] [CrossRef] [PubMed]
- Shimada, M.; Mochizuki, K.; Goda, T. Dietary resistant starch reduces levels of glucose-dependent insulinotropic polypeptide mRNA along the jejunum-ileum in both normal and type 2 diabetic rats. Biosci. Biotechnol. Biochem. 2008, 72, 2206–2209. [Google Scholar] [CrossRef] [PubMed]
- Lockyer, S.; Nugent, A. Health effects of resistant starch. Nutr. Bull. 2017, 42, 10–41. [Google Scholar] [CrossRef]
- Goodpaster, B.H.; Sparks, L.M. Metabolic Flexibility in Health and Disease. Cell Metab. 2017, 25, 1027–1036. [Google Scholar] [CrossRef] [Green Version]
- Goodpaster, B.; Kelley, D.E. Metabolic Inflexibility and Insulin Resistance in Skeletal Muscle. In Physical Activity and Type 2 Diabetes; Hawley, J., Zierath, J., Eds.; Human Kinetics Publishing: Champaign, IL, USA, 2008; pp. 59–66. [Google Scholar]
- Ng, J.M.; Azuma, K.; Kelley, C.; Pencek, R.; Radikova, Z.; Laymon, C.; Price, J.; Goodpaster, B.H.; Kelley, D.E. PET imaging reveals distinctive roles for different regional adipose tissue depots in systemic glucose metabolism in nonobese humans. Am. J. Physiol. Endocrinol. Metab. 2012, 303, E1134–E1141. [Google Scholar] [CrossRef] [Green Version]
- Wong, J.M.; de Souza, R.; Kendall, C.W.; Emam, A.; Jenkins, D.J. Colonic health: Fermentation and short chain fatty acids. J. Clin. Gastroenterol. 2006, 40, 235–243. [Google Scholar] [CrossRef]
- Cheung, L.T.F.; Ko, G.T.C.; Chow, F.C.C.; Kong, A.P.S. Association between hedonic hunger and glycemic control in non-obese and obese patients with type 2 diabetes. J. Diabetes Investig. 2018, 9, 1135–1143. [Google Scholar] [CrossRef] [PubMed] [Green Version]
- Egecioglu, E.; Skibicka, K.P.; Hansson, C.; Alvarez-Crespo, M.; Friberg, P.A.; Jerlhag, E.; Engel, J.A.; Dickson, S.L. Hedonic and incentive signals for body weight control. Rev. Endocr. Metab. Disord. 2011, 12, 141–151. [Google Scholar] [CrossRef] [Green Version]
- De Roos, N.; Heijnen, M.L.; de Graaf, C.; Woestenenk, G.; Hobbel, E. Resistant starch has little effect on appetite, food intake and insulin secretion of healthy young men. Eur. J. Clin. Nutr. 1995, 49, 532–541. [Google Scholar]
- Higgins, J.A.; Brown, I.L. Resistant starch: A promising dietary agent for the prevention/treatment of inflammatory bowel disease and bowel cancer. Curr. Opin. Gastroenterol. 2013, 29, 190–194. [Google Scholar] [CrossRef] [PubMed]
- Anderson, G.H.; Catherine, N.L.; Woodend, D.M.; Wolever, T.M. Inverse association between the effect of carbohydrates on blood glucose and subsequent short-term food intake in young men. Am. J. Clin. Nutr. 2002, 76, 1023–1030. [Google Scholar] [CrossRef]
- Anderson, G.H.; Cho, C.E.; Akhavan, T.; Mollard, R.C.; Luhovyy, B.L.; Finocchiaro, E.T. Relation between estimates of cornstarch digestibility by the Englyst in vitro method and glycemic response, subjective appetite, and short-term food intake in young men. Am. J. Clin. Nutr. 2010, 91, 932–939. [Google Scholar] [CrossRef] [PubMed] [Green Version]
- Keogh, J.B.; Lau, C.W.; Noakes, M.; Bowen, J.; Clifton, P.M. Effects of meals with high soluble fibre, high amylose barley variant on glucose, insulin, satiety and thermic effect of food in healthy lean women. Eur. J. Clin. Nutr. 2007, 61, 597–604. [Google Scholar] [CrossRef]


| Variables | Mean ± Standard Deviation (SD) |
|---|---|
| Age (years) | 29.6 ± 6.0 |
| Body weight (kg) | 85.6 ± 11.8 |
| BMI (kg/m2) | 32.8 ± 3.7 |
| Percent fat mass | 43.6 ± 4.9 |
| Percent fat-free mass | 56.4 ± 4.9 |
| Fat mass (kg) | 37.9 ± 8.0 |
| Lean mass (kg) | 48.5 ± 5.1 |
| Variable | Mean ± SD Boiled | p-Value Boiled | Mean ± SD Chilled | p-Value Chilled | p-Value Difference in Change between Groups |
|---|---|---|---|---|---|
| Energy (kcal) | |||||
| Pre | 1828 ± 842 | 0.329 | 1933 ± 891 | 0.528 | |
| Post | 1987 ± 1223 | 1843 ± 1220 | |||
| Difference | 160 ± 865 | −67 ± 774 | 0.185 | ||
| CHO (g) | |||||
| Pre | 211.2 ± 95.9 | 0.55 | 206.0 ± 83.8 | 0.457 | |
| Post | 223.9 ± 140.6 | 218.6 ± 130.3 | |||
| Difference | 12.7 ± 112.7 | 16.1 ± 90.8 | 0.876 | ||
| Protein (g) | |||||
| Pre | 76.6 ± 45.2 | 0.753 | 77.7 ± 34.7 | 0.895 | |
| Post | 78.5 ± 49.5 | 76.8 ± 52.8 | |||
| Difference | 1.9 ± 32.0 | −1.2 ± 37.2 | 0.72 | ||
| Fat (g) | |||||
| Pre | 76.6 ± 40.5 | 0.328 | 89.5 ± 55.6 | 0.065 | |
| Post | 84.5 ± 60.4 | 75.1 ± 62.2 | |||
| Difference | 7.9 ± 42.8 | −13.2 ± 41.4 | 0.026 | ||
| Monounsaturated fat (g) | |||||
| Pre | 27.7 ± 15.7 | 0.608 | 31.9 ± 18.6 | 0.095 | |
| Post | 28.9 ± 19.0 | 26.9 ± 22.7 | |||
| Difference | 1.2 ± 12.9 | −4.5 ± 16.0 | 0.09 | ||
| Polyunsaturated fat (g) | |||||
| Pre | 17.6 ± 9.7 | 0.294 | 22.0 ± 15.0 | 0.11 | |
| Post | 20.2 ± 16.7 | 18.1 ± 14.2 | |||
| Difference | 2.6 ± 13.3 | −3.9 ± 13.4 | 0.013 | ||
| Saturated fat (g) | |||||
| Pre | 24.8 ± 13.6 | 0.303 | 28.5 ± 20.6 | 0.047 | |
| Post | 28.2 ± 21.2 | 23.7 ± 21.6 | |||
| Difference | 3.4 ± 17.6 | −4.2 ± 12.5 | 0.045 | ||
| Trans fatty acids (g) | |||||
| Pre | 2.3 ± 1.8 | 0.679 | 2.4 ± 1.6 | 0.608 | |
| Post | 2.2 ± 1.3 | 2.6 ± 2.9 | |||
| Difference | −0.1 ± 1.6 | 0.3 ± 2.7 | 0.345 | ||
| % kcal from CHO | |||||
| Pre | 46.4 ± 9.3 | 0.488 | 44.0 ± 8.7 | 0.033 | |
| Post | 45.3 ± 10.7 | 49.3 ± 11.7 | |||
| Difference | −1.1 ± 8.7 | 5.4 ± 13.0 | 0.032 | ||
| % kcal from protein | |||||
| Pre | 16.6 ± 5.1 | 0.875 | 16.8 ± 4.6 | 0.688 | |
| Post | 16.4 ± 4.6 | 16.4 ± 5.3 | |||
| Difference | −0.2 ± 5.6 | −0.7 ± 5.4 | 0.692 | ||
| % kcal from fat | |||||
| Pre | 36.5 ± 6.6 | 0.798 | 38.3 ± 6.8 | 0.032 | |
| Post | 36.2 ± 8.7 | 33.9 ± 9.1 | |||
| Difference | −0.4 ± 7.6 | −4.3 ± 11.0 | 0.088 | ||
| Fiber (g) | |||||
| Pre | 14.8 ± 7.0 | 0.502 | 15.6 ± 6.2 | 0.418 | |
| Pro | 15.8 ± 10.2 | 16.7 ± 8.9 | |||
| Difference | 1.1 ± 8.3 | 1.5 ± 7.0 | 0.813 | ||
| Glycemic index * | |||||
| Pre | 59.8 ± 4.5 | 0.833 | 60.2 ± 4.0 | 0.001 | |
| Post | 60.0 ± 3.7 | 64.3 ± 7.3 | |||
| Difference | 0.2 ± 5.9 | 4.1 ± 6.5 | 0.049 | ||
| Glycemic load | |||||
| Pre | 118.2 ± 52.8 | 0.539 | 115.5 ± 49.0 | 0.171 | |
| Post | 125.1 ± 78.3 | 130.0 ± 76.9 | |||
| Difference | 6.9 ± 59.8 | 15.3 ± 52.6 | 0.486 |
© 2019 by the authors. Licensee MDPI, Basel, Switzerland. This article is an open access article distributed under the terms and conditions of the Creative Commons Attribution (CC BY) license (http://creativecommons.org/licenses/by/4.0/).
Share and Cite
Patterson, M.A.; Fong, J.N.; Maiya, M.; Kung, S.; Sarkissian, A.; Nashef, N.; Wang, W. Chilled Potatoes Decrease Postprandial Glucose, Insulin, and Glucose-dependent Insulinotropic Peptide Compared to Boiled Potatoes in Females with Elevated Fasting Glucose and Insulin. Nutrients 2019, 11, 2066. https://doi.org/10.3390/nu11092066
Patterson MA, Fong JN, Maiya M, Kung S, Sarkissian A, Nashef N, Wang W. Chilled Potatoes Decrease Postprandial Glucose, Insulin, and Glucose-dependent Insulinotropic Peptide Compared to Boiled Potatoes in Females with Elevated Fasting Glucose and Insulin. Nutrients. 2019; 11(9):2066. https://doi.org/10.3390/nu11092066
Chicago/Turabian StylePatterson, Mindy A, Joy Nolte Fong, Madhura Maiya, Stephanie Kung, Araz Sarkissian, Nezar Nashef, and Wanyi Wang. 2019. "Chilled Potatoes Decrease Postprandial Glucose, Insulin, and Glucose-dependent Insulinotropic Peptide Compared to Boiled Potatoes in Females with Elevated Fasting Glucose and Insulin" Nutrients 11, no. 9: 2066. https://doi.org/10.3390/nu11092066