Variations in 25-Hydroxyvitamin D in Countries from the Middle East and Europe: The Roles of UVB Exposure and Diet

 ,
,  ,
,  ,
,  and
and
Abstract
:1. Introduction
2. Methods and Materials
3. Results
4. Discussion
5. Conclusions
Author Contributions
Funding
Conflicts of Interest
References
- Bassil, D.; Rahme, M.; Hoteit, M.; Fuleihan Gel, H. Hypovitaminosis D in the Middle East and North Africa: Prevalence, risk factors and impact on outcomes. Derm. Endocrinol. 2013, 5, 274–298. [Google Scholar] [CrossRef] [PubMed]
- Chakhtoura, M.; Rahme, M.; Chamoun, N.; El-Hajj Fuleihan, G. Vitamin D in the Middle East and North Africa. Bone Rep. 2018, 8, 135–146. [Google Scholar] [CrossRef] [PubMed]
- Lips, P.; Cashman, K.D.; Lamberg-Allardt, C.; Bischoff-Ferrari, H.A.; Obermayer-Pietsch, B.R.; Bianchi, M.; Stepan, J.; El-Hajj Fuleihan, G.; Bouillon, R. Management of endocrine disease: Current vitamin D status in European and Middle East countries and strategies to prevent vitamin D deficiency; a position statement of the European Calcified Tissue Society. Eur. J. Endocrinol. 2019. [Google Scholar] [CrossRef] [PubMed]
- Grant, W.B.; Bhattoa, H.P.; Pludowski, P. Determinants of Vitamin D Deficiency From Sun Exposure: A Global Perspective. In Vitamin D, 4th ed.; Feldman, D., Ed.; Academic Press: New York, NY, USA, 2018; pp. 79–90. [Google Scholar]
- Meddeb, N.; Sahli, H.; Chahed, M.; Abdelmoula, J.; Feki, M.; Salah, H.; Frini, S.; Kaabachi, N.; Belkahia, C.; Mbazaa, R.; et al. Vitamin D deficiency in Tunisia. Osteoporos. Int. 2005, 16, 180–183. [Google Scholar] [CrossRef] [PubMed]
- Batieha, A.; Khader, Y.; Jaddou, H.; Hyassat, D.; Batieha, Z.; Khateeb, M.; Belbisi, A.; Ajlouni, K. Vitamin D status in Jordan: Dress style and gender discrepancies. Ann. Nutr. Metab. 2011, 58, 10–18. [Google Scholar] [CrossRef] [PubMed]
- Gannage-Yared, M.H.; Chemali, R.; Yaacoub, N.; Halaby, G. Hypovitaminosis D in a sunny country: Relation to lifestyle and bone markers. J. Bone Miner. Res. 2000, 15, 1856–1862. [Google Scholar] [CrossRef] [PubMed]
- Al Attia, H.M.; Ibrahim, M.A. The high prevalence of vitamin D inadequacy and dress style of women in the sunny UAE. Arch. Osteoporos. 2012, 7, 307–310. [Google Scholar] [CrossRef]
- Golbahar, J.; Al-Saffar, N.; Altayab Diab, D.; Al-Othman, S.; Darwish, A.; Al-Kafaji, G. Predictors of vitamin D deficiency and insufficiency in adult Bahrainis: A cross-sectional study. Public Health Nutr. 2014, 17, 732–738. [Google Scholar] [CrossRef]
- Ardawi, M.S.; Sibiany, A.M.; Bakhsh, T.M.; Qari, M.H.; Maimani, A.A. High prevalence of vitamin D deficiency among healthy Saudi Arabian men: Relationship to bone mineral density, parathyroid hormone, bone turnover markers, and lifestyle factors. Osteoporos. Int. 2012, 23, 675–686. [Google Scholar] [CrossRef]
- Hwalla, N.; Al Dhaheri, A.S.; Radwan, H.; Alfawaz, H.A.; Fouda, M.A.; Al-Daghri, N.M.; Zaghloul, S.; Blumberg, J.B. The Prevalence of Micronutrient Deficiencies and Inadequacies in the Middle East and Approaches to Interventions. Nutrients 2017, 9, 229. [Google Scholar] [CrossRef]
- Khosravi-Boroujeni, H.; Sarrafzadegan, N.; Sadeghi, M.; Roohafza, H.; Ng, S.K.; Pourmogaddas, A.; Ahmed, F. Prevalence and Trends of Vitamin D Deficiency among Iranian Adults: A Longitudinal Study from 2001–2013. J. Nutr. Sci. Vitaminol. 2017, 63, 284–290. [Google Scholar] [CrossRef] [PubMed]
- Pilz, S.; Marz, W.; Cashman, K.D.; Kiely, M.E.; Whiting, S.J.; Holick, M.F.; Grant, W.B.; Pludowski, P.; Hiligsmann, M.; Trummer, C.; et al. Rationale and Plan for Vitamin D Food Fortification: A Review and Guidance Paper. Front. Endocrinol. 2018, 9, 373. [Google Scholar] [CrossRef] [PubMed]
- Gannage-Yared, M.H.; Chemali, R.; Sfeir, C.; Maalouf, G.; Halaby, G. Dietary calcium and vitamin D intake in an adult Middle Eastern population: Food sources and relation to lifestyle and PTH. Int. J. Vitam. Nutr. Res. 2005, 75, 281–289. [Google Scholar] [CrossRef] [PubMed]
- Crowe, F.L.; Steur, M.; Allen, N.E.; Appleby, P.N.; Travis, R.C.; Key, T.J. Plasma concentrations of 25-hydroxyvitamin D in meat eaters, fish eaters, vegetarians and vegans: Results from the EPIC-Oxford study. Public Health Nutr. 2011, 14, 340–346. [Google Scholar] [CrossRef] [PubMed]
- Liu, J.; Greenfield, H.; Strobel, N.; Fraser, D.R. The influence of latitude on the concentration of vitamin D3 and 25-hydroxy-vitamin D3 in Australian red meat. Food Chem. 2013, 140, 432–435. [Google Scholar] [CrossRef] [PubMed]
- Taylor, C.L.; Patterson, K.Y.; Roseland, J.M.; Wise, S.A.; Merkel, J.M.; Pehrsson, P.R.; Yetley, E.A. Including food 25-hydroxyvitamin D in intake estimates may reduce the discrepancy between dietary and serum measures of vitamin D status. J. Nutr. 2014, 144, 654–659. [Google Scholar] [CrossRef] [PubMed]
- Dunlop, E.; Cunningham, J.; Sherriff, J.L.; Lucas, R.M.; Greenfield, H.; Arcot, J.; Strobel, N.; Black, L.J. Vitamin D(3) and 25-Hydroxyvitamin D(3) Content of Retail White Fish and Eggs in Australia. Nutrients 2017, 9, 647. [Google Scholar] [CrossRef] [PubMed]
- Food and Agriculture Organization of the United Nations. Food Balance Sheets. Available online: http://www.fao.org/faostat/en/#data/FBS (accessed on 27 June 2019).
- FAO. Global Food Losses and Food Waste—Extent, Causes and Prevention; Food and Agriculture Organization of the United Nations: Rome, Italy, 2011; p. 29. [Google Scholar]
- Armstrong, B.; Doll, R. Environmental factors and cancer incidence and mortality in different countries, with special reference to dietary practices. Int. J. Cancer 1975, 15, 617–631. [Google Scholar] [CrossRef] [PubMed]
- Kuchuk, N.O.; van Schoor, N.M.; Pluijm, S.M.; Chines, A.; Lips, P. Vitamin D status, parathyroid function, bone turnover, and BMD in postmenopausal women with osteoporosis: Global perspective. J. Bone Miner. Res. 2009, 24, 693–701. [Google Scholar] [CrossRef]
- Dafterdar, R.; Al-Fayoumi, M.; Saadeddin, S.; Khan, R.; Alothaim, A.; Hasanato, R.; Al-Shangiti, A.; Fakhoury, H.; Tamimi, W. Vitamin D immunoassay systems: A comparison. Br. J. Biomed. Sci. 2014, 71, 127–130. [Google Scholar] [CrossRef] [PubMed]
- Sadat-Ali, M.; Al-Elq, A.H.; Al-Shaikh, I.H.; Al-Turki, H.A.; Al-Ali, A.K.; Al-Othman, A.A. Assessment of low vitamin D among Saudi Arabians. Did we overshoot the runway? Saudi Med. J. 2014, 35, 1243–1249. [Google Scholar] [PubMed]
- Garland, C.F.; Cuomo, R.E.; Gorham, E.D.; Zeng, K.; Mohr, S.B. Cloud cover-adjusted ultraviolet B irradiance and pancreatic cancer incidence in 172 countries. J. Steroid Biochem. Mol. Biol. 2016, 155, 257–263. [Google Scholar] [CrossRef] [PubMed] [Green Version]
- Rabenberg, M.; Scheidt-Nave, C.; Busch, M.A.; Rieckmann, N.; Hintzpeter, B.; Mensink, G.B. Vitamin D status among adults in Germany--results from the German Health Interview and Examination Survey for Adults (DEGS1). BMC Public Health 2015, 15, 641. [Google Scholar] [CrossRef] [PubMed]
- Heidari, B.; Mirghassemi, M.B.H. Seasonal variations inserum vitamin D according to age and sex. Casp. J. Interrnal Med. 2012, 3, 535–540. [Google Scholar]
- Nouri Saeidlou, S.; Vahabzadeh, D.; Babaei, F.; Vahabzadeh, Z. Seasonal variations of vitamin D and its relation to lipid profile in Iranian children and adults. J. Health Popul. Nutr. 2017, 36, 21. [Google Scholar] [CrossRef]
- Saliba, W.; Rennert, H.S.; Kershenbaum, A.; Rennert, G. Serum 25(OH)D concentrations in sunny Israel. Osteoporos. Int. 2012, 23, 687–694. [Google Scholar] [CrossRef]
- Bonelli, P.; Buonocore, R.; Aloe, R.; Lippi, G. Blood Sampling Seasonality as an Important Preanalytical Factor for Assessment of Vitamin D Status. J. Med. Biochem. 2016, 35, 113–117. [Google Scholar] [CrossRef] [Green Version]
- Mishal, A.A. Effects of different dress styles on vitamin D levels in healthy young Jordanian women. Osteoporos. Int. 2001, 12, 931–935. [Google Scholar] [CrossRef]
- Gannage-Yared, M.H.; Helou, E.; Zaraket, V.; Abi Akl, S.; Antonios, L.; Moussalli, M.L.; Wakim, S. Serum 25 hydroxyvitamin D in employees of a Middle Eastern university hospital. J. Endocrinol. Investig. 2014, 37, 541–546. [Google Scholar] [CrossRef]
- Bettencourt, A.; Boleixa, D.; Reis, J.; Oliveira, J.C.; Mendonca, D.; Costa, P.P.; Silva, B.M.D.; Marinho, A.; Silva, A.M.D. Serum 25-hydroxyvitamin D levels in a healthy population from the North of Portugal. J. Steroid Biochem. Mol. Biol. 2018, 175, 97–101. [Google Scholar] [CrossRef]
- Al-Dabhani, K.; Tsilidis, K.K.; Murphy, N.; Ward, H.A.; Elliott, P.; Riboli, E.; Gunter, M.; Tzoulaki, I. Prevalence of vitamin D deficiency and association with metabolic syndrome in a Qatari population. Nutr. Diabetes 2017, 7, e263. [Google Scholar] [CrossRef] [PubMed]
- Niculescu, D.A.; Capatina, C.A.M.; Dusceac, R.; Caragheorgheopol, A.; Ghemigian, A.; Poiana, C. Seasonal variation of serum vitamin D levels in Romania. Arch. Osteoporos. 2017, 12, 113. [Google Scholar] [CrossRef] [PubMed]
- Kanan, R.M.; Al Saleh, Y.M.; Fakhoury, H.M.; Adham, M.; Aljaser, S.; Tamimi, W. Year-round vitamin D deficiency among Saudi female out-patients. Public Health Nutr. 2013, 16, 544–548. [Google Scholar] [CrossRef] [PubMed]
- Klingberg, E.; Olerod, G.; Konar, J.; Petzold, M.; Hammarsten, O. Seasonal variations in serum 25-hydroxy vitamin D levels in a Swedish cohort. Endocrine 2015, 49, 800–808. [Google Scholar] [CrossRef] [PubMed] [Green Version]
- Merlo, C.; Trummler, M.; Essig, S.; Zeller, A. Vitamin D Deficiency in Unselected Patients from Swiss Primary Care: A Cross-Sectional Study in Two Seasons. PLoS ONE 2015, 10, e0138613. [Google Scholar] [CrossRef] [PubMed]
- Sayed-Hassan, R.; Abazid, N.; Alourfi, Z. Relationship between 25-hydroxyvitamin D concentrations, serum calcium, and parathyroid hormone in apparently healthy Syrian people. Arch. Osteoporos. 2014, 9, 176. [Google Scholar] [CrossRef] [PubMed]
- Cinar, N.; Harmanci, A.; Yildiz, B.O.; Bayraktar, M. Vitamin D status and seasonal changes in plasma concentrations of 25-hydroxyvitamin D in office workers in Ankara, Turkey. Eur. J. Intern. Med. 2014, 25, 197–201. [Google Scholar] [CrossRef] [PubMed]
- Jablonski, N.G.; Chaplin, G. The evolution of human skin coloration. J. Hum. Evol. 2000, 39, 57–106. [Google Scholar] [CrossRef] [Green Version]
- Chaplin, G. Geographic distribution of environmental factors influencing human skin coloration. Am. J. Phys. Anthropol. 2004, 125, 292–302. [Google Scholar] [CrossRef]
- Chaplin, G.; Jablonski, N.G. The human environment and the vitamin D compromise: Scotland as a case study in human biocultural adaptation and disease susceptibility. Hum. Biol. 2013, 85, 529–552. [Google Scholar] [CrossRef]
- Jablonski, N.G.; Chaplin, G. Colloquium paper: Human skin pigmentation as an adaptation to UV radiation. Proc. Natl. Acad. Sci. USA 2010, 107 (Suppl. 2), 8962–8968. [Google Scholar] [CrossRef]
- Botros, R.M.; Sabry, I.M.; Abdelbaky, R.S.; Eid, Y.M.; Nasr, M.S.; Hendawy, L.M. Vitamin D deficiency among healthy Egyptian females. Endocrinol. Nutr. 2015, 62, 314–321. [Google Scholar] [CrossRef] [PubMed]
- Mallah, E.M.; Hamad, M.F.; Elmanaseer, M.A.; Qinna, N.A.; Idkaidek, N.M.; Arafat, T.A.; Matalka, K.Z. Plasma concentrations of 25-hydroxyvitamin D among Jordanians: Effect of biological and habitual factors on vitamin D status. BMC Clin. Pathol. 2011, 11, 8. [Google Scholar] [CrossRef] [PubMed]
- Darwish, H.; Zeinoun, P.; Ghusn, H.; Khoury, B.; Tamim, H.; Khoury, S.J. Serum 25-hydroxyvitamin D predicts cognitive performance in adults. Neuropsychiatr. Dis. Treat. 2015, 11, 2217–2223. [Google Scholar] [CrossRef] [PubMed]
- Grant, W.B. A multicountry ecological study of cancer incidence rates in 2008 with respect to various risk-modifying factors. Nutrients 2014, 6, 163–189. [Google Scholar] [CrossRef] [PubMed]
- Grant, W.B. Dietary links to Alzheimer’s disease. Alz. Dis. Rev. 1997, 2, 42–55. [Google Scholar]
- Grant, W.B. The APOE-epsilon4 allele and Alzheimer disease among African Americans, Hispanics, and whites. JAMA J. Am. Med. Assoc. 1998, 280, 1662–1663. [Google Scholar]
- Luchsinger, J.A.; Tang, M.X.; Shea, S.; Mayeux, R. Caloric intake and the risk of Alzheimer disease. Arch. Neurol. 2002, 59, 1258–1263. [Google Scholar] [CrossRef] [PubMed]
- Rainey-Smith, S.R.; Gu, Y.; Gardener, S.L.; Doecke, J.D.; Villemagne, V.L.; Brown, B.M.; Taddei, K.; Laws, S.M.; Sohrabi, H.R.; Weinborn, M.; et al. Mediterranean diet adherence and rate of cerebral Abeta-amyloid accumulation: Data from the Australian Imaging, Biomarkers and Lifestyle Study of Ageing. Transl. Psychiatry 2018, 8, 238. [Google Scholar] [CrossRef] [PubMed]
- Morris, M.C.; Evans, D.A.; Bienias, J.L.; Tangney, C.C.; Bennett, D.A.; Wilson, R.S.; Aggarwal, N.; Schneider, J. Consumption of fish and n-3 fatty acids and risk of incident Alzheimer disease. Arch. Neurol. 2003, 60, 940–946. [Google Scholar] [CrossRef] [PubMed]
- Grant, W.B. Using Multicountry Ecological and Observational Studies to Determine Dietary Risk Factors for Alzheimer’s Disease. J. Am. Coll. Nutr. 2016, 35, 476–489. [Google Scholar] [CrossRef] [PubMed]
- Grant, W.B. Reassessing the role of sugar in the etiology of heart disease. J. Orthomolec. Med. 1998, 13, 95–104. [Google Scholar]
- Johnson, R.K.; Appel, L.J.; Brands, M.; Howard, B.V.; Lefevre, M.; Lustig, R.H.; Sacks, F.; Steffen, L.M.; Wylie-Rosett, J. Dietary sugars intake and cardiovascular health: A scientific statement from the American Heart Association. Circulation 2009, 120, 1011–1020. [Google Scholar] [CrossRef] [PubMed]
- Moukayed, M.; Grant, W.B. Molecular link between vitamin D and cancer prevention. Nutrients 2013, 5, 3993–4021. [Google Scholar] [CrossRef] [PubMed]
- Jakobsen, J.; Smith, C.; Bysted, A.; Cashman, K.D. Vitamin D in Wild and Farmed Atlantic Salmon (Salmo Salar)-What Do We Know? Nutrients 2019, 11, 982. [Google Scholar] [CrossRef] [PubMed]
- Chuang, S.C.; Chen, H.L.; Tseng, W.T.; Wu, I.C.; Hsu, C.C.; Chang, H.Y.; Chen, Y.I.; Lee, M.M.; Liu, K.; Hsiung, C.A. Circulating 25-hydroxyvitamin D and physical performance in older adults: A nationwide study in Taiwan. Am. J. Clin. Nutr. 2016, 104, 1334–1344. [Google Scholar] [CrossRef] [PubMed]
- Lehmann, U.; Gjessing, H.R.; Hirche, F.; Mueller-Belecke, A.; Gudbrandsen, O.A.; Ueland, P.M.; Mellgren, G.; Lauritzen, L.; Lindqvist, H.; Hansen, A.L.; et al. Efficacy of fish intake on vitamin D status: A meta-analysis of randomized controlled trials. Am. J. Clin. Nutr. 2015, 102, 837–847. [Google Scholar] [CrossRef] [PubMed]
- Farrell, C.J.; Martin, S.; McWhinney, B.; Straub, I.; Williams, P.; Herrmann, M. State-of-the-art vitamin D assays: A comparison of automated immunoassays with liquid chromatography-tandem mass spectrometry methods. Clin. Chem. 2012, 58, 531–542. [Google Scholar] [CrossRef] [PubMed]
- Holmes, E.W.; Garbincius, J.; McKenna, K.M. Analytical variability among methods for the measurement of 25-hydroxyvitamin D: Still adding to the noise. Am. J. Clin. Pathol. 2013, 140, 550–560. [Google Scholar] [CrossRef] [PubMed]
- Hsu, S.A.; Soldo, J.; Gupta, M. Evaluation of two automated immunoassays for 25-OH vitamin D: Comparison against LC-MS/MS. J. Steroid Biochem. Mol. Biol. 2013, 136, 139–145. [Google Scholar] [CrossRef] [PubMed]
- Wyness, S.P.; Straseski, J.A. Performance characteristics of six automated 25-hydroxyvitamin D assays: Mind your 3s and 2s. Clin. Biochem. 2015, 48, 1089–1096. [Google Scholar] [CrossRef] [PubMed]
- Cashman, K.D.; Dowling, K.G.; Skrabakova, Z.; Kiely, M.; Lamberg-Allardt, C.; Durazo-Arvizu, R.A.; Sempos, C.T.; Koskinen, S.; Lundqvist, A.; Sundvall, J.; et al. Standardizing serum 25-hydroxyvitamin D data from four Nordic population samples using the Vitamin D Standardization Program protocols: Shedding new light on vitamin D status in Nordic individuals. Scand. J. Clin. Lab. Investig. 2015, 75, 549–561. [Google Scholar] [CrossRef]
- Sempos, C.T.; Durazo-Arvizu, R.A.; Binkley, N.; Jones, J.; Merkel, J.M.; Carter, G.D. Developing vitamin D dietary guidelines and the lack of 25-hydroxyvitamin D assay standardization: The ever-present past. J. Steroid Biochem. Mol. Biol. 2016, 164, 115–119. [Google Scholar] [CrossRef] [PubMed]
- Sarafin, K.; Durazo-Arvizu, R.; Tian, L.; Phinney, K.W.; Tai, S.; Camara, J.E.; Merkel, J.; Green, E.; Sempos, C.T.; Brooks, S.P. Standardizing 25-hydroxyvitamin D values from the Canadian Health Measures Survey. Am. J. Clin. Nutr. 2015, 102, 1044–1050. [Google Scholar] [CrossRef] [PubMed] [Green Version]
- Pludowski, P.; Holick, M.F.; Grant, W.B.; Konstantynowicz, J.; Mascarenhas, M.R.; Haq, A.; Povoroznyuk, V.; Balatska, N.; Barbosa, A.P.; Karonova, T.; et al. Vitamin D supplementation guidelines. J. Steroid Biochem. Mol. Biol. 2018, 175, 125–135. [Google Scholar] [CrossRef] [PubMed]
- Holick, M.F. Vitamin D deficiency. N. Engl. J. Med. 2007, 357, 266–281. [Google Scholar] [CrossRef] [PubMed]
- Pludowski, P.; Holick, M.F.; Pilz, S.; Wagner, C.L.; Hollis, B.W.; Grant, W.B.; Shoenfeld, Y.; Lerchbaum, E.; Llewellyn, D.J.; Kienreich, K.; et al. Vitamin D effects on musculoskeletal health, immunity, autoimmunity, cardiovascular disease, cancer, fertility, pregnancy, dementia and mortality—A review of recent evidence. Autoimmun. Rev. 2013, 12, 976–989. [Google Scholar] [CrossRef] [PubMed]
- Grant, W.B. Vitamin D and health in the Mediterranean countries. Hormones 2019, 18, 23–35. [Google Scholar] [CrossRef]
- McDonnell, S.L.; Baggerly, C.; French, C.B.; Baggerly, L.L.; Garland, C.F.; Gorham, E.D.; Lappe, J.M.; Heaney, R.P. Serum 25-Hydroxyvitamin D Concentrations >/=40 ng/mL Are Associated with >65% Lower Cancer Risk: Pooled Analysis of Randomized Trial and Prospective Cohort Study. PLoS ONE 2016, 11, e0152441. [Google Scholar] [CrossRef]
- McDonnell, S.L.; Baggerly, C.A.; French, C.B.; Baggerly, L.L.; Garland, C.F.; Gorham, E.D.; Hollis, B.W.; Trump, D.L.; Lappe, J.M. Breast cancer risk markedly lower with serum 25-hydroxyvitamin D concentrations >/=60 vs <20 ng/mL (150 vs 50 nmol/L): Pooled analysis of two randomized trials and a prospective cohort. PLoS ONE 2018, 13, e0199265. [Google Scholar] [CrossRef]
- Manson, J.E.; Cook, N.R.; Lee, I.M.; Christen, W.; Bassuk, S.S.; Mora, S.; Gibson, H.; Gordon, D.; Copeland, T.; D’Agostino, D.; et al. Vitamin D Supplements and Prevention of Cancer and Cardiovascular Disease. N. Engl. J. Med. 2019, 380, 33–44. [Google Scholar] [CrossRef] [PubMed]
- Martineau, A.R.; Jolliffe, D.A.; Hooper, R.L.; Greenberg, L.; Aloia, J.F.; Bergman, P.; Dubnov-Raz, G.; Esposito, S.; Ganmaa, D.; Ginde, A.A.; et al. Vitamin D supplementation to prevent acute respiratory tract infections: Systematic review and meta-analysis of individual participant data. BMJ 2017, 356, i6583. [Google Scholar] [CrossRef] [PubMed]
- McDonnell, S.L.; Baggerly, K.A.; Baggerly, C.A.; Aliano, J.L.; French, C.B.; Baggerly, L.L.; Ebeling, M.D.; Rittenberg, C.S.; Goodier, C.G.; Mateus Nino, J.F.; et al. Maternal 25(OH)D concentrations >/=40 ng/mL associated with 60% lower preterm birth risk among general obstetrical patients at an urban medical center. PLoS ONE 2017, 12, e0180483. [Google Scholar] [CrossRef] [PubMed]
- Pittas, A.G.; Dawson-Hughes, B.; Sheehan, P.; Ware, J.H.; Knowler, W.C.; Aroda, V.R.; Brodsky, I.; Ceglia, L.; Chadha, C.; Chatterjee, R.; et al. Vitamin D Supplementation and Prevention of Type 2 Diabetes. N. Engl. J. Med. 2019. [Google Scholar] [CrossRef] [PubMed]
- Baig, M.B.; Al-Zahrani, K.H.; Schneider, F.; Straquadine, G.S.; Mourad, M. Food waste posing a serious threat to sustainability in the Kingdom of Saudi Arabia—A systematic review. Saudi J. Biol. Sci. 2018. [Google Scholar] [CrossRef]
- FAO. Reducing Food Losses and Waste in the Near East & North Africa Region; Food and Agriculture Organization of the United Nations: Rome, Italy, 2014; p. 11. [Google Scholar]


| Country (City), Latitude | Age (years) | N | Year | Assay | 25(OH)D (nmol/L), Summer * | 25(OH)D (nmol/L), Winter * | Ref. |
|---|---|---|---|---|---|---|---|
| Bahrain, 43° | Mean 35 | 250 M 250 F | 2010 2011 | ELISA | 27 ± 15 M 18 ± 15 F | 41 ± 32 M 26 ± 24 F | [9] |
| Germany, 47°–49° | 18–79 | 694 M su 748 M wi 770 F su 841 F wi | 2008 2011 | LIAISON, Roche | 62 (59–65) M 59 (56–62) F | 31 (29–34) M 35 (33–38) F | [26] |
| Iran (Babol), 36.5° | M 20–80 F 30–50 | 120 M 576 F | Sep 2010–Sep 2012 | ELISA, lyophilized competitive protein binding | 59 ± 29 M 52 ± 56 F | 46 ± 58 M 48 ± 52 F | [27] |
| Iran (W. Azerbaijan), 37.5° | 5–60 | 273 M 268 F | 2015 | ELISA, confirmed with HPLC | 62 ± 5 M 50 ± 7 F | 32 ± 4 M 30 ± 4 F | [28] |
| Israel, 31° | All ages | 295,556 Jews | 2009 | LIAISON, DiaSorin | 64 ± 24 M 50 ± 24 F | 43 ± 24 M 41 ± 24 F | [29] |
| All ages | 59,203 Arabs | 2009 | LIAISON, DiaSorin | 57 ± 22 M 38 ± 20 F | 36 ± 22 M 24 ± 24 F | ||
| Italy, 41.4° | 49–74 | 1820 sum 1885 win 78% F | 2014 | LIAISON, DiaSorin | 55 ± 21 M 72 ± 21 F | 50 ± 20 M 50 ± 20 F | [30] |
| Jordan, 30.6° | 18–45 | 23 M | ? | Radioimmune, DiaSorin | 44 ± 5 M | 35 ± 4 M | [31] |
| 18–45 | 124 F | Radioimmune, DiaSorin | 29 ± 5 F | 25 ± 4 F | |||
| Lebanon, 33.8° | 30–50 | 74 M 318 F | 2009–2010 | Chemiluminescent, DiaSorin | 51 ± 20 M + F | 34 ± 20 M + F | [32] |
| Portugal (Porto), 41.2° | 18–67 | 103 M 95 F | Jul/Aug 2015 Apr 2016 | Elecsys, Cobas, Roche | 70 ± 22 M 66 ± 22 F | 43 ± 16 M 41 ± 16 F | [33] |
| Qatar, 23.4° | 18–80 | 503 M 702 F | Dec 2012 Feb 2014 | LIAISON, DiaSorin | 42 ± 10 M + F | 43 ± 10 M + F | [34] |
| Romania, 45.9° | Mean 50 | 1429 M 6569 F | 2012–2016 | Liaison XL, DiaSorin | 66 ± 19 M 59 ± 16 F | 38 ± 14 M 33 ± 13 F | [35] |
| Saudi Arabia, 23.9° | 19+ | 659 F | 2009 | HPLC, Chromsystems, Germany | 37 ± 2 F (±SE) | [36] | |
| 19+ | 897 F | 2009 | HPLC, Chromsystems, Germany | 34 ± 1 F (±SE) | |||
| Sweden (Gothenburg), 57.7° | 28–54 | 325 M 215 F | Oct 2009 Sep 2010 | ? | 81 ± 27 M + F | 48 ± 20 M + F | [37] |
| Switzerland, 47.1° | 8–92 | 300 M 476 F | Sep 2011 Mar 2012 | Immuno-diagnosticsystems, IDS | 54 ± 20 M + F | 42 ± 19 M + F | [38] |
| Syria, 34.8° | 18–62 | 184 M 188 F | Apr 2011 Mar 2013 | Elecsys 2010, Roche | 37 ± 19 M 20 ± 14 F | 23 ± 15 M 18 ± 9–23 F | [39] |
| Turkey (Ankara), 39.0° | 21–52 | 53 M 65 F | Aug 2008 & Feb 2009 | HPLC, AB Sciex, Foster City, CA, USA | 72 ± 20 M 70 ± 30 F | 38 ± 16 M 34 ± 17 F | [40] |
| Country (City) | Latitude (°N) | Energy (kcal/Capita/Day) from: | ||||
|---|---|---|---|---|---|---|
| Animal Fat | Eggs | Ocean Fish | Meat | Milk | ||
| Saudi Arabia | 23.9 | 60 | 17 | 11 | 217 | 131 |
| Jordan | 30.6 | 23 | 29 | 7 | 140 | 115 |
| Israel | 31.0 | 16 | 37 | 20 | 418 | 250 |
| Lebanon | 33.8 | 16 | 22 | 17 | 242 | 160 |
| Iran | 36.5 | 20 | 21 | 10 | 143 | 74 |
| 37.5 | 50 | 30 | 10 | 133 | 66 | |
| Turkey | 39.0 | 15 | 33 | 8 | 138 | 309 |
| Portugal | 41.2 | 187 | 34 | 63 | 396 | 252 |
| Italy | 41.4 | 84 | 52 | 42 | 374 | 272 |
| Romania | 45.9 | 68 | 50 | 8 | 217 | 431 |
| Switzerland | 47.1 | 78 | 40 | 22 | 556 | 400 |
| Germany | 50.5 | 153 | 48 | 30 | 365 | 337 |
| Sweden (Gothenburg) | 57.7 | 51 | 49 | 43 | 357 | 402 |
| Sweden (Stockholm) | 60.0 | 47 | 43 | 47 | 344 | 428 |
| Country | Energy (kcal/Capita/Day) from: | ||||
|---|---|---|---|---|---|
| Animal Fat | Eggs | Ocean Fish | Meat | Milk | |
| Greece | 70 | 36 | 23 | 323 | 379 |
| Spain | 41 | 59 | 63 | 502 | 248 |
| Italy | 90 | 46 | 31 | 409 | 291 |
| Bulgaria | 51 | 42 | 8 | 234 | 239 |
| Croatia | 66 | 37 | 23 | 177 | 271 |
| Romania | 67 | 52 | 6 | 254 | 393 |
| Hungary | 285 | 66 | 5 | 419 | 214 |
| France | 85 | 60 | 56 | 559 | 393 |
| Slovakia | 210 | 47 | 12 | 245 | 153 |
| Germany | 147 | 48 | 32 | 355 | 249 |
| Belgium | 250 | 46 | 34 | 309 | 394 |
| Poland | 117 | 46 | 24 | 369 | 250 |
| Netherlands | 92 | 74 | 39 | 440 | 433 |
| Lithuania | 86 | 50 | 77 | 269 | 279 |
| Denmark | 199 | 66 | 48 | 381 | 276 |
| Russian Fed. | 37 | 52 | 29 | 240 | 239 |
| Estonia | 13 | 43 | 9 | 295 | 426 |
| Norway | 126 | 38 | 82 | 371 | 351 |
| Finland | 24 | 34 | 43 | 495 | 434 |
| Factor * | 25(OH)D, Males (R, β, p) | 25(OH)D, Females (R, β, p) |
|---|---|---|
| Summer | ||
| Latitude | 0.61, 0.80, 0.03 | 0.84, 1.45, <0.001 |
| UVB | 0.56, −3.0, 0.06 | 0.76, −5.2, 0.002 |
| Eggs, milk | 0.57, 0.044, 0.053 | 0.69, 0.087, 0.007 |
| Milk | 0.57, 0.047, 0.053 | 0.68, 0.093, 0.007 |
| Eggs | 0.50, 0.46, 0.12 | 0.60, 0.93, 0.02 |
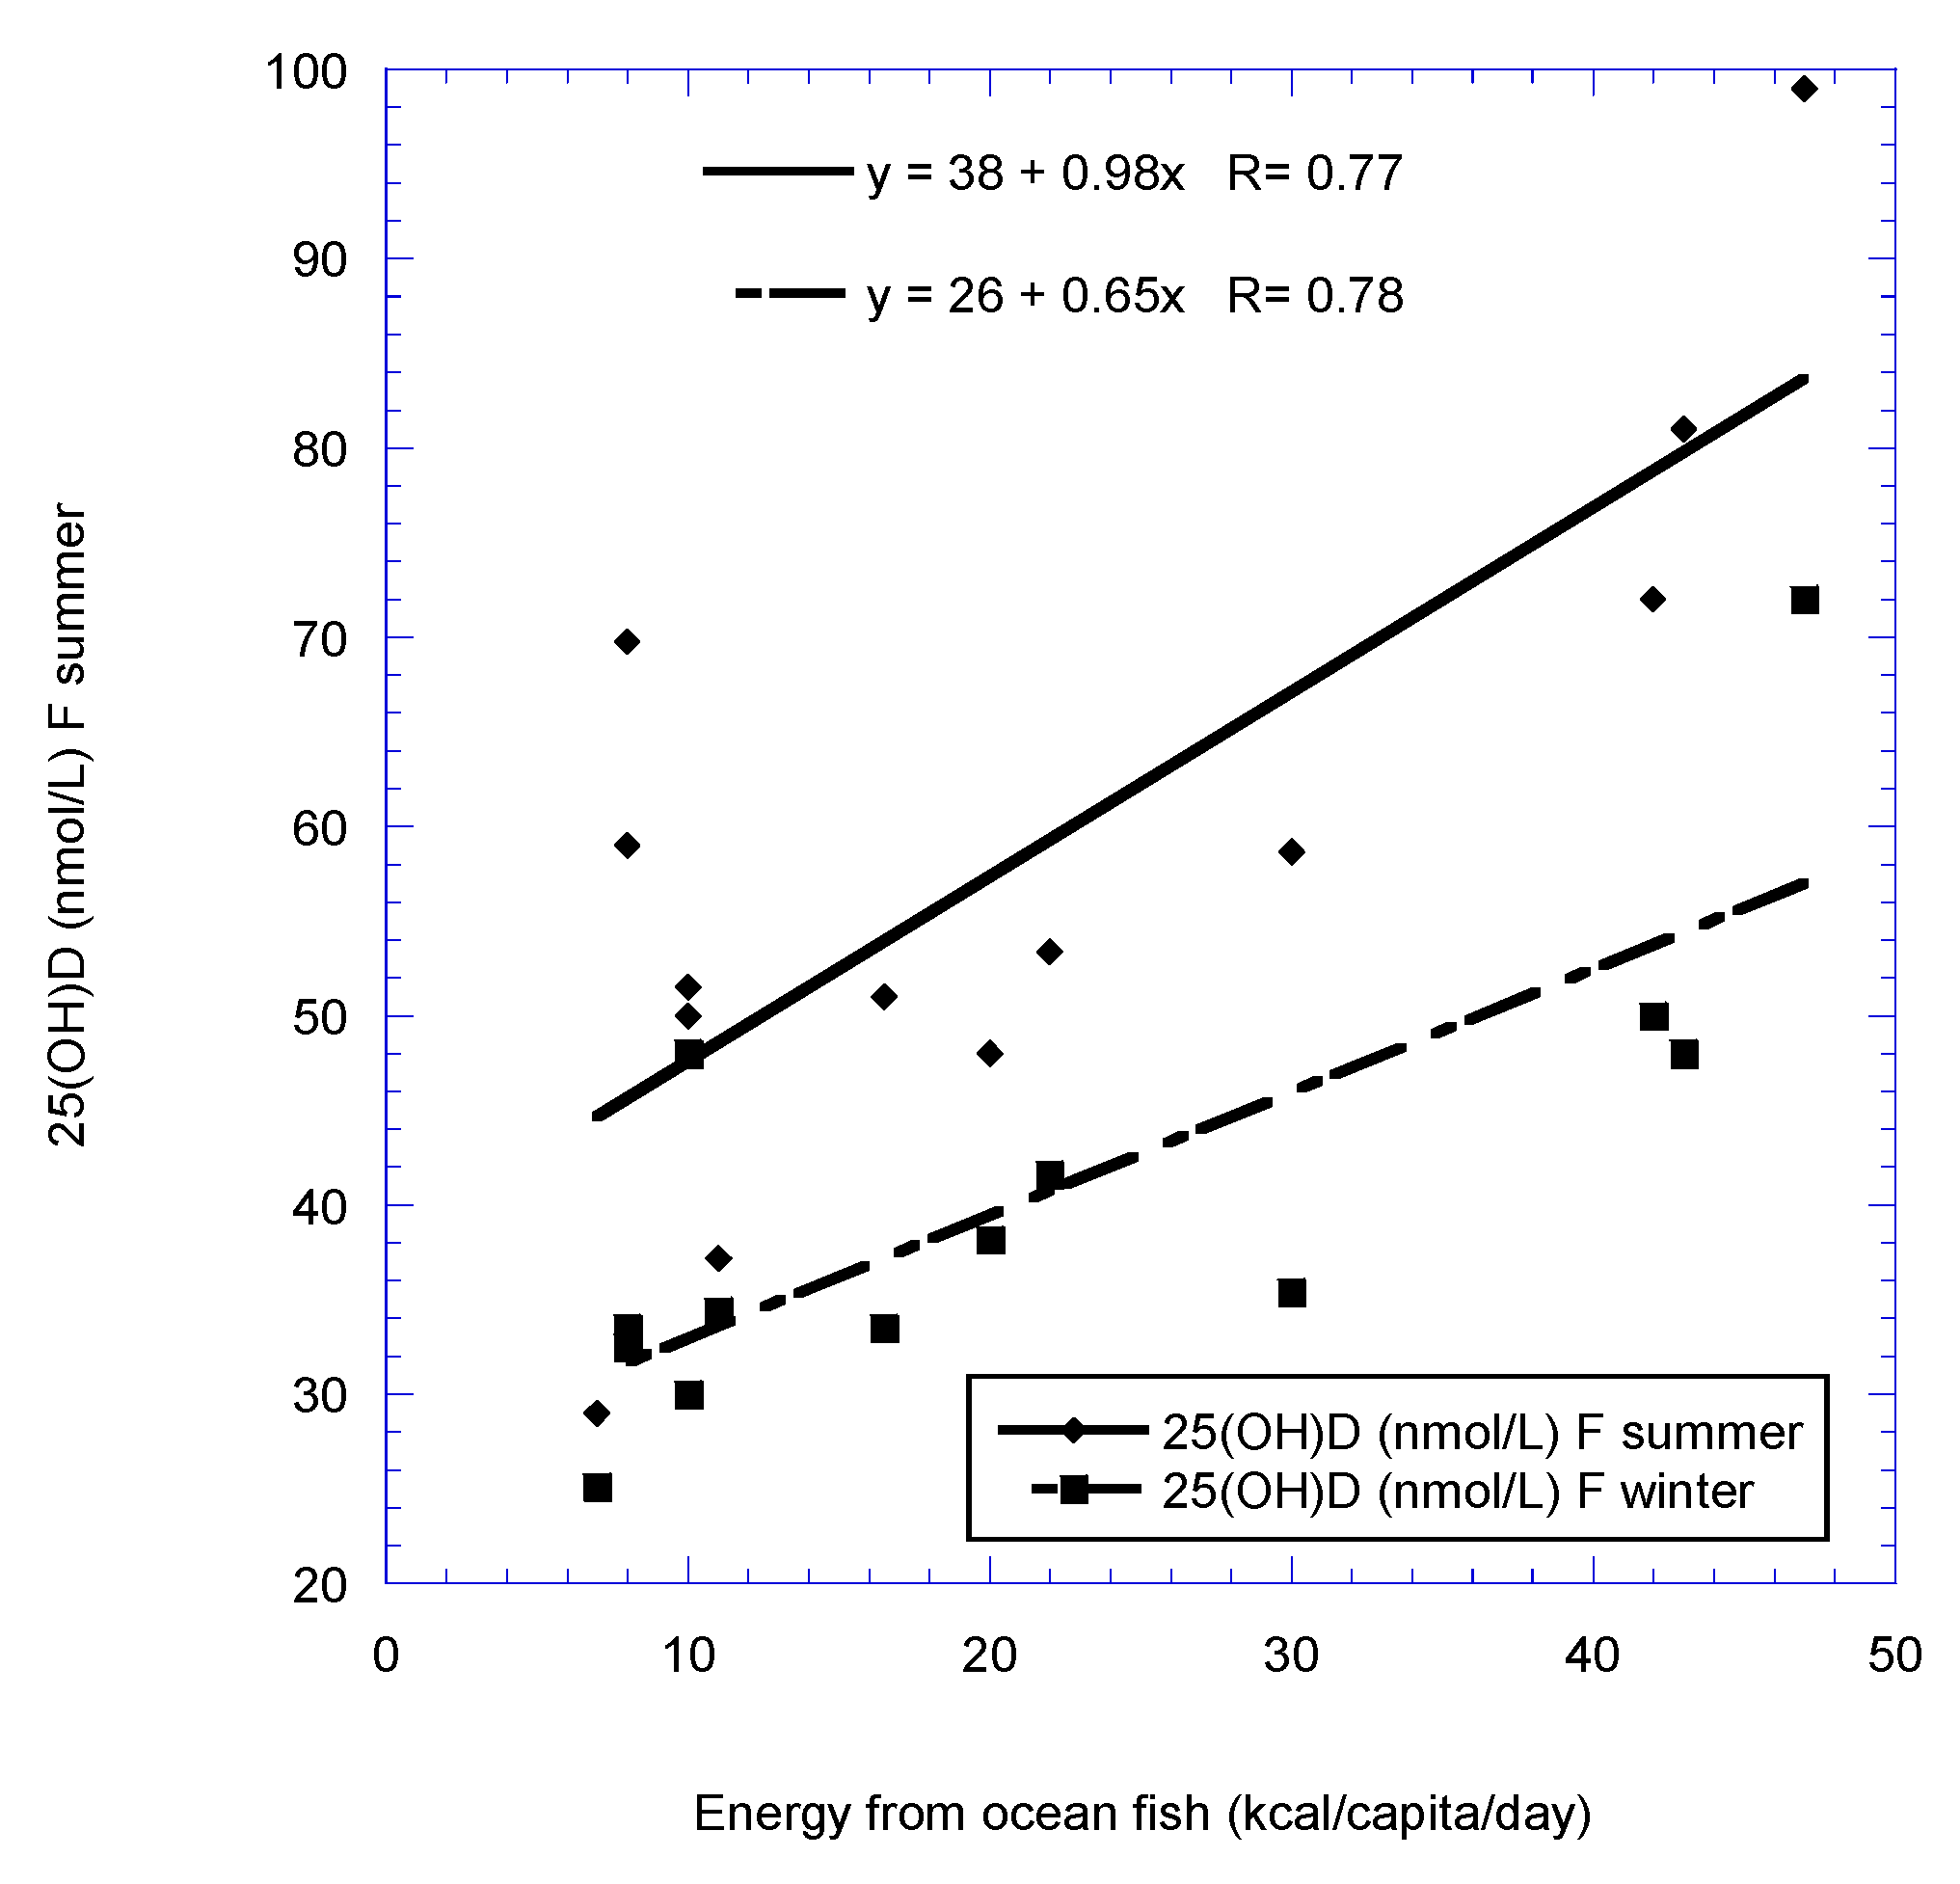
| Ocean fish | 0.42, 0.25, 0.17 | 0.67, 0.67, 0.009 |
| Meat | NS | 0.33, 0.045, 0.25 |
| Animal fat | NS | NS |
| Winter | ||
| Latitude | 0.36, 0.28, 0.25 | 0.62, 0.68, 0.02 |
| UVB | 0.51, −1.7, 0.09 | 0.37, −1.6, 0.20 |
| Eggs, milk | 0.55, 0.026, 0.07 | NS |
| Milk | 0.54, 0.027, 0.07 | NS |
| Eggs | 0.60, 0.36, 0.04 | NS |
| Ocean fish | 0.64, 0.23, 0.03 | 0.54, 0.34, 0.047 |
| Meat | 0.59, 0.027, 0. 04 | NS |
| Animal fat | NS | NS |
| Factor | 25(OH)D Summer (R, β, p) | 25(OH)D Winter * (R, β, p) |
|---|---|---|
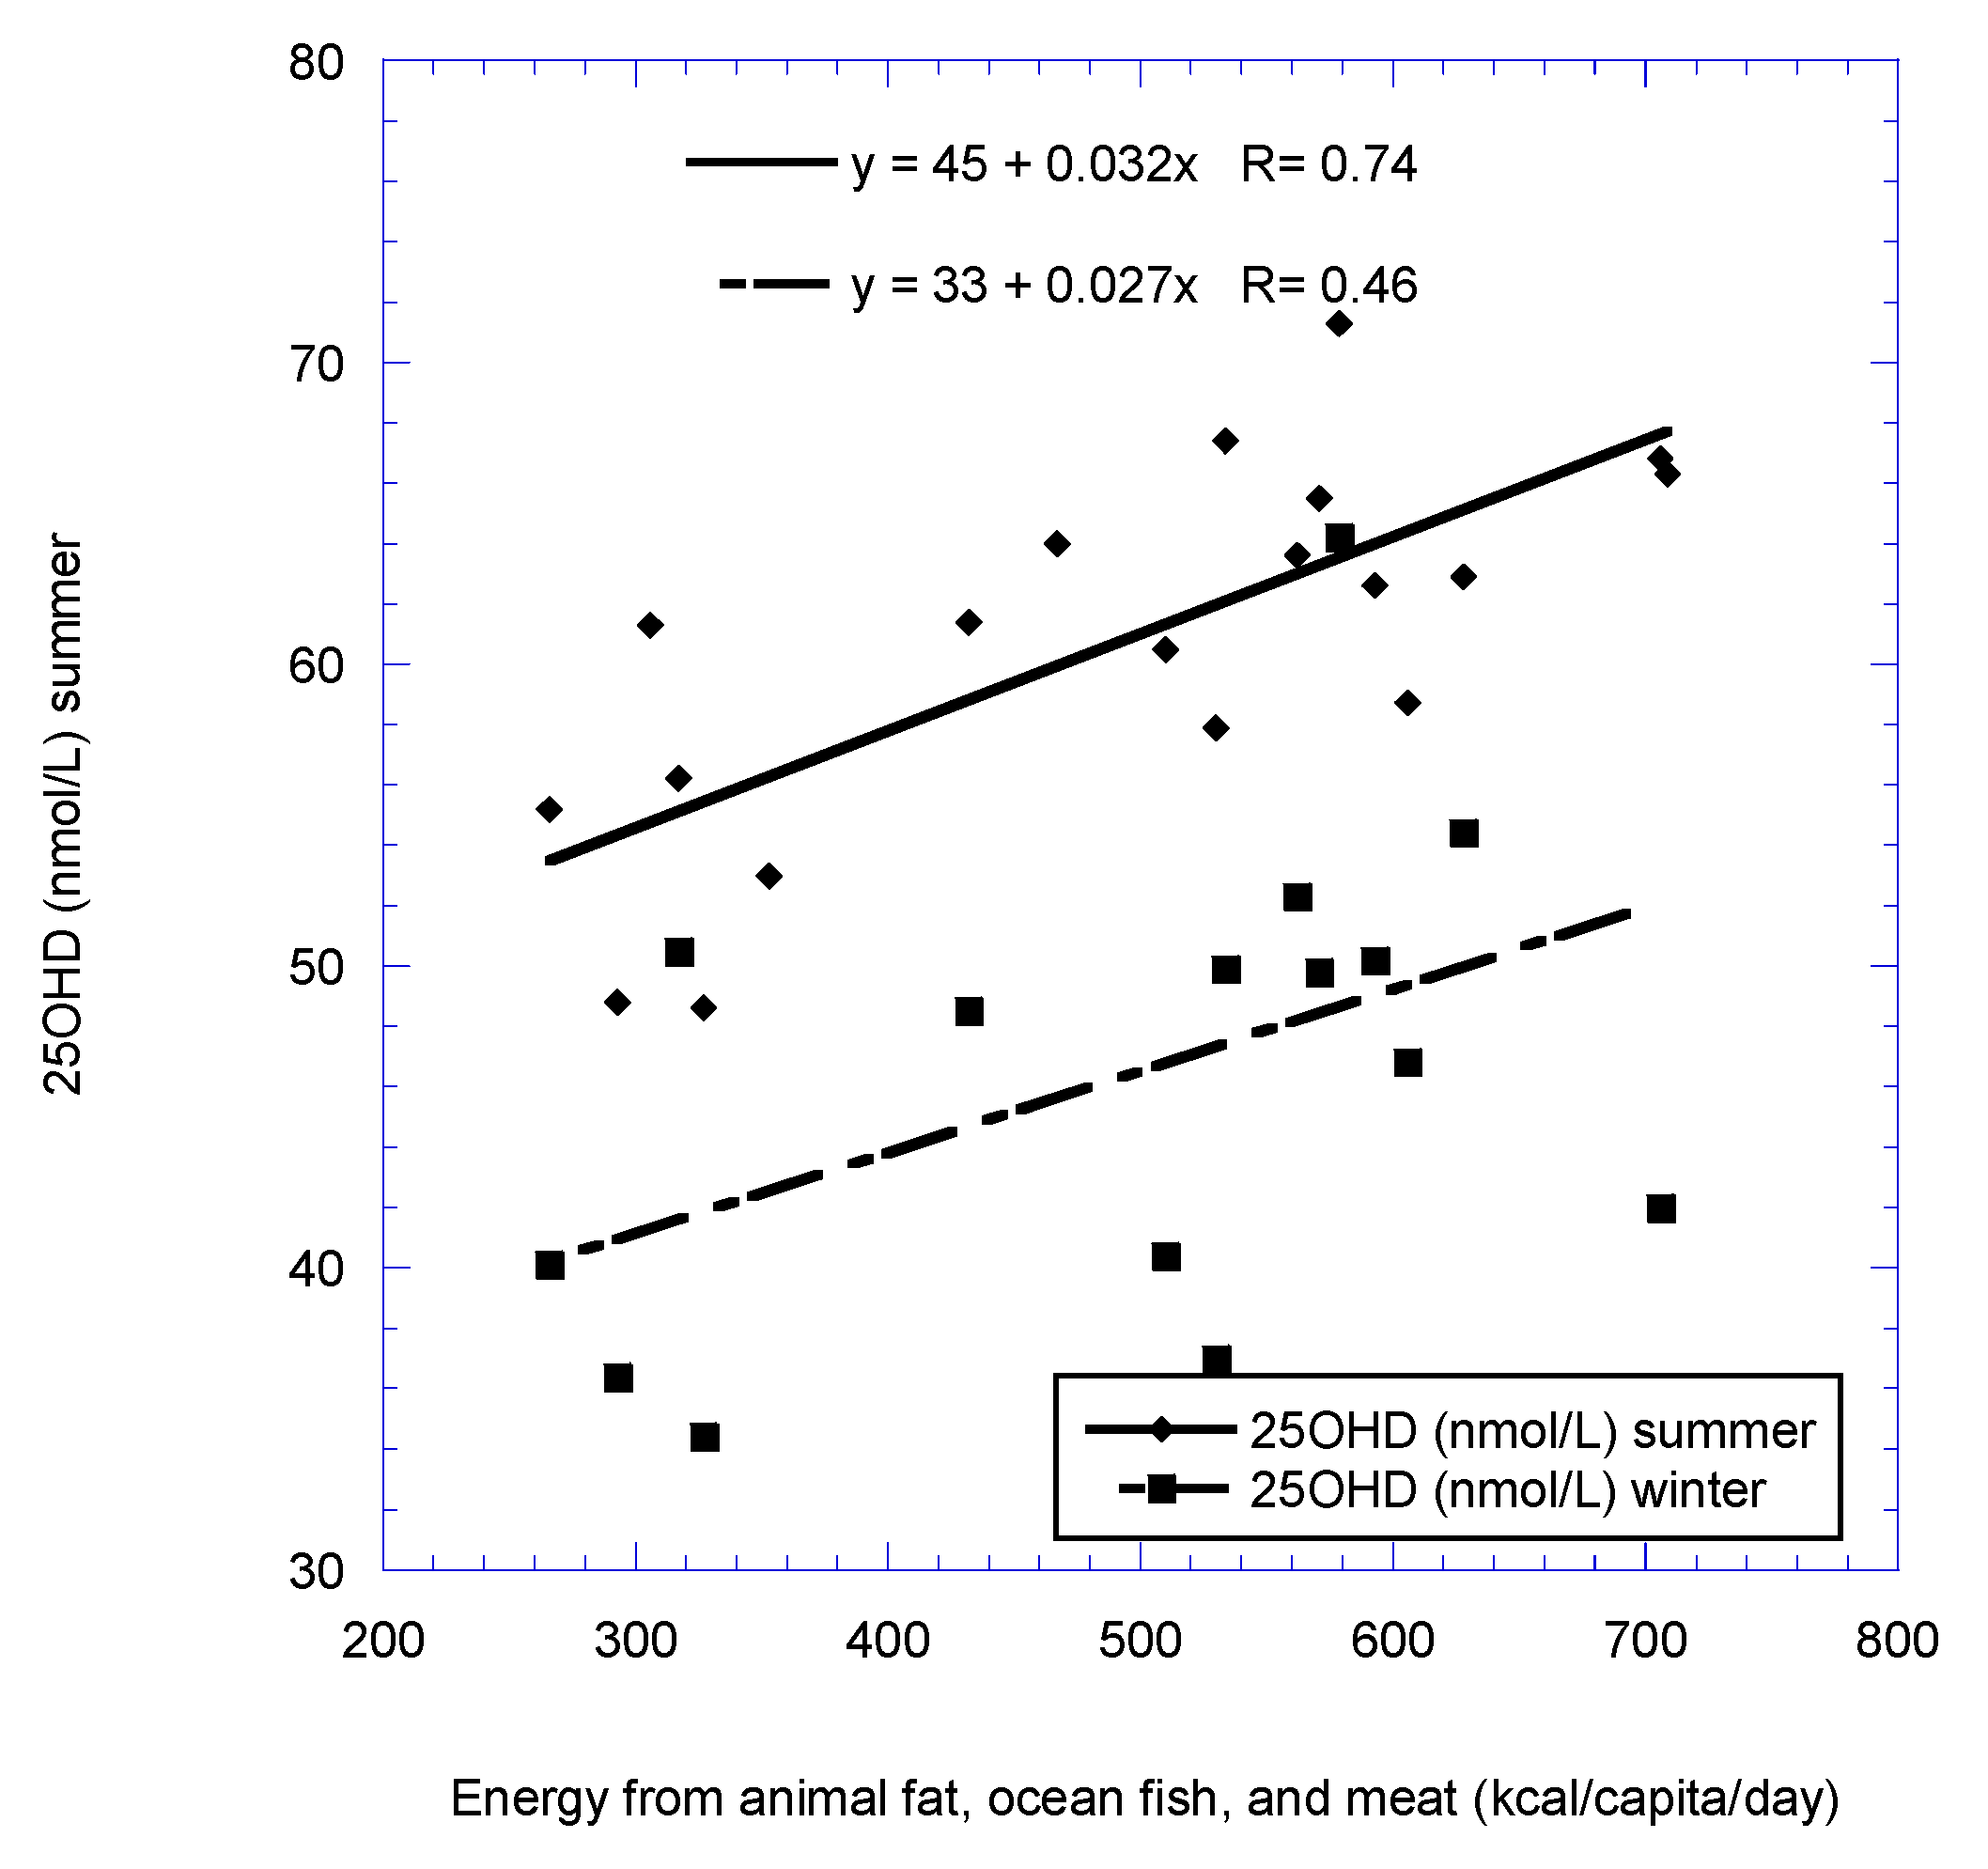
| Animal fat, ocean fish, meat | 0.74, 0.032, <0.001 | 0.46, 0.027, 0.09 |
| Animal fat, ocean fish, eggs, meat | 0.73, 0.030, <0.001 | 0.44, 0.025, 0.10 |
| Animal fat, ocean fish | 0.65, 0.049, 0.003 | 0.48, 0.05, 0.07 |
| Animal fat, eggs, ocean fish | 0.65, 0.046, 0.03 | 0.46, 0.048, 0.08 |
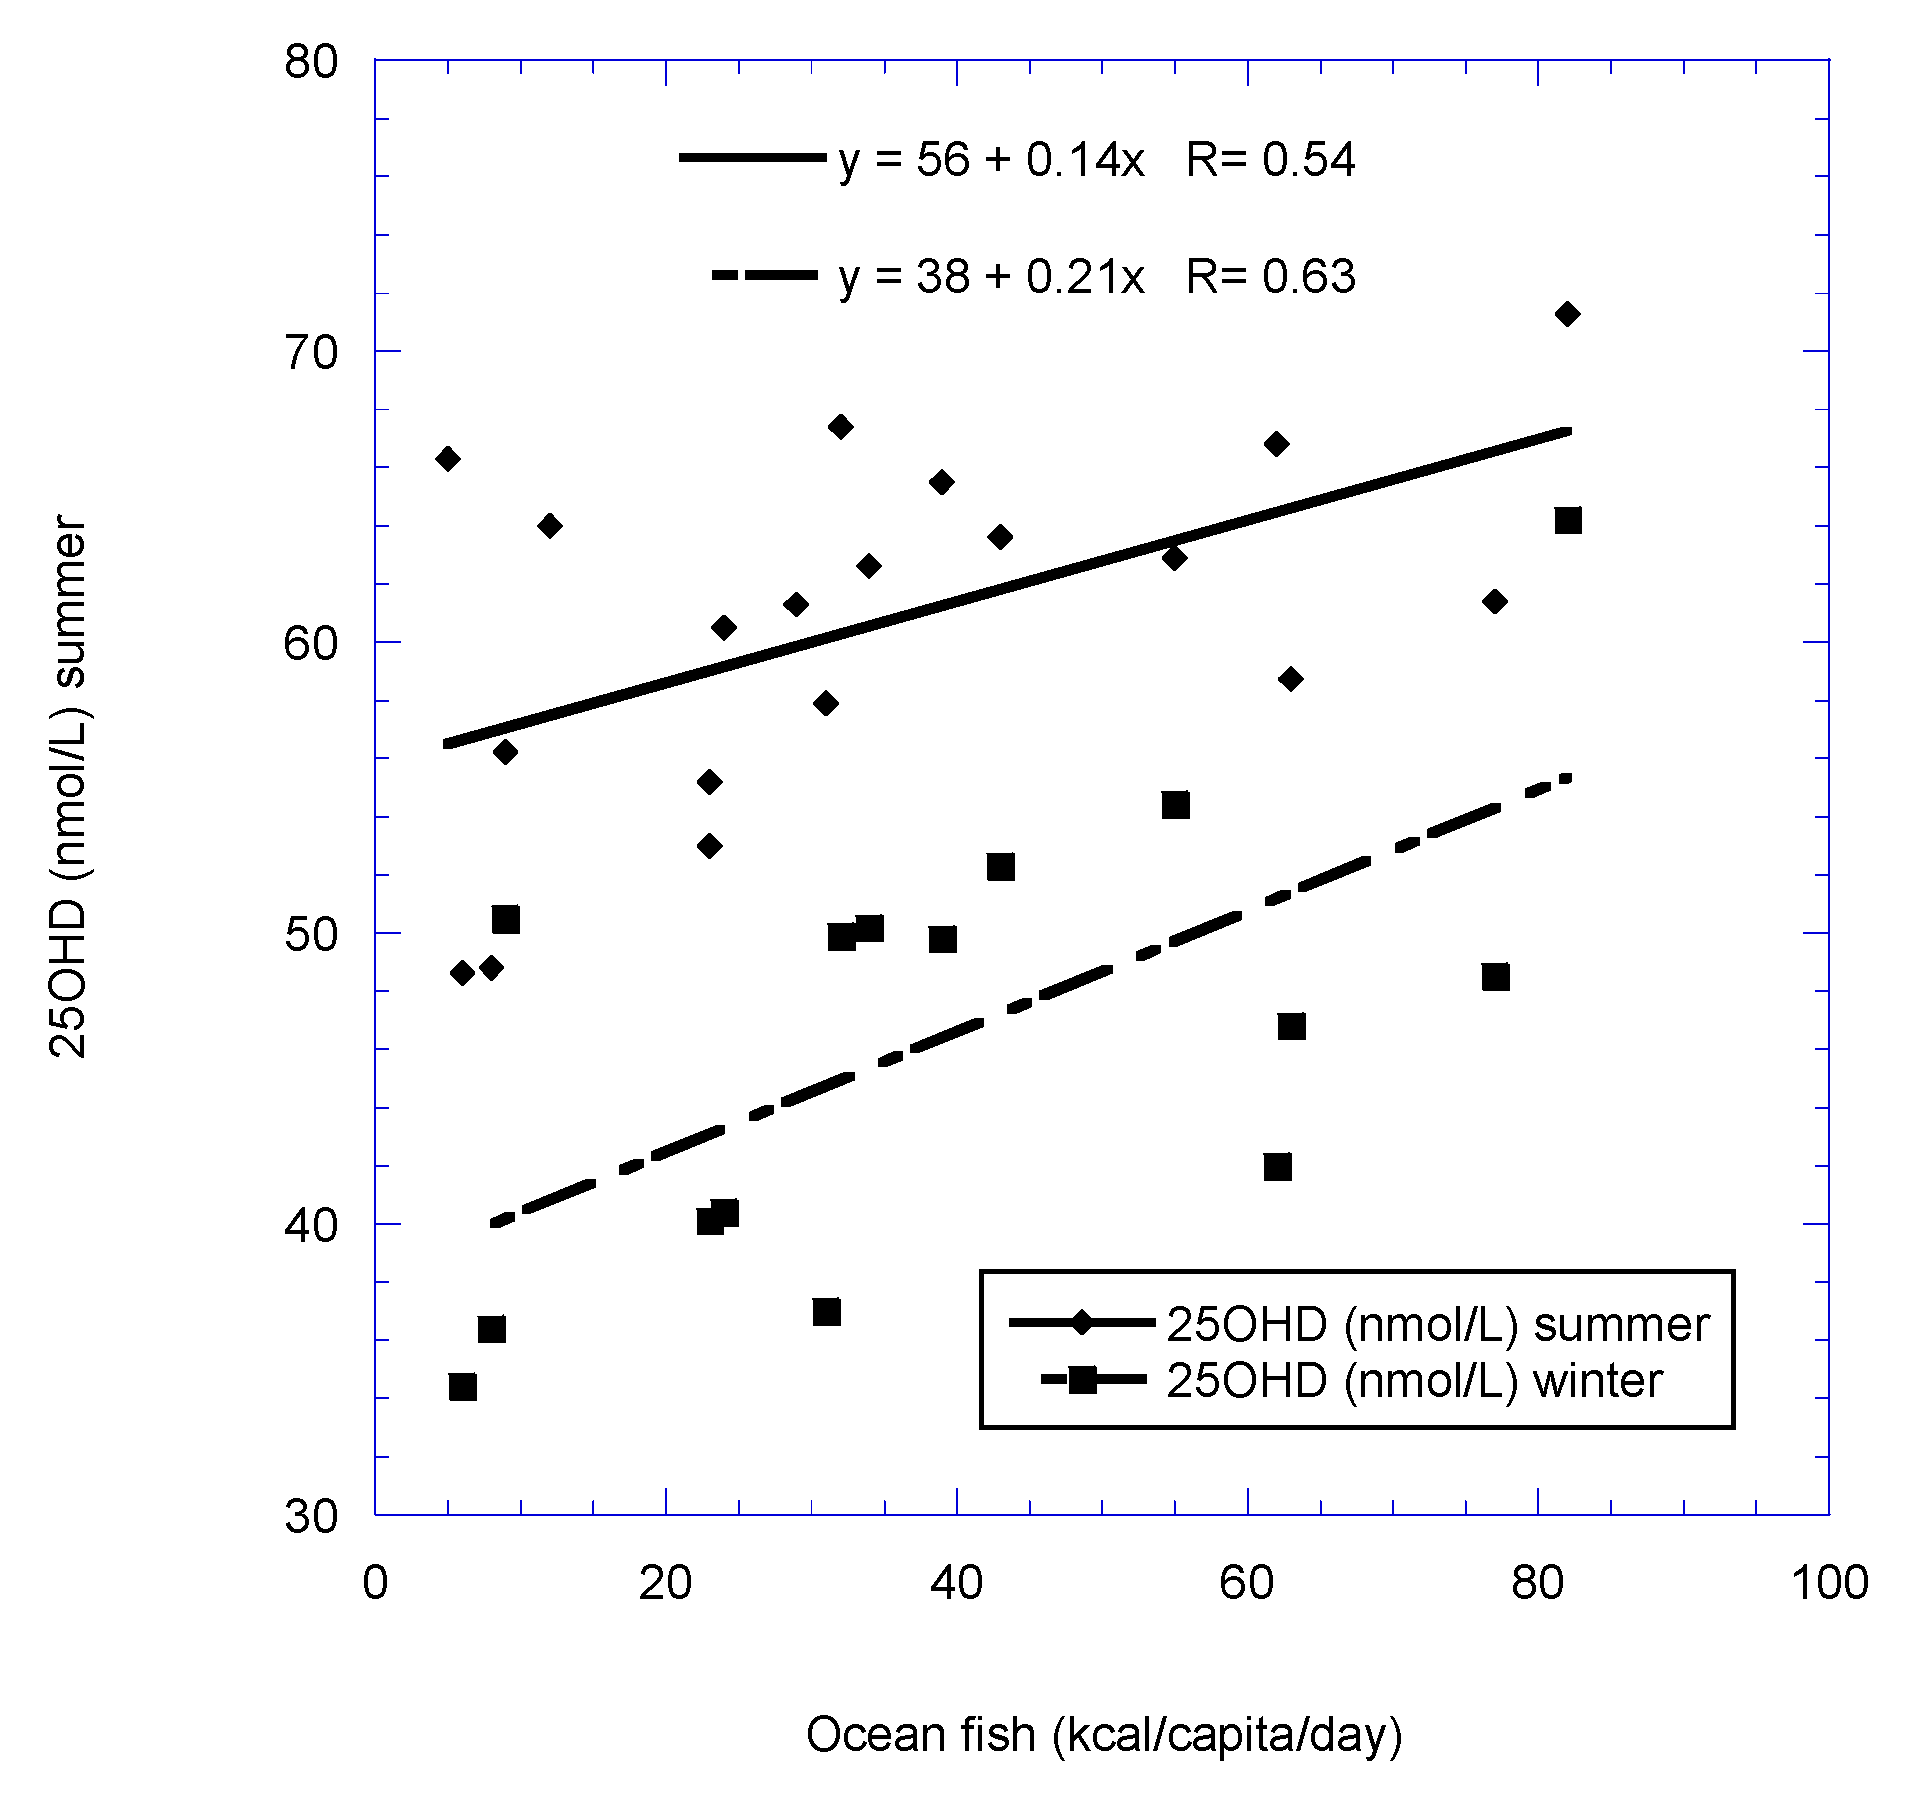
| Ocean fish | 0.54, 0.14, 0.02 | 0.63, 0.21, 0.01 |
| Animal fat | 0.51, 0.039, 0.03 | 0.32, 0.040, 0.25 |
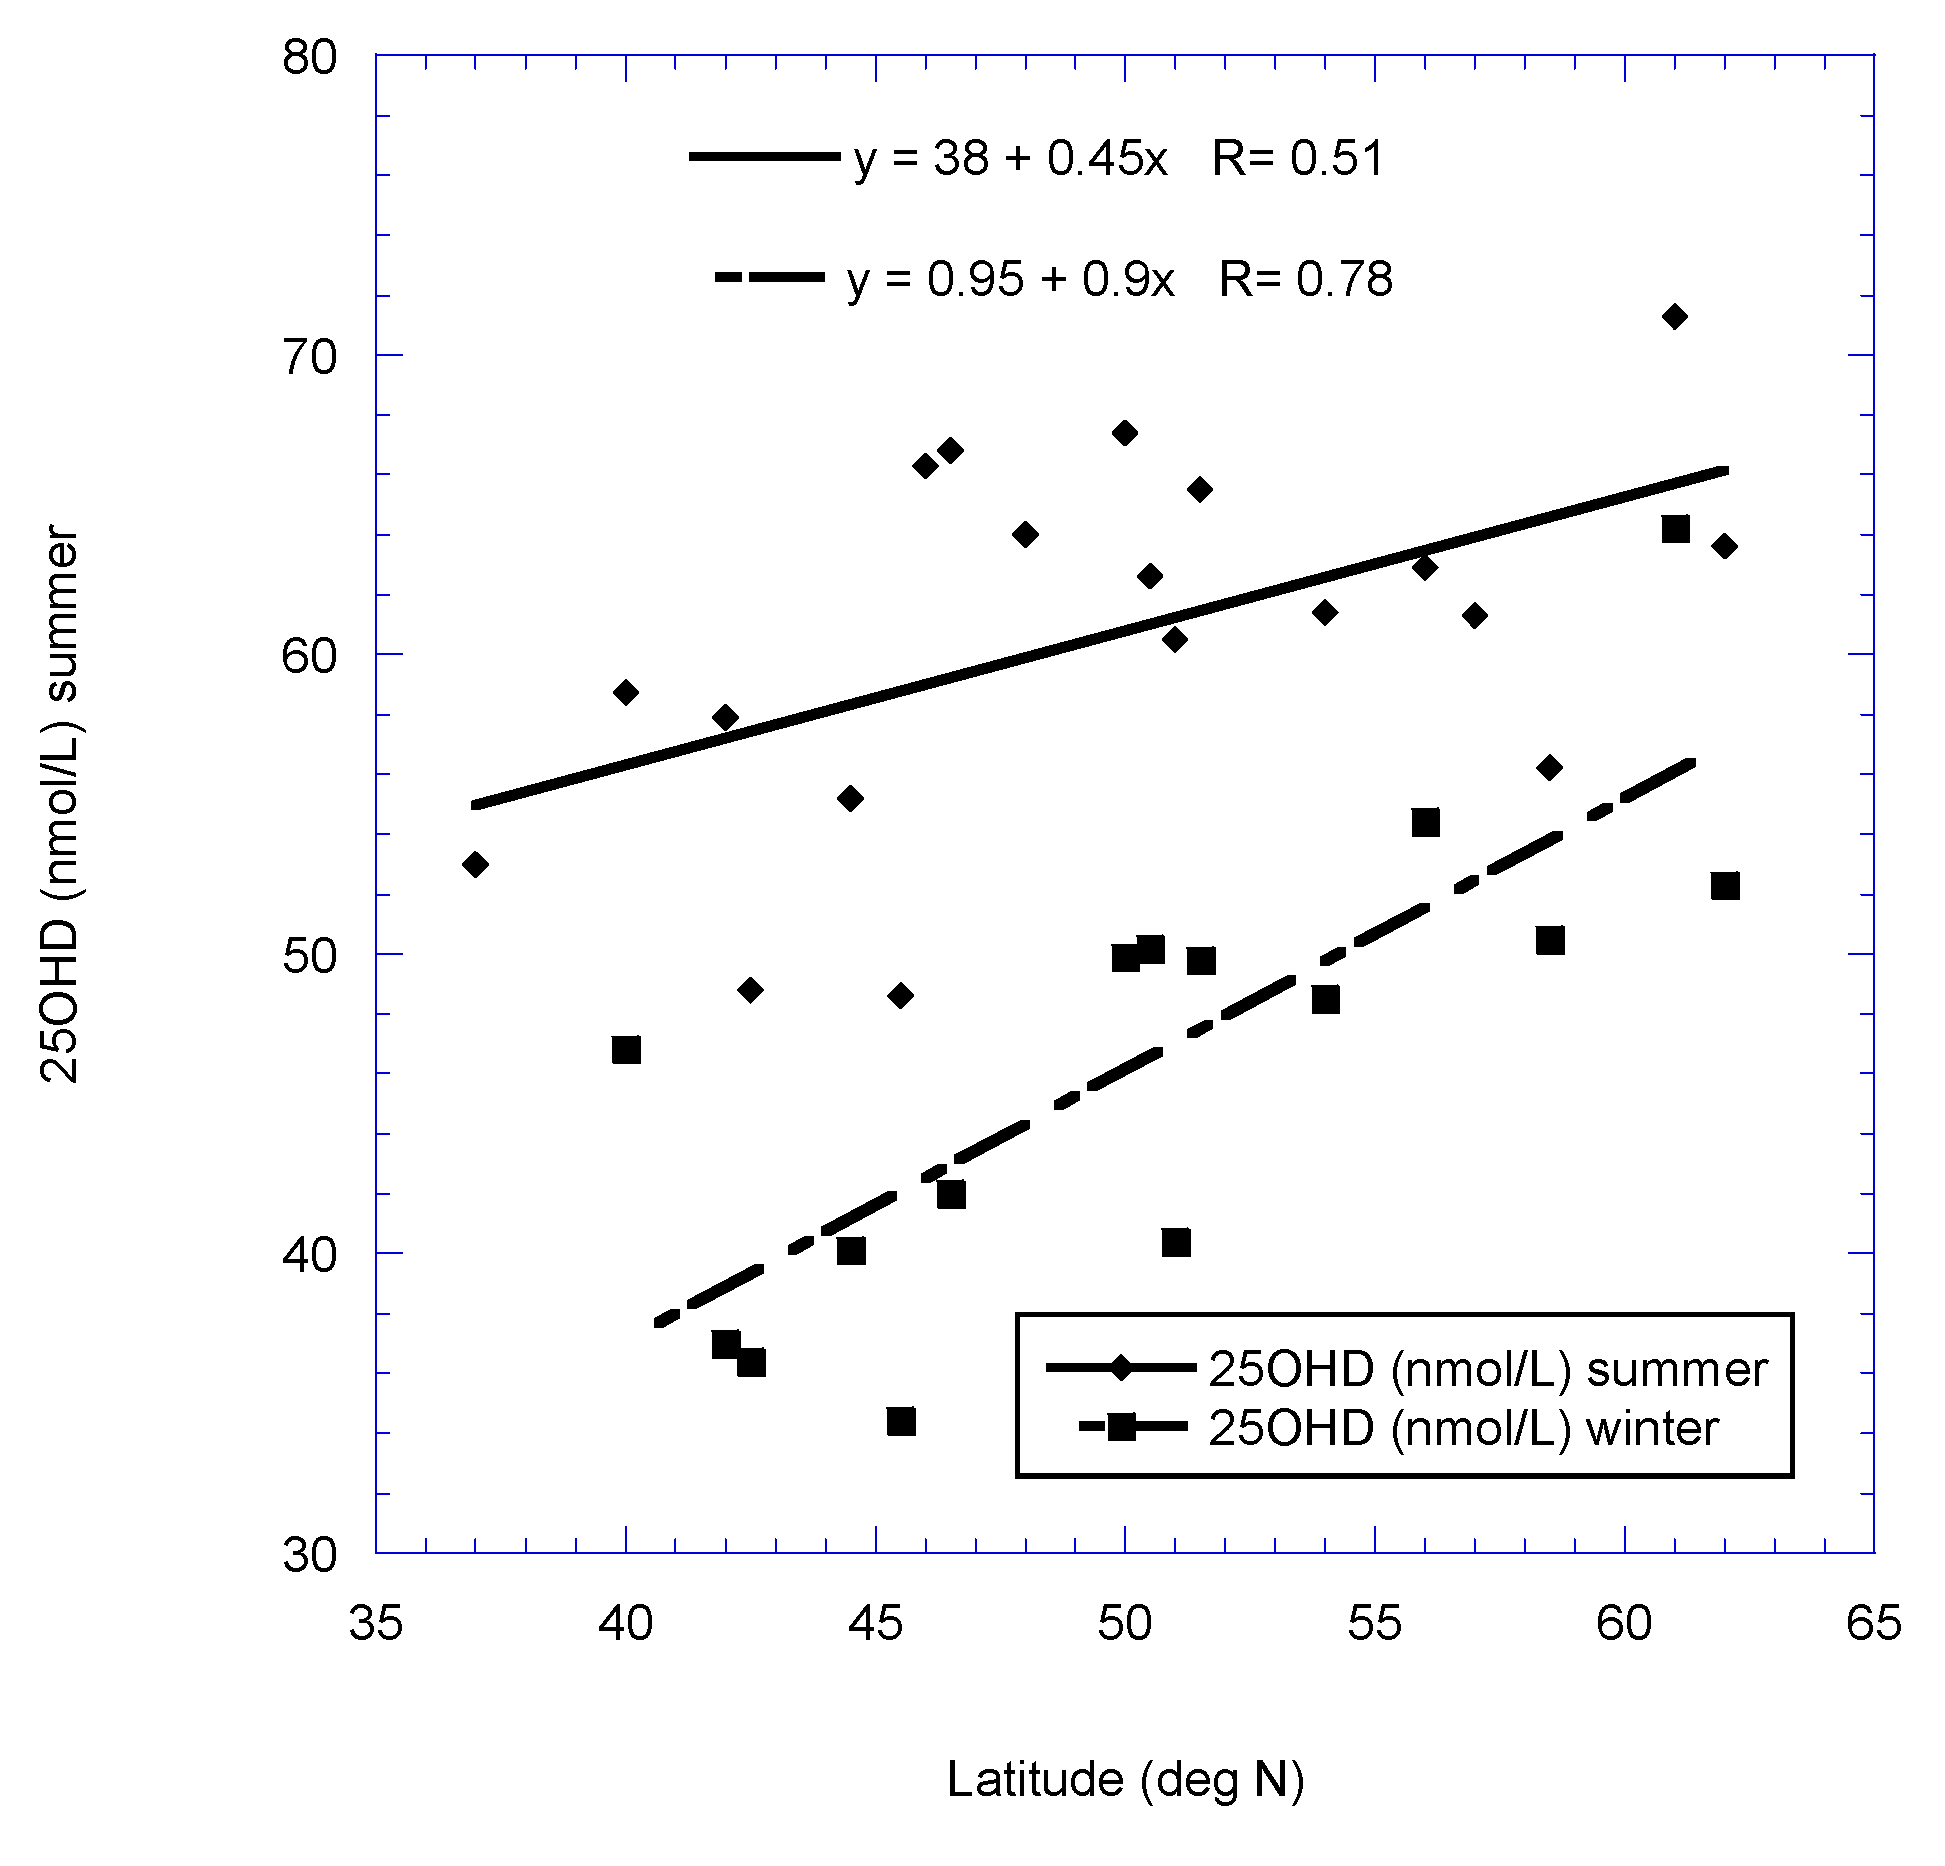
| Latitude | 0.51, 0.45, 0.02 | 0.78, 0.90, <0.001 |
| Meat | 0.50, 0.030, 0.03 | NS |
| UVB dose | 0.47, −2.7, 0.04 | 0.56, −3.9, 0.03 |
| Factor | Latitude | Latitude (Omit Portugal) |
|---|---|---|
| Milk, eggs | 0.80, 0.058, <0.001 | 0.80, 0.058, 0.001 |
| UVB | 0.89, −3.6, <0.001 | 0.89, −3.6, <0.001 |
| Milk | 0.79, 0.062, <0.001 | 0.79, 0.062, 0.001 |
| Eggs | 0.75, 0.67, 0.002 | 0.75, 0.67, 0.003 |
| Ocean fish | 0.57, 0.33, 0.03 | 0.73, 0.53, 0.005 |
| Meat | 0.43, 0.034, 0.12 | 0.44, 0.20, 0.13 |
| Animal fat | 0.30, 0.093, 0.29 | 0.42, 0.12, 0.15 |
| Factor | Latitude |
|---|---|
| UVB | 0.78, −5.2, <0.001 |
| Milk | 0.47, 0.023, 0.27 |
| Ocean fish | 0.32, 0.098, 0.18 |
| Eggs | NS |
| Meat | NS |
| Animal fat | NS |
| Country | Assay | Mean Age (years) | Veiled (nmol/L) | Not Veiled (nmol/L) | Western (nmol/L) | Ref. |
|---|---|---|---|---|---|---|
| Bahrain | ELISA | 33 | 20 ± 19 Abayah | 23 ± 19 | [9] | |
| Egypt * | IEMA radioimmune, DiaSorin | 42 ± 8 | 58 ± 23 | [45] | ||
| Jordan | Immunodiagnostic | 39 | 29 ± 4 Niqab (7.3%) * | [46] | ||
| 34 | 31 ± 6 Hijab (46.7%) * | |||||
| 23 | 40 ± 8 (13.3%) * | |||||
| Lebanon | Radioimmune, Instar | 39 | 13 ± 9 (47%) * | 25 ± 16 (53%) * | [7] | |
| Protein-binding, DiaSorin | 55 | 40 ± 19 (17%) * | 68 ± 35 (83%) * | [47] | ||
| Syria | Elecsys 2010, Roche | 36 | 13 (10–22 IQR) (60%) * | 17 (10–33 IQR) (40%) * | [39] | |
| Tunisia | Radioimmune, Instar | 40? | 35 ± ? (38%) * | 43 ± ? (62%) * | [5] | |
| UAE | chemiluminescent microparticle immunoassay, Abbott | 45 | 44 ± 14 (38%) * | 40 ± 13 (41%) * | 47 ± 16 (21%) | [8] |
© 2019 by the authors. Licensee MDPI, Basel, Switzerland. This article is an open access article distributed under the terms and conditions of the Creative Commons Attribution (CC BY) license (http://creativecommons.org/licenses/by/4.0/).
Share and Cite
Grant, W.B.; Fakhoury, H.M.A.; Karras, S.N.; Al Anouti, F.; Bhattoa, H.P. Variations in 25-Hydroxyvitamin D in Countries from the Middle East and Europe: The Roles of UVB Exposure and Diet. Nutrients 2019, 11, 2065. https://doi.org/10.3390/nu11092065
Grant WB, Fakhoury HMA, Karras SN, Al Anouti F, Bhattoa HP. Variations in 25-Hydroxyvitamin D in Countries from the Middle East and Europe: The Roles of UVB Exposure and Diet. Nutrients. 2019; 11(9):2065. https://doi.org/10.3390/nu11092065
Chicago/Turabian StyleGrant, William B., Hana M. A. Fakhoury, Spyridon N. Karras, Fatme Al Anouti, and Harjit P. Bhattoa. 2019. "Variations in 25-Hydroxyvitamin D in Countries from the Middle East and Europe: The Roles of UVB Exposure and Diet" Nutrients 11, no. 9: 2065. https://doi.org/10.3390/nu11092065
APA StyleGrant, W. B., Fakhoury, H. M. A., Karras, S. N., Al Anouti, F., & Bhattoa, H. P. (2019). Variations in 25-Hydroxyvitamin D in Countries from the Middle East and Europe: The Roles of UVB Exposure and Diet. Nutrients, 11(9), 2065. https://doi.org/10.3390/nu11092065