High-Protein Diet Containing Dairy Products is Associated with Low Body Mass Index and Glucose Concentrations: A Cross-Sectional Study

 ,
,
Abstract
:1. Introduction
2. Materials and Methods
2.1. Design of Study
2.2. Physical Activity
2.3. Anthropometric Measurements
2.4. Random Glucose Assessment
2.5. Food Intake
2.6. Statistical Analysis
3. Results
3.1. Subject Characteristics
3.2. Association Between Legume Protein with Anthropometric Measures and Blood Glucose
3.3. Association between Total Protein Intake with Anthropometric Measures and Blood Glucose
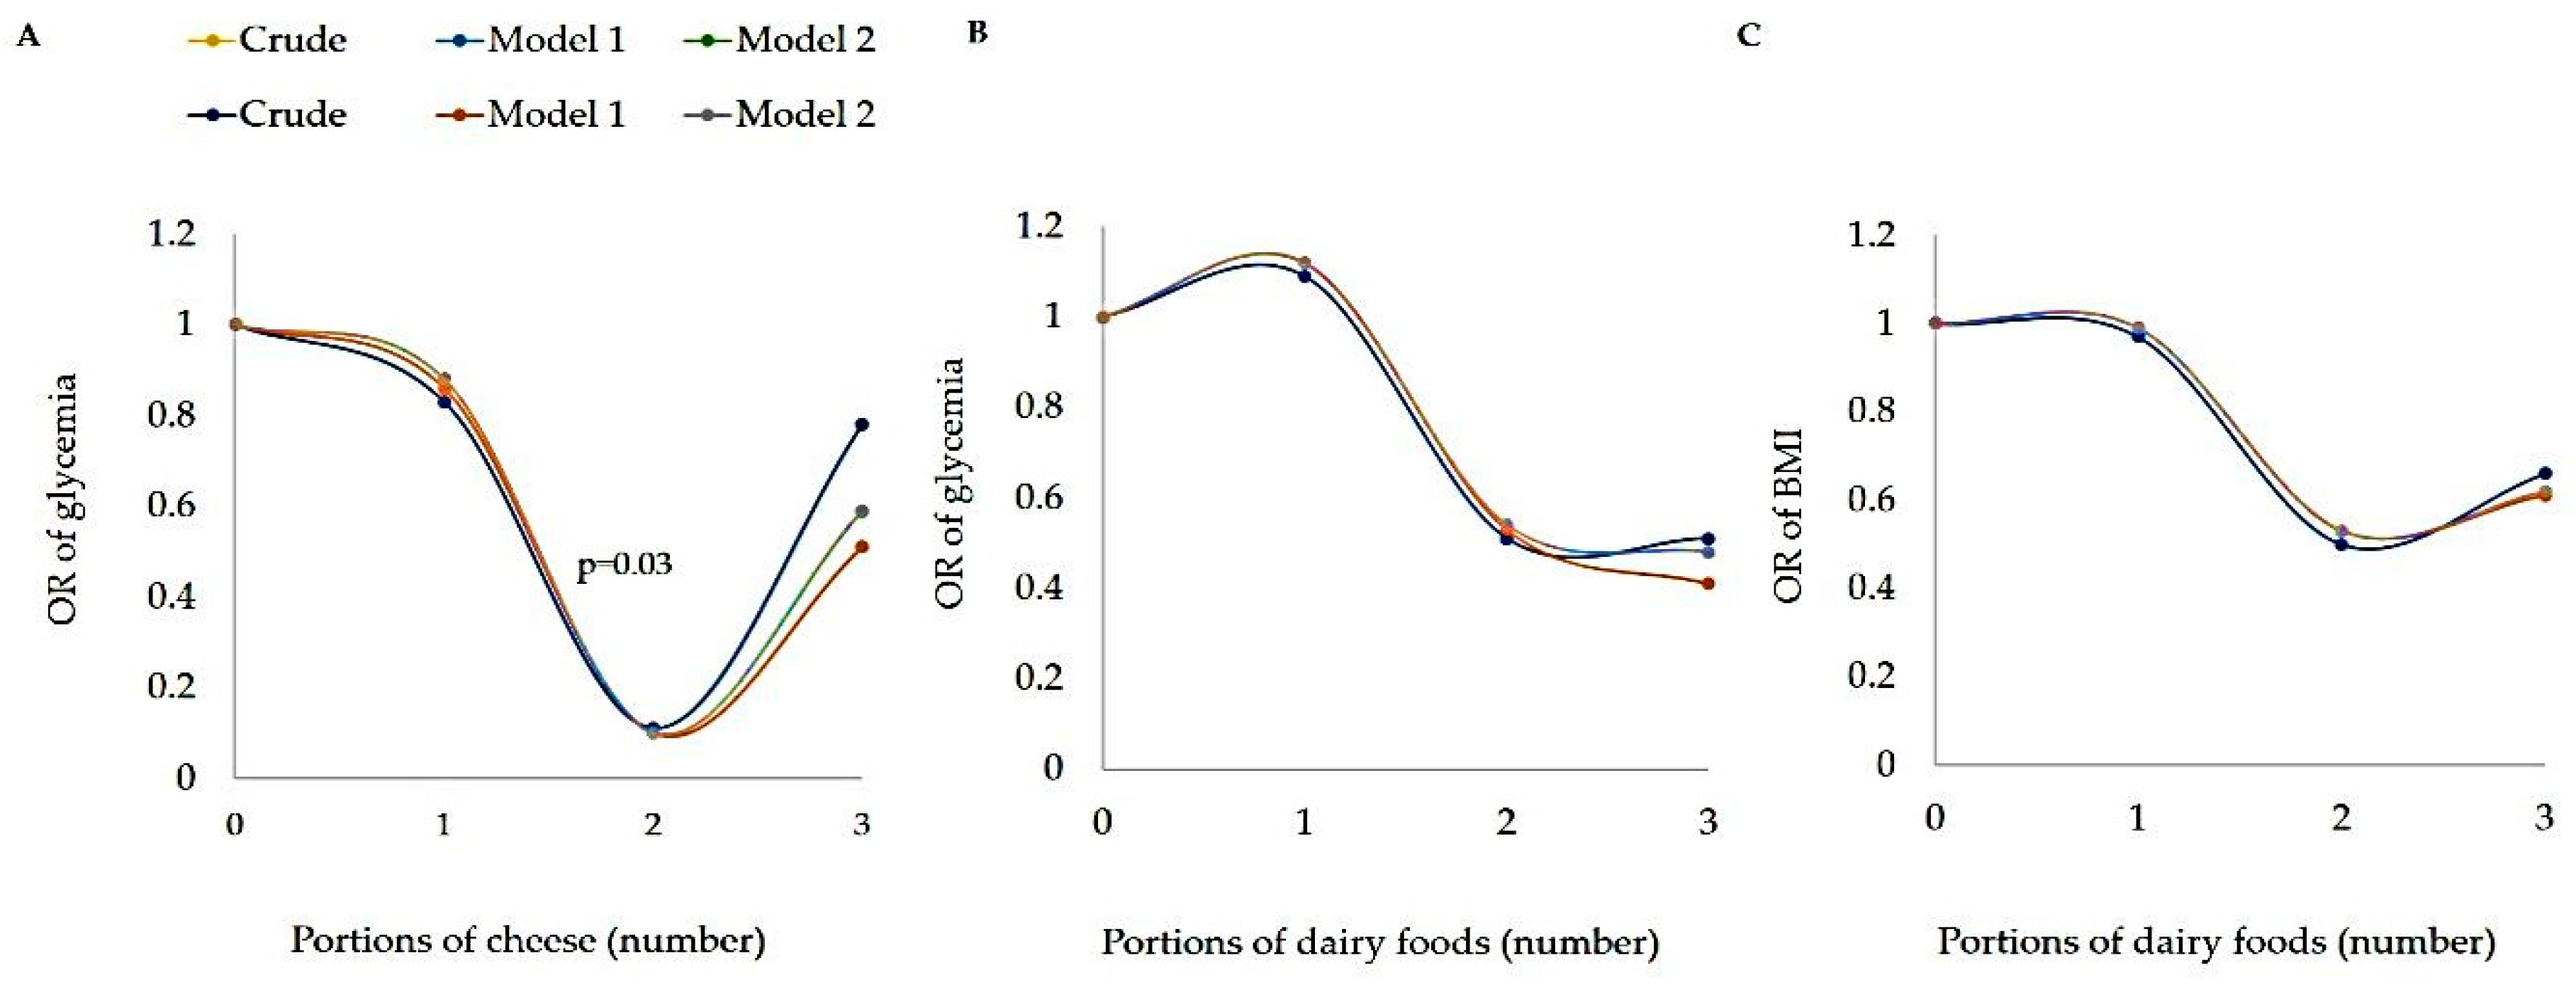
3.4. Association between Dairy Intake with Anthropometrics Measurements and Blood Glucose
3.5. Association between Meat and Egg Intake with Anthropometric Measurements and Blood Glucose
4. Discussion
5. Conclusions
Author Contributions
Funding
Acknowledgments
Conflicts of Interest
References
- World Health Organization. Obesity: Preventing and Managing the Global Epidemic. Available online: https://www.who.int/nutrition/publications/obesity/WHO_TRS_894/en/ (accessed on 10 May 2018).
- Phillips, S.M.; Chevalier, S.; Leidy, H.J. Protein “requirements” beyond the RDA: Implications for optimizing health. Appl. Physiol. Nutr. Metab. 2016, 41, 1–8. [Google Scholar] [CrossRef] [PubMed]
- Van Nielen, M.; Feskens, E.J.M.; Rietman, A.; Siebelink, E.; Mensink, M. Partly replacing meat protein with soy protein alters insulin resistance and blood lipids in postmenopausal women with abdominal obesity. J. Nutr. 2014, 144, 1423–1429. [Google Scholar] [CrossRef]
- Westerterp-Plantenga, M.S.; Nieuwenhuizen, A.; Tomé, D.; Soenen, S.; Westerterp, K.R. Dietary protein, weight loss, and weight maintenance. Annu. Rev. Nutr. 2009, 29, 21–41. [Google Scholar] [CrossRef] [PubMed]
- Ronis, M.J.; Chen, Y.; Badeaux, J.; Badger, T.M. Dietary soy protein isolate attenuates metabolic syndrome in rats via effects on PPAR, LXR, and SREBP signaling. J. Nutr. 2009, 139, 1431–1438. [Google Scholar] [CrossRef] [PubMed]
- Marinangeli, C.P.F.; House, J.D. Potential impact of the digestible indispensable amino acid score as a measure of protein quality on dietary regulations and health. Nutr. Rev. 2017, 75, 658–667. [Google Scholar] [CrossRef] [PubMed] [Green Version]
- Thorning, T.K.; Raben, A.; Tholstrup, T.; Soedamah-Muthu, S.S.; Givens, I.; Astrup, A. Milk and dairy products: Good or bad for human health? An assessment of the totality of scientific evidence. Food Nutr. Res. 2016, 60, 32527. [Google Scholar] [CrossRef]
- Sousa, G.T.; Lira, F.S.; Rosa, J.C.; de Oliveira, E.P.; Oyama, L.M.; Santos, R.V.; Pimentel, G.D. Dietary whey protein lessens several risk factors for metabolic diseases: A review. Lipids Health Dis. 2012, 11, 67. [Google Scholar] [CrossRef]
- World Health Organization. Global Recommendations on Physical Activity for Health—Fact Sheet Physical Activity. Available online: https://www.who.int/dietphysicalactivity/factsheet_recommendations/en/ (accessed on 2 May 2018).
- Lipschitz, D.A. Screening for nutritional status in the elderly. Prim. Care 1994, 21, 55–67. [Google Scholar]
- Lohman, T.G.; Roche, A.F.; Martorell, R. Anthropometric Standardization Reference Manual, 1st ed.; Human Kinetic Books: Champaign, IL, USA, 1988; ISBN 978-0873221214. [Google Scholar]
- ABESO. VI Diretrizes Brasileiras de Obesidade. Available online: http://www.abeso.org.br/diretrizes (accessed on 10 May 2018).
- Frisancho, A.R. New norms of upper limb fat and muscle areas for assessment of nutritional status. Am. J. Clin. Nutr. 1981, 34, 2540–2545. [Google Scholar] [CrossRef]
- American Diabetes Association (ADA). Standard Medical Care in Diabetes 2018. J. Clin. Appl. Res. Educ. 2018, 41, 1–150. [Google Scholar]
- Fisberg, R.M.; Slater, B.; Marchioni, D.M.L.; Martini, L.A. Inquéritos alimentares: Métodos e bases científicas, 1st ed.; Manole: São Paulo, Brazil, 2005; ISBN 978-8520416389. [Google Scholar]
- USDA Food Composition Databases. Available online: https://ndb.nal.usda.gov/ndb/ (accessed on 10 May 2018).
- Ministério da Saúde. Guia alimentar para a população Brasileira. Promovendo a alimentação Saudável, 1st ed.; Ministério da Saúde: Brasília, Brazil, 2008; ISBN 85-334-1154-5.
- Devries, M.C.; Phillips, S.M. Supplemental Protein in Support of Muscle Mass and Health: Advantage Whey. J. Food Sci. 2015, 80, A8–A15. [Google Scholar] [CrossRef] [PubMed]
- Soenen, S.; Bonomi, A.G.; Lemmens, S.G.T.; Scholte, J.; Thijssen, M.A.M.A.; Van Berkum, F.; Westerterp-Plantenga, M.S. Relatively high-protein or “low-carb” energy-restricted diets for body weight loss and body weight maintenance? Physiol. Behav. 2012, 107, 374–380. [Google Scholar] [CrossRef] [PubMed]
- Phillips, S.M.; Tipton, K.D.; van Loon, L.J.C.; Verdijk, L.B.; Paddon-Jones, D.; Close, G.L. Exceptional body composition changes attributed to collagen peptide supplementation and resistance training in older sarcopenic men. Br. J. Nutr. 2016, 116, 569–570. [Google Scholar] [CrossRef] [PubMed] [Green Version]
- Phillips, S.M.; Martinson, W. Nutrient-rich, high-quality, protein-containing dairy foods in combination with exercise in aging persons to mitigate sarcopenia. Nutr. Rev. 2019, 77, 216–229. [Google Scholar] [CrossRef] [PubMed]
- Rietman, A.; Schwarz, J.; Tomé, D.; Kok, F.J.; Mensink, M. High dietary protein intake, reducing or eliciting insulin resistance? Eur. J. Clin. Nutr. 2014, 68, 973–979. [Google Scholar] [CrossRef] [PubMed] [Green Version]
- Abargouei, A.S.; Janghorbani, M.; Salehi-Marzijarani, M.; Esmaillzadeh, A. Effect of dairy consumption on weight and body composition in adults: A systematic review and meta-analysis of randomized controlled clinical trials. Int. J. Obes. 2012, 36, 1485–1493. [Google Scholar] [CrossRef] [PubMed]
- Szilagyi, A. Complex interactions of obesity, dairy food intake and genetics of Lactase. J. Obes. Chronic Dis. 2018, 2, 44–54. [Google Scholar] [CrossRef]
- Burton-Freeman, B.M. Glycomacropeptide (GMP) is not critical to whey-induced satiety, but may have a unique role in energy intake regulation through cholecystokinin (CCK). Physiol. Behav. 2008, 93, 379–387. [Google Scholar] [CrossRef]
- Foltz, M.; Ansems, P.; Schwarz, J.; Tasker, M.C.; Lourbakos, A.; Gerhardt, C.C. Protein hydrolysates induce CCK release from Enteroendocrine cells and act as partial agonists of the CCK1 receptor. J. Agric. Food Chem. 2008, 56, 837–843. [Google Scholar] [CrossRef]
- Chen, M.; Pan, A.; Malik, V.S.; Hu, F.B. Effects of dairy intake on body weight and fat: A meta-analysis of randomized controlled trials. Am. J. Clin. Nutr. 2012, 96, 735–747. [Google Scholar] [CrossRef]
- Hirahatake, K.M.; Slavin, J.L.; Maki, K.C.; Adams, S.H. Associations between dairy foods, diabetes, and metabolic health: Potential mechanisms and future directions. Metabolism 2014, 63, 618–627. [Google Scholar] [CrossRef] [PubMed] [Green Version]
- Gijsbers, L.; Ding, E.L.; Malik, V.S.; de Goede, J.; Geleijnse, J.M.; Soedamah-Muthu, S.S. Consumption of dairy foods and diabetes incidence: A dose-response meta-analysis of observational studies. Am. J. Clin. Nutr. 2016, 103, 1111–1124. [Google Scholar] [CrossRef] [PubMed]
- Aune, D.; Norat, T.; Romundstad, P.; Vatten, L.J. Dairy products and the risk of type 2 diabetes: A systematic review and dose-response meta-analysis of cohort studies. Am. J. Clin. Nutr. 2013, 98, 1066–1083. [Google Scholar] [CrossRef]
- Zheng, H.; Yde, C.C.; Clausen, M.R.; Kristensen, M.; Lorenzen, J.; Astrup, A.; Bertram, H.C. Metabolomics investigation to shed light on cheese as a possible piece in the french paradox puzzle. J. Agric. Food Chem. 2015, 63, 2830–2839. [Google Scholar] [CrossRef] [PubMed]
- Pasin, G.; Comerford, K.B. Dairy foods and dairy proteins in the management of type 2 diabetes: A systematic review of the clinical evidence. Adv. Nutr. 2015, 6, 245–259. [Google Scholar] [CrossRef]
- Tonstad, S.; Malik, N.; Haddad, E. A high-fibre bean-rich diet versus a low-carbohydrate diet for obesity. J. Hum. Nutr. Diet. 2014, 27, 109–116. [Google Scholar] [CrossRef] [PubMed]
- Dos Santos Vieira, D.; Hermes Sales, C.; Galvão Cesar, C.; Marchioni, D.; Fisberg, R. Influence of Haem, Non-Haem, and Total Iron Intake on Metabolic Syndrome and Its Components: A Population-Based Study. Nutrients 2018, 10, 314. [Google Scholar] [CrossRef] [PubMed]
- Pallottini, A.C.; Sales, C.H.; Vieira, D.A.D.S.; Marchioni, D.M.; Fisberg, R.M. Dietary BCAA intake is associated with demographic, socioeconomic and lifestyle factors in residents of São Paulo, Brazil. Nutrients 2017, 9, 449. [Google Scholar] [CrossRef] [PubMed]
- Gemming, L.; Jiang, Y.; Swinburn, B.; Utter, J.; Mhurchu, C.N. Under-reporting remains a key limitation of self-reported dietary intake: An analysis of the 2008/09 New Zealand Adult Nutrition Survey. Eur. J. Clin. Nutr. 2014, 68, 259–264. [Google Scholar] [CrossRef]

| Variables | Low-protein <0.8 g/kg N = 130 | Normoprotein 0.8–1.2 g/kg N = 130 | High-protein >1.2 g/kg N = 158 | p |
|---|---|---|---|---|
| Sociodemographic | ||||
| Age (years) | 50.35 ± 16.42A | 46.09 ± 14.62AB | 40.01 ± 16.91B | <0.001 *,¥ |
| Adults (%) | 85 (26.90) | 100 (31.65) | 131 (41.46) | 0.002 * |
| Elderly (%) | 45 (44.12) | 30 (29.41) | 27 (26.47) | |
| Gender (n) | ||||
| Men (%) | 62 (31.63) | 52 (26.53) | 82 (41.84) | 0.129 |
| Women (%) | 68 (30.63) | 78 (35.14) | 76 (34.23) | |
| Regular physical activity (n) | ||||
| Yes (%) | 46 (36.38) | 48 (36.92) | 45 (28.48) | 0.257 |
| No (%) | 84 (64.62) | 82 (63.08) | 113 (71.52) | |
| Smoking (n) | ||||
| Yes (%) | 13 (39.39) | 9 (27.27) | 11 (33.34) | 0.563 |
| No (%) | 117 (30.39) | 121 (31.43) | 147 (38.18) | |
| Alcohol consumption (n) | ||||
| Yes (%) | 56 (27.59) | 67 (33.00) | 80 (39.41) | 0.317 |
| No (%) | 74 (34.42) | 63 (29.30) | 78 (36.28) | |
| Anthropometric Measurements | ||||
| BMI (kg/m2) | 27.57 ± 4.43A | 26.82 ± 4.70AB | 24.26 ± 3.91B | <0.001 *,¥ |
| Normal | 55 (25.82) | 58 (27.23) | 100 (46.95) | <0.001* |
| Overweight | 75 (36.59) | 72 (35.12) | 58 (28.29) | |
| TSFT (mm) | 25.35 ± 9.11A | 25.07 ± 8.35AB | 20.35 ± 8.08B | <0.001 *,¥ |
| WC (cm) | 96.19 ± 10.95A | 93.41 ± 11.12AB | 87.98 ± 11.69B | <0.001 * |
| Glucose (mg/dL) | 110.14 ± 41.89A | 106.06 ± 30.53AB | 101.55 ± 32.37B | 0.007 *,¥ |
| Food intake | ||||
| Calorie (kcal) | 1310.05 ± 539.01A | 1782.45 ± 569.93B | 2408.76 ± 832.39C | <0.001 *,¥ |
| Carbohydrate (%) | 50.48 ± 12.79A | 45.34 ± 12.08B | 39.00 ± 11.36C | <0.001 *,¥ |
| Lipids (%) | 13.64 ± 4.49A | 17.51 ± 6.31B | 21.26 ± 6.08C | <0.001 *,¥ |
| Protein (%) | 15.09 ± 4.74A | 15.97 ± 4.54A | 17.25 ± 4.05B | <0.001 *,¥ |
| Protein (g/kg) | 0.56 ± 0.18A | 0.98 ± 0.11B | 1.80 ± 0.49C | <0.001 * |
| Leucine (g) | 1.36 ± 0.99A | 2.24 ± 1.68B | 3.83 ± 3.83C | <0.001 *,¥ |
| Fiber (g) | 15.69 ± 10.83A | 19.34 ± 12.83B | 22.65 ± 12.17B | <0.001 *,¥ |
| Protein (g/kg) | ||||
| Adults | 0.56 ± 0.17A | 0.98 ± 0.11B | 1.79 ± 0.49C | <0.001 *,¥ |
| Elderly | 0.56 ± 0.18A | 0.99 ± 0.12B | 1.83 ± 0.51C | <0.001 *,¥ |
| Variables | Legumes | p |
|---|---|---|
| BMI (kg/m2) | OR (CI 95%) | |
| Normal (adults <25 or elderly <27) | 1 | |
| Overweight (adults ≥25 or elderly ≥27) | ||
| Crude | 1.05 (0.89–1.26) | 0.533 |
| Model 1 | 1.02 (0.85–1.22) | 0.828 |
| Model 2 | 1.03 (0.83–1.29) | 0.769 |
| TSFT (Percentile) | ||
| Normal (≥percentile 10 <percentile 90) | 1 | |
| High (≥percentile 90) | ||
| Crude | 1.12 (0.92–1.35) | 0.248 |
| Model 1 | 1.01 (0.82–1.23) | 0.938 |
| Model 2 | 0.99 (0.78–1.26) | 0.964 |
| WC (cm) | ||
| Normal (Women <80 or Men <94) | 1 | |
| High (Women ≥80 or Men ≥94) | ||
| Crude | 0.92 (0.77–1.11) | 0.417 |
| Model 1 | 1.00 (0.82–1.23) | 0.967 |
| Model 2 | 1.08 (0.84–1.40) | 0.548 |
| Glucose (mg/dL) | ||
| Normal (<200) | 1 | |
| High (≥200) | ||
| Crude | 0.92 (0.74–1.14) | 0.455 |
| Model 1 | 1.15 (0.95–1.39) | 0.152 |
| Model 2 | 1.16 (0.92–1.46) | 0.209 |
| Variables | Total Protein Intake | p |
|---|---|---|
| BMI (kg/m2) | ||
| Normal (adults <25 or elderly <27) | 1 | |
| Overweight (adults ≥25 or elderly ≥27) | ||
| Crude | 0.45 (0.32–0.64) | <0.001 |
| Model 1 | 0.47 (0.33–0.67) | <0.001 |
| Model 2 | 0.26 (0.16–0.44) | <0.001 |
| TSFT (Percentile) | ||
| Normal (≥percentile 10 <percentile 90) | 1 | |
| High (≥percentile 90) | ||
| Crude | 0.55 (0.37–0.81) | 0.003 |
| Model 1 | 0.52 (0.34–0.79) | 0.002 |
| Model 2 | 0.27 (0.15–0.51) | <0.001 |
| WC (cm) | ||
| Normal (Women <80 or Men <94) | 1 | |
| High (Women ≥80 or Men ≥94) | ||
| Crude | 0.36 (0.25–0.51) | <0.001 |
| Model 1 | 0.44 (0.30–0.65) | <0.001 |
| Model 2 | 0.25 (0.14–0.43) | <0.001 |
| Glucose (mg/dL) | ||
| Normal (<200) | 1 | |
| High (≥200) | ||
| Crude | 0.52 (0.37–0.74) | <0.001 |
| Model 1 | 0.60 (0.42–0.86) | 0.006 |
| Model 2 | 0.56 (0.34–0.91) | 0.019 |
| Variables | Milk | p | Skimmed Yogurt | p | Whole Yogurt | p | Cheese | p | Curd Cheese | p | Dairy Products | p |
|---|---|---|---|---|---|---|---|---|---|---|---|---|
| BMI (kg/m2) | OR (CI 95%) | OR (CI 95%) | OR (CI 95%) | OR (CI 95%) | OR (CI 95%) | OR (CI 95%) | ||||||
| Normal | 1 | 1 | 1 | 1 | 1 | 1 | ||||||
| Overweight | ||||||||||||
| Crude | 0.83 (0.67–1.04) | 0.107 | 0.64 (0.20–2.09) | 0.463 | 0.60 (0.35–1.00) | 0.051 | 0.80 (0.62–1.03) | 0.088 | 0.64 (0.12–3.22) | 0.585 | 0.80 (0.67–0.92) | 0.003 |
| Model 1 | 0.83 (0.67–1.04) | 0.113 | 0.68 (0.21–2.21) | 0.521 | 0.63 (0.37–1.06) | 0.083 | 0.78 (0.60–1.01) | 0.062 | 0.68 (0.13–3.39) | 0.635 | 0.79 (0.68–0.93) | 0.004 |
| Model 2 | 0.84 (0.67–1.04) | 0.118 | 0.68 (0.21–2.21) | 0.522 | 0.63 (0.37–1.07) | 0.086 | 0.78 (0.61–1.01) | 0.065 | 0.68 (0.14–3.45) | 0.647 | 0.79 (0.67–0.92) | 0.004 |
| TSFT (Percentile) | ||||||||||||
| Normal | 1 | 1 | 1 | 1 | 1 | 1 | ||||||
| High | ||||||||||||
| Crude | 0.88 (0.67–1.14) | 0.330 | 0.85 (0.23–2.95) | 0.805 | 0.97 (0.61–1.54) | 0.906 | 1.13 (0.88–1.46) | 0.344 | 0.43 (0.43–4.29) | 0.471 | 1.00 (0.86–1.17) | 0.993 |
| Model 1 | 0.91 (0.71–1.18) | 0.497 | 0.91 (0.89–0.24) | 0.887 | 1.14 (0.70–1.84) | 0.602 | 1.09 (0.83–1.42) | 0.543 | 0.40 (0.04–3.87) | 0.428 | 1.01 (0.87–1.19) | 0.821 |
| Model 2 | 0.91 (0.71–1.18) | 0.488 | 0.90 (0.23–3.49) | 0.886 | 1.14 (0.70–1.85) | 0.593 | 1.09 (0.83–1.42) | 0.542 | 0.40 (0.04–3.85) | 0.426 | 1.01 (0.87–1.20) | 0.823 |
| WC (cm) | ||||||||||||
| Normal | 1 | 1 | 1 | 1 | 1 | 1 | ||||||
| High | ||||||||||||
| Crude | 0.90 (0.72–1.12) | 0.333 | 0.89 (0.30–2.67) | 0.842 | 0.84 (0.55–1.28) | 0.424 | 0.85 (0.66–1.08) | 0.191 | 0.76 (0.15–3.74) | 0.738 | 0.89 (0.77–1.02) | 0.105 |
| Model 1 | 0.85 (0.67–1.07) | 0.160 | 1.03 (0.25–4.19) | 0.966 | 0.84 (0.54–1.32) | 0.459 | 0.86 (0.66–1.17) | 0.259 | 1.42 (0.27–7.41) | 0.681 | 0.87 (0.75–1.01) | 0.078 |
| Model 2 | 0.84 (0.67–1.07) | 0.167 | 1.03 (0.25–4.20) | 0.969 | 0.83 (0.53–1.31) | 0.430 | 0.86 (0.66–1.12) | 0.254 | 1.44 (0.27–7.61) | 0.665 | 0.86 (0.74–1.01) | 0.073 |
| Glucose (mg/dL) | ||||||||||||
| Normal | 1 | 1 | 1 | 1 | 1 | 1 | ||||||
| High | ||||||||||||
| Crude | 0.92 (0.74–1.14) | 0.455 | 1.00 (0.35–2.83) | 0.995 | 0.75 (0.47–1.18) | 0.212 | 0.76 (0.58–1.00) | 0.053 | 0.57 (0.11–3.02) | 0.508 | 0.86 (0.74–1.00) | 0.052 |
| Model 1 | 0.91 (0.74–1.14) | 0.427 | 1.12 (0.39–3.23) | 0.827 | 0.80 (0.49–1.30) | 0.369 | 0.73 (0.55–0.96) | 0.023 | 0.69 (0.13–3.63) | 0.658 | 0.86 (0.74–0.99) | 0.042 |
| Model 2 | 0.93 (0.74–1.16) | 0.521 | 1.13 (0.39–3.25) | 0.816 | 0.83 (0.51–1.37) | 0.478 | 0.74 (0.56–0.98) | 0.036 | 0.75 (0.14–4.00) | 0.737 | 0.87 (0.75–1.01) | 0.077 |
| Variables | Beef | p | Pork | p | Poultry | p | Fish | p | Eggs | p |
|---|---|---|---|---|---|---|---|---|---|---|
| BMI (kg/m2) | OR (CI 95%) | OR (CI 95%) | OR (CI 95%) | OR (CI 95%) | OR (CI 95%) | |||||
| Normal | 1 | 1 | 1 | 1 | 1 | |||||
| Overweight | ||||||||||
| Crude | 1.05 (0.96–1.15) | 0.319 | 1.43 (0.80–2.56) | 0.224 | 0.94 (0.79–1.12) | 0.483 | 1.11 (0.86–1.45) | 0.423 | 1.06 (0.92–1.24) | 0.403 |
| Model 1 | 1.04 (0.94–1.14) | 0.467 | 1.43 (0.79–2.59) | 0.235 | 0.96 (0.81–1.15) | 0.674 | 1.11 (0.85–1.44) | 0.450 | 1.06 (0.90–1.23) | 0.491 |
| Model 2 | 1.04 (0.94–1.15) | 0.388 | 1.47 (0.81–2.68) | 0.202 | 0.96 (0.81–1.15) | 0.697 | 1.12 (0.85–1.46) | 0.417 | 1.06 (0.91–1.23) | 0.481 |
| TSFT (Percentile) | ||||||||||
| Normal | 1 | 1 | 1 | 1 | 1 | |||||
| High | ||||||||||
| Crude | 1.05 (0.95–1.16) | 0.338 | 1.52 (0.88–2.64) | 0.136 | 0.89 (0.73–1.09) | 0.275 | 1.03 (0.78–1.36) | 0.849 | 1.02 (0.87–1.19) | 0.837 |
| Model 1 | 1.00 (0.90–1.10) | 1.000 | 1.48 (0.81–2.69) | 0.199 | 0.88 (0.72–1.09) | 0.257 | 1.05 (0.78–1.41) | 0.748 | 0.97 (0.82–1.14) | 0.700 |
| Model 2 | 1.00 (0.89–1.11) | 0.987 | 1.50 (0.82–2.77) | 0.190 | 0.88 (0.71–1.09) | 0.249 | 1.05 (0.78–1.42) | 0.731 | 0.97 (0.82–1.14) | 0.711 |
| WC (cm) | ||||||||||
| Normal | 1 | 1 | 1 | 1 | 1 | |||||
| High | ||||||||||
| Crude | 1.00 (0.90–1.10) | 0.960 | 1.78 (0.76–4.13) | 0.184 | 0.82 (0.68–0.98) | 0.031 | 1.23 (0.86–1.74) | 0250 | 0.93 (0.79–108) | 0.338 |
| Model 1 | 1.08 (0.96–1.21) | 0.221 | 2.18 (0.86–5.50) | 0.100 | 0.90 (0.74–1.11) | 0.351 | 1.17 (0.81–1.70) | 0.409 | 0.97 (0.82–1.16) | 0.766 |
| Model 2 | 1.08 (0.96–1.22) | 0.189 | 2.27 (0.89–5.74) | 0.084 | 0.91 (0.75–1.11) | 0.367 | 1.16 (0.79–1.69) | 0.446 | 0.97 (0.81–1.15) | 0.711 |
| Glucose (mg/dL) | ||||||||||
| Normal | 1 | 1 | 1 | 1 | 1 | |||||
| High | ||||||||||
| Crude | 0.99 (0.90–1.08) | 0.786 | 1.50 (0.82–2.73) | 0.186 | 0.86 (0.72–1.04) | 0.120 | 0.98 (0.75–1.28) | 0.891 | 0.88 (0.75–1.03) | 0.118 |
| Model 1 | 0.97 (0.88–1.07) | 0.591 | 1.56 (0.83–2.92) | 0.169 | 0.91 (0.75–1.10) | 0.330 | 0.95 (0.72–1.25) | 0.707 | 0.86 (0.73–1.01) | 0.074 |
| Model 2 | 1.00 (0.90–1.11) | 0.970 | 1.75 (0.93–3.28) | 0.081 | 0.92 (0.76–1.11) | 0.400 | 1.00 (0.75–1.32) | 0.996 | 0.87 (0.74–1.02) | 0.096 |
© 2019 by the authors. Licensee MDPI, Basel, Switzerland. This article is an open access article distributed under the terms and conditions of the Creative Commons Attribution (CC BY) license (http://creativecommons.org/licenses/by/4.0/).
Share and Cite
Giglio, B.M.; Duarte, V.I.R.; Galvão, A.F.; Marini, A.C.B.; Schincaglia, R.M.; Mota, J.F.; Souza, L.B.; Pimentel, G.D. High-Protein Diet Containing Dairy Products is Associated with Low Body Mass Index and Glucose Concentrations: A Cross-Sectional Study. Nutrients 2019, 11, 1384. https://doi.org/10.3390/nu11061384
Giglio BM, Duarte VIR, Galvão AF, Marini ACB, Schincaglia RM, Mota JF, Souza LB, Pimentel GD. High-Protein Diet Containing Dairy Products is Associated with Low Body Mass Index and Glucose Concentrations: A Cross-Sectional Study. Nutrients. 2019; 11(6):1384. https://doi.org/10.3390/nu11061384
Chicago/Turabian StyleGiglio, Bruna M., Valeska I. R. Duarte, Ana Flávia Galvão, Ana Clara B. Marini, Raquel M. Schincaglia, João F. Mota, Luciana B. Souza, and Gustavo D. Pimentel. 2019. "High-Protein Diet Containing Dairy Products is Associated with Low Body Mass Index and Glucose Concentrations: A Cross-Sectional Study" Nutrients 11, no. 6: 1384. https://doi.org/10.3390/nu11061384