Food Security of Adolescents in Selected Khat- and Coffee-Growing Areas in the Sidama Zone, Southern Ethiopia


1
United Nations University Institute for the Advanced Study of Sustainability, Tokyo 150-8925, Japan
2
National Institute for Environmental Studies, Tsukuba 305-0053, Japan
*
Author to whom correspondence should be addressed.
Nutrients 2018, 10(8), 980; https://doi.org/10.3390/nu10080980
Submission received: 9 June 2018
/
Revised: 19 July 2018
/
Accepted: 25 July 2018
/
Published: 27 July 2018
Abstract
:Whilst pervasive food insecurity exists among adolescents in Ethiopia, the available information is scant and inconsistent. Therefore, the main objective of this cross-sectional study was to contribute to these gaps by assessing the food security of adolescents in the selected khat- and coffee-growing areas. We selected 234 (117 girls and 117 boys) adolescents aged 12–18 years via stratified random sampling. We measured the height and weight of the adolescents and asked about their food insecurity experiences. We assessed the prevalence of stunting and thinness using the WHO 2007 growth reference standards. Out of the total, 17 (7.3%) and 30 (12.8%) adolescents were stunted and thin, respectively. In addition, 89 (38.0%) adolescents reported food insecurity experiences and nine (3.8%) were overweight. A regression analyses showed that the stunting was associated with the age of the adolescents and maternal education. Thinness was associated with area, gender, and the number of meals. Food insecurity experiences were associated with health problems in the past 30 days. In general, adolescents from the khat-growing area have better food security than those from the coffee-growing area, and the same is true, gender-wise, for girls compared to boys. We recommend possible interventions primarily for adolescents in coffee-growing areas.
1. Introduction
Adolescents are defined as young people within the age range of 10–19 years and currently constitute the fastest growing segment of the population in most developing countries [1]. There were approximately 1.2 billion adolescents in the world in 2009, accounting for approximately 18% of the world population, and 88% of adolescents live in developing countries [2]. In 2016, nearly a quarter (24.8%) of Ethiopia’s population were adolescents aged 10–19 years [3]. A sizable proportion of adolescents from many developing countries, mostly in southeast Asia and Africa, suffer from undernutrition, which makes them highly vulnerable to potential diseases and premature death [4]. Their risk of vulnerability to undernutrition increases in situations where poverty, famine, and conflicts prevail [5]. Potential impacts of nutritional deficiencies such as stunting are difficult to deal with once adolescence is passed and will become permanent [6]. Catch up growths that occur during childhood and adolescence, usually after recovery from an illness or undernutrition, can restrain, or even correct, growth failures caused by acute malnutrition and chronic diseases [7]. Access to improved nutrition would help a stunted child or adolescent undergo a catch-up growth period and resume a normal growth trajectory before his/her height is permanently reduced [8].
Adolescence is a stage of growth marked by rapid physical growth (e.g., height), often known as an adolescent growth spurt, and behavioral changes [9]. It is at this stage that humans attain more than 20% of their adult height and gain up to 50% of their adult weight and skeletal mass [10]. The requirements for both energy and protein considerably increase during adolescence [4]. However, adolescents are often considered to be fit and less vulnerable to diseases compared to other segments of the society, such as children and the elderly and, therefore, the condition of their health has received little attention until recently [11].
The absence of global or national agencies that specifically target adolescent health shows the negligence in the policy arena [12]. Investments in adolescent health yield triple dividends, i.e., improved health for the adolescents now, a productive force for tomorrow’s economy, and healthy parents that can reproduce and nurture their children [13]. Undernutrition is the single main contributor to growth retardation worldwide [14]. Therefore, any health care provider that deals with adolescents must take into account their nutrition [15]. A study that compared the nutritional status of adolescents from 200 countries from 1975 to 2016 reported that Ethiopian adolescents had the lowest age-standardized mean BMI for both sexes at 16.8 kg/m2 (95% CI, 15.6–17.9 kg/m2) for girls and 15.5 kg/m2 (95% CI, 14.4–16.6 kg/m2) for boys [16]. A study conducted on the impacts of a school feeding program in Ethiopia reported gains in growth indicators such as improved height and body mass index [17]. However, food aid and nutrition-related interventions in Ethiopia, with no exception to the Sidama Zone, often target highly vulnerable segments of the society such as children, nursing mothers, orphans, disabled, elderly, terminally ill patients, HIV victims, and displaced people [18]. Children and elderly are among the primary targets for potential food aid in the Sidama Zone [19]. Research on the subject also appears to focus on one or more of these vulnerable groups, and there are few case studies on the food and nutrition security of adolescents in Ethiopia in general and in the study areas in particular. Therefore, this study targeted adolescents to contribute to the existing knowledge gap concerning the nutritional situations of adolescents in khat- and coffee-growing areas in the Sidama Zone, which is one of the major producers of both crops in Ethiopia [20]. Khat and coffee are prominent cash crops in Ethiopia that support millions of smallholder farmers and earn substantial revenues for the government via taxes and exports.
Ethiopia is the largest coffee producer in Africa and sixth in the world [21]. The Ethiopian coffee sector supports over 15 million people, of which 5 million are smallholder farmers, and coffee is the leading export commodity for the country [22]. Khat is a controversial stimulant plant that is widely grown and consumed in Ethiopia and neighboring countries. It is also a livelihood base for millions of smallholder farmers and many others. Despite its attractive financial returns, khat is often considered an undesirable plant due to its negative health and social impacts [23]. Its buds and leaves contain cathinone and are chewed in fresh condition as a moderate stimulant to alleviate fatigue, increase self-confidence, promote excitation, and suppress sleep and hunger [24]. Khat is often blamed for worsening food insecurity where it grows by displacing conventional staple food crops such as enset (Ensete ventricosum) and maize [25]. Enset, or false banana, is a giant herbaceous plant from the Musaceae family with a large underground corm [26]. It is a staple food crop widely grown in Southern Ethiopia, in general, and the study areas, in particular. However, contrary to such claims, our hypothesis is that adolescents from khat-growing areas have improved food security or nutritional status compared to those from coffee-growing areas. This is due to the high economic return of khat compared to coffee and other cash crops.
There are various methods to assess the nutritional status of adolescents, including the use of anthropometry, which is an inexpensive technique to measure the size and composition of a human body [27]. Stunting (height-for-age Z scores < −2 standard deviation (SD) from the median of the reference group) and thinness (body mass index (BMI) for age Z scores < −2 standard deviation (SD) from the median of the reference group) are the commonly used anthropometric indicators to assess the nutritional status of adolescents [5]. Other methods include the use of indirect measurements such as adolescent responses to selected questions adopted from a standardized food insecurity questionnaire, such as the household food insecurity access scale (HFIAS) [28]. Therefore, the main purpose of this study was to assess the food security or nutritional status of adolescents living in selected khat- and coffee-growing areas with three indicators, i.e., stunting, thinness, and a food insecurity experience index (FIE).
2. Materials and Methods
2.1. Selection of the Study Sites
The study sites were selected from the Southern Nations Nationalities and Peoples Regional State (SNNPRS) of Ethiopia by multistage purposive sampling (Figure 1). First, we selected SNNPRS based on the information from the literature and personal experience. Second, we chose the Sidama Zone from 13 administrative zones in the SNNPRS, in consultation with regional experts due to its increasing potential for both khat and coffee. Third, we selected Dale and Wondo Genet woreda (Woreda’ is the local name for district which is the second lowest administrative unit in Ethiopia) from the 19 khat- and coffee- growing woredas in the Sidama zone, in consultation with zonal experts because of their high potential for khat and coffee respectively. Finally, we picked Abaye kebele (Kebele is the local name for peasant association, the lowest administrative unit in Ethiopia) for khat and Chume kebele for coffee from Wondo Genet and Dale, respectively, in consultation with woreda level experts for the same reason.
Description of the Study Sites
The Sidama Zone is the largest producer of both coffee and khat in the SNNPRS and has a total area of 6981.8 km2. It lies between the latitudes (5′ 45″ N and 6′ 45″ N) and longitudes (38′ E and 39′ E) with an elevation of 1830–2440 m above sea level [29]. It is one of the densely populated (over 460 persons per km2) areas in the region with per household landholding less than two hectares [30]. Wondo Genet is the leading producer of a famous khat known as “beleche”. Similarly, Dale Woreda is a supplier of coffee to regional and national markets. Both of the study areas fall in the subtropical climatic zone with mean annual rainfall of 1123 mm and 1235 mm, mean annual temperature of 17.6 °C and 18.9 °C, and the population of 231,322 and 169,659 for Wondo Genet and Dale, respectively [31]. Chume kebele is located approximately 45 km from Hawassa (Hawassa is the regional capital of the SNNPRS and is located 275 km from the capital Addis Ababa) and has a total area of 800 ha (out of which 426 ha (53.25%) is covered by coffee) and, according to the 2010/11 census, its total population was 5202 [32]. Similarly, Abaye is approximately 27 km from Hawassa and has an area of 1103 ha, out of which 757 ha (68.63%) is covered by perennial crops, primarily khat, and a total population of 11,099 [33].
2.2. Methods
We conducted a cross-sectional study in Abaye and Chume from December 2017 to February 2018 to assess the food security of adolescents aged between 12 and 18 years. Though the adolescence age range is between 10–19 years [1], we excluded those below 12 years, in this study, because we assumed that they are too young to adequately comprehend and answer questions about food insecurity experience (FIE). However, the upper age became 18 years by chance, i.e., we used gender-based stratified simple random sampling, and we did not encounter adolescents older than 18 years. The selection was completely random within a stratum (sex category) with no inclusion or exclusion criteria. We selected 234 adolescents (108 from Chume (55 females and 53 males) and 126 from Abaye (62 females and 64 males)) using gender-based stratified random sampling. We collected basic profiles of the adolescents including age in months and recorded their weight and height with standard procedures [34]. Using a digital scale (Seca 881, Germany), we measured the weight to the nearest 0.1 kg. We measured the height to nearest 0.1 cm with a 5-m non-stretchable metallic measuring tape. We locked the tape at 2 m and tied or fixed it to a straight standing object, usually a door frame, and conducted the measurement while the adolescent stood barefoot very close to the tape matching his/her foot to the zero mark and holding their head straight upright. We calculated the body mass index (BMI) of each adolescent by dividing his/her weight in kilogram by the square of his/her height in meters:
We checked the distribution of the data and calculated the Z-scores for the height for age (HAZ) and the body mass index for age (BMIZ) using the WHO AnthroPlus software (an open software freely available from the World Health Organization website). We determined the nutritional status of the adolescents using the WHO 2007 growth standards [35]. Accordingly, using the height for age Z scores, we categorized them into three classes of stunting, i.e., non-stunted (HAZ > −2 SD), moderately stunted (HAZ < −2 SD), and severely stunted (HAZ < −3 SD). Similarly, using the BMIZ, we categorized them into thin (BMIZ < −2 SD), severely thin (BMIZ < −3 SD), overweight (BMIZ > 1 SD), and obese (BMIZ > 2 SD). To determine the personal food insecurity experience of the adolescents, not that of their family, we used a four-item index obtained from the sum of the adolescents’ responses to the four questions modified by Hadley and others [28] from the household food insecurity access scale (HFIAS) questionnaire. Accordingly, we instructed each respondent to think about his/her personal experience, not that of his/her household or family, and asked him/her if, in the last three months, he/she had ever:
- (i)
- Worried about having enough food;
- (ii)
- Had to reduce food intake because of shortages of food or money to buy food;
- (iii)
- Had to go without eating because of shortages of food or money to buy food; and
- (iv)
- Had to ask outside the home for food because of shortages of food or money to buy food.
We coded the yes responses 1 and the no responses 0, summed up the scores, and produced a food insecurity experience (FIE) index. Finally, we categorized the respondents as food secure if the sum of the responses for the four questions was 0 and food insecure if the sum was greater than 0. We also asked each adolescent if he/she had been sick (unable to go to school, work, or visited a doctor) from any illness in the last 30 days and coded yes responses 1 and the no responses 0.
To ensure ethical standards, we obtained informed consent prior to any measurement or interview from the participating adolescents and their parents. We obtained ethical clearance (ID: 15–186) from the University of Tokyo under the food insecurity impacts of the industrial crops expansion in the sub-Saharan Africa (FICESSA) project. Therefore, only willing adolescents participated in the study and their anthropometric data and responses to the interview questions were treated with confidentiality.
2.3. Statistical Analyses
We used Microsoft Excel to compute descriptive statistics, such as the percent, mean, and median, and SPSS (Version 23.0; IBM Corp., Armonk, NY, USA) to conduct statistical tests (e.g., the chi-squared test). We conducted binary and multivariate logistic regression analyses using SPSS (version 23) to test potential associations between each of the three dependent variables (stunting, thinness, and food insecurity experience) and the 11 explanatory variables. First, we conducted bivariate analyses with each of the independent variables, by entering a single independent variable and a dependent variable at a time. Then, we ran multivariate logistic regression analyses to select covariates for each of the dependent variables with the stepwise forward selection method [36]. The variables we included in the multivariate logistic regression analyses are those that have shown significant association in the bivariate analyses and others reported in the literature [37].
3. Results
3.1. Descriptive Results
Table 1 presents the socio-demographic characteristics of the sample adolescents. The total number of sample adolescents was 234 (117 girls and 117 boys), of which 126 (62 girls and 64 boys) were from Abaye (a khat-growing area) and 108 (55 girls and 53 boys) are from Chume (a coffee-growing area). In terms of livelihood, 73% of the adolescents from Abaye were from families that depend on khat, 5.6% of them were from families that rely on coffee, and 21.4% of them were from families that earned their living from other means of livelihood, such as farming mixed crops, employment, and small businesses. Similarly, 60.2% and 39.8% of the adolescents from Chume were from families that primarily rely on coffee and other means of livelihood, respectively. The girls from Chume are younger and have shorter median height and lower HAZ-score than girls from Abaye; however, boys have comparable age, height, and HAZ-score regardless of the area (Table 1). Overall, the mean Z-scores of height for age of the girls and body mass index for age for both sexes from Chume were significantly lower than the corresponding values from Abaye (Table 1).
3.2. The Nutritional Status and Food Security of the Adolescents
3.2.1. Nutritional Status: Stunting and Thinness
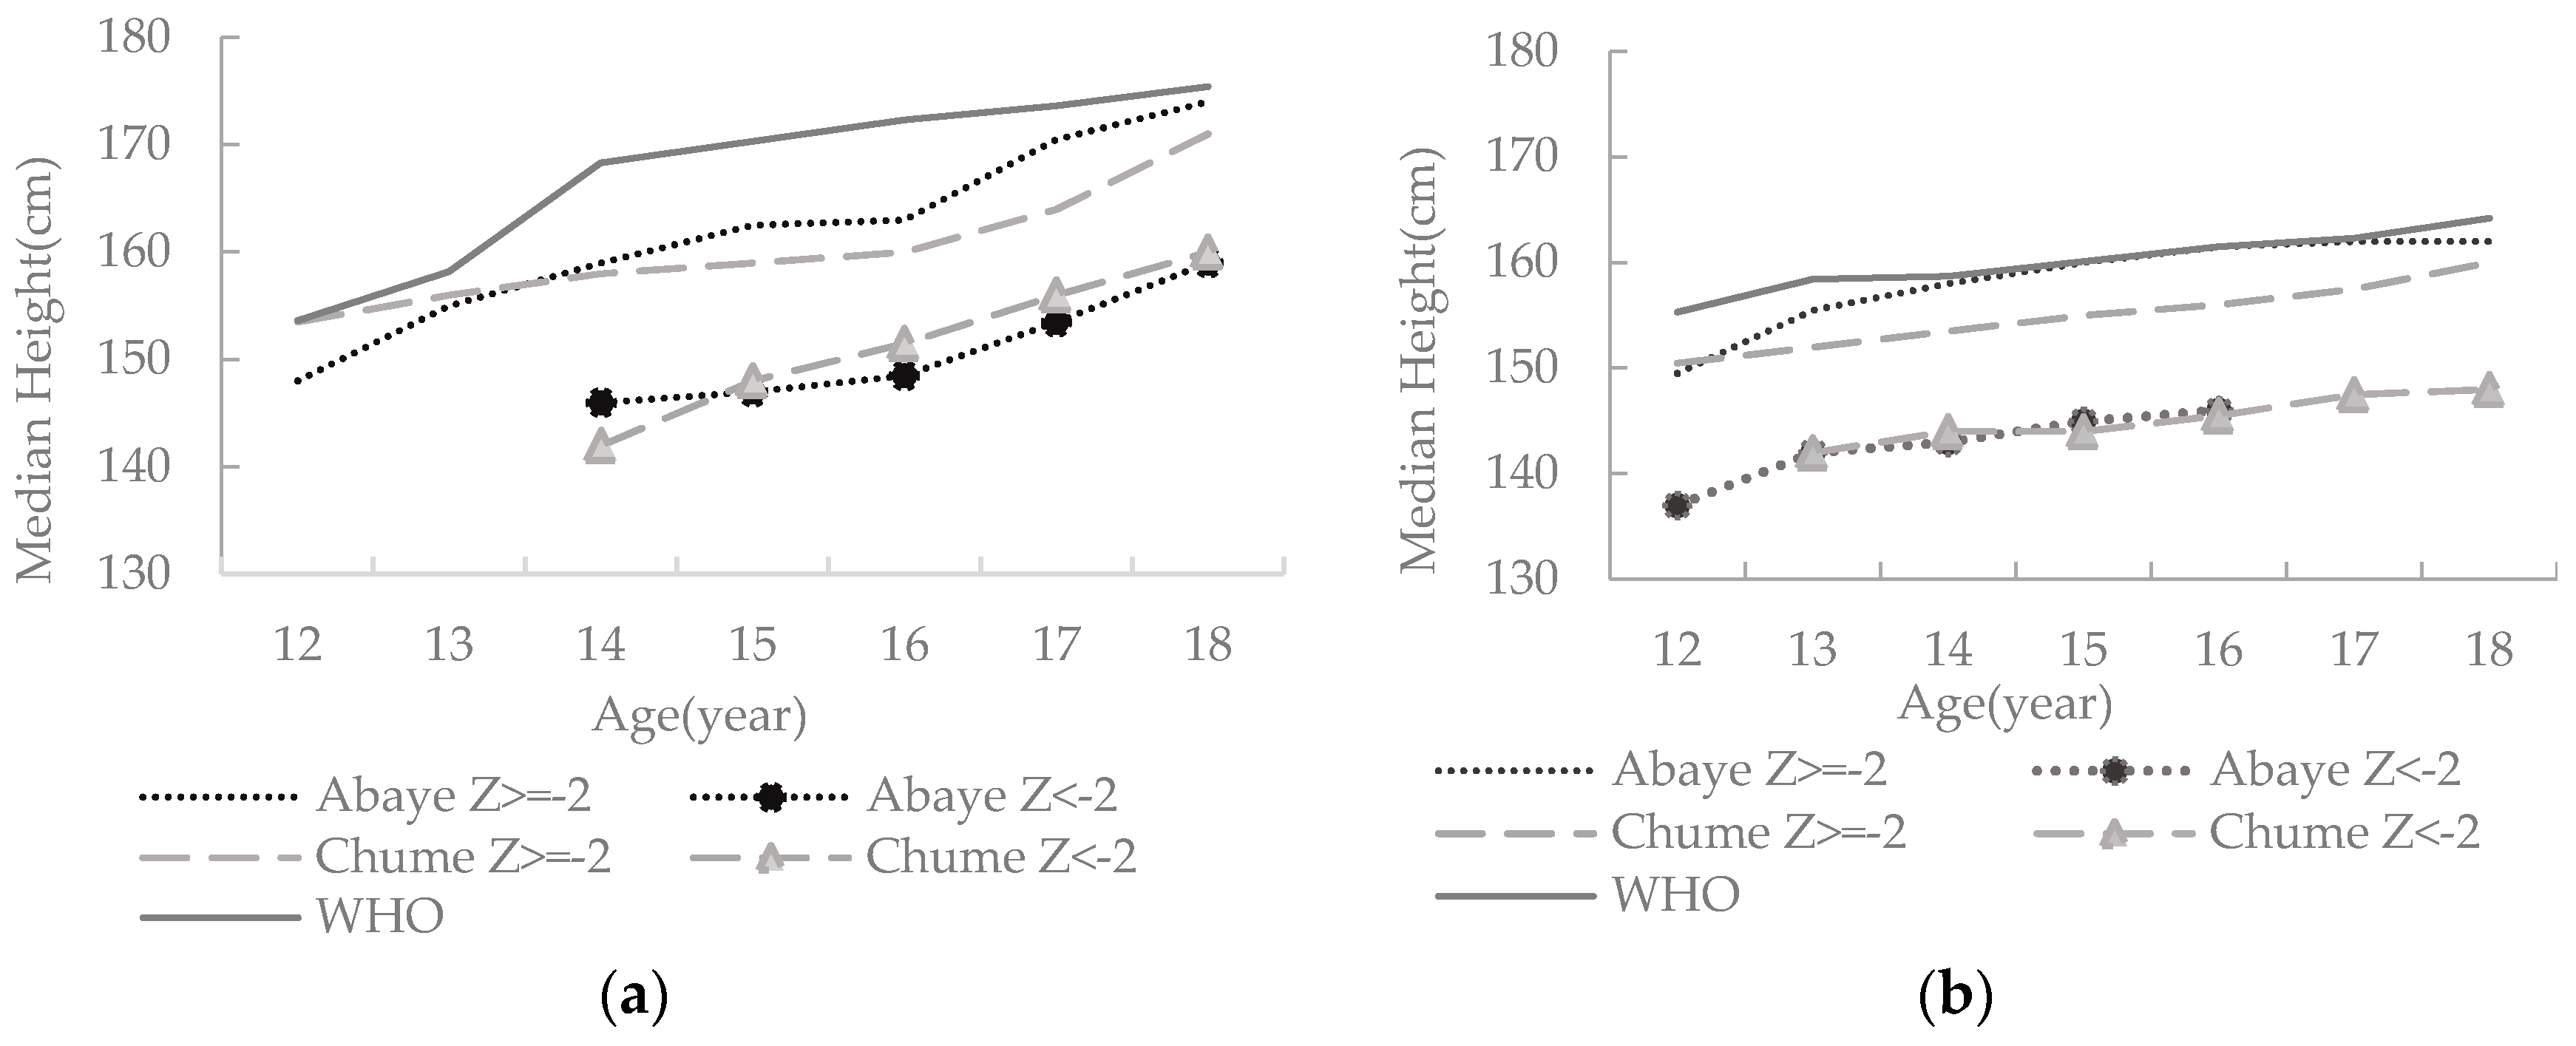
The prevalence of stunting appears low, i.e., only 17 (7.3%) of all adolescents were stunted. We observed severe stunting for 3.1% of the boys from Abaye. Area-wise, 6.5% and 5.5% of the girls and 7.8% and 9.4% of the boys were stunted in Abaye and Chume, respectively (Figure 2a). However, there was no significant difference in the stunting of adolescents between study sites (χ2 = 1.530, p = 0.216) and genders (χ2 = 0.153, p = 0.696). The median height for age of all the stunted adolescents was below the corresponding median height for age of the non-stunted adolescents and that of the WHO 2007 growth reference data, regardless of the area or gender (Figure 3). The mean height of the stunted girls was 144.1 cm, which was 11.8 cm shorter than the mean height of the non-stunted girls. Similarly, the mean height of the stunted boys was 151.1 cm, which was 10.6 cm shorter than the mean height of the non-stunted boys.
The overall prevalence of thinness 30 (12.8%) in the study areas was high. Nevertheless, it was significantly higher in Chume than in Abaye (χ2 = 22.726, p = 0.000) and for boys compared to girls (χ2 = 5.506, p = 0.019). We observed severe thinness for 4 (7.5%) boys and 3 (5.5%) girls from Chume, while none of the adolescents from Abaye were severely thin (Figure 2b). The prevalence of thinness was 1 (1.6%) and 9 (16.4%) for the girls and 3 (4.7%) and 17 (32.1%) for the boys in Abaye and Chume, respectively. Moreover, 8 (12.9%) and 1 (1.8%) of the girls were overweight in Abaye and Chume, respectively, while only 1 (1.6%) boy from Abaye was obese.
3.2.2. Food Insecurity Experience (FIE)
Of the adolescents, 89 (38.0%) reported food insecurity experiences. Accordingly, 40.3% and 30.9% of the girls and 45.3% and 34.0% of the boys were food insecure in Abaye and Chume, respectively. The proportion of adolescents that experienced food insecurity did not appear to differ across sites (χ2 = 2.694, p = 0.101) or gender (χ2 = 0.453, p = 0.501).
3.3. Factors Associated with the Stunting, Thinness, and FIE of Adolescents
Multivariate logistic regression analyses revealed that adolescent age and maternal education are significantly associated with stunting (Table 2). The odds of stunting for adolescents aged 12–14 years is 3.569 times (adjusted OR = 3.569; 95% CI, 1.109, 11.485) greater than that of those aged 15–18 years, all things being equal. Similarly, the odds of adolescents who have illiterate mothers (who cannot read and write properly) of being stunted is 5.641 times (adjusted OR = 5.641; 95% CI, 1.560, 20.392) greater than that of those who have literate mothers.
As shown in Table 3, gender, area or place of residence, the number of meals a day, and livelihood show significant associations with the adolescents’ thinness. Controlling for other variables, the odds of thinness for girls is 0.386 times (adjusted OR = 0.386; 95% CI, 0.157, 0.944) smaller than that of boys, and the odds of thinness for adolescents from Abaye is 0.123 times (Adjusted OR = 0.123, 95% CI, (0.040, 0.375) smaller than that of adolescents from Chume. Likewise, adolescents from families whose livelihoods depend on khat are 0.119 times (adjusted OR = 0.119; 95% CI, 0.035, 0.401) less likely to be thin than those who are from families that earn their living from coffee. Finally, the odds of thinness for adolescents who said they eat less than three meals a day is 4.164 times (adjusted OR = 4.164; 95% CI, 1.629, 10.647) greater than those who claimed to eat three or more meals a day.
The food insecurity experiences (FIEs) of adolescents were associated with health problems in the past 30 days (Table 4). The odds of experiencing at least one of the four food insecurity indicators was 0.235 times (adjusted OR = 0.235; 95% CI, 0.115, 0.483) smaller for those adolescents who had a health problem in the past 30 days compared to those who did not have such a problem in the stated period.
4. Discussion
The overall rate of stunting (7.3%) and thinness (12.8%) reported in this study are within the WHO’s prevalence range of low and high, respectively [38]. Previous studies have associated adolescents’ nutritional status with a myriad of personal characteristics (e.g., genetic, age, etc.), household variables (e.g., income, family size, etc.), and environmental factors, like hygiene [39]. Accordingly, we associate the observed differences in adolescents’ nutritional status in this study with two groups of factors: (1) personal characteristics and (2) socioeconomic (e.g., parental education) and environmental factors.
4.1. Personal Characteristics
Many genetic and environmental factors influence human growth characteristics, such as height, in addition to nutrition [40]. For example, genetic factors, such as race, account for 60–80% of the height differences between individuals [41]. Hence, we argue that at least part of the observed deviations from the WHO 2007 standard reference is likely due to genetic differences (e.g., race) between our sample groups and that of the WHO reference samples. In this study, younger adolescents (12–14 years) have a higher risk of stunting than older ones (15–18 years), and this is in agreement with previous studies, such as Mulugeta and others [42], from the Tigray region in Northern Ethiopia, and Barman [43] from India. Thinness was significantly higher for the boys than the girls, especially for those from Chume. This gendered difference could be due to the boys’ tendencies to engage in energy-intensive outdoor activities, like working on agricultural farms and playing soccer [44], whereas girls, who are customarily close to home and assist their mothers with household works, including food preparation, are likely to have better access to food than boys. The higher prevalence of thinness among boys is in line with the national trend, i.e., the national average rate of thinness for boys aged 10–19 years is nearly double of that of girls of the same age group [3]. However, this result contradicts some of the previous studies in Ethiopia, such as Tessema [45], and Hadley and others [28], have reported a gender bias that favors boys in intra-household food allocations during scarcities. The observed contradiction would be due to differences in socioeconomic factors (e.g., ethnicity, culture, etc.) between the study sites [46].
4.2. Socioeconomic and Environmental Factors
The prevalence of stunting in the study areas appears low (less than 10%) and does not vary significantly across the study sites. However, non-stunted adolescents from Abaye appear to have relatively better height than those from Chume (Figure 3). The overall prevalence of thinness (12.8%) is high by the WHO standard [38] and is disproportionately very high in Chume for both sexes. Nonetheless, they are less than the national prevalence rates (29% for girls and 59% for boys) for adolescents in Ethiopia [3]. We contend that the relatively smaller prevalence of thinness and better linear growth (see Figure 3, and Figures S1–S4 in the Supplementary Materials) of adolescents from Abaye are in accordance with our hypothesis. This is likely due to (1) better household income from khat (the livelihood base for the majority of the adolescents’ families in Abaye); (2) the presence of rich agroforestry systems; and (3) access to better infrastructure.
Khat, as a cash crop, outcompetes other crops, including coffee, primarily due to its fast growth (2 to 3 times harvests per year), stable and lucrative income, and better resistance to shocks (e.g., drought, price fluctuation) [47]. For example, a khat farm on a 0.1 ha plot in Wondo Genet can generate 25 times and six times more income than maize and sugarcane, respectively [25]. However, despite its attractive income, some blame khat for exacerbating food insecurity by displacing staple food crops and disempowering women [25,48]. Notwithstanding the dominance of men over large income streams (especially when the khat is sold at once on a farm), there are also cases where women harvest small quantities of khat and sell it on the retail market to buy food and other utilities. In addition, khat has no defined growing and harvesting seasons, especially where there is adequate moisture (e.g., irrigation) and, therefore, can generate income every three to four months. There are pieces of evidence that khat improves the overall livelihood, including food security, of its growers by generating fast and substantial income [20]. Another reason for the better nutritional status in Abaye would be the presence of rich agroforestry systems in the area [49]. Well managed agroforestry systems are sources of quality fruits, vegetables, and fiber and, hence, improve food security [50]. Proximity to the large towns, like Hawassa and Shashemene, and better infrastructure (e.g., roads, irrigation) would also give better opportunities (e.g., access to off-farm jobs, buy foods at reasonable prices, etc.) for the Abaye residents to improve their food security [51].
Coffee, the main livelihood for many families in Chume, is highly susceptible to various shocks (e.g., frost, pests and diseases, and price drops), and its market is heavily regulated by the government [52]. Farmers in the study areas often complain about the disappointingly low coffee prices and some of them are even switching to other crops such as khat and eucalyptus [23]. Coffee harvests frequently fail in the study areas, and expose its growers to a higher risk of food insecurity [53]. In the event of such shocks, farmers try to cope by selling their assets (e.g., cattle to buy food) or use other means, like reducing the amount of food intake, which could eventually deplete their resilience capacity [52]. Moreover, unlike Abaye, Chume is relatively far from infrastructure (e.g., there is no irrigation water) and it is one of the beneficiaries of the government’s productive safety net program (PSNP), a program that provides food in exchange of public work for extremely poor citizens. Therefore, the observed high prevalence of thinness in Chume could be due to low returns from coffee and fewer opportunities for residents.
The staple foods in both of the study areas are from enset and maize. Although they are good sources of carbohydrate and quality fiber, popular enset-based foods like “kocho” and “bulla” are poor in protein and vitamins and lack essential nutrients [54]. As a result, too much dependence on such foods would compromise one’s nutritional status. Insufficient carbohydrate and nutrient intake, low diet diversity, and frequent meal skipping practices increase the risk of stunting and thinness [55,56].
Several other studies have reported associations between adolescents’ nutritional status and socioeconomic and environmental factors [37,57]. A comparative study conducted on Indian adolescents and adolescents of Indian origin from the United Arab Emirates (UAE) has reported a higher prevalence of stunting and thinness in the Indian group living in India and attributed it to the poor living conditions in India [58]. Another study from Canada reported that youths from low-income households had lower height percentiles, consumed less milk, and had higher levels of nutritional deprivation [59]. Similarly, many studies from Ethiopia have reported positive associations between adolescents’ poor nutritional status (e.g., stunting, thinness) and various socioeconomic factors, such as low household income, large family size, poor sanitation, and low maternal education [37,42,60]. According to Demissie [61] and Sandifordt [62], literate mothers (who can properly read and write) can easily adopt technical supports and health packages provided by the extension workers and would improve the nutritional status of their children and families.
Our study has revealed important findings which would inform pertinent policies not only in Ethiopia, but also in other khat- and coffee-growing countries, like Kenya, Uganda, and Madagascar [20,63]. Its strengths lie in its focus both in choosing the target group (adolescents) and the study sites (areas with the two competing cash crops), and the use of three different food security indicators. However, because it is a cross-sectional study from only two sites, its results should not be generalizable beyond the stated areas, times, and ages of the adolescents.
5. Conclusions
The study has revealed that food insecurity exists among adolescents in both sites but is less severe in the khat-growing region of Abaye than in the coffee-growing region of Chume, and less severe in girls than boys. Additional in-depth studies are needed to better understand the adolescents’ food security in these and other khat- and coffee-growing areas in Ethiopia. Possible interventions for adolescents in coffee-growing areas should include increasing the low coffee prices, introducing targeted school feeding programs for adolescents, and educating mothers on the importance of proper nutrition.
Supplementary Materials
The following are available online at https://www.mdpi.com/2072-6643/10/8/980/s1, Figure S1: Height for age (HAZ) distribution of 126 (male = 64, female = 62) adolescents aged 12–18 years from Abaye, southern Ethiopia, along with the WHO 2007 growth reference., Figure S2: Height for age (HAZ) distribution of 108 (male = 53, female = 55) adolescents aged 12–18 years from Chume, southern Ethiopia, along with the WHO 2007 growth reference., Figure S3: Body mass index for age (BMIZ) distribution of 126 (male = 64, female = 62) adolescents aged 12–18 years, from Abaye, southern Ethiopia, along with the WHO 2007 growth reference., Figure S4: Body mass index for age (BMIZ) distribution of 108 (male = 53, female = 55) adolescents aged 12–18 years, from Chume, southern Ethiopia, along with the WHO 2007 growth reference.
Author Contributions
Conceptualization: D.B.J. and O.S.; data curation: D.B.J.; formal analysis: D.B.J. and M.S.; funding acquisition: O.S.; methodology: D.B.J., M.S. and O.S.; supervision: O.S.; writing—original draft: D.B.J.; writing—review and editing: M.S. and O.S.
Funding
We kindly appreciate the financial supports from the following sources. Japan Foundation for United Nations University (jfUNU) has provided a scholarship for the first author. Food Insecurity Impacts of Industrial Crops Expansion in sub-Saharan Africa (FICESSA) project funded by the Japan Science and Technology Agency (JST) has covered costs of the fieldworks; and Development Strategy for Urban Sustainability in Africa on the Basis of SDGs Interlinkage Analysis (USiA) project the University of Tokyo, funded by the Japan International Cooperation Agency (JICA), has paid APC.
Acknowledgments
We are grateful to the sample adolescents who voluntarily took part in this study, and all others like local and regional officers, research assistants, and the local community members who, in one way or another, contributed to this research.
Conflicts of Interest
The authors declare no conflicts of interest. The funder played no role in the design and later stages of the research, such as data collection and analyses, the interpretation of the results, or the writing of the manuscript and the decision to publish it.
References
- Dick, B.; Ferguson, B.J. Health for the World’s Adolescents: A Second Chance in the Second Decade. J. Adolesc. Health 2015, 56, 3–6. [Google Scholar] [CrossRef] [PubMed]
- The United Nations Children’s Fund (UNICEF). The United Nations Children’s Fund (UNICEF). The State of the World’s Children 2011. In Adolescence an Age of Opportunity; UNICEF: New York, NY, USA, 2011. [Google Scholar]
- Central Statistical Agency (CSA); Inner City Fund (ICF). Ethiopia Demographic and Health Survey 2016; Central Statistical Agency (CSA) and ICF: Addis Ababa, Ethiopia, 2016.
- World Health Organization. Adolescent Nutrition: A Review of the Situation in Selected South-East Asian Countries; WHO: New Delhi, India, 2006. [Google Scholar]
- Mramba, L.; Ngari, M.; Mwangome, M.; Muchai, L.; Bauni, E.; Walker, A.S.; Gibb, D.M.; Fegan, G.; Berkley, J.A. A growth reference for mid upper arm circumference for age among school age children and adolescents, and validation for mortality: Growth curve construction and longitudinal cohort study. BMJ 2017, 358, j3423. [Google Scholar] [CrossRef] [PubMed]
- Melaku, Y.A.; Zello, G.A.; Gill, T.K.; Adams, R.J.; Shi, Z. Prevalence and factors associated with stunting and thinness among adolescent students in Northern Ethiopia: A comparison to World Health Organization standards. Arch. Public Health 2015, 73, 44. [Google Scholar] [CrossRef] [PubMed]
- Largo, R.H. Catch-Up Growth during Adolescence. Horm. Res. 1993, 39, 41–48. [Google Scholar] [CrossRef] [PubMed]
- Gat-Yablonski, G.; Phillip, M. Nutritionally-Induced Catch-Up Growth. Nutrients 2015, 7, 517–551. [Google Scholar] [CrossRef] [PubMed] [Green Version]
- Leenstra, T.; Petersen, L.T.; Kariuki, S.K.; Oloo, A.J.; Kager, P.A.; Kuile, F.O.T. Prevalence and severity of malnutrition and age at menarche; cross-sectional studies in adolescent schoolgirls in western Kenya. Eur. J. Clin. Nutr. 2005, 59, 41–48. [Google Scholar] [CrossRef] [PubMed]
- Gebreyohannes, Y.; Shiferaw, S.; Demtsu, B.; Bugssa, G. Nutritional Status of Adolescents in Selected Government and Private Secondary Schools of Addis Ababa, Ethiopia. Int. J. Nutr. Food Sci. 2014, 3, 504. [Google Scholar] [CrossRef] [Green Version]
- World Health Organization (WHO). Health for the World’s Adolescents: A Second Chance in the Second Decade; WHO Press: Geneva, Switzerland, 2014. [Google Scholar]
- Patton, G.C.; Sawyer, S.M.; Ross, D.A.; Viner, R.M.; Santelli, J.S. From Advocacy to Action in Global Adolescent Health. J. Adolesc. Health 2016, 59, 375–377. [Google Scholar] [CrossRef] [PubMed] [Green Version]
- World Health Organization (WHO). Guideline: Implementing Effective Actions for Improving Adolescent Nutrition; World Health Organization: Geneva, Switzerland, 2018. [Google Scholar]
- Pinhas-Hamiel, O.; Reichman, B.; Shina, A.; Derazne, E.; Tzur, D.; Yifrach, D.; Wiser, I.; Afek, A.; Shamis, A.; Tirosh, A.; et al. Sex Differences in the Impact of Thinness, Overweight, Obesity, and Parental Height on Adolescent Height. J. Adolesc. Health 2017, 61, 233–239. [Google Scholar] [CrossRef] [PubMed]
- Evans, E.W.; Lo, C. Adolescents: Nutritional Problems of Adolescents. In Encyclopedia of Human Nutrition; Elsevier: New York, NY, USA, 2013; pp. 14–22. [Google Scholar]
- Abarca-Gómez, L.; Abdeen, Z.A.; Hamid, Z.A.; Abu-Rmeileh, N.M.; Acosta-Cazares, B.; Acuin, C.; Adams, R.J.; Aekplakorn, W.; Afsana, K.; Aguilar-Salinas, C.A.; et al. Worldwide trends in body-mass index, underweight, overweight, and obesity from 1975 to 2016: A pooled analysis of 2416 population-based measurement studies in 128·9 million children, adolescents, and adults. Lancet 2017, 390, 2627–2642. [Google Scholar] [CrossRef]
- Zenebe, M.; Gebremedhin, S.; Henry, C.J.; Regassa, N. School feeding program has resulted in improved dietary diversity, nutritional status and class attendance of school children. Ital. J. Pediatr. 2018, 44, 16. [Google Scholar] [CrossRef] [PubMed] [Green Version]
- Coll-Black, S.; Gilligan, D.O.; Hoddinott, J.; Kumar, N.; Wiseman, W. 10 Targeting Food Security Interventions in Ethiopia: The Productive Safety Net. In Food and Agriculture in Ethiopia: Progress and Policy Challenges; Dorosh, P.A., Rashid, S., Eds.; University of Pennsylvania Press: Philadelphia, PA, USA, 2012; pp. 280–317. [Google Scholar]
- Regassa, N. Small holder farmers coping strategies to household food insecurity and hunger in Southern Ethiopia. Ethiop. J. Environ. Stud. Manag. 2011, 4. [Google Scholar] [CrossRef] [Green Version]
- Anderson, A.K.D.; Beckerleg, S.; Hailu, D. The Khat Controversy. Stimulating the Debate on Drugs. Soc. Hist. Med. 2008, 21, 189–190. [Google Scholar] [CrossRef]
- The United States Department of Agriculture (USDA). Coffee: World Markets and Trade; USDA: Washington, DC, USA, 2017.
- Tefera, A.; Tefera, T. Ethiopia Coffee Annual Report-GAIN Report Number: ET- 1302; The United States Department of Agriculture (USDA): Addis Ababa, Ethiopia, 2013.
- Cochrane, L.; O’Regan, D. Legal harvest and illegal trade: Trends, challenges, and options in khat production in Ethiopia. Int. J. Drug Policy 2016, 30, 27–34. [Google Scholar] [CrossRef] [PubMed]
- Feyisa, T.H.; Aune, J.B. Khat Expansion in the Ethiopian Highlands. Mt. Res. Dev. 2003, 23, 185–189. [Google Scholar] [CrossRef]
- Dessie, G.; Kinlund, P. Khat Expansion and Forest Decline in Wondo Genet, Ethiopia. Geogr. Ann. Ser. B 2008, 90, 187–203. [Google Scholar] [CrossRef]
- Sahle, M.; Yeshitela, K.; Saito, O. Mapping the supply and demand of Enset crop to improve food security in Southern Ethiopia. Agron. Sustain. Dev. 2018, 38, 7. [Google Scholar] [CrossRef] [Green Version]
- De Onis, M.; Habicht, J.P. Anthropometric reference data for international use: Recommendations from a World Health Organization Expert Committee. Am. J. Clin. Nutr. 1996, 64, 650–658. [Google Scholar] [CrossRef] [PubMed]
- Hadley, C.; Lindstrom, D.; Tessema, F.; Belachew, T. Gender bias in the food insecurity experience of Ethiopian adolescents. Soc. Sci. Med. 2008, 66, 427–438. [Google Scholar] [CrossRef] [PubMed] [Green Version]
- Sidama Zone Culture and Tourism Bureau. Sidama Zone: Location, Area and Administrative Divisions. Unpublished work. 2011. [Google Scholar]
- Assefa, E. Assessment of Production and Marketing System of Goats in Dale District; University of Hawassa: Sidama Zone, Ethiopia, 2007. [Google Scholar]
- Sidama Zone Finance and Economic Development Bureau. Sidama Zone: Administrative Divisions’ Area and Total population. Unpublished work. 2017. [Google Scholar]
- Chume Kebele Agricultural Extension Office. Basic information about the Chume kebele. Unpublished work. 2017. [Google Scholar]
- Abaye Kebele Agricultural Extension Office. Basic information about the Abaye kebele. Unpublished work. 2017.
- Dasgupta, A.; Butt, A.; Saha, T.; Basu, G.; Chattopadhyay, A.; Mukherjee, A. Assessment of malnutrition among adolescents: Can BMI be replaced by MUAC. Indian J. Commun. Med. 2010, 35, 276. [Google Scholar] [CrossRef] [PubMed]
- The World Health Organization (WHO). WHO Child Growth Standards Length/Height-for-Age, Weight-for-Age, Weight-for-Length, Weight-for-Height and Body Mass Index-for-Age Methods and Development; WHO: Geneva, Switzerland, 2006. [Google Scholar]
- Sarkar, S.K.; Midi, H.; Rana, S. Model Selection in Logistic Regression and Performance of its Predictive Ability. Aust. J. Basic Appl. Sci. 2010, 4, 5813–5822. [Google Scholar]
- Wolde, M.; Berhan, Y.; Chala, A. Determinants of underweight, stunting and wasting among schoolchildren. BMC Public Health 2015, 15, 8. [Google Scholar] [CrossRef] [PubMed]
- The World Health Organization (WHO). Global Database on Child Growth and Malnutrition. Available online: http://www.who.int/nutgrowthdb/about/introduction/en/index5.html (accessed on 13 May 2018).
- Al-Shaikh, M.H.; Bashaaib, M.O. Unpredictable pulmonary tuberculosis with Hydatid cyst in adult male. Egypt. J. Chest Dis. Tuberc. 2017, 66, 317–319. [Google Scholar] [CrossRef]
- Bogin, B. Patterns of Human Growth; Cambridge University Press: Cambridge, UK, 1999; Volume 23. [Google Scholar]
- Perola, M. Genetics of Human Stature: Lessons from Genome-Wide Association Studies. Horm. Res. Paediatr. 2011, 76, 10–11. [Google Scholar] [CrossRef] [PubMed]
- Mulugeta, A.; Hagos, F.; Stoecker, B.; Kruseman, G.; Linderhof, V.; Abraha, Z.; Yohannes, M.; Samuel, G.G. Nutritional Status of Adolescent Girls from Rural Communities of Tigray, Northern Ethiopia. Ethiop. J. Health Dev. 2009, 23. [Google Scholar] [CrossRef] [Green Version]
- Roy, S.; Barman, S.; Mondal, N.; Sen, J. Prevalence of Stunting and Thinness Among Adolescent Girls Belonging to the Rajbanshi Population of West Bengal, India. J. Nepal Paediatr. Soc. 2016, 36, 147. [Google Scholar] [CrossRef] [Green Version]
- Haddad, C.N.L.; Peña, C.; Quisumbing, A.S.A. Food Security and Nutrition Implications of Intrahousehold Bias: A Review of Literature; FCND Discussion Paper No. 19; International Food Policy Research Institute: Washington, DC, USA, 1996. [Google Scholar]
- Tessema, M.; Belachew, T.; Ersino, G. Feeding patterns and stunting during early childhood in rural communities of Sidama, South Ethiopia. Pan Afr. Med. J. 2013, 14, 75. [Google Scholar] [PubMed]
- Harris-Fry, H.; Shrestha, N.; Costello, A.; Saville, N.M. Determinants of intra-household food allocation between adults in South Asia–a systematic review. Int. J. Equity Health 2017, 16, 107. [Google Scholar] [CrossRef] [PubMed]
- Dessie, G. Land and Water for Drugs, Cash for Food: Khat Production and Food Security in Ethiopia; I.B. Tauris: London, UK, 2015; Volume 3. [Google Scholar]
- Odenwald, M.; Klein, A.; Warfa, N. Introduction to the special issue: The changing use and misuse of khat (Catha edulis)—Tradition, trade and tragedy. J. Ethnopharmacol. 2010, 132, 537–539. [Google Scholar] [CrossRef] [PubMed]
- Mellisse, B.T.; van de Ven, G.W.J.; Giller, K.E.; Descheemaeker, K. Home garden system dynamics in Southern Ethiopia. Agrofor. Syst. 2017, 1–7. [Google Scholar] [CrossRef]
- Mbow, C.; van Noordwijk, M.; Prabhu, R.; Simons, T. Knowledge gaps and research needs concerning agroforestry’s contribution to Sustainable Development Goals in Africa. Curr. Opin. Environ. Sustain. 2014, 6, 162–170. [Google Scholar] [CrossRef]
- Bezu, S.; Holden, S. Are Rural Youth in Ethiopia Abandoning Agriculture? World Dev. 2014, 64, 259–272. [Google Scholar] [CrossRef]
- Minten, B.; Dereje, M.; Engida, E.; Tamru, S. Tracking the Quality Premium of Certified Coffee: Evidence from Ethiopia. World Dev. 2018, 101, 119–132. [Google Scholar] [CrossRef]
- Fan, S.; Brzeska, J.; Keyzer, M.; Halsema, A. From Subsistence to Profit Transforming Smallholder Farms; International Food Policy Research Institute: Washington, DC, USA, 2013. [Google Scholar]
- Negash, A.; Niehof, A. The significance of enset culture and biodiversity for rural household food and livelihood security in southwestern Ethiopia. Agric. Hum. Values 2004, 21, 61–71. [Google Scholar] [CrossRef]
- Roba, K.; Abdo, M.; Wakayo, T. Nutritional Status and Its Associated Factors among School Adolescent Girls in Adama City, Central Ethiopia. J. Nutr. Food Sci. 2016, 6, 2. [Google Scholar]
- Mohammed, A.Y. Nutritional Status and Associated Risk Factors Among Adolescents Girls in Agarfa High School, Bale Zone, Oromia Region, South East Ethiopia. Int. J. Nutr. Food Sci. 2015, 4, 445. [Google Scholar] [CrossRef] [Green Version]
- Pal, A.; Pari, A.K.; Sinha, A.; Dhara, P.C. Prevalence of undernutrition and associated factors: A cross-sectional study among rural adolescents in West Bengal, India. Int. J. Pediatr. Adolesc. Med. 2017, 4, 9–18. [Google Scholar] [CrossRef] [Green Version]
- Shaikh, R.; Haboubi, G. A comparison of the nutritional status of adolescents from selected schools of South India and UAE: A cross-sectional study. Indian J. Commun. Med. 2009, 34, 108. [Google Scholar] [CrossRef] [PubMed]
- Mark, K.G.-D.S.; Lambert, M.; O’Loughlin, J. Household Income, Food Insecurity and Nutrition in Canadian Youth. Can. J. Public Health. 2012, 102, 94–99. [Google Scholar]
- Assefa, H.; Belachew, T.; Negash, L. Socioeconomic Factors Associated with Underweight and Stunting among Adolescents of Jimma Zone, South West Ethiopia: A Cross-Sectional Study. ISRN Public Health 2013, 2013. [Google Scholar] [CrossRef]
- Demissie, S. Magnitude and Factors Associated with Malnutrition in Children 6–59 Months of Age in Pastoral Community of Dollo Ado District, Somali Region, Ethiopia. Sci. J. Public Health 2013, 1, 175. [Google Scholar] [CrossRef]
- Sandiford, P.; Cassel, J.; Montenegro, M.; Sanchez, G. The Impact of Women’s Literacy on Child Health and its Interaction with Access to Health Services. Popul. Stud. (NY) 1995, 49, 5–17. [Google Scholar] [CrossRef]
- Gezon, L.L. Drug Crops and Food Security: The Effects of Khat on Lives and Livelihoods in Northern Madagascar. Cult. Agric. Food Environ. 2012, 34, 124–135. [Google Scholar] [CrossRef]
Figure 1.
Map of the study areas.

Figure 2.
Adolescent (a) stunting and (b) thinness.
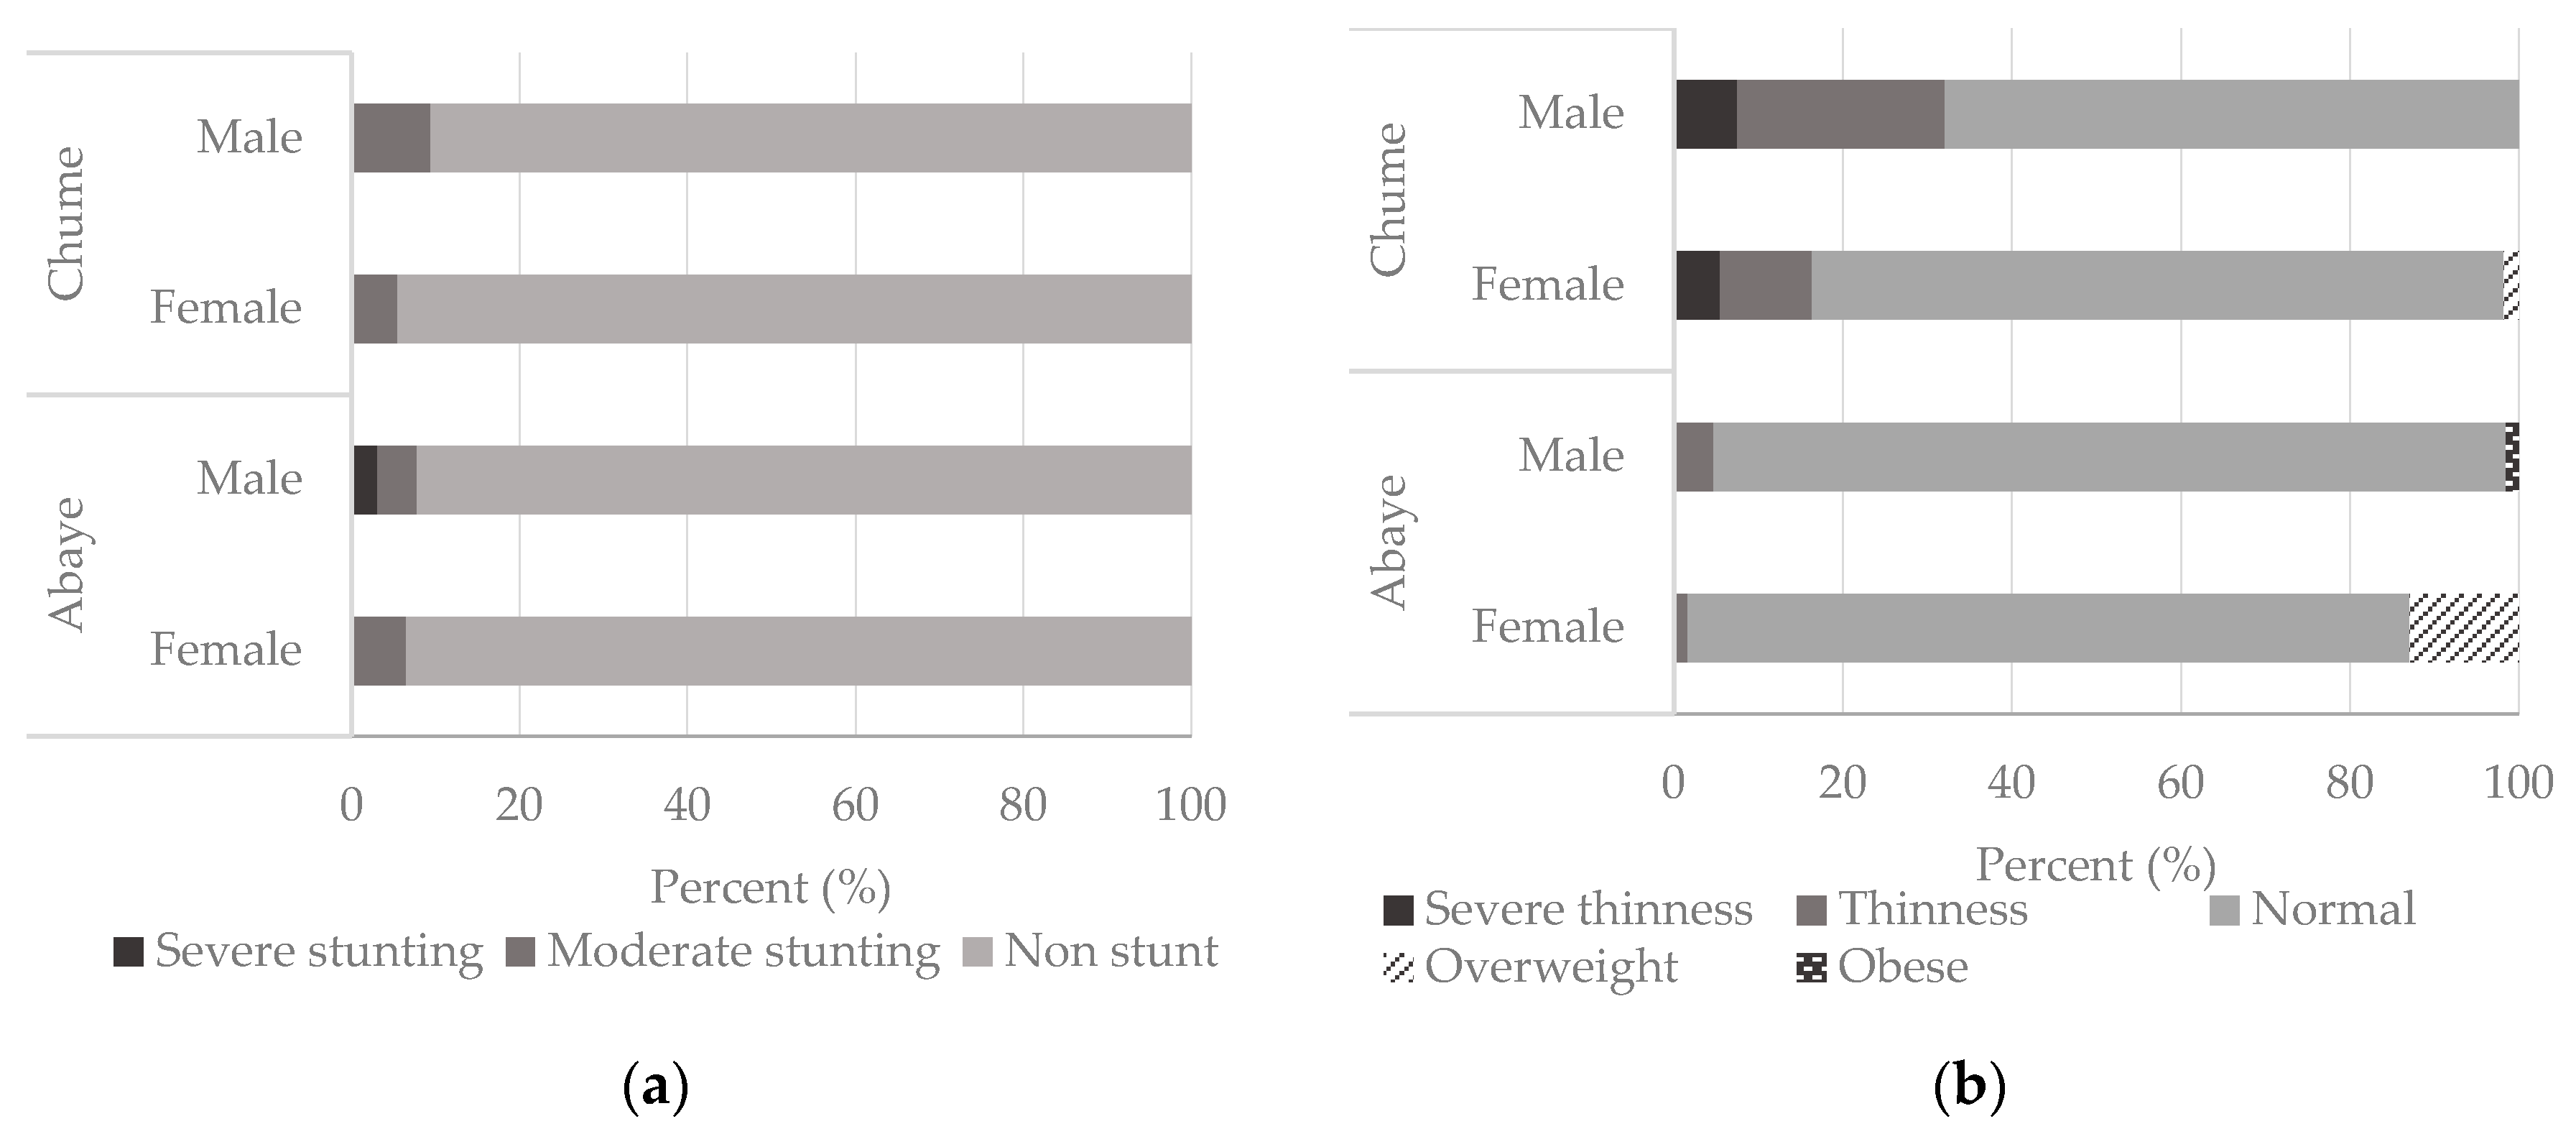
Figure 3.
Height of stunted and non-stunted adolescent (a) boys and (b) girls by age.

Table 1.
Socio-demographic characteristics of the sample adolescents from the Sidama Zone, Southern Ethiopia.
Table 1.
Socio-demographic characteristics of the sample adolescents from the Sidama Zone, Southern Ethiopia.
| Variable | Area | Sex | N | Min | Max | Median | Mean (SD) | S. Error | d.f | Test Statistics 1 | p-Value |
|---|---|---|---|---|---|---|---|---|---|---|---|
| Age (year) | Abaye | F | 62 | 12.0 | 18.0 | 14.4 | 14.72 (2.05) | 0.26 | |||
| Chume | 55 | 12.0 | 17.8 | 13.9 | 13.90 (1.82) | 0.25 | 1 | 1470 | 0.191 | ||
| Abaye | M | 64 | 12.0 | 18.0 | 14.7 | 14.95 (2.03) | 0.25 | ||||
| Chume | 53 | 12.1 | 18.0 | 14.9 | 15.00 (1.61) | 0.28 | 1 | 1113.5 | 0.001 | ||
| Weight (kg) | Abaye | F | 62 | 30 | 71 | 50.0 | 48.72 (9.41) | 1.21 | |||
| Chume | 55 | 28 | 69 | 43.0 | 42.80 (7.18) | 0.97 | 1 | 981 | 0.000 | ||
| Abaye | M | 64 | 29 | 67 | 48.0 | 46.31 (9.81) | 1.22 | ||||
| Chume | 53 | 31 | 68 | 43.0 | 45.76 (9.16) | 1.26 | 1 | 1644 | 0.776 | ||
| Height (cm) | Abaye | F | 62 | 137 | 173 | 157.5 | 155.95 (7.92) | 1.00 | |||
| Chume | 55 | 143 | 173 | 154.0 | 154.36 (6.59) | 0.89 | 1 | 1432 | 0.136 | ||
| Abaye | M | 64 | 137 | 180 | 158.5 | 157.81 (10.27) | 1.28 | ||||
| Chume | 53 | 144 | 188 | 162.0 | 163.68 (9.41) | 1.29 | 1 | 1165.5 | 0.004 | ||
| HAZ | Abaye | F | 62 | −2.73 | 1.71 | −0.25 | −0.33 (0.91) | 0.12 | |||
| Chume | 55 | −2.73 | 1.52 | −0.91 | −0.82 (0.94) | 0.13 | 1 | 1217.5 | 0.008 ** | ||
| Abaye | M | 64 | −3.46 | 1.64 | −0.37 | −0.55 (1.05) | 0.13 | ||||
| Chume | 53 | −2.63 | 2.24 | −0.53 | −0.50 (1.15) | 0.16 | 1 | 1505.5 | 0.297 | ||
| BMIZ | Abaye | F | 62 | −2.09 | 1.82 | 0.09 | −0.01 (0.85) | 0.11 | |||
| Chume | 55 | −4.07 | 1.01 | −0.77 | −0.96 (1.04) | 0.14 | 1 | 831 | 0.000 ** | ||
| Abaye | M | 64 | −2.29 | 2.67 | −0.41 | −0.43 (0.90) | 0.11 | ||||
| Chume | 53 | −3.32 | 0.04 | −1.43 | −1.60 (0.86) | 0.12 | 1 | 866.5 | 0.000 ** | ||
| Education (school year) | Abaye | F | 62 | 2 | 12 | 5 | 5.94 (2.78) | 0.35 | |||
| Chume | 55 | 2 | 10 | 7 | 6.42 (2.20) | 0.29 | 1 | 1410 | 0.102 | ||
| Abaye | M | 64 | 0 | 10 | 6 | 5.64 (2.22) | 0.28 | ||||
| Chume | 53 | 4 | 10 | 6 | 6.02 (1.69) | 0.23 | 1 | 1577.5 | 0.511 | ||
| Family size (number) | Abaye | F | 62 | 2 | 14 | 7.5 | 7.29 (2.51) | 0.319 | |||
| Chume | 55 | 3 | 9 | 6 | 6.24 (1.41) | 0.191 | 1 | 1159.5 | 0.003 ** | ||
| Abaye | M | 64 | 3 | 15 | 7.5 | 7.33 (2.25) | 0.281 | ||||
| Chume | 53 | 3 | 8 | 6 | 5.94 (1.34) | 0.184 | 1 | 971.5 | 0.000 ** |
1 Mann–Whitney U, ** the difference is significant (p < 0.01).
Table 2.
Multivariate analyses of risk factors for stunting of adolescents in the Sidama Zone, Southern Ethiopia.
Table 2.
Multivariate analyses of risk factors for stunting of adolescents in the Sidama Zone, Southern Ethiopia.
| N (%) | Crude OR | (Sig.) | Adjusted OR | (Sig.) | ||
|---|---|---|---|---|---|---|
| Variable | Not Stunted | Stunted | (95% CI) | p-Value | (95% CI) | p-Value |
| Sex | ||||||
| Female | 110 (94.0) | 7 (6.0) | 0.681 (0.250, 1.854) | 0.452 | 0.616 (0.192, 1.971) | 0.414 |
| Male | 107 (91.5) | 10 (8.5) | 1.00 | 1.00 | ||
| Age | ||||||
| 12–14 years | 107 (89.2) | 13 (10.8) | 3.341 (1.056, 10.571) | 0.04* | 3.569 (1.109, 11.485) | 0.033 * |
| 15–18 years | 110 (96.5) | 4 (3.5) | 1.00 | 1.00 | ||
| Education | ||||||
| Up to grade 6 | 89 (93.7) | 6 (6.3) | 0.784 (0.280, 2.199) | 0.644 | 0.364 (0.100, 1.318) | 0.124 |
| Above grade 6 | 128 (92.1) | 11 (7.9) | 1.00 | 1.00 | ||
| Maternal Education | ||||||
| Illiterate @ | 101 (87.8) | 14 (12.2) | 5.360 (1.497, 19.184) | 0.01* | 5.641 (1.560, 20.392) | 0.008 ** |
| Literate | 116 (97.5) | 3 (2.5) | 1.00 | 1.00 | ||
| Area | ||||||
| Abaye | 117 (92.9) | 9 (7.1) | 0.962 (0.358, 2.585) | 0.938 | 0.993 (0.256, 3.855) | 0.992 |
| Chume | 100 (92.6) | 8 (7.8) | 1.00 | 1.00 | ||
| Family size | ||||||
| Over 6 members | 117 (90.7) | 12 (9.3) | 2.051 (0.699, 6.022) | 0.191 | 3.196 (0.954, 10.704) | 0.060 |
| Up to 6 members | 100 (95.2) | 5 (4.8) | 1.00 | 1.00 | ||
| Off farm income | ||||||
| Yes | 67 (89.3) | 8 (10.7) | 1.99 (0.736, 5.382) | 0.175 | 2.337 (0.766, 7.133) | 0.136 |
| No | 150 (94.3) | 9 (5.7) | 1.00 | 1.00 | ||
| Health problem Ф | ||||||
| Yes (in 30 days) | 67 (90.5) | 7 (9.5) | 1.567 (0.572, 4.294) | 0.382 | 2.142 (0.653, 7.022) | 0.209 |
| No (in 30 days) | 150 (93.8) | 10 (6.2) | 1.00 | 1.00 | ||
| Number of meals | ||||||
| <3 meals a day | 87 (89.7) | 10 (10.3) | 2.135 (0.783, 5.822) | 0.139 | 1.664 (1.090, 2.290) | 0.457 |
| ≥3 meals a day | 130 (94.9) | 7 (5.1) | 1.00 | 1.00 | ||
| Animal protein | ||||||
| <3 times a week | 46 (90.2) | 5 (9.8) | 1.549 (0.519, 4.620) | 0.433 | 1.484 (0.420, 5.245) | 0.540 |
| ≥3 times a week | 171 (93.4) | 12 (6.6) | 1.00 | 1.00 | ||
| Family livelihood | ||||||
| Khat | 85 (92.4) | 7 (7.6) | 1.894 (0.472, 7.599) | 0.368 | 1.924 (0.213, 17.353) | 0.852 |
| Other Θ | 63 (90.0) | 7 (10.0) | 2.556 (0.633, 10.311) | 0.187 | 2.266 (0.153, 4.701) | 0.560 |
| Coffee | 69 (95.8) | 3 (4.2) | 1.00 | 1.00 | ||
@ Cannot read or write; * the difference is significant (p < 0.05); ** the difference is significant (p < 0.01). Ф Refers to any illness that had forced an adolescent to miss classes or absent from work or visit a doctor in the last 30 days. Θ Refers to means of livelihoods other than khat and coffee like mixed-crop farming, employment, business, social support, etc.
Table 3.
Multivariate analyses of risk factors for the thinness of adolescents in the Sidama Zone, Southern Ethiopia.
Table 3.
Multivariate analyses of risk factors for the thinness of adolescents in the Sidama Zone, Southern Ethiopia.
| N (%) | Crude OR | (Sig.) | Adjusted OR | (Sig.) | ||
|---|---|---|---|---|---|---|
| Variable | Not Thin | Thin | (95% CI) | p-Value | (95% CI) | p-Value |
| Sex | ||||||
| Female | 108 (92.3) | 9 (7.7) | 0.381 (0.166, 0.872) | 0.022 * | 0.386 (0.157, 0.944) | 0.037 * |
| Male | 96 (82.1) | 21 (17.9) | 1.00 | 1.00 | ||
| Age | ||||||
| 12–14 years | 99 (86.8) | 15 (13.2) | 1.061 (0.493, 2.283) | 0.880 | 1.173 (0.439, 3.133) | 0.751 |
| 15–18 years | 105 (87.5) | 15 (12.5) | 1.00 | 1.00 | ||
| Education | ||||||
| Up to grade 6 | 119 (85.6) | 20 (14.4) | 1.429 (0.636, 3.207) | 0.387 | 1.657 (0.607, 4.523) | 0.325 |
| Above grade 6 | 85 (89.5) | 10 (10.5) | 1.00 | 1.00 | ||
| Maternal Education | ||||||
| Illiterate @ | 91 (79.1) | 24 (20.9) | 4.967 (1.948, 12.668) | 0.001 ** | 1.373 (0.401, 4.700) | 0.613 |
| Literate | 113 (95.0) | 6 (5.0) | 1.00 | 1.00 | ||
| Area | ||||||
| Abaye | 122 (96.8) | 4 (3.2) | 0.103 (0.035, 0.307) | 0.000 ** | 0.123 (0.040, 0.375) | 0.000 ** |
| Chume | 82 (75.9) | 26 (24.1) | 1.00 | 1.00 | ||
| Family size | ||||||
| Up to 6 members | 89 (84.8) | 16 (15.2) | 1.477 (0.685,3.186) | 0.320 | 1.394 (0.263, 1.588) | 0.341 |
| Over 6 members | 115 (89.1) | 14 (10.9) | 1.00 | 1.00 | ||
| Off farm income | ||||||
| Yes | 67 (89.3) | 8 (10.7) | 0.744 (0.315, 1.758) | 0.500 | 0.889 (0.264, 2.989) | 0.849 |
| No | 137 (86.2) | 22 (13.8) | 1.00 | 1.00 | ||
| Health problem Ф | ||||||
| Yes (in 30 days) | 64 (86.5) | 10 (13.5) | 1.094 (0.484, 2.470) | 0.829 | 0.883 (0.350, 2.226) | 0.792 |
| No (in 30 days) | 140 (87.5) | 20 (12.5) | 1.00 | 1.00 | ||
| Number of meals | ||||||
| <3 meals a day | 74 (76.3) | 23 (23.7) | 5.772 (2.364, 14.097) | 0.000 ** | 4.164 (1.629, 10.647) | 0.003 ** |
| ≥3 meals a day | 130 (94.9) | 7 (5.1) | 1.00 | 1.00 | ||
| Animal protein | ||||||
| <3 times a week | 43 (84.3) | 8 (15.7) | 1.362 (0. 567, 3.271) | 0.490 | 1.233 (0.405, 3.751) | 0.712 |
| ≥3 times a week | 161 (88.0) | 22 (12.0) | 1.00 | 1.00 | ||
| Family livelihood | ||||||
| Khat | 88 (95.7) | 4 (4.3) | 0.127 (0.041, 0.393) | 0.000 ** | 0.119 (0.035, 0.401) | 0.001 ** |
| Other Θ | 63 (90.0) | 7 (10.0) | 0.310 (0.121, 0.794) | 0.015 * | 0.314 (0.096, 1.029) | 0.056 |
| Coffee | 53 (73.4) | 19 (26.4) | 1.00 | 1.00 | ||
@ Cannot read or write; * the difference is statistically significant (p < 0.05); ** the difference is statistically significant (p < 0.01). Ф Refers to any illness that had forced an adolescent to miss classes or absent from work or visit a doctor in the last 30 days. Θ Refers to means of livelihoods other than khat and coffee like mixed-crop farming, employment, business, social support, etc.
Table 4.
Multivariate analyses of risk factors for adolescent food insecurity experiences (FIE) in the Sidama Zone, Southern Ethiopia.
Table 4.
Multivariate analyses of risk factors for adolescent food insecurity experiences (FIE) in the Sidama Zone, Southern Ethiopia.
| N (%) | Crude OR | (Sig.) | Adjusted OR | (Sig.) | ||
|---|---|---|---|---|---|---|
| Variable | Food Secure | Food Insecure | (95% CI) | p-Value | (95% CI) | p-Value |
| Sex | ||||||
| Female | 75 (64.1) | 42 (35.9) | 0.834 (0.492, 1.415) | 0.501 | 0.787 (0.445, 1.393) | 0.412 |
| Male | 70 (59.8) | 47 (40.2) | 1.00 | 1.00 | ||
| Age | ||||||
| 12–14 years | 76 (63.3) | 44 (36.7) | 0.888 (0.524, 1.505) | 0.658 | 0.707 (0.368, 1.357) | 0.298 |
| 15–18 years | 69 (60.5) | 45 (39.5) | 1.00 | 1.00 | ||
| Education | ||||||
| Up to grade 6 | 55 (57.9) | 40 (42.1) | 1.336 (0.782, 2.282) | 0.289 | 1.480 (0.766, 2.858) | 0.244 |
| Above grade 6 | 90 (64.7) | 49 (35.3) | 1.00 | 1.00 | ||
| Maternal Education | ||||||
| Illiterate @ | 76 (66.1) | 39 (33.9) | 0.708 (0.417, 1.204) | 0.202 | 0.625 (0.286, 1.365) | 0.239 |
| Literate | 69 (68.0) | 50 (42.0) | 1.00 | 1.00 | ||
| Area | ||||||
| Abaye | 72 (57.1) | 54 (42.9) | 1.564 (0.916, 2.673) | 0.102 | 1.244 (0.466, 3.320) | 0.663 |
| Chume | 73 (67.6) | 35 (32.4) | 1.00 | 1.00 | ||
| Family size | ||||||
| Up to 6 members | 78 (61.5) | 51 (39.5) | 1.153 (0.677, 1.962) | 0.600 | 0.903 (0.498, 1.639) | 0.738 |
| Over 6 members | 67 (63.8) | 38 (36.2) | 1.00 | 1.00 | ||
| Off farm income | ||||||
| Yes | 41 (54.7) | 34 (45.3) | 1.568 (0.896, 2.745) | 0.115 | 1.312 (0.625, 2.756) | 0.473 |
| No | 104 (65.4) | 55 (34.6) | 1.00 | 1.00 | ||
| Health problem Ф | ||||||
| Yes (in 30 days) | 58 (78.4) | 16 (21.6) | 0.329 (0.174, 0.620) | 0.001** | 0.235 (0.115, 0.483) | 0.000 ** |
| No (in 30 days) | 87 (54.4) | 73 (45.6) | 1.00 | 1.00 | ||
| Number of meals | ||||||
| <3 meals a day | 64 (63.9) | 35 (36.1) | 0.868 (0.507, 1.486) | 0.605 | 1.201 (0.564, 2.557) | 0.634 |
| ≥3 meals a day | 83 (60.6) | 54 (39.4) | 1.00 | 1.00 | ||
| Animal protein | ||||||
| <3 times a week | 38 (74.5) | 13 (25.5) | 0.482 (0.240, 0.965) | 0.039 * | 0.651 (0.305, 1.392) | 0.269 |
| ≥3 times a week | 107 (58.5) | 76 (41.5) | 1.00 | 1.00 | ||
| Family livelihood | ||||||
| Khat | 55 (59.8) | 37 (40.2) | 1.634 (0.847, 3.152) | 0.143 | 1.302 (0.439, 3.859) | 0.634 |
| Other Θ | 39 (55.7) | 31 (44.3) | 1.930 (0.965, 3.861) | 0.063 | 1.608 (0.686, 3.768) | 0.275 |
| Coffee | 51 (70.8) | 21 (29.2) | 1.00 | 1.00 | ||
@ Cannot read and write properly; * the difference is statistically significant (p < 0.05); ** the difference is statistically significant (p < 0.01). Ф Refers to any illness that had forced an adolescent to miss classes or absent from work or visit a doctor in the last 30 days. Θ Refers to means of livelihoods other than khat and coffee like mixed-crop farming, employment, business, social support, etc.
© 2018 by the authors. Licensee MDPI, Basel, Switzerland. This article is an open access article distributed under the terms and conditions of the Creative Commons Attribution (CC BY) license (http://creativecommons.org/licenses/by/4.0/).
Share and Cite
MDPI and ACS Style
Juju, D.B.; Sekiyama, M.; Saito, O. Food Security of Adolescents in Selected Khat- and Coffee-Growing Areas in the Sidama Zone, Southern Ethiopia. Nutrients 2018, 10, 980. https://doi.org/10.3390/nu10080980
AMA Style
Juju DB, Sekiyama M, Saito O. Food Security of Adolescents in Selected Khat- and Coffee-Growing Areas in the Sidama Zone, Southern Ethiopia. Nutrients. 2018; 10(8):980. https://doi.org/10.3390/nu10080980
Chicago/Turabian StyleJuju, Denabo Billo, Makiko Sekiyama, and Osamu Saito. 2018. "Food Security of Adolescents in Selected Khat- and Coffee-Growing Areas in the Sidama Zone, Southern Ethiopia" Nutrients 10, no. 8: 980. https://doi.org/10.3390/nu10080980
Note that from the first issue of 2016, this journal uses article numbers instead of page numbers. See further details here.