Impact of a Modified Version of Baby-Led Weaning on Dietary Variety and Food Preferences in Infants

 , , , , and
Abstract
:1. Introduction
2. Materials and Methods
Statistics
3. Results
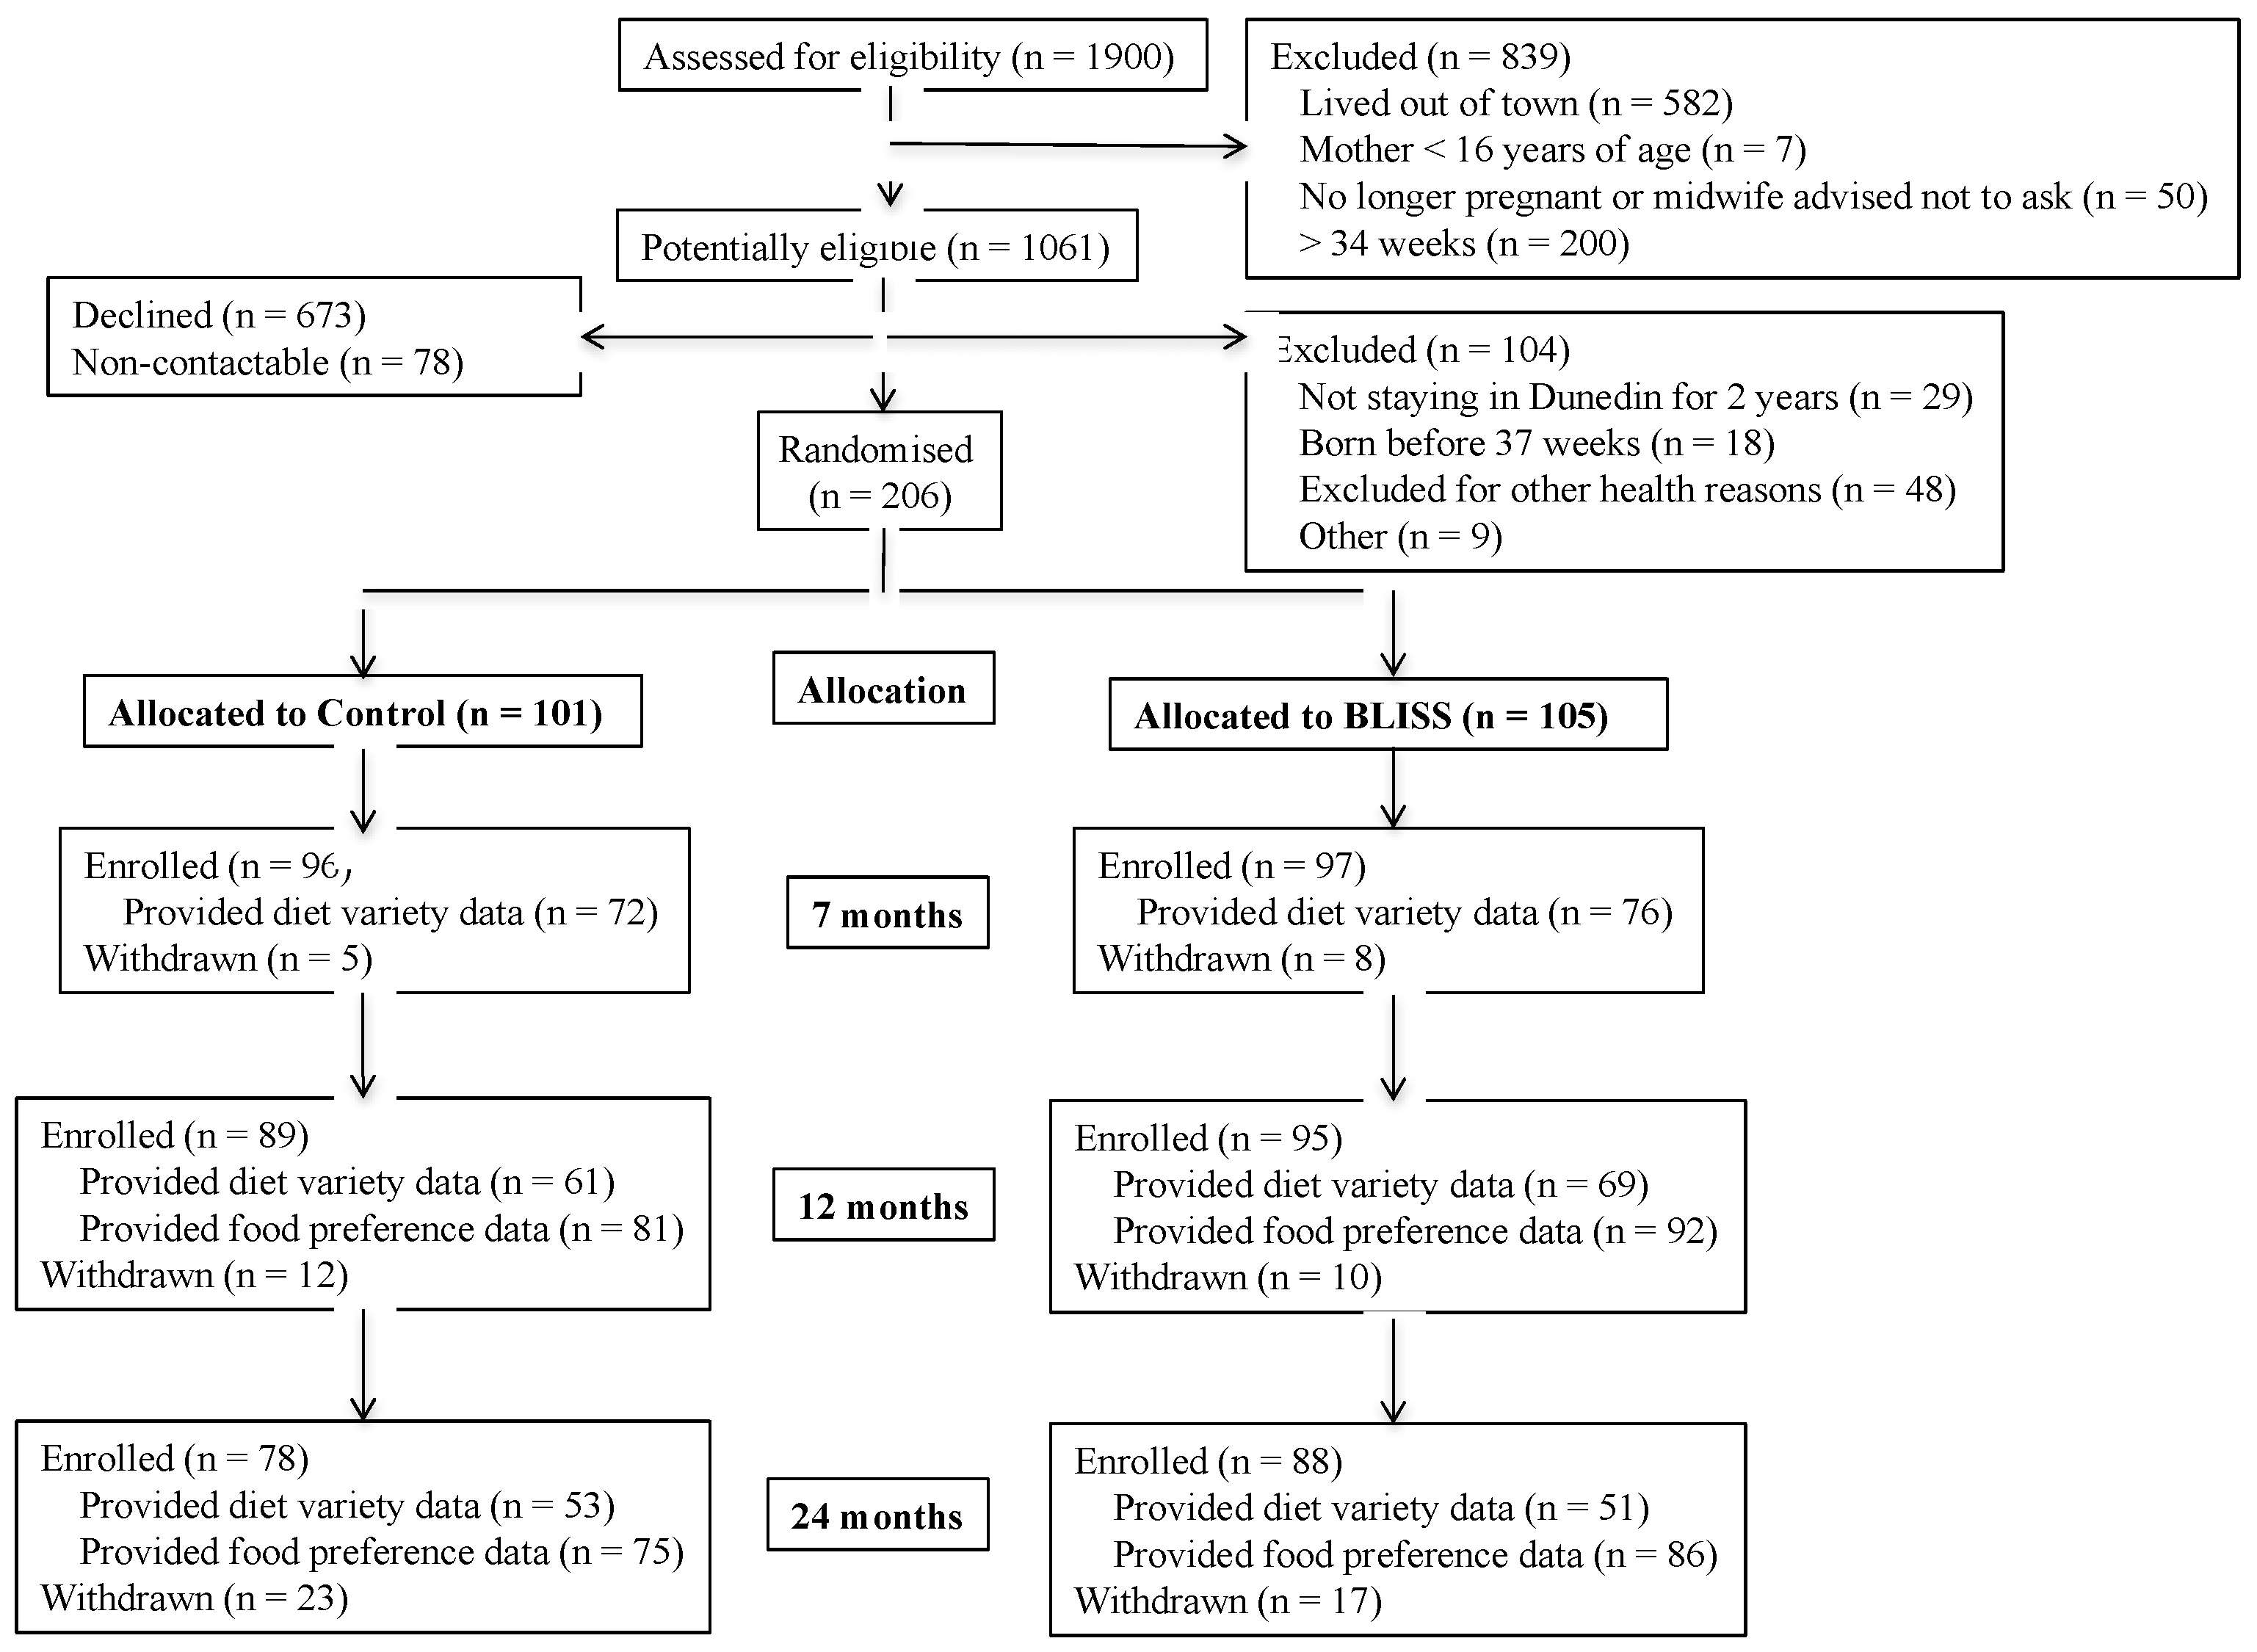
3.1. Participants
3.2. Food Variety
3.3. Food Preferences
4. Discussion
5. Conclusions
Author Contributions
Funding
Acknowledgments
Conflicts of Interest
References
- McAndrew, F.; Thompson, J.; Fellows, L.; Large, A.; Speed, M.; Renfrew, M.J. Infant Feeding Survey 2010; Health and Social Care Information Centre: London, UK, 2012. [Google Scholar]
- Infant Feeding and Nutrition: Complementary Foods. Available online: https://wicworks.fns.usda.gov/wicworks/Topics/FG/Chapter5_ComplementaryFoods.pdf (accessed on 20 March 2018).
- Food and Nutrition Guidelines for Healthy Eating for Infants and Toddlers (Aged 0–2): A Background Paper. Available online: https://www.health.govt.nz/system/files/documents/publications/food-and-nutrition-guidelines-healthy-infants-and-toddlers-revised-dec12.pdf (accessed on 20 March 2018).
- National Health and Medical Research Council (NHMRC). Infant Feeding Guidelines: Information for Health Workers; Department of Health and Ageing: Canberra, Australia, 2012; pp. 1–160.
- Guiding Principles of Complementary Feeding of the Breastfed Child. Available online: http://www.who.int/nutrition/publications/guiding_principles_compfeeding_breastfed.pdf (accessed on 20 March 2018).
- Guiding Principles for Feeding Non-Breastfed Children 6–24 Months of Age. Available online: http://www.who.int/maternal_child_adolescent/documents/9241593431/en/ (accessed on 20 March 2018).
- Rapley, G.; Murkett, T. Baby-Led Weaning; Vermilion: Londo, UK, 2008. [Google Scholar]
- Gibson-Moore, H. New perspectives of first foods, complementary feeding and obesity. Nutr. Bull. 2015, 40, 349–355. [Google Scholar] [CrossRef]
- Brown, A.; Lee, M.D. Early influences on child satiety-responsiveness: The role of weaning style. Pediatr. Obes. 2015, 10, 57–66. [Google Scholar] [CrossRef] [PubMed]
- Cichero, J.A.Y. Introducing solid foods using baby-led weaning vs. spoon-feeding: A focus on oral development, nutrient intake and quality of research to bring balance back to the debate. Nutr. Bull. 2016, 41, 72–77. [Google Scholar] [CrossRef]
- Rapley, G. Baby-led weaning: Transitioning to solid foods at the baby’s own pace. Community Pract. 2011, 84, 20–23. [Google Scholar] [CrossRef] [PubMed]
- Rapley, G. Baby-led weaning: The theory and evidence behind the approach. J. Health Visit 2015. [Google Scholar] [CrossRef]
- Cameron, S.L.; Heath, A.-L.M.; Taylor, R.W. How feasible is baby-led weaning as an approach to infant feeding? A review of the evidence. Nutrients 2012, 4, 1575–1609. [Google Scholar] [CrossRef] [PubMed]
- Brown, A.; Lee, M. A descriptive study investigating the use and nature of baby-led weaning in a UK sample of mothers. Matern. Child Nutr. 2011, 7, 34–47. [Google Scholar] [CrossRef] [PubMed]
- Wright, C.M.; Cameron, K.; Tsiaka, M.; Parkinson, K.N. Is baby-led weaning feasible? When do babies first reach out for and eat finger food? Matern. Child Nutr. 2011, 7, 27–33. [Google Scholar] [CrossRef] [PubMed]
- Rowan, H.; Harris, C. Baby-led weaning and the family diet. A. pilot study. Appetite 2012, 58, 1046–1049. [Google Scholar] [CrossRef] [PubMed]
- D’Andrea, E.; Jenkins, K.; Mathews, M.; Roebothan, B. Baby-led weaning: A preliminary investigation. Can. J. Diet. Pract. Res. 2016, 77, 72–77. [Google Scholar]
- Mennella, J.A. Ontogeny of taste preferences: Basic biology and implications for health. Am. J. Clin. Nutr. 2014, 99, 704S–711S. [Google Scholar] [CrossRef] [PubMed]
- Barends, C.; de Vries, J.H.M.; Mojet, J.; de Graaf, C. Effects of weaning exlusively with vegetables on vegetable intake at the age of 12 and 23 months. Appetite 2014, 81, 193–199. [Google Scholar] [CrossRef] [PubMed]
- Nicklaus, S. Children’s acceptance of new foods at weaning. Role of practices of weaning and of food sensory properties. Appetite 2011, 57, 812–815. [Google Scholar] [CrossRef] [PubMed]
- Ventura, A.K.; Worobey, J. Early influences on the development of food preferences. Curr. Biol. 2013, 23, R401–R408. [Google Scholar] [CrossRef] [PubMed]
- Townsend, E.; Pitchford, N.J. Baby knows best? The impact of weaning style in food preferences and body mass index in early childhood in a case-controlled sample. BMJ Open 2012, 2, e000298. [Google Scholar] [CrossRef] [PubMed]
- Taylor, R.W.; Williams, S.M.; Fangupo, L.J.; Wheeler, B.J.; Taylor, B.J.; Daniels, L.; Fleming, L.A.; McArthur, J.; Morison, B.; Erickson, L.W.; et al. Baby-led and conventional approaches to complementary feeding for obesity prevention: A randomised controlled trial. Jama Pediatr. 2017, 171, 838–846. [Google Scholar] [CrossRef] [PubMed]
- Cameron, S.L.; Heath, A.-L.M.; Taylor, R.W. Healthcare professionals’ and mothers’ knowledge of, attitudes to, and experiences with, baby-led weaning: A content analysis study. BMJ Open 2012, 2, e001542. [Google Scholar] [CrossRef] [PubMed]
- Daniels, L.; Heath, A.-L.H.; Williams, S.M.; Cameron, S.L.; Fleming, E.A.; Taylor, B.J.; Wheeler, B.J.; Gibson, R.S.; Taylor, R.W. Baby-Led Introduction to SolidS (BLISS) study: A randomised controlled trial of a baby-led approach to complementary feeding. BMJ Open 2015, 15, 179. [Google Scholar] [CrossRef] [PubMed]
- About Lead Maternity Carer (LMC) Services. Available online: https://www.midwife.org.nz/women-in-new-zealand/about-lead-maternity-carer-lmc-services (accessed on 25 June 2018).
- Well Child Tamariki Ora Visits. Available online: http://www.health.govt.nz/your-health/services-and-support/health-care-services/well-child-tamariki-ora (accessed on 25 June 2018).
- Cameron, S.L.; Heath, A.-L.M.; Taylor, R.W. Development and pilot testing of baby-led introduction to solids-a version of baby-led weaning modified to address concerns about iron deficiency, growth faltering and choking. BMJ Open 2015, 15, 99. [Google Scholar] [CrossRef] [PubMed]
- NZDep2013 Index of Deprivation. Available online: https://www.health.govt.nz/publication/nzdep2013-index-deprivation (accessed on 25 June 2018).
- Dewey, K.G.; Heinig, M.J.; Nommsen, L.A.; Lonnerdal, B. Adequacy of energy intake among breast-fed infants in the DARLING study: Relationships to growth velocity, morbidity, and activity levels. Davis Area Research on Lactation, Infant Nutrition and Growth. J. Pediatr. 1991, 119, 538–547. [Google Scholar] [CrossRef]
- Briefel, R.R.; Kalb, L.M.; Condon, E.; Deming, D.M.; Clusen, N.A.; Fox, M.K.; Harnack, L.; Gemmill, E.; Stevens, M.; Reidy, K.C. The Feeding Infants and Toddlers Study 2008: Study design and methods. J. Am. Diet. Assoc. 2010, 110, S16–S26. [Google Scholar] [CrossRef] [PubMed]
- Scott, J.A.; Chih, T.Y.; Oddy, W.H. Food variety at 2 years of age is related to duration of breastfeeding. Nutrients 2012, 4, 1464–1474. [Google Scholar] [CrossRef] [PubMed] [Green Version]
- Szymlek-Gay, E.A.; Ferguson, E.L.; Heath, A.-L.M.; Fleming, E.A. Quantities of foods consumed by 12- to 24-month old New Zealand children. Nutr. Diet. 2010, 67, 244–250. [Google Scholar] [CrossRef]
- Wardle, J.; Sanderson, S.; Gibson, E.L.; Rapoport, L. Factor-analytic structure of food preferences in four-year-old children in the UK. Appetite 2001, 37, 217–223. [Google Scholar] [CrossRef] [PubMed]
- Baron, R.M.; Kenny, D.A. The moderator–mediator variable distinction in social psychological research: Conceptual, strategic, and statistical considerations. J. Person Soc. Psychol. 1986, 51, 1173–1182. [Google Scholar] [CrossRef]
- Dunn, R.L.; Lessen, R. The influence of human milk on flavor and food preferences. Curr. Nutr. Rep. 2017, 6, 134–140. [Google Scholar] [CrossRef]
- Shim, J.E.; Kim, J.; Mathai, R.A.; the Strong Kids Research Team. Associations of infant feeding practices and picky eating behaviors of preschool children. J. Am. Diet. Assoc. 2011, 111, 1363–1368. [Google Scholar] [CrossRef] [PubMed]
- Liu, R.H. Dietary bioactive compounds and their health implications. J. Food Sci. 2013, 78, A18–A25. [Google Scholar] [CrossRef] [PubMed]
- Mennella, J.A.; Reiter, A.R.; Daniels, L.M. Vegetable and fruit acceptance during infancy: Impact on ontogeny, genetics, and early experiences. Adv. Nutr. 2016, 7, 211S–219S. [Google Scholar] [CrossRef] [PubMed]
- Birch, L.L.; Gunder, L.; Grimm-Thomas, K.; Laing, D.G. Infants’ consumption of a new food enhances acceptance of similar foods. Appetite 1998, 30, 283–295. [Google Scholar] [CrossRef] [PubMed]
- Werthman, J.; Jansen, A.; Havermans, R.; Nederkoorn, C.; Kremers, S.; Roefs, A. Bits and pieces. Food texture influences food acceptance in young children. Appetite 2015, 84, 181–187. [Google Scholar] [CrossRef] [PubMed]
- Northstone, K.; Emmett, P.; Nethersole, F. Avon Longitudinal Study of Pregnancy and Childhood: The effect of age of introduction to lumpy solids on foods eaten and reported feeding difficulties at 6 and 15 months. J. Hum. Nutr. Diet. 2001, 14, 43–54. [Google Scholar] [CrossRef] [PubMed]
- Brown, A.; Lee, M.D. Maternal control during the weaning period: Differences between mothers following a baby-led or standard weaning approach. Matern. Child Health 2011, 15, 1265–1271. [Google Scholar] [CrossRef] [PubMed]
- Falciglia, G.A.; Horner, S.L.; Liang, J.; Couch, S.C.; Levin, L.S. Assessing dietary variety in children: Development and validartion of a predictive equation. J. Am. Diet. Assoc. 2009, 109, 641–647. [Google Scholar] [CrossRef] [PubMed]


| Core foods (No Maximum Count) |
| Dairy products |
| Milk alternative 1 |
| Any cheese |
| Sweetened yoghurt 2 |
| Unsweetened yoghurt 2 |
| Custard |
| Low-fat dairy 3 |
| High-fat dairy 4 |
| Ice cream |
| Milk not as a drink 5 |
| Grains |
| Individual breakfast cereals counted separately |
| Baby rice cereal |
| Breads-white |
| Breads-whole meal or wholegrain |
| Breads-novelty 6 |
| Rice |
| Pasta |
| Crackers |
| Cereal bars |
| Baby rusks |
| Other grain products |
| Milk |
| Breast milk |
| Infant formula |
| Cow’s milk as a drink |
| Non-core foods (no maximum count) |
| Savoury |
| Pies |
| Burgers |
| Battered fish |
| Pizza |
| Fried chicken |
| Fried potatoes 7 |
| Pastries 8 |
| Dips 9 |
| Savoury muffins or scones |
| Croissants |
| Potato chips |
| Popcorn |
| Corn chips |
| Other salty snacks |
| Other takeaway foods |
| Sweet |
| Cakes or slices |
| Muffins or fruit loaves |
| Sweet scones or pancakes |
| Sweet pastries |
| Biscuits 10 |
| Individual ‘other desserts’ counted separately |
| Candy |
| Chocolate |
| Frozen ice block 11 |
| Other drinks |
| Soda |
| Fruit-flavored drink |
| Flavored milk drink |
| Fruit juice |
| Tea |
| Milo, chocolate, and malt drink |
| Coffee |
| Meat and other protein (maximum = 16) |
| Eggs |
| Peanut butter |
| Nuts or seeds |
| Baked beans |
| Hummus |
| Legumes |
| Vegetarian meat substitutes |
| Beef |
| Lamb |
| Pork |
| Venison |
| Chicken or turkey |
| Fish or shellfish |
| Sausages |
| Processed meats or cold cuts 12 |
| Offal and other unspecified meats |
| Pâté |
| Fruit and vegetables (no maximum count) |
| Individual fruits 13 and vegetables 14 counted separately |
| 7 Months | 12 Months | 24 Months | |||||||
|---|---|---|---|---|---|---|---|---|---|
| Control (n = 77) | BLISS (n = 85) | p8 | Control (n = 69) | BLISS (n = 75) | p8 | Control (n = 56) | BLISS (n = 57) | p8 | |
| Puréed 2 | 8.8 (2.6, 18.5) | 3.7 (0, 9.0) | 0.009 | 0 (0, 3.6) | 0 (0, 3.1) | >0.999 | 0 (0, 0) | 0 (0, 0) | >0.999 |
| Mashed 3 | 6.1 (1.3, 13.5) | 3.1 (0, 7.5) | 0.054 | 2.2 (0, 9.6) | 0.8 (0, 3.1) | 0.235 | 0 (0, 1.7) | 0 (0, 1.4) | >0.999 |
| Diced 4 | 0 (0, 2.2) | 0 (0, 2.1) | >0.999 | 2.8 (0, 5.6) | 0 (0, 5.1) | 0.084 | 1.1 (0, 5.9) | 1.1 (0, 6.3) | 0.927 |
| Smooth 5 | 3.7 (0, 8.6) | 7.5 (3.7, 11.9) | 0.209 | 5.2 (1.4, 9.7) | 4.7 (1.7, 8.8) | 0.422 | 8.6 (3.7, 16.0) | 8.8 (4.2, 12.8) | 0.543 |
| Whole 6 | 7.9 (2.6, 21.1) | 31.0 (20.5, 36.4) | <0.001 | 20.8 (13.2, 31.7) | 28.2 (19.2, 34.6) | 0.025 | 37.7 (29.6, 49.2) | 49.7 (37.7, 62.5) | <0.001 |
| Liquid 7 | 54.0 (43.8, 65.9) | 44.9 (36.6, 55.3) | 0.008 | 57.1 (47.4, 66.4) | 57.4 (49.6, 66.6) | 0.631 | 36.6 (23.0, 51.3) | 32.8 (20.7, 42.4) | 0.008 |
| Category | Control (n = 101) | BLISS (n = 105) | |
|---|---|---|---|
| n (%) | n (%) | ||
| Maternal variables | |||
| Age (years) 1 | Mean (SD) | 31.3 (6.2) | 31.3 (5.0) |
| Pre-pregnancy BMI 2 | Mean (SD) | 25.6 (5.6) | 25.9 (6.3) |
| Education | School only | 29 (28.7) | 34 (32.4) |
| Post-secondary | 19 (18.8) | 24 (22.9) | |
| University | 53 (52.5) | 47 (44.8) | |
| Parity | First child | 42 (41.6) | 43 (41.0) |
| Subsequent child | 59 (59.4) | 62 (59.0) | |
| Ethnicity | NZEO | 85 (84.2) | 83 (79.0) |
| Māori or Pacific | 10 (9.9) | 15 (14.1) | |
| Asian | 6 (5.9) | 7 (6.7) | |
| Household variables | |||
| Household deprivation 3 | 1–3 (Low) | 29 (28.7) | 31 (29.5) |
| 4–7 | 49 (48.5) | 53 (50.5) | |
| 8–10 (High) | 23 (22.8) | 21 (20.0) | |
| Infant variables | |||
| Birth weight (g) 4 | Mean (SD) | 3531 (486) | 3509 (451) |
| Sex 5 | Male | 53 (52.5) | 43 (41.0) |
| Female | 47 (47.5) | 62 (59.0) | |
| 7 months | 12 months | 24 months | |||||||
|---|---|---|---|---|---|---|---|---|---|
| Food group 1 | Control (n = 72) | BLISS (n = 76) | Difference 2 (95% CI) | Control (n = 61) | BLISS (n = 69) | Difference 2 (95% CI) | Control (n = 53) | BLISS (n = 51) | Difference 2 (95% CI) |
| Core foods | 5.8 (2.9) | 7.1 (2.4) | 1.3 (0.4, 2.2) | 9.4 (2.6) | 9.3 (2.5) | 0.0 (−0.9, 0.9) | 9.8 (2.4) | 9.7 (2.2) | 0.1 (−0.7, 0.9) |
| Non-core foods | 0.5 (1.0) | 1.1 (1.1) | 0.6 (0.2, 0.9) | 2.3 (1.7) | 2.2 (1.7) | −0.1 (−0.7, 0.5) | 4.9 (2.7) | 4.0 (2.6) | −0.7 (−1.8, 0.3) |
| Meat & other protein | 1.9 (1.7) | 3.2 (1.8) | 1.3 (0.8, 1.9) | 3.6 (1.6) | 4.0 (1.7) | 0.5 (−0.02, 1.1) | 4.0 (1.6) | 4.4 (1.8) | 0.4 (−0.2, 1.1) |
| Fruit and vegetables | 9.2 (4.1) | 8.1 (3.7) | −1.1 (−2.4, 0.2) | 11.9 (4.4) | 11.1 (5.1) | −0.6 (−2.2, 1.1) | 9.8 (4.2) | 11.5 (4.1) | 2.0 (0.4, 3.6) |
| Total food variety | 13.1 (6.1) | 15.9 (5.4) | 3.0 (1.1, 4.8) | 21.4 (5.8) | 21.6 (6.0) | 0.4 (−1.6 2.4) | 24.6 (6.4) | 25.3 (6.8) | 1.3 (−1.1, 3.7) |
| Taste category | Control (n = 81) | BLISS (n = 92) | Difference (95% CI) BLISS: Control 3 |
|---|---|---|---|
| Exposure score—i.e., offered to the infant 1 | |||
| Sweet 4 | 6.0 (2.1) | 5.7 (2.3) | −0.3 (−1.0, 0.4) |
| Savory-vegetable 5 | 5.9 (2.8) | 6.5 (2.2) | 0.8 (0.01, 1.5) |
| Savory-meat 6 | 7.1 (2.8) | 7.7 (2.5) | 0.4 (−0.3, 1.2) |
| Savory-non-meat high-protein 7 | 6.8 (2.7) | 8.0 (2.5) | 1.3 (0.6, 2.1) |
| Savory-French fries 8 | 6.8 (3.8) | 7.0 (4.0) | 0.2 (−1.0, 1.4) |
| Salty 9 | 5.0 (2.3) | 4.6 (2.3) | −0.5 (−1.2, 0.2) |
| Preference score—i.e., consumed by the infant 2 | |||
| Sweet 4 | 4.5 (0.5) | 4.5 (0.4) | 0.0 (−0.1, 0.1) |
| Savory-vegetable 5 | 4.1 (0.8) | 4.2 (0.6) | 0.1 (−0.1, 0.3) |
| Savory-meat 6 | 4.4 (0.6) | 4.5 (0.5) | 0.1 (−0.1, 0.2) |
| Savory-non-meat high-protein 7 | 4.3 (0.7) | 4.5 (0.5) | 0.2 (0.04, 0.4) |
| Savory-French fries 8 | 4.7 (0.4) | 4.6 (0.6) | −0.1 (−0.3, 0.1) |
| Salty 9 | 4.4 (0.8) | 4.4 (0.8) | 0.0 (−0.3, 0.3) |
| Texture category | Control (n = 81) | BLISS (n = 92) | Difference (95% CI) BLISS: Control 3 |
|---|---|---|---|
| Exposure score—i.e., offered to the infant 1 | |||
| Smooth 4 | 8.0 (3.6) | 7.6 (3.3) | −0.4 (−1.5, 0.6) |
| Lumpy 5 | 7.5 (2.3) | 8.5 (1.9) | 1.1 (0.4, 1.7) |
| Chewy 6 | 5.2 (2.3) | 5.6 (2.1) | 0.4 (−0.2, 1.0) |
| Crunchy 7 | 3.7 (2.7) | 3.5 (2.6) | −0.2 (−1.0, 0.5) |
| Preference score—i.e., consumed by the infant 2 | |||
| Smooth 4 | 4.6 (0.6) | 4.6 (0.6) | 0.0 (−0.2, 0.2) |
| Lumpy 5 | 4.2 (0.5) | 4.4 (0.4) | 0.2 (0.01, 0.3) |
| Chewy 6 | 4.3 (0.5) | 4.3 (0.5) | 0.0 (−0.1, 0.2) |
| Crunchy 7 | 4.6 (0.5) | 4.5 (0.5) | 0.0 (−0.2, 0.1) |
| Food Category | Control (n = 75) | BLISS (n = 86) | Difference (95% CI) BLISS: Control 1 |
|---|---|---|---|
| ‘Vegetables’ 2 | 3.7 (3.1, 4.1) | 3.8 (3.2, 4.2) | 0.1 (−0.2, 0.5) |
| ‘Fruit’ 3 | 4.8 (4.4, 4.9) | 4.8 (4.4, 4.9) | 0.1 (−0.1, 0.2) |
| ‘Meat and fish’ 4 | 4.2 (3.7, 4.6) | 4.3 (4.0, 4.5) | 0.1 (−0.2, 0.3) |
| ‘Desserts’ 5 | 4.4 (3.8, 4.8) | 4.4 (4.0, 4.8) | 0.1 (−0.2, 0.4) |
© 2018 by the authors. Licensee MDPI, Basel, Switzerland. This article is an open access article distributed under the terms and conditions of the Creative Commons Attribution (CC BY) license (http://creativecommons.org/licenses/by/4.0/).
Share and Cite
Morison, B.J.; Heath, A.-L.M.; Haszard, J.J.; Hein, K.; Fleming, E.A.; Daniels, L.; Erickson, E.W.; Fangupo, L.J.; Wheeler, B.J.; Taylor, B.J.; et al. Impact of a Modified Version of Baby-Led Weaning on Dietary Variety and Food Preferences in Infants. Nutrients 2018, 10, 1092. https://doi.org/10.3390/nu10081092
Morison BJ, Heath A-LM, Haszard JJ, Hein K, Fleming EA, Daniels L, Erickson EW, Fangupo LJ, Wheeler BJ, Taylor BJ, et al. Impact of a Modified Version of Baby-Led Weaning on Dietary Variety and Food Preferences in Infants. Nutrients. 2018; 10(8):1092. https://doi.org/10.3390/nu10081092
Chicago/Turabian StyleMorison, Brittany J., Anne-Louise M. Heath, Jillian J. Haszard, Karen Hein, Elizabeth A. Fleming, Lisa Daniels, Elizabeth W. Erickson, Louise J. Fangupo, Benjamin J. Wheeler, Barry J. Taylor, and et al. 2018. "Impact of a Modified Version of Baby-Led Weaning on Dietary Variety and Food Preferences in Infants" Nutrients 10, no. 8: 1092. https://doi.org/10.3390/nu10081092