Figure 1.
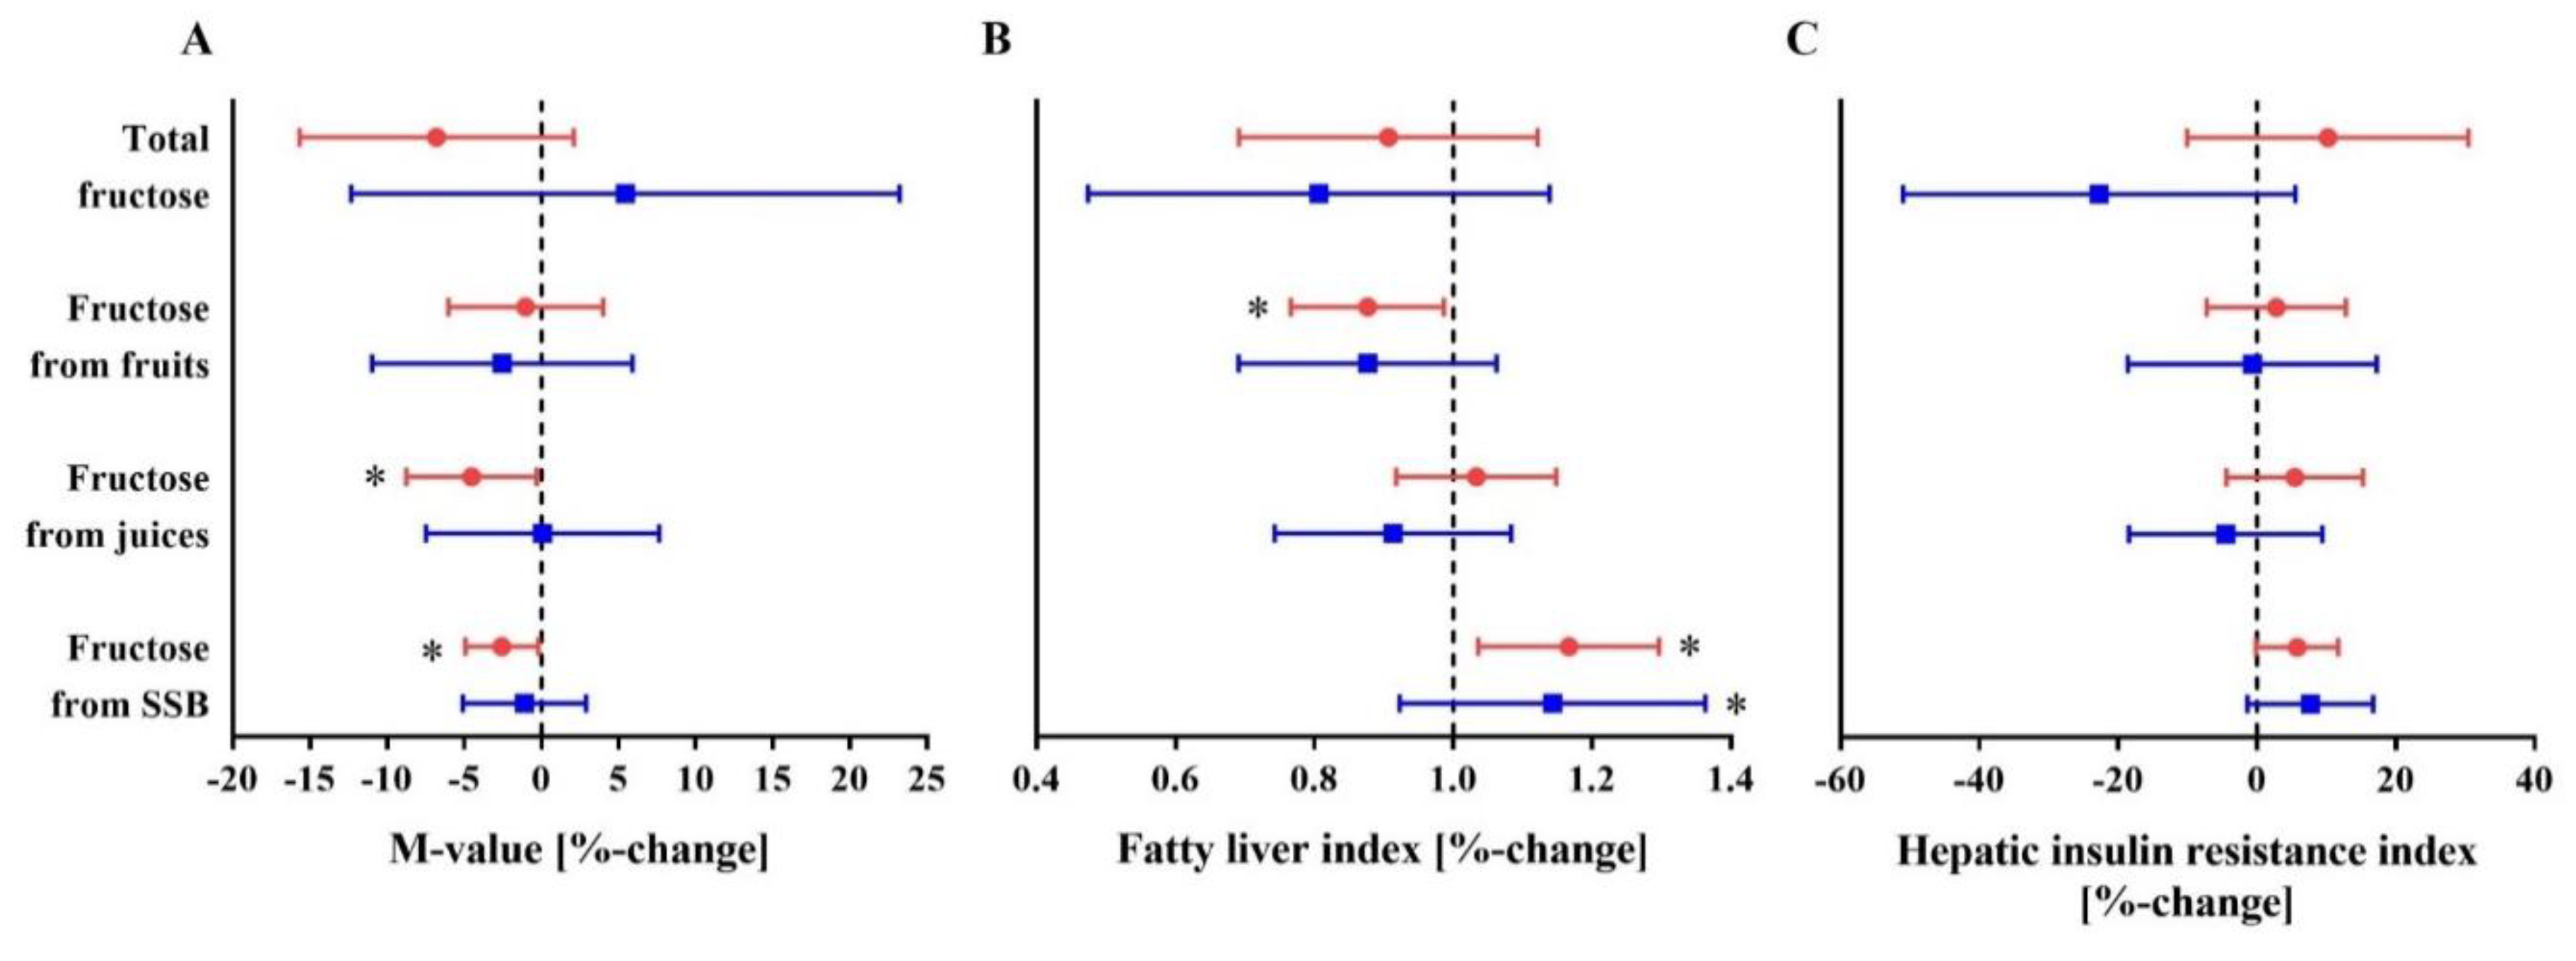
Association of sucrose plus non-sucrose bound total fructose, fructose from fruits, fruit juices and sugar-sweetened beverages with peripheral insulin sensitivity (M-value) (A), fatty liver index (B) and hepatic insulin resistance index (C) in patients with type 2 diabetes (T2D) and individuals without diabetes (CON). Data are summarized as relative changes, 95% confidence intervals (A,C) or odds ratios, 95% confidence intervals (B) and p-values from linear regression analyses, calculated using the M-value (A), the fatty liver index (B) and the hepatic insulin resistance index (C) as outcome variables. Total fructose as well as fructose from fruits, fruit juices and sugar-sweetened beverages were defined as exposure variables for linear regression analyses with fructose intake adjusted for the total daily energy intake [MJ] using the residual method. Red circles indicate individuals with type 2 diabetes, blue squares indicate individuals without diabetes (CON). * p < 0.05. Regression analyses are adjusted for total daily energy intake, age, BMI (not for models using fructose from SSB as independent variable), metabolic status, sex, the interaction term between metabolic status and sex, an interaction between subject group (T2D and CON) and fructose intake, leisure time physical activity and sports, marital status, highest school-leaving qualification, and current employment status. Relative changes (95% CI) (A,C) should be interpreted as follows: a doubling of fructose intake associates with a %-change of M-value (A), hepatic insulin resistance index (C) by the respective relative change. Odds ratios (95% CI) (B) should be interpreted as follows: a doubling of fructose intake associates with a change in the odds of having a fatty liver by the respective odds ratio. SSB, sugar-sweetened beverages.
Figure 1.
Association of sucrose plus non-sucrose bound total fructose, fructose from fruits, fruit juices and sugar-sweetened beverages with peripheral insulin sensitivity (M-value) (A), fatty liver index (B) and hepatic insulin resistance index (C) in patients with type 2 diabetes (T2D) and individuals without diabetes (CON). Data are summarized as relative changes, 95% confidence intervals (A,C) or odds ratios, 95% confidence intervals (B) and p-values from linear regression analyses, calculated using the M-value (A), the fatty liver index (B) and the hepatic insulin resistance index (C) as outcome variables. Total fructose as well as fructose from fruits, fruit juices and sugar-sweetened beverages were defined as exposure variables for linear regression analyses with fructose intake adjusted for the total daily energy intake [MJ] using the residual method. Red circles indicate individuals with type 2 diabetes, blue squares indicate individuals without diabetes (CON). * p < 0.05. Regression analyses are adjusted for total daily energy intake, age, BMI (not for models using fructose from SSB as independent variable), metabolic status, sex, the interaction term between metabolic status and sex, an interaction between subject group (T2D and CON) and fructose intake, leisure time physical activity and sports, marital status, highest school-leaving qualification, and current employment status. Relative changes (95% CI) (A,C) should be interpreted as follows: a doubling of fructose intake associates with a %-change of M-value (A), hepatic insulin resistance index (C) by the respective relative change. Odds ratios (95% CI) (B) should be interpreted as follows: a doubling of fructose intake associates with a change in the odds of having a fatty liver by the respective odds ratio. SSB, sugar-sweetened beverages.
![Nutrients 10 00774 g001]()
Table 1.
Characteristics of patients with type 2 diabetes and individuals without diabetes.
| | Type 2 Diabetes | CON | p |
|---|
| N (% males) | 161 (68%) | 62 (71%) | 0.748 |
| Age (years) | 53.2 ± 9.1 | 46.5 ± 14.0 | <0.001 |
| Diabetes duration (months) | 5.9 ± 3.2 | - | - |
| Glucose-lowering medication [diet/oral glucose-lowering medication/oral glucose-lowering medication + insulin/insulin] | 55 (34%)/(61%)/4 (2%)/4 (2%) | - | - |
| BMI (kg/m2) | 32.1 ± 6.0 | 28.0 ± 5.6 | <0.001 |
| Waist circumference (cm) | 107 ± 15 | 95 ± 17 | <0.001 |
| Fasting blood glucose (mg/dL) | 130 ± 29 | 92 ± 16 | <0.001 |
| Fasting insulin (mU/L) | 17.7 (13.2; 24.8) | 7.8 (5.3; 11.6) | <0.001 |
| HbA1c (% (mmol/mol)) | 6.4 ± 0.9 (46.5 ± 9.7) | 5.3 ± 0.3 (33.9 ± 3.1) | <0.001 |
| M-value (body weight, with space correction) (mg∙kg−1∙min−1) | 5.4 (4.2; 7.5) | 10.3 (8.5; 12.3) | <0.001 |
| Hepatic insulin resistance index (mg∙kg−1∙min−1∙mU−1∙L) * | 31.8 (21.5; 40.9) | 17.9 (11.4; 23.6) | <0.001 |
| Fatty liver index [a.u.] | 84.6 (62.5; 94.7) | 36.5 (12.5; 73.1) | <0.001 |
| Marital status [with spouse/unmated] | 123 (76%)/38 (24%) | 44 (71%)/18 (29%) | 0.395 |
| Highest school-leaving qualification: advanced technical college certificate/high school graduation [yes/no] | 87 (54%)/74 (46%) | 40 (65%)/22 (35%) | 0.176 |
| Current employment status [employed/unemployed] | 127 (79%)/34 (21%) | 41 (66%)/21 (34%) | 0.057 |
Table 2.
Dietary characteristics of patients with type 2 diabetes and individuals without diabetes.
| | T2D | CON | p |
|---|
| TEI (MJ/day) | 8.9 (7.1; 11.7) | 10.0 (8.0; 12.6) | 0.029 |
| Total sucrose plus non-sucrose bound fructose |
| (g/day) | 40.2 (30.5; 59.4) | 47.9 (38.2; 69.0) | 0.016 |
| (% of TEI) | 7.9 (6.0; 10.5) | 8.9 (6.9; 10.9) | 0.232 |
| Sucrose plus non-sucrose bound fructose from fruits |
| (g/day) | 11.0 (6.4; 18.9) | 12.3 (7.5; 17.6) | 0.924 |
| (% of TEI) | 2.1 (1.2; 3.3) | 2.2 (1.2; 2.9) | 0.404 |
| Sucrose plus non-sucrose bound fructose from juices |
| (g/day) | 1.6 (1.1; 3.6) | 2.5 (1.3; 5.4) | 0.029 |
| (% of TEI) | 0.3 (0.2; 0.6) | 0.4 (0.3; 0.9) | 0.146 |
| Sucrose plus non-sucrose bound fructose from SSB |
| (g/day) | 0.53 (0.21; 1.81) | 0.53 (0.21; 5.79) | 0.102 |
| (% of TEI) | 0.09 (0.05; 0.48) | 0.15 (0.05; 0.88) | 0.186 |
| Total non-sucrose bound fructose |
| (g/day) | 19.6 (13.3; 28.6) | 21.4 (14.6; 32.5) | 0.279 |
| (% of TEI) | 3.6 (2.7; 5.4) | 3.4 (2.9; 4.7) | 0.850 |
| Non-sucrose bound fructose from fruits |
| (g/day) | 7.2 (4.0; 13.8) | 8.5 (4.6; 11.2) | 0.759 |
| (% of TEI) | 1.4 (0.8; 2.4) | 1.3 (0.8; 1.9) | 0.253 |
| Non-sucrose bound fructose from juices |
| (g/day) | 0.8 (0.5; 1.9) | 1.3 (0.6; 3.0) | 0.034 |
| (% of TEI) | 0.2 (0.1; 0.3) | 0.2 (0.1; 0.4) | 0.133 |
| Non-sucrose bound fructose from sugar-sweetened beverages | |
| (g/day) | 0.4 (0.2; 1.2) | 0.4 (0.2; 3.8) | 0.110 |
| (% of TEI) | 0.07 (0.04; 0.33) | 0.10 (0.05; 0.58) | 0.209 |
| Carbohydrates | | | |
| (g/day) | 199.4 (148.1; 255.8) | 214.7 (173.3; 306.5) | 0.021 |
| (% of TEI) | 37.9 (33.3; 41.4) | 39.4 (35.0; 43.1) | 0.244 |
| Disaccharides |
| (g/day) | 56.3 (40.3; 74.9) | 68.3 (53.4; 97.1) | <0.001 |
| (% of TEI) | 10.6 (8.5; 13.5) | 12.5 (9.3; 15.1) | 0.009 |
| Sucrose | | | |
| (g/day) | 40.8 (30.5; 57.4) | 54.8 (40.9; 76.9) | <0.001 |
| (% of TEI) | 8.2 (6.4; 10.8) | 10.1 (70; 12.3) | 0.009 |
Table 3.
Association of fructose intake with peripheral insulin sensitivity (M-value) in patients with type 2 diabetes and individuals without diabetes.
| Parameter/Model | T2D (n = 161) | CON (n = 62) |
|---|
| | Relative Change (95% CI) * | p | Relative Change (95% CI) * | p |
|---|
| Sucrose plus non-sucrose bound fructose | | | | |
| Total fructose [residual] | | | | |
| Model 1 | −5.9 (−14.6; 3.7) | 0.219 | −0.9 (−16.5; 17.5) | 0.915 |
| Model 2 | −6.7 (−15.3; 2.9) | 0.164 | 1.7 (−14.2; 20.7) | 0.844 |
| Model 3 | −7.1 (−15.5; 2.3) | 0.132 | 4.5 (−11.8; 23.7) | 0.611 |
| Fructose from fruits [residual] | | | | |
| Model 1 | 0.3 (−4.6; 5.5) | 0.912 | 0.6 (−7.6; 9.6) | 0.886 |
| Model 2 | 0.0 (−4.9; 5.1) | 0.998 | 0.2 (−8.1; 9.2) | 0.967 |
| Model 3 | −1.1 (−6.0; 4.1) | 0.671 | −2.8 (−10.8; 6) | 0.523 |
| Fructose from juices [residual] | | | | |
| Model 1 | −3.6 (−7.8; 0.8) | 0.106 | 0.7 (−6.7; 8.8) | 0.856 |
| Model 2 | −3.9 (−8.1; 0.5) | 0.083 | −0.2 (−7.6; 7.8) | 0.963 |
| Model 3 | −4.6 (−8.7; −0.3) | 0.038 | −0.1 (−7.4; 7.7) | 0.979 |
| Fructose from SSB [residual] | | | | |
| Model 1 | −3.1 (−5.5; −0.7) | 0.011 | −2.5 (−6.4; 1.5) | 0.218 |
| Model 2 | −2.9 (−5.3; −0.5) | 0.017 | −2.3 (−6.1; 1.8) | 0.264 |
| Model 3 | −2.6 (−4.9; −0.2) | 0.035 | −1.1 (−5.1; 2.9) | 0.575 |
| Non-sucrose bound fructose | | | | |
| Total fructose [residual] | | | | |
| Model 1 | −5.1 (−12.0; 2.3) | 0.174 | −1.6 (−14.3; 13.0) | 0.816 |
| Model 2 | −5.9 (−12.8; 1.5) | 0.112 | 0.1 (−12.9; 14.9) | 0.990 |
| Model 3 | −6.4 (−13.1; 0.8) | 0.081 | 2.1 (−11.0; 17.0) | 0.767 |
| Fructose from fruits [residual] | | | | |
| Model 1 | 0.2 (−4.3; 4.9) | 0.923 | 0.1 (−7.4; 8.3) | 0.976 |
| Model 2 | −0.2 (−4.6; 4.5) | 0.946 | −0.4 (−7.9; 7.7) | 0.912 |
| Model 3 | −1.1 (−5.6; 3.6) | 0.627 | −2.9 (−10.3; 5.0) | 0.460 |
| Fructose from juices [residual] | | | | |
| Model 1 | −3.5 (−7.1; 0.4) | 0.076 | 0.3 (−6.3; 7.3) | 0.931 |
| Model 2 | −3.7 (−7.4; 0.1) | 0.058 | −0.5 (−7.1; 6.5) | 0.877 |
| Model 3 | −4.3 (−7.9; −0.5) | 0.025 | −0.5 (−6.9; 6.3) | 0.875 |
| Fructose from SSB [residual] | | | | |
| Model 1 | −3.3 (−5.9; −0.7) | 0.013 | −2.6 (−6.8; 1.7) | 0.229 |
| Model 2 | −3.1 (−5.7; −0.5) | 0.019 | −2.3 (−6.5; 2.0) | 0.282 |
| Model 3 | −2.7 (−5.2; −0.1) | 0.040 | −1.1 (−5.4; 3.3) | 0.605 |
Table 4.
Association of fructose intake with fatty liver index in patients with type 2 diabetes and individuals without diabetes.
| Parameter/Model | T2D (n = 161) | CON (n = 62) |
|---|
| | Relative Change (95% CI) * | p | Relative Change (95% CI) * | p |
|---|
| Sucrose plus non-sucrose bound fructose | | | | |
| Total fructose [residual] | | | | |
| Model 1 | 0.87 (0.68; 1.10) | 0.245 | 0.85 (0.56; 1.30) | 0.453 |
| Model 2 | 0.89 (0.70; 1.14) | 0.358 | 0.80 (0.53; 1.22) | 0.309 |
| Model 3 | 0.89 (0.70; 1.13) | 0.354 | 0.76 (0.50; 1.16) | 0.197 |
| Fructose from fruits [residual] | | | | |
| Model 1 | 0.85 (0.76; 0.96) | 0.010 | 0.83 (0.68; 1.02) | 0.082 |
| Model 2 | 0.86 (0.76; 0.97) | 0.013 | 0.85 (0.69; 1.04) | 0.118 |
| Model 3 | 0.87 (0.77; 0.99) | 0.033 | 0.86 (0.70; 1.07) | 0.167 |
| Fructose from juices [residual] | | | | |
| Model 1 | 1.01 (0.90; 1.12) | 0.898 | 0.88 (0.73; 1.06) | 0.178 |
| Model 2 | 1.02 (0.91; 1.14) | 0.720 | 0.90 (0.74; 1.09) | 0.262 |
| Model 3 | 1.03 (0.92; 1.15) | 0.642 | 0.90 (0.75; 1.09) | 0.284 |
| Fructose from SSB [residual] | | | | |
| Model 1 | 1.19 (1.06; 1.34) | 0.003 | 1.18 (0.98; 1.42) | 0.084 |
| Model 2 | 1.18 (1.05; 1.33) | 0.005 | 1.18 (0.97; 1.42) | 0.093 |
| Model 3 | 1.16 (1.04; 1.30) | 0.011 | 1.13 (0.93; 1.37) | 0.221 |
| Non-sucrose bound fructose | | | | |
| Total fructose [residual] | | | | |
| Model 1 | 0.85 (0.71; 1.03) | 0.095 | 0.82 (0.58; 1.15) | 0.248 |
| Model 2 | 0.88 (0.73; 1.05) | 0.161 | 0.78 (0.56; 1.10) | 0.156 |
| Model 3 | 0.89 (0.74; 1.06) | 0.195 | 0.75 (0.54; 1.06) | 0.099 |
| Fructose from fruits [residual] | | | | |
| Model 1 | 0.87 (0.78; 0.97) | 0.016 | 0.84 (0.69; 1.01) | 0.063 |
| Model 2 | 0.88 (0.79; 0.98) | 0.023 | 0.85 (0.70; 1.03) | 0.094 |
| Model 3 | 0.89 (0.80; 1.00) | 0.056 | 0.86 (0.71; 1.05) | 0.142 |
| Fructose from juices [residual] | | | | |
| Model 1 | 1.01 (0.92; 1.11) | 0.865 | 0.90 (0.76; 1.07) | 0.227 |
| Model 2 | 1.02 (0.93; 1.12) | 0.688 | 0.92 (0.78; 1.09) | 0.324 |
| Model 3 | 1.03 (0.93; 1.13) | 0.608 | 0.92 (0.78; 1.09) | 0.347 |
| Fructose from SSB [residual] | | | | |
| Model 1 | 1.20 (1.06; 1.36) | 0.004 | 1.20 (0.98; 1.47) | 0.081 |
| Model 2 | 1.19 (1.05; 1.35) | 0.006 | 1.19 (0.97; 1.46) | 0.091 |
| Model 3 | 1.17 (1.03; 1.33) | 0.014 | 1.14 (0.93; 1.40) | 0.219 |
Table 5.
Association of fructose intake with hepatic insulin resistance index in patients with type 2 diabetes and individuals without diabetes.
| Parameter/Model | T2D (n = 73) | CON (n = 32) |
|---|
| | Relative Change (95% CI) * | p | Relative Change (95% CI) * | p |
|---|
| Sucrose plus non-sucrose bound fructose | | | | |
| Total fructose [residual] | | | | |
| Model 1 | 6.0 (−12.9; 29.0) | 0.559 | −13.5 (−41.7; 28.4) | 0.468 |
| Model 2 | 6.8 (−12.5; 30.4) | 0.513 | −17.8 (−44.9; 22.8) | 0.336 |
| Model 3 | 9.0 (−9.4; 31.1) | 0.356 | −26.2 (−49.1; 7.1) | 0.108 |
| Fructose from fruits [residual] | | | | |
| Model 1 | −3.8 (−12.8; 6.2) | 0.438 | −10.8 (−25.5; 6.9) | 0.212 |
| Model 2 | −3.5 (−12.6; 6.5) | 0.474 | −9.2 (−24.4; 9.0) | 0.298 |
| Model 3 | 2.5 (−7.1; 13.0) | 0.621 | −1.7 (−18; 17.8) | 0.848 |
| Fructose from juices [residual] | | | | |
| Model 1 | 2.9 (−6.6; 13.3) | 0.562 | −5.6 (−18.9; 9.8) | 0.451 |
| Model 2 | 2.6 (−6.9; 13.1) | 0.604 | −5.8 (−19.6; 10.3) | 0.453 |
| Model 3 | 5.2 (−4.2; 15.5) | 0.289 | −5.2 (−18.0; 9.7) | 0.471 |
| Fructose from SSB [residual] | | | | |
| Model 1 | 7.9 (2.2; 13.9) | 0.007 | 10.8 (2.2; 20.2) | 0.013 |
| Model 2 | 7.6 (1.8; 13.7) | 0.010 | 10.6 (1.8; 20.2) | 0.018 |
| Model 3 | 5.7 (−0.1; 11.7) | 0.053 | 7.5 (−1.2; 16.9) | 0.093 |
| Non-sucrose bound fructose | | | | |
| Total fructose [residual] | | | | |
| Model 1 | 0.8 (−13.5; 17.4) | 0.919 | −2.2 (−28.6; 33.8) | 0.8862 |
| Model 2 | 1.6 (−12.9; 18.5) | 0.839 | −7.4 (−32.9; 27.9) | 0.6384 |
| | 4.4 (−9.6; 20.5) | 0.556 | −15.0 (−37.2; 14.8) | 0.285 |
| Fructose from fruits [residual] | | | | |
| Model 1 | −3.3 (−11.6; 5.7) | 0.450 | −9.6 (−23.2; 6.3) | 0.220 |
| Model 2 | −3.1 (−11.4; 6) | 0.492 | −8.4 (−22.3; 8) | 0.292 |
| | 2.4 (−6.3; 11.8) | 0.598 | −1.5 (−16.3; 15.8) | 0.851 |
| Fructose from juices [residual] | | | | |
| Model 1 | 3 (−5.5; 12.1) | 0.501 | −4.7 (−17; 9.4) | 0.488 |
| Model 2 | 2.7 (−5.8; 12) | 0.537 | −4.9 (−17.6; 9.7) | 0.485 |
| | 5.1 (−3.2; 14.1) | 0.235 | −4.6 (−16.5; 8.9) | 0.481 |
| Fructose from SSB [residual] | | | | |
| Model 1 | 8.3 (2.1; 14.8) | 0.008 | 11.3 (2; 21.4) | 0.016 |
| Model 2 | 8.0 (1.7; 14.6) | 0.012 | 11 (1.5; 21.4) | 0.023 |
| | 5.9 (−0.3; 12.5) | 0.061 | 7.6 (−1.7; 17.8) | 0.112 |


 ,
, 
