Evaluation of Energy Expenditure and Oxidation of Energy Substrates in Adult Males after Intake of Meals with Varying Fat and Carbohydrate Content

 ,
,  ,
,
Abstract
:1. Introduction
2. Methods
2.1. Study Procedures and Indirect Calorimetry Measurements
2.2. Statistical Analysis
3. Results
4. Discussion
5. Conclusions
Author Contributions
Funding
Acknowledgments
Conflicts of Interest
References
- Barness, L.A.; Opitz, J.M.; Gilbert-Barness, E. Obesity: Genetic, molecular, and environmental aspects. Am. J. Med. Genet. Part A 2007, 143A, 3016–3034. [Google Scholar] [CrossRef] [PubMed]
- Flegal, K.M.; Carroll, M.D.; Ogden, C.L.; Curtin, L.R. Prevalence and trends in obesity among US adults, 1999–2008. JAMA 2010, 303, 235–241. [Google Scholar] [CrossRef] [PubMed]
- Corpeleijn, E.; Saris, W.H.; Blaak, E.E. Metabolic flexibility in the development of insulin resistance and type 2 diabetes: Effects of lifestyle. Obes. Rev. 2009, 10, 178–193. [Google Scholar] [CrossRef] [PubMed]
- Crowell, M.D.; Decker, G.A.; Levy, R.; Jeffrey, R.; Talley, N.J. Gut-brain neuropeptides in the regulation of ingestive behaviors and obesity. Am. J. Gastroenterol. 2006, 101, 2848–2856. [Google Scholar] [CrossRef] [PubMed]
- Arora, S.; Anubhuti. Role of neuropeptides in appetite regulation and obesity—A review. Neuropeptides 2006, 40, 375–401. [Google Scholar] [CrossRef] [PubMed]
- Stookey, J.J. Negative, Null and Beneficial Effects of Drinking Water on Energy Intake, Energy Expenditure, Fat Oxidation and Weight Change in Randomized Trials: A Qualitative Review. Nutrients 2016, 8, 19. [Google Scholar] [CrossRef] [PubMed]
- Bell, D.S.; O’Keefe, J.H.; Jellinger, P. Postprandial dysmetabolism: The missing link between diabetes and cardiovascular events? Endocr. Pract. 2008, 14, 112–124. [Google Scholar] [CrossRef] [PubMed]
- Soares, M.J.; She-Ping-Delfos, W.L. Postprandial energy metabolism in the regulation of body weight: Is there a mechanistic role for dietary calcium? Nutrients 2010, 2, 586–598. [Google Scholar] [CrossRef] [PubMed]
- Tentolouris, N.; Tsigos, C.; Perea, D.; Koukou, E.; Kyriaki, D.; Kitsou, E.; Daskas, S.; Daifotis, Z.; Makrilakis, K.; Raptis, S.A.; et al. Differential effects of high-fat and high-carbohydrate isoenergetic meals on cardiac autonomic nervous system activity in lean and obese women. Metabolism 2003, 52, 1426–1432. [Google Scholar] [CrossRef]
- Tentolouris, N.; Alexiadou, K.; Kokkinos, A.; Koukou, E.; Perrea, D.; Kyriaki, D.; Katsilambros, N. Meal-induced thermogenesis and macronutrient oxidation in lean and obese women after consumption of carbohydrate-rich and fat-rich meals. Nutrition 2011, 27, 310–315. [Google Scholar] [CrossRef] [PubMed]
- Imbeault, P.; Doucet, E.; Mauriège, P.; St-Pierre, S.; Couillard, C.; Alméras, N.; Després, J.P.; Tremblay, A. Difference in leptin response to a high-fat meal between lean and obese men. Clin. Sci. 2001, 101, 359–365. [Google Scholar] [CrossRef] [PubMed]
- Rizi, E.P.; Loh, T.P.; Baig, S.; Chhay, V.; Huang, S.; Quek, J.C.; Tai, E.S.; Toh, S.A.; Khoo, C.M. A high carbohydrate, but not fat or protein meal attenuates postprandial ghrelin, PYY and GLP-1 responses in Chinese men. PLoS ONE 2018, 13, e0191609. [Google Scholar]
- Chowdhury, E.A.; Richardson, J.D.; Tsintzas, K.; Thompson, D.; Betts, J.A. Postprandial Metabolism and Appetite Do Not Differ between Lean Adults that Eat Breakfast or Morning Fast for 6 Weeks. J. Nutr. 2018, 148, 13–21. [Google Scholar] [CrossRef] [PubMed]
- Adamska, E.; Ostrowska, L.; Gościk, J.; Waszczeniuk, M.; Krętowski, A.; Górska, M. Intake of Meals Containing High Levels of Carbohydrates or High Levels of Unsaturated Fatty Acids Induces Postprandial Dysmetabolism in Young Overweight/Obese Men. Biomed. Res. Int. 2015, 2015, 147196. [Google Scholar] [CrossRef] [PubMed]
- Adamska, E.; Kretowski, A.; Goscik, J.; Citko, A.; Bauer, W.; Waszczeniuk, M.; Maliszewska, K.; Paczkowska-Abdulsalam, M.; Niemira, M.; Szczerbinski, L.; et al. The type 2 diabetes susceptibility TCF7L2 gene variants affect postprandial glucose and fat utilization in non-diabetic subjects. Diabetes Metab. 2017. [Google Scholar] [CrossRef] [PubMed]
- Kretowski, A.; Adamska, E.; Maliszewska, K.; Wawrusiewicz-Kurylonek, N.; Citko, A.; Goscik, J.; Bauer, W.; Wilk, J.; Golonko, A.; Waszczeniuk, M.; et al. The rs340874 PROX1 type 2 diabetes mellitus risk variant is associated with visceral fat accumulation and alterations in postprandial glucose and lipid metabolism. Genes Nutr. 2015, 10, 454. [Google Scholar] [CrossRef] [PubMed]
- Achamrah, N.; Jésus, P.; Grigioni, S.; Rimbert, A.; Petit, A.; Déchelotte, P.; Folope, V.; Coëffier, M. Validity of Predictive Equations for Resting Energy Expenditure Developed for Obese Patients: Impact of Body Composition Method. Nutrients 2018, 10, 63. [Google Scholar] [CrossRef] [PubMed]
- Gupta, R.D.; Ramachandran, R.; Venkatesan, P.; Anoop, S.; Joseph, M.; Thomas, N. Indirect Calorimetry: From Bench to Bedside. Indian J. Endocrinol. Metab. 2017, 21, 594–599. [Google Scholar] [PubMed]
- Cooper, J.A.; Watras, A.C.; O’Brien, M.J.; Luke, A.; Dobratz, J.R.; Earthman, C.P.; Schoeller, D.A. Assessing validity and reliability of resting metabolic rate in six gas analysis systems. J. Am. Diet. Assoc. 2009, 109, 128–132. [Google Scholar] [CrossRef] [PubMed]
- Chambers, J.M.; Freeny, A.; Heiberger, R.M. Analysis of variance; designed experiments. In Statistical Models in S; Routledge: Abingdon, UK, 1992; Chapter 5. [Google Scholar]
- Wilcoxon, F. Individual comparisons by ranking methods. Biom. Bull. 1945, 1, 80–83. [Google Scholar] [CrossRef]
- Shapiro, S.S.; Wilk, M.B. An analysis of variance test for normality (complete samples). Biometrika 1965, 52, 591–611. [Google Scholar] [CrossRef]
- Mann, H.B.; Whitney, D.R. On a Test of Whether one of Two Random Variables is Stochastically Larger than the other. Ann. Math. Stat. 1947, 18, 50–60. [Google Scholar] [CrossRef]
- Levene, H. Robust tests for equality of variances. In Contributions to Probability and Statistics: Essays in Honor of Harold Hotelling; Stanford University Press: Palo Alto, CA, USA, 1960; pp. 278–292. [Google Scholar]
- Benjamini, Y.; Hochberg, Y. Controlling the false discovery rate: A practical and powerful approach to multiple testing. J. R. Stat. Soc. 1995, 57, 289–300. [Google Scholar]
- Rankinen, T.; Zuberi, A.; Chagnon, Y.C.; Weisnagel, S.J.; Argyropoulos, G.; Walts, B.; Pérusse, L.; Bouchard, C. The human obesity gene map: The 2005 update. Obesity 2006, 14, 529–644. [Google Scholar] [CrossRef] [PubMed]
- Weker, H. Simple obesity in children. A study on the role of nutritional factors. Med. Wieku Rozwoj. 2006, 10, 3–191. [Google Scholar] [PubMed]
- Kruizenga, H.M.; Hofsteenge, G.H.; Weijs, P.J. Predicting resting energy expenditure in underweight, normal weight, overweight, and obese adult hospital patients. Nutr. Metab. 2016, 13, 85. [Google Scholar] [CrossRef] [PubMed]
- Marques-Lopes, I.; Forga, L.; Martínez, J.A. Thermogenesis induced by a high-carbohydrate meal in fasted lean and overweight young men: Insulin, body fat, and sympathetic nervous system involvement. Nutrition 2003, 19, 25–29. [Google Scholar] [CrossRef]
- Raben, A.; Agerholm-Larsen, L.; Flint, A.; Holst, J.J.; Astrup, A. Meals with similar energy densities but rich in protein, fat, carbohydrate, or alcohol have different effects on energy expenditure and substrate metabolism but not on appetite and energy intake. Am. J. Clin. Nutr. 2003, 77, 91–100. [Google Scholar] [CrossRef] [PubMed]
- Potter, J.F.; Heseltine, D.; Hartley, G.; Matthews, J.; MacDonald, I.A.; James, O.F. Effects of meal composition on the postprandial blood pressure, catecholamine and insulin changes in elderly subjects. Clin. Sci. 1989, 77, 265–272. [Google Scholar] [CrossRef] [PubMed]
- Ellis, A.C.; Hyatt, T.C.; Hunter, G.R.; Gower, B.A. Respiratory quotient predicts fat mass gain in premenopausal women. Obesity 2010, 18, 2255–2259. [Google Scholar] [CrossRef] [PubMed]
- Thomas, C.D.; Peters, J.C.; Reed, G.W.; Abumrad, N.N.; Sun, M.; Hill, J.O. Nutrient balance and energy expenditure during ad libitum feeding of high-fat and high-carbohydrate diets in humans. Am. J. Clin. Nutr. 1992, 55, 934–942. [Google Scholar] [CrossRef] [PubMed]
- Bergouignan, A.; Gozansky, W.S.; Barry, D.W.; Leitner, W.; MacLean, P.S.; Hill, J.O.; Draznin, B.; Melanson, E.L. Increasing dietary fat elicits similar changes in fat oxidation and markers of muscle oxidative capacity in lean and obese humans. PLoS ONE 2012, 7, e30164. [Google Scholar] [CrossRef] [PubMed]
- Ciborowski, M.; Adamska, E.; Rusak, M.; Godzien, J.; Wilk, J.; Citko, A.; Bauer, W.; Gorska, M.; Kretowski, A. CE-MS-based serum fingerprinting to track evolution of type 2 diabetes mellitus. Electrophoresis 2015, 36, 2286–2293. [Google Scholar] [CrossRef] [PubMed]


| Parameter | Normal-Weight | Overweight/Obese | p-Value | |
|---|---|---|---|---|
| Men | Men | |||
| Group 1 | n | 11 | 12 | |
| Age (years) | 33 ± 2 | 40 ± 2 | 0.01 | |
| BMI | 23.8 ± 0.5 | 31.4 ± 1.5 | 0.0002 | |
| Body fat content (%) | 17.9 ± 1.0 | 28.6 ± 1.7 | 0.00003 | |
| Group 2 | n | 12 | 11 | |
| Age (years) | 33 ± 3 | 36 ± 3 | 0.24 | |
| BMI | 23.9 ± 0.2 | 33.7 ± 2.2 | 0.000001 | |
| Body fat content (%) | 18.6 ± 1.5 | 31.9 ± 2.7 | 0.0002 | |
| Parameter | High-Carbohydrate Meal | Normo-Carbohydrate Meal | High-Fat Meal |
|---|---|---|---|
| Energy (kcal) | 450 | 450 | 450 |
| Carbohydrate (g) | 100.5 | 51.1 | 4.0 |
| Carbohydrate (% of total energy) | 89.3 | 45.1 | 4.0 |
| Fat (g) | 0 | 12.6 | 47.5 |
| Fat (% of total energy) | 0 | 25.2 | 96 |
| Protein (g) | 12 | 36 | 0 |
| Protein (% of total energy) | 10.7 | 29.7 | 0 |
| Fiber (g) | 0 | 0.1 | 0 |
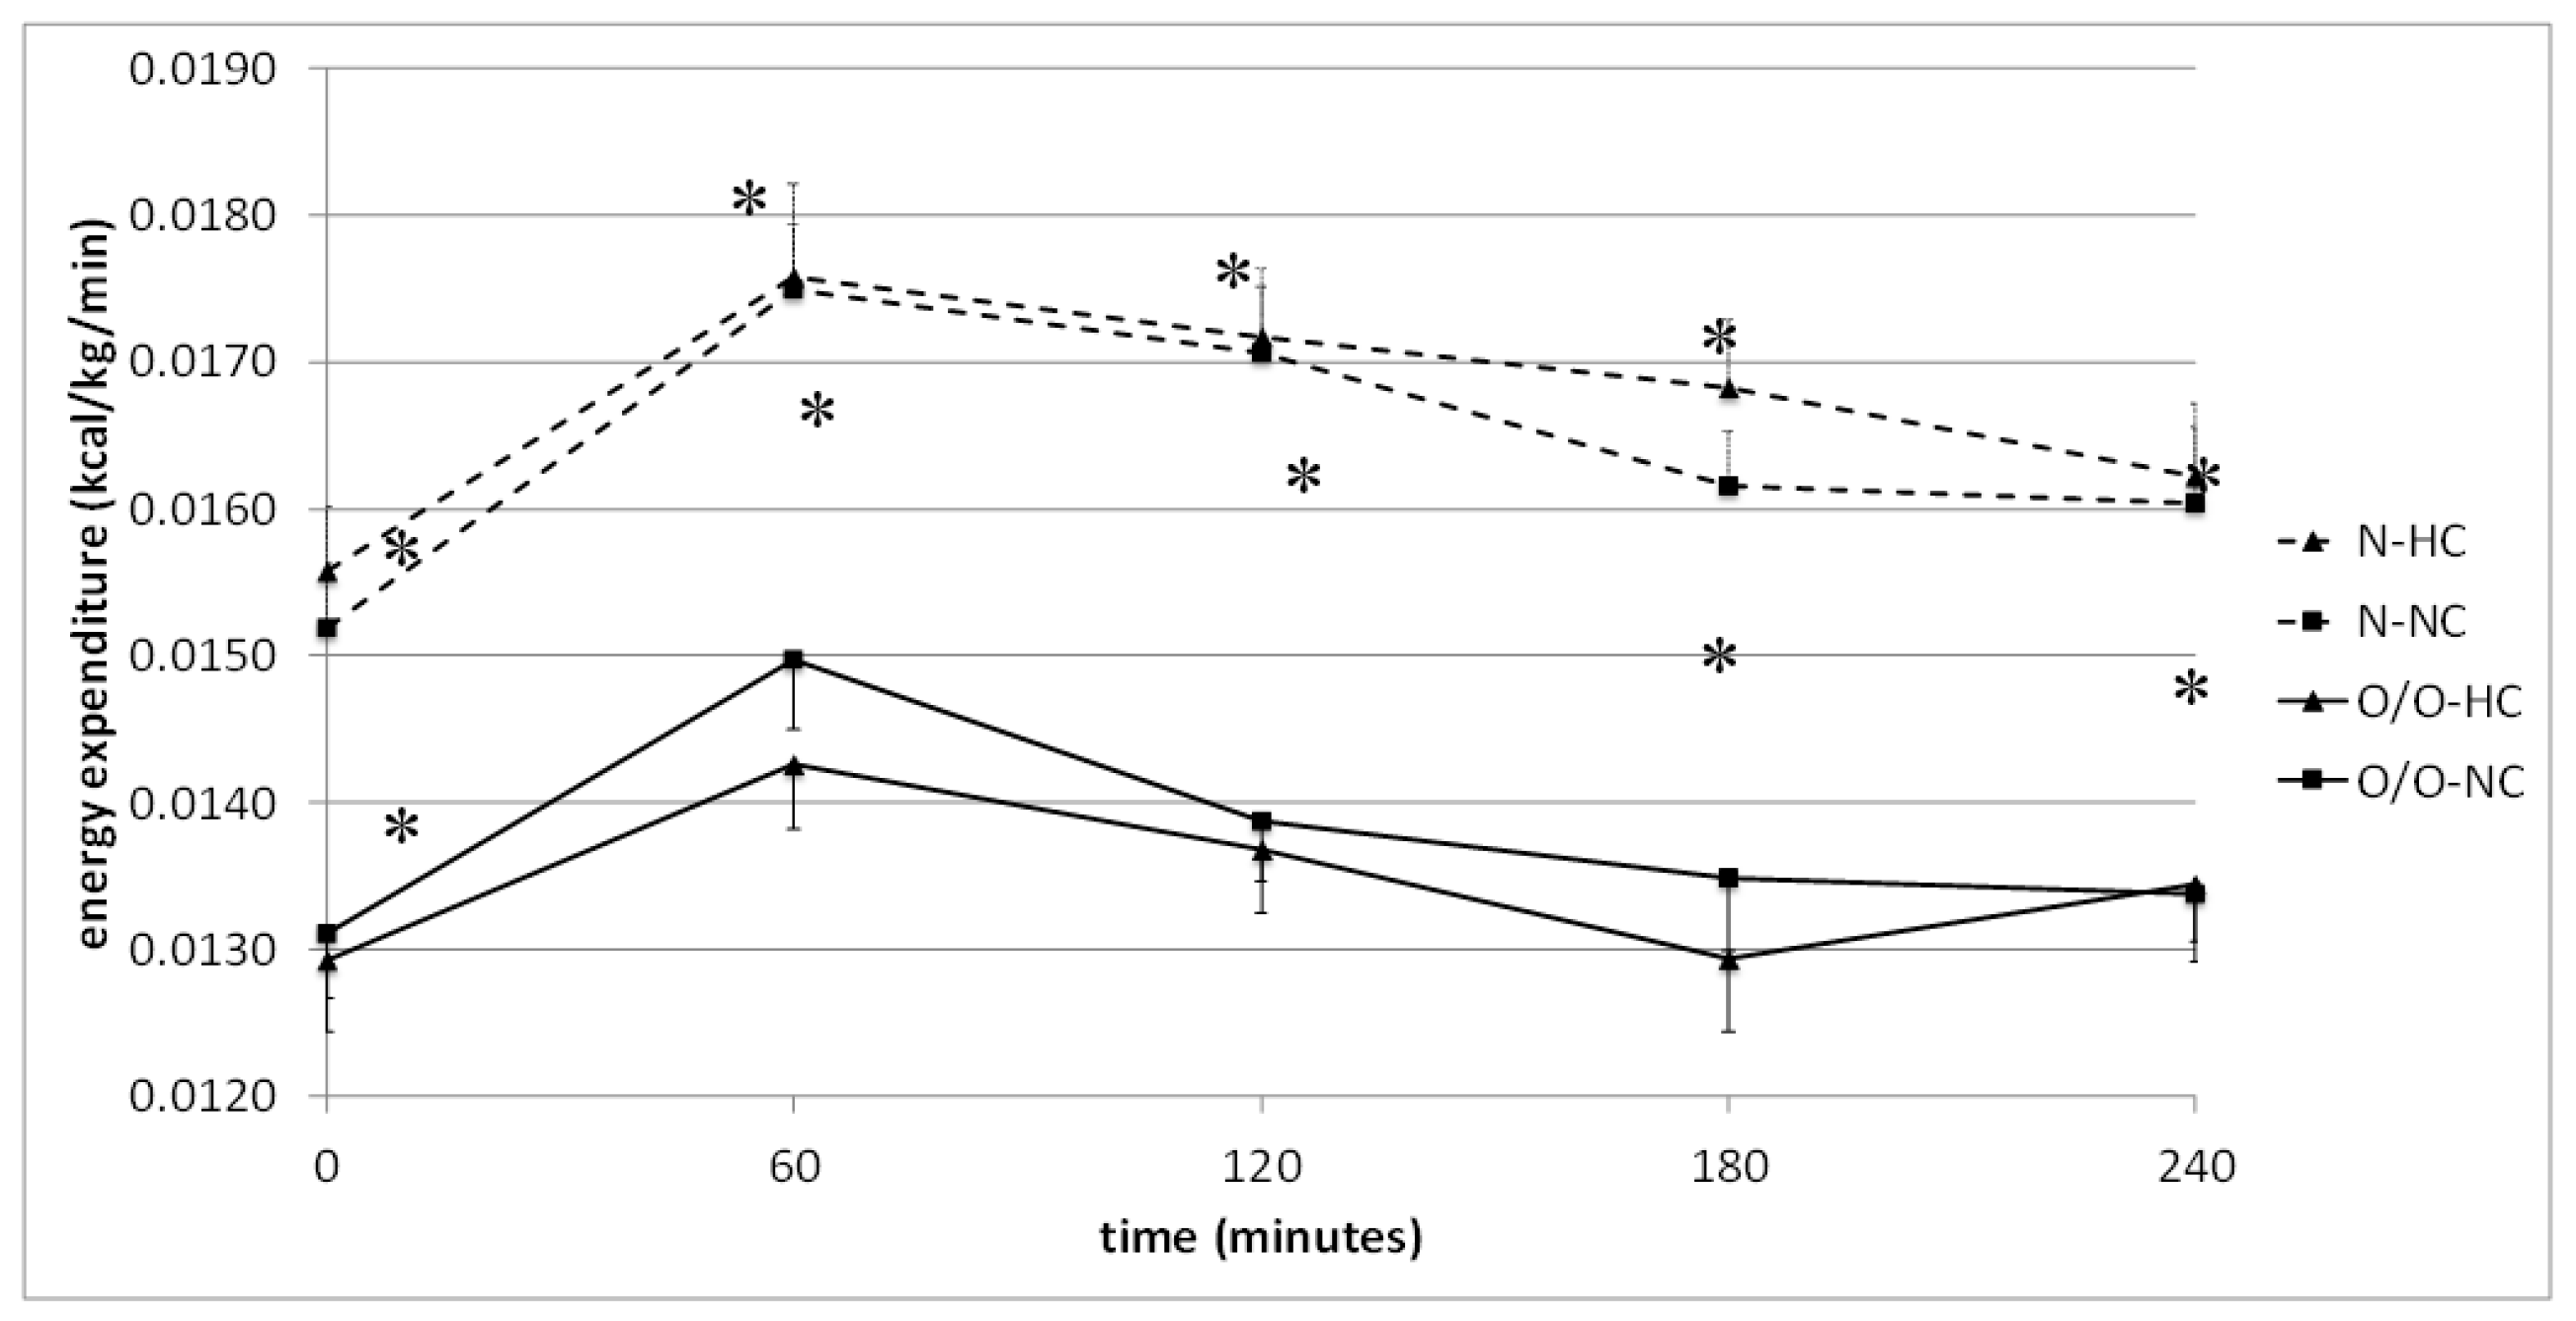
| G1 | Time (min) | 0 | 60 | 120 | 180 | 240 | The Area under the Curve |
| High-carbohydrate (HC) meal vs. normo- carbohydrate (NC) meal | N1-HC | 0.0156 ± 0.0004 | 0.0176 ± 0.0006 | 0.0172 ± 0.0005 | 0.0168 ± 0.0005 | 0.0162 ± 0.0005 | 4.0689 ± 0.1191 |
| N1-NC | 0.0152 ± 0.0004 | 0.0175 ± 0.004 | 0.0171 ± 0.0004 | 0.0162 ± 0.0004 | 0.0160 ± 0.0005 | 3.9562 ± 0.0973 | |
| * p = | 0.29 | 0.68 | 0.78 | 0.11 | 0.72 | 0.11 | |
| O/O1-HC | 0.00129 ± 0.0005 | 0.0143 ± 0.0004 | 0.0137 ± 0.0004 | 0.0129 ± 0.005 | 0.0134 ± 0.004 | 3.2434 ± 0.0918 | |
| O/O1-NC | 0.0131 ± 0.0004 | 0.0150 ± 0.0005 | 0.0139 ± 0.0004 | 0.0135 ± 0.0005 | 0.0134 ± 0.0005 | 3.3340 ± 0.0974 | |
| * p = | 0.70 | 0.70 | 0.72 | 0.27 | 0.83 | 0.21 | |
| G2 | Time (min) | 0 | 60 | 120 | 180 | 240 | The Area under the Curve |
| High-carbohydrate (HC) meal vs. high-fat (HF) meal | N2-HC | 0.0155 ± 0.0011 | 0.0172 ± 0.0008 | 0.0167 ± 0.0007 | 0.0156 ± 0.0008 | 0.0155 ± 0.0006 | 3.9040 ± 0.1864 |
| N2-HF | 0.0151 ± 0.0005 | 0.0152 ± 0.0005 | 0.0157 ± 0.0005 | 0.0155 ± 0.0004 | 0.0160 ± 0.0006 | 3.7185 ± 0.1190 | |
| ** p = | 0.68 | 0.01 | 0.11 | 0.81 | 0.19 | 0.20 | |
| O/O2-HC | 0.0133 ± 0.0004 | 0.0145 ± 0.0005 | 0.0139 ± 0.0003 | 0.0131 ± 0.0004 | 0.0132 ± 0.0004 | 3.2887 ± 0.0960 | |
| O/O2-HF | 0.0132 ± 0.0005 | 0.0128 ± 0.0004 | 0.0132 ± 0.0004 | 0.0137 ± 0.0005 | 0.0134 ± 0.0005 | 3.1815 ± 0.1023 | |
| ** p = | 0.78 | 0.0008 | 0.18 | 0.24 | 0.46 | 0.23 |
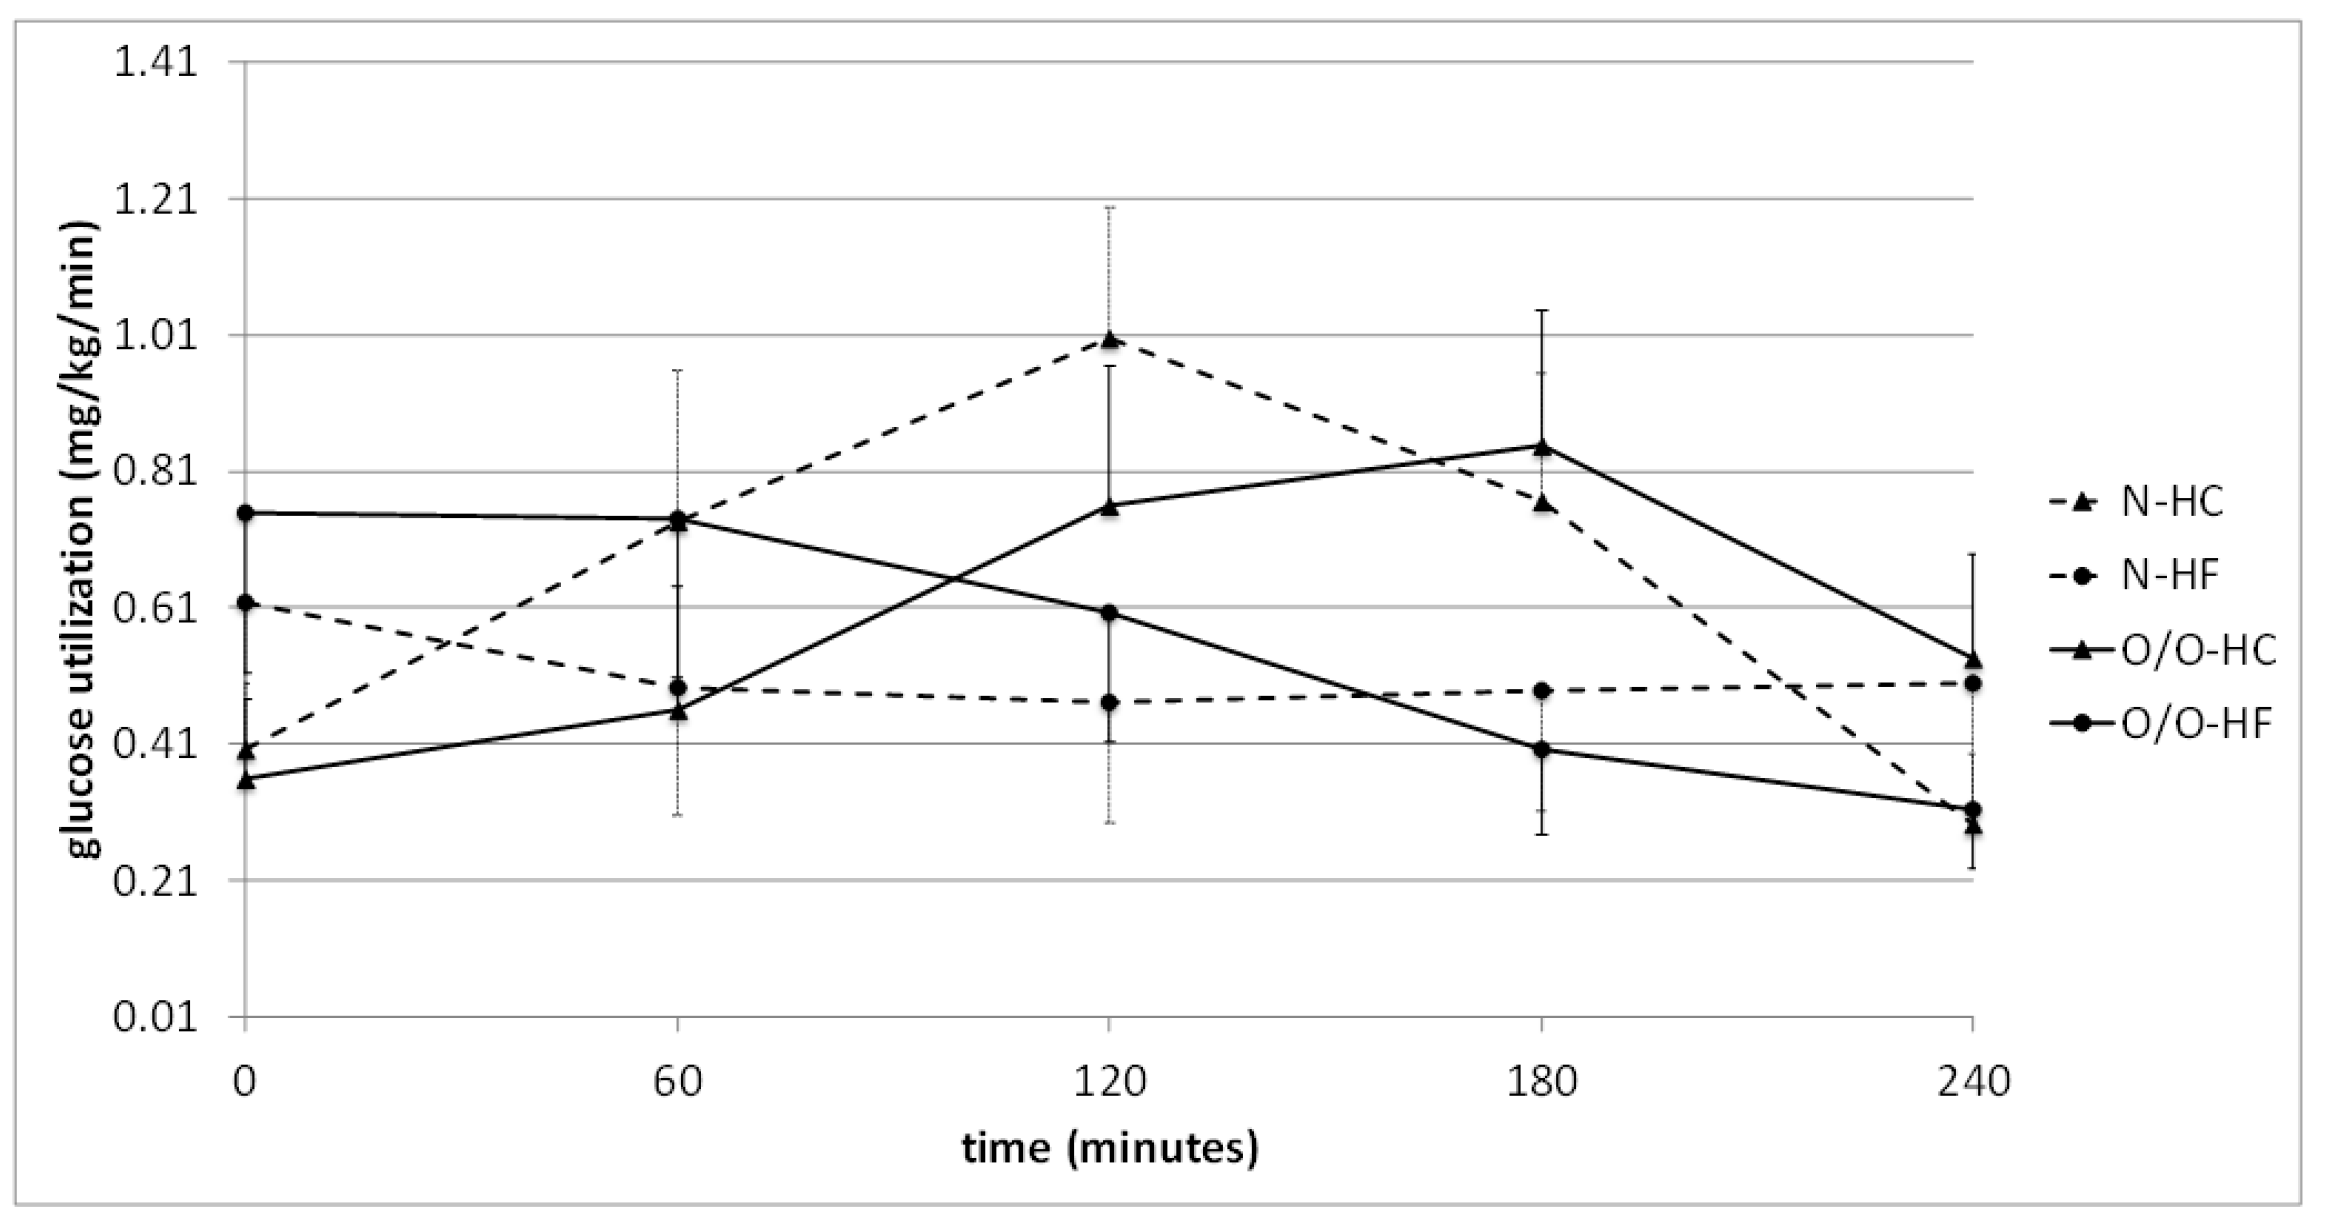
| G1 | Time (min) | 0 | 60 | 120 | 180 | 240 | The Area under the Curve |
| High-carbohydrate (HC) meal vs. normo- carbohydrate (NC) meal | N1-HC | 0.575 ± 0.126 | 1.420 ± 0.222 | 1.678 ± 0.189 | 1.670 ± 0.200 | 1.109 ± 0.245 | 344 ± 38 |
| N1-NC | 0.441 ± 0.085 | 1.205 ± 0.140 | 1.059 ± 0.135 | 0.793 ± 0.117 | 0.687 ± 0.103 | 249 ± 23 | |
| * p = | 0.15 | 0.32 | 0.01 | 0.0007 | 0.19 | 0.04 | |
| O/O1-HC | 0.645 ± 0.144 | 1.023 ± 0.174 | 1.140 ± 0.159 | 1.049 ± 0.169 | 0.950 ± 0.176 | 241 ± 33 | |
| O/O1-NC | 0.676 ± 0.169 | 0.968 ± 0.102 | 0.833 ± 0.103 | 0.632 ± 0.096 | 0.566 ± 0.096 | 255 ± 19 | |
| * p = | 0.85 | 0.80 | 0.08 | 0.05 | 0.06 | 0.67 | |
| G2 | Time (min) | 0 | 60 | 120 | 180 | 240 | The Area under the Curve |
| High-carbohydrate (HC) meal vs. high-fat (HF) meal | N2-HC | 0.404 ± 0.097 | 0.738 ± 0.222 | 1.007 ± 0.192 | 0.768 ± 0.188 | 0.295 ± 0.103 | 178 ± 38 |
| N2-HF | 0.619 ± 0.215 | 0.495 ± 0.187 | 0.473 ± 0.177 | 0.491 ± 0.177 | 0.501 ± 0.200 | 151 ± 55 | |
| ** p = | 0.31 | 0.50 | 0.07 | 0.33 | 0.57 | 0.84 | |
| O/O2-HC | 0.361 ± 0.117 | 0.461 ± 0.181 | 0.761 ± 0.205 | 0.850 ± 0.198 | 0.537 ± 0.154 | 151 ± 41 | |
| O/O2-HF | 0.752 ± 0.235 | 0.743 ± 0.234 | 0.605 ± 0.191 | 0.404 ± 0.126 | 0.315 ± 0.087 | 194 ± 39 | |
| ** p = | 0.12 | 0.40 | 0.50 | 0.09 | 0.27 | 0.57 |
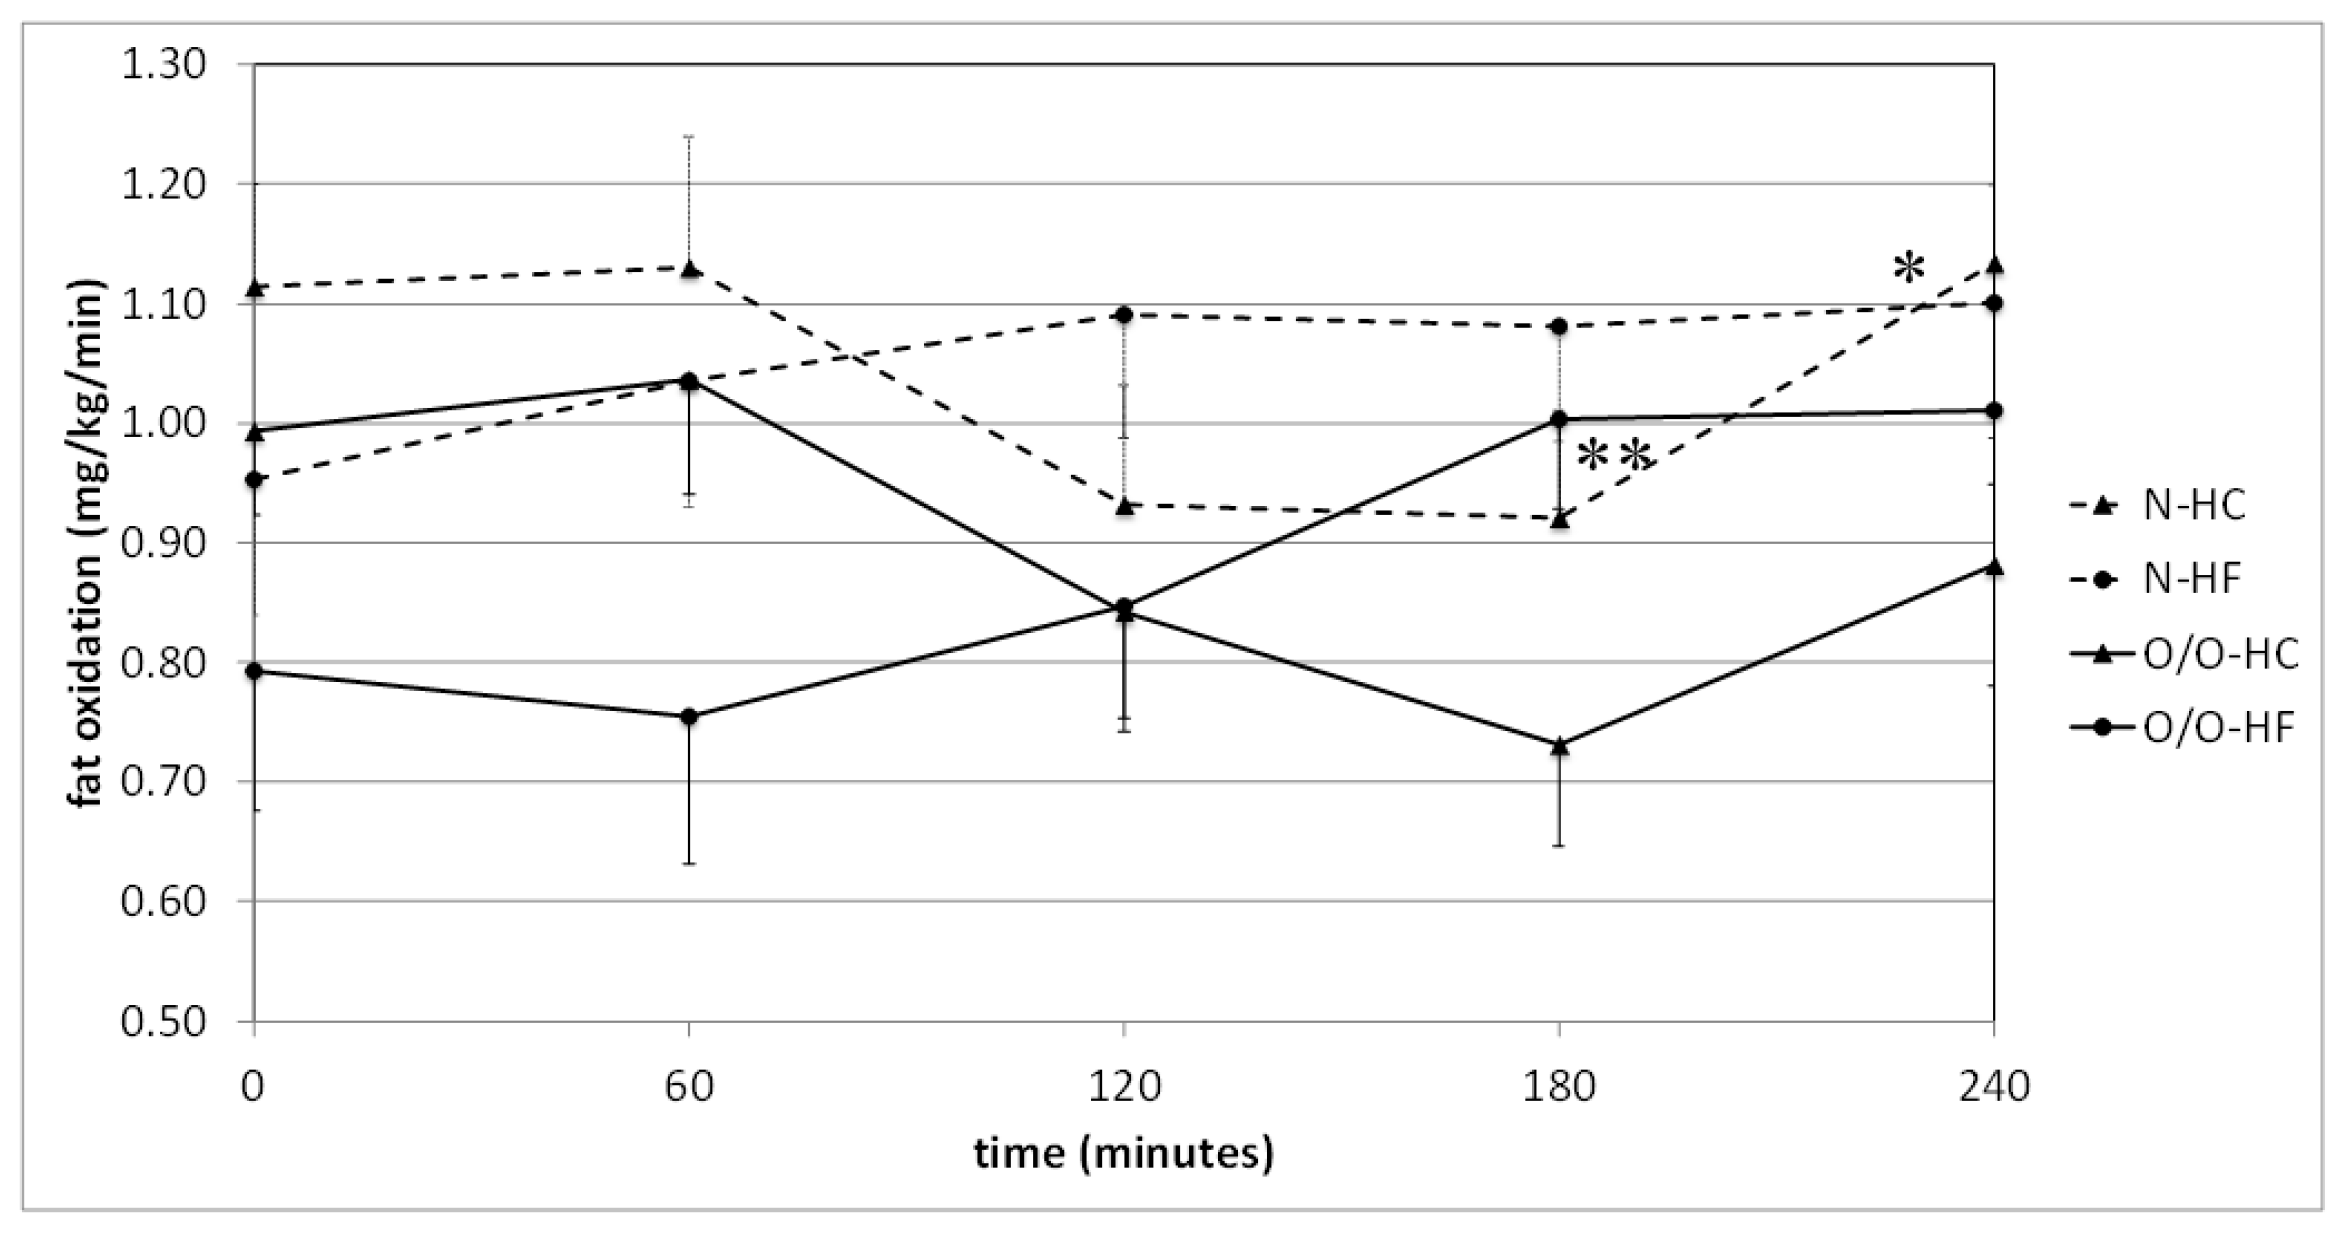
| G1 | Time (min) | 0 | 60 | 120 | 180 | 240 | The Area under the Curve |
| High-carbohydrate (HC) meal vs. normo- carbohydrate (NC) meal | N1-HC | 1.007 ± 0.061 | 0.839 ± 0.077 | 0.689 ± 0.081 | 0.656 ± 0.086 | 0.844 ± 0.133 | 185 ± 18 |
| N1-NC | 1.028 ± 0.047 | 0.936 ± 0.059 | 0.949 ± 0.062 | 0.969 ± 0.062 | 1.002 ± 0.078 | 234 ± 13 | |
| * p = | 0.60 | 0.28 | 0.009 | 0.003 | 0.12 | 0.03 | |
| O/O1-HC | 0.788 ± 0.074 | 0.749 ± 0.089 | 0.634 ± 0.074 | 0.598 ± 0.061 | 0.700 ± 0.080 | 167 ± 15 | |
| O/O1-NC | 0.784 ± 0.068 | 0.845 ± 0.054 | 0.791 ± 0.052 | 0.848 ± 0.048 | 0.854 ± 0.043 | 198 ± 8 | |
| * p = | 0.95 | 0.37 | 0.08 | 0.003 | 0.11 | 0.04 | |
| G2 | Time (min) | 0 | 60 | 120 | 180 | 240 | The Area under the Curve |
| High-carbohydrate (HC) meal vs. high-fat (HF) meal | N2-HC | 1.115 ± 0.086 | 1.330 ± 0.110 | 0.932 ± 0.099 | 0.921 ± 0.090 | 1.134 ± 0.065 | 247+22 |
| N2-HF | 0.953 ± 0.113 | 1.035 ± 0.106 | 1.090 ± 0.104 | 1.081 ± 0.096 | 1.100 ± 0.113 | 254 ± 25 | |
| ** p = | 0.32 | 0.46 | 0.27 | 0.20 | 0.77 | 0.96 | |
| O/O2-HC | 0.993 ± 0.070 | 1.036 ± 0.096 | 0.842 ± 0.089 | 0.731 ± 0.084 | 0.881 ± 0.101 | 214 ± 21 | |
| O/O2-HF | 0.792 ± 0.116 | 0.754 ± 0.123 | 0.847 ± 0.105 | 1.003 ± 0.075 | 1.010 ± 0.062 | 210 ± 18 | |
| ** p = | 0.16 | 0.13 | 0.83 | 0.02 | 0.02 | 0.95 |
© 2018 by the authors. Licensee MDPI, Basel, Switzerland. This article is an open access article distributed under the terms and conditions of the Creative Commons Attribution (CC BY) license (http://creativecommons.org/licenses/by/4.0/).
Share and Cite
Adamska-Patruno, E.; Ostrowska, L.; Golonko, A.; Pietraszewska, B.; Goscik, J.; Kretowski, A.; Gorska, M. Evaluation of Energy Expenditure and Oxidation of Energy Substrates in Adult Males after Intake of Meals with Varying Fat and Carbohydrate Content. Nutrients 2018, 10, 627. https://doi.org/10.3390/nu10050627
Adamska-Patruno E, Ostrowska L, Golonko A, Pietraszewska B, Goscik J, Kretowski A, Gorska M. Evaluation of Energy Expenditure and Oxidation of Energy Substrates in Adult Males after Intake of Meals with Varying Fat and Carbohydrate Content. Nutrients. 2018; 10(5):627. https://doi.org/10.3390/nu10050627
Chicago/Turabian StyleAdamska-Patruno, Edyta, Lucyna Ostrowska, Anna Golonko, Barbara Pietraszewska, Joanna Goscik, Adam Kretowski, and Maria Gorska. 2018. "Evaluation of Energy Expenditure and Oxidation of Energy Substrates in Adult Males after Intake of Meals with Varying Fat and Carbohydrate Content" Nutrients 10, no. 5: 627. https://doi.org/10.3390/nu10050627