Iodine Deficiency in a Study Population of Norwegian Pregnant Women—Results from the Little in Norway Study (LiN)

 ,
,
Abstract
1. Introduction
2. Materials and Methods
2.1. Study Population and Design
2.2. Data Collection and Categorization of Variables
2.3. Laboratory Analysis
2.4. Statistics
3. Results
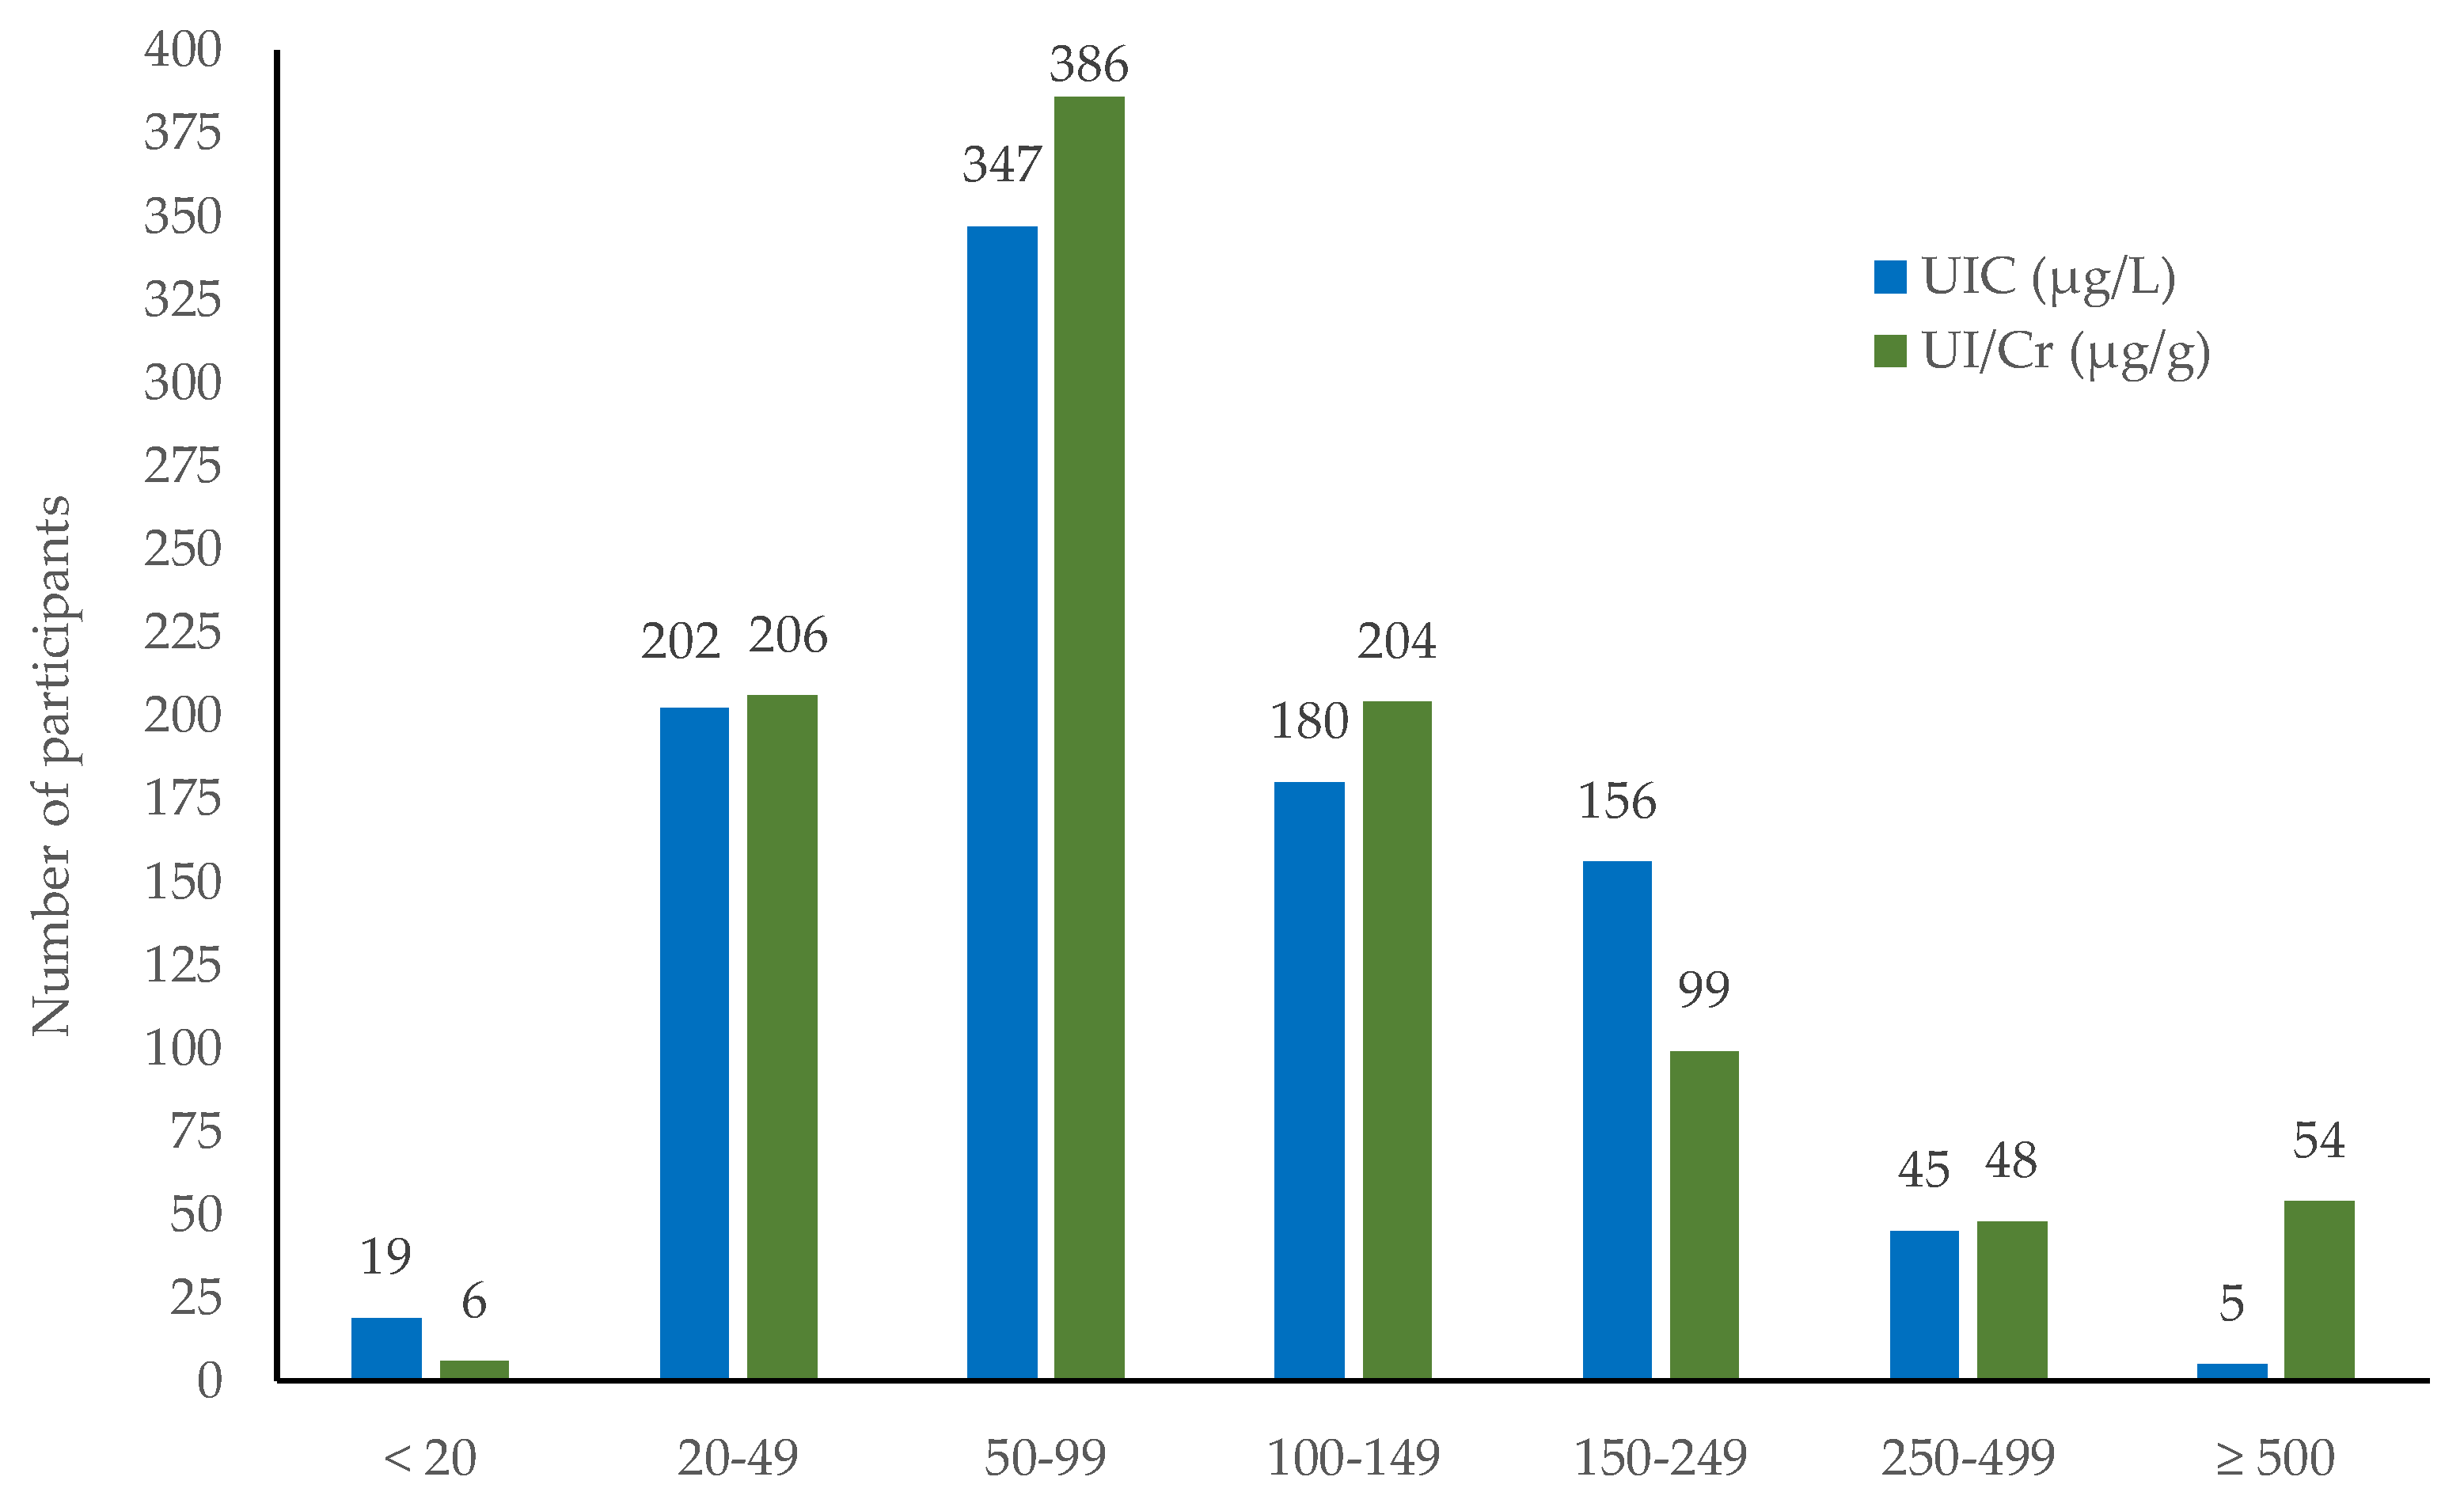
3.1. Urinary Iodine Distribution
3.2. Urinary Iodine Distribution in Relation to Maternal Characteristics
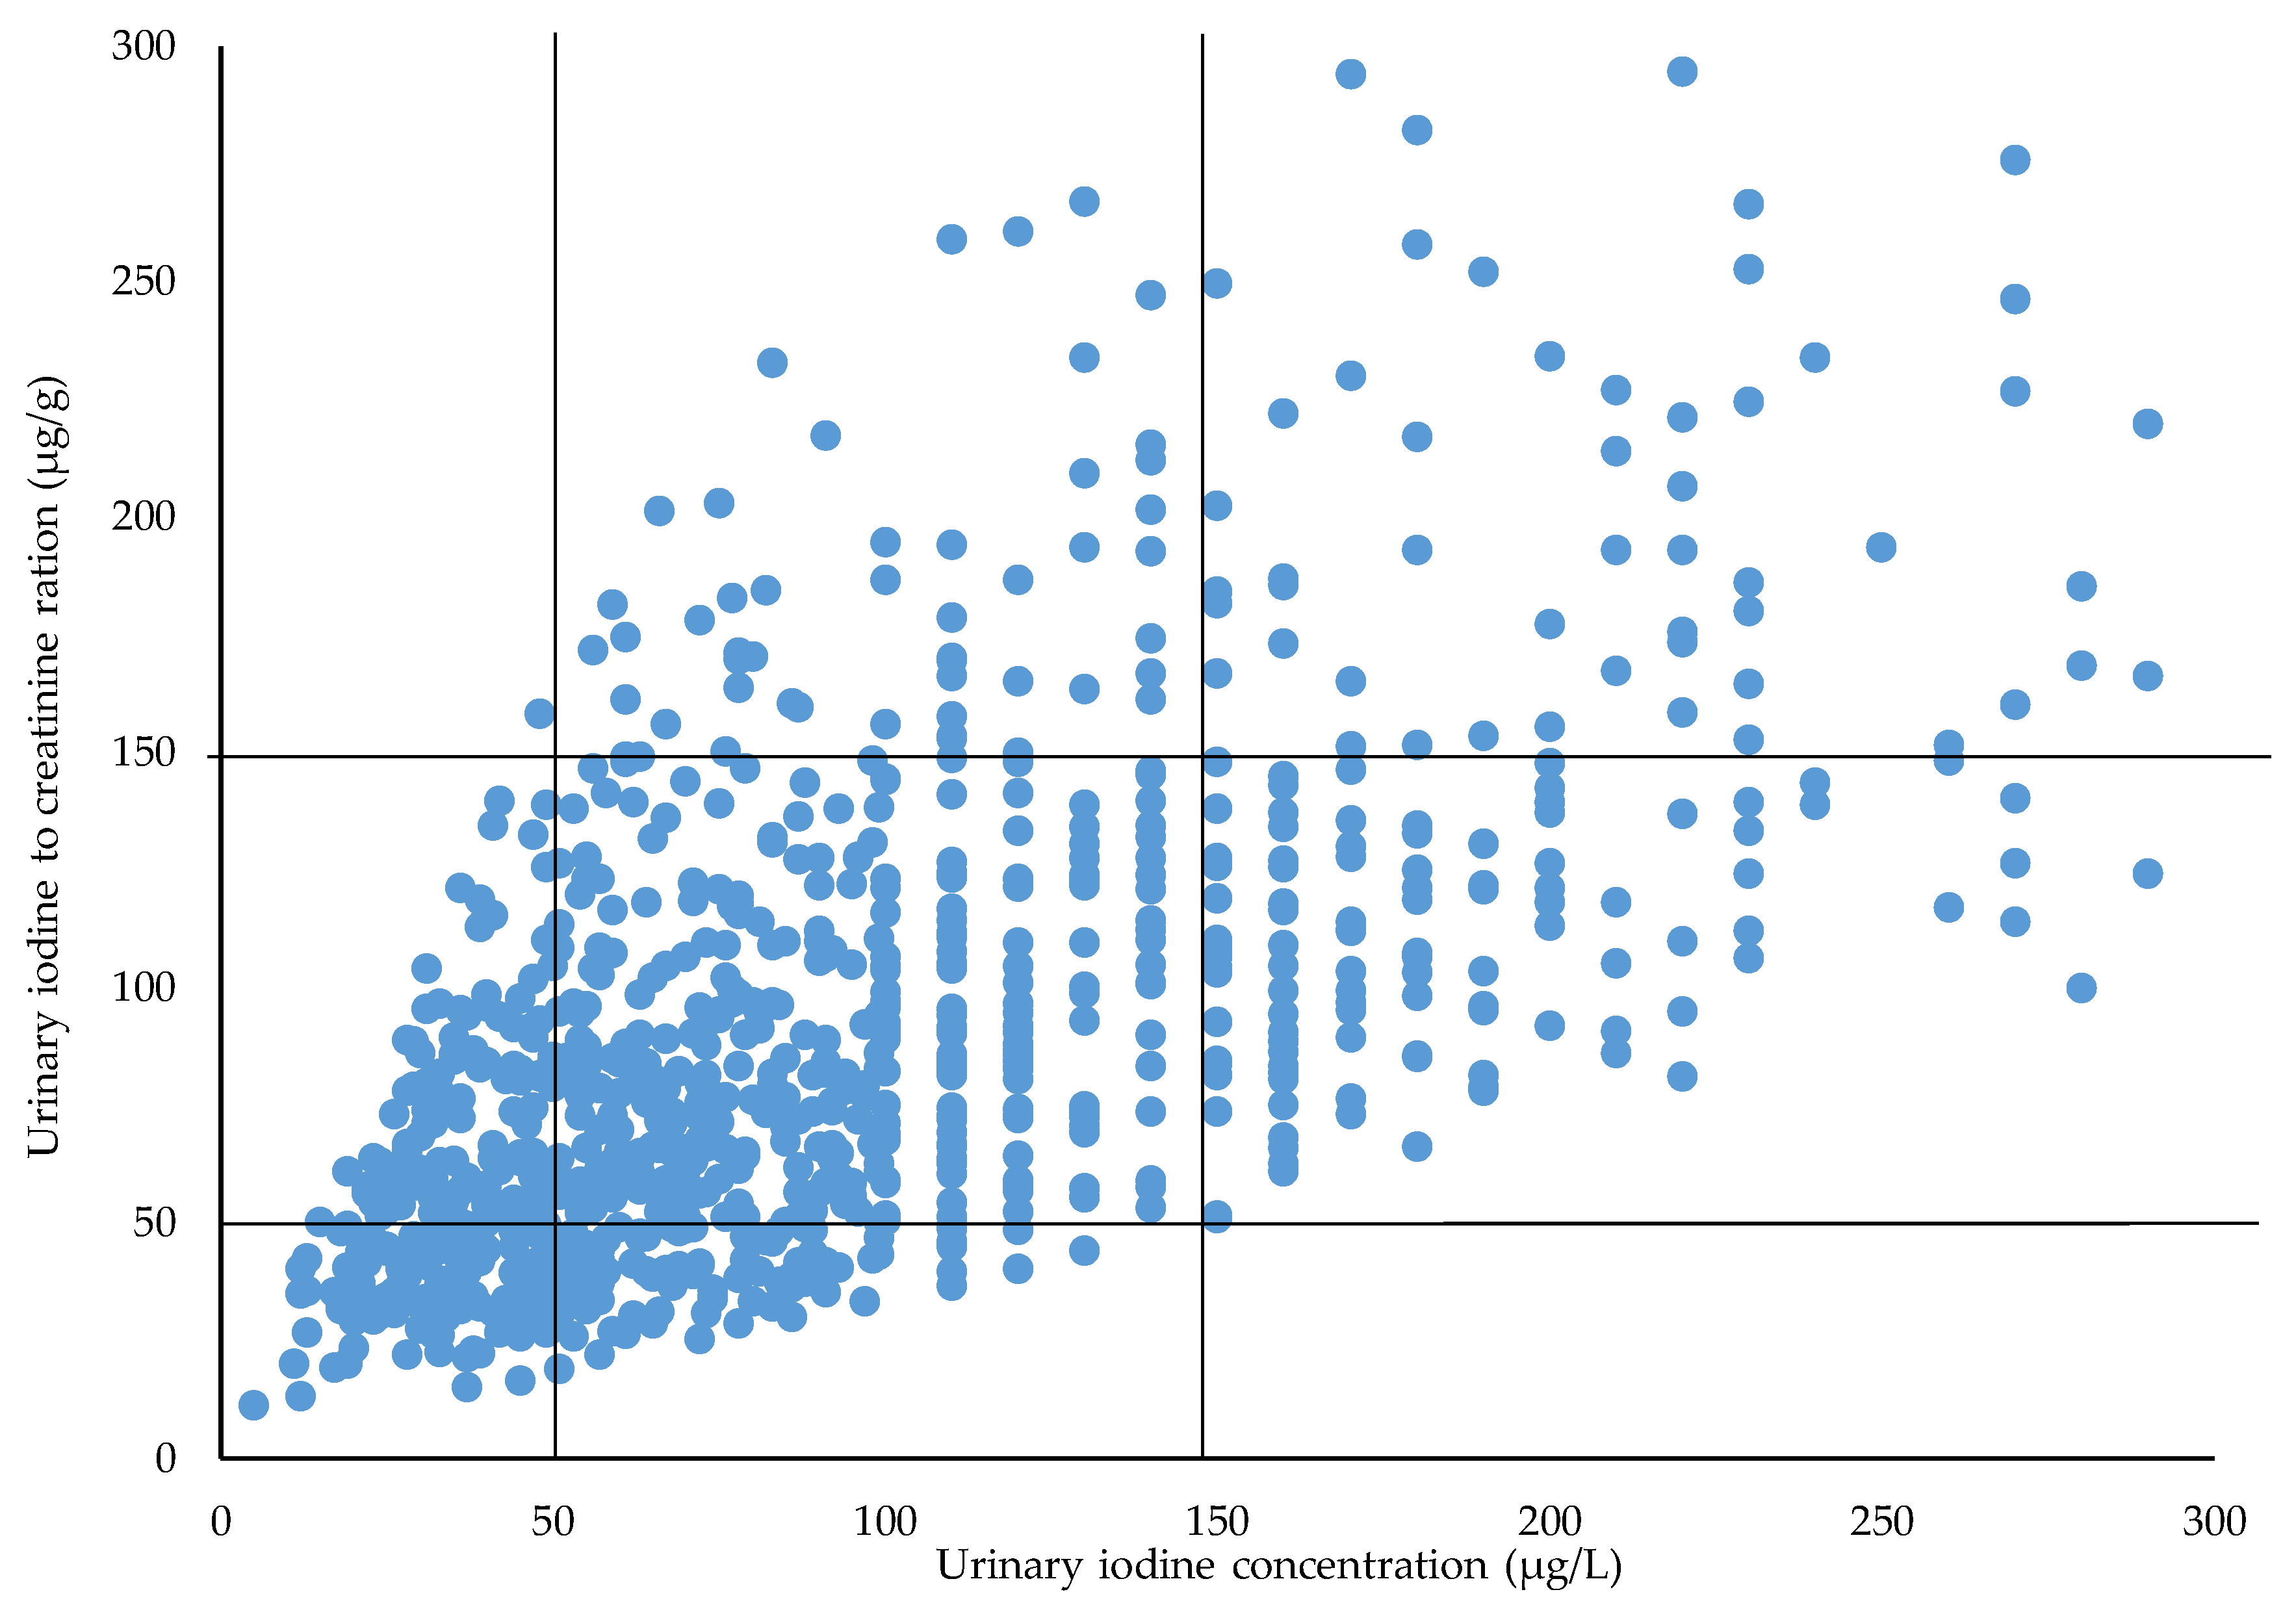
3.3. Assignments between UIC and UI/Cr Ratio
3.4. Association between Iodine Status and Maternal Characteristics
4. Discussion
5. Conclusions
Acknowledgments
Author Contributions
Conflicts of Interest
Abbreviations
| EAR | Estimated average requirement |
| LiN | Little in Norway study |
| MoBa | The Norwegian Mother and Child Cohort Study |
| MISA | Northern mother-and-child contaminant cohort |
| UIC | Urinary iodine concentration |
| UI/Cr | Urinary iodine-to-creatinine ratio |
| UIE | 24-h excretion of iodine |
| WHO | World Health Organization |
References
- Zimmermann, M.B.; Boelaert, K. Iodine deficiency and thyroid disorders. Lancet Diabetes Endocrinol. 2015, 3, 286–295. [Google Scholar] [CrossRef]
- Bath, S.C.; Steer, C.D.; Golding, J.; Emmett, P.; Rayman, M.P. Effect of inadequate iodine status in UK pregnant women on cognitive outcomes in their children: Results from the Avon Longitudinal Study of Parents and Children (ALSPAC). Lancet 2013, 382, 331–337. [Google Scholar] [CrossRef]
- Hynes, K.L.; Otahal, P.; Hay, I.; Burgess, J.R. Mild iodine deficiency during pregancy is associated with reduced educational outcomes in the offspring: 9-year follow-up of the gestational iodine cohort. J. Clin. Endocrinol. Metabol. 2013, 98, 1954–1962. [Google Scholar] [CrossRef] [PubMed]
- Hynes, K.L.; Otahal, P.; Burgess, J.R.; Oddy, W.H.; Hay, I. Reduced educational outcome persist into adolescence following mild iodine deficiency in utero, despite adequacy in childhood: 15-year follow-up of the gestational iodine cohort investigating auditory processing speed and working memory. Nutrients 2017, 9, 1354. [Google Scholar] [CrossRef] [PubMed]
- Nordic Council of Ministers. Nordic Nutrition Recommendations 2012. In Integrating Nutrition and Physical Activity, 5th ed.; Ministers, N., Ed.; Norden: Copenhagen, Denmark, 2012. [Google Scholar]
- Andersson, M.; de Benoist, B.; Delange, F.; Zupan, J. Prevention and control of iodine deficiency in pregnant and lactating women and in children less than 2-years-old: Conclusions and recommendations of the Technical Consultation. Public Health Nutr. 2007, 10, 1606–1611. [Google Scholar] [PubMed]
- Zimmermann, M.B.; Andersson, M. Assessment of iodine nutrition in populations: Past, present, and future. Nutr. Rev. 2012, 70, 553–570. [Google Scholar] [CrossRef] [PubMed]
- World Health Organization (WHO); International Council for the Control of Iodine Deficiency Disorders (ICCIDD); United Nations International Childrens Emergency Fund (UNICEF). Assessment of Iodine Deficiency Disorders and Monitoring Their Elimination. A Guide for Programme Managers, 3rd ed.; World Health Organization: Geneva, Swizerland, 2007. [Google Scholar]
- Andersen, S.L.; Sorensen, L.K.; Krejbjerg, A.; Moller, M.; Laurberg, P. Iodine deficiency in Danish pregnant women. Dan. Med. J. 2013, 60, A4657. [Google Scholar] [PubMed]
- Granfors, M.; Andersson, M.; Stinca, S.; Akerud, H.; Skalkidou, A.; Poromaa, I.S.; Wikstrom, A.K.; Nystrom, H.F. Iodine deficiency in a study population of pregnant women in Sweden. Acta Obstet. Gynecol. Scand. 2015, 94, 1168–1174. [Google Scholar] [CrossRef] [PubMed]
- Lindorfer, H.; Krebs, M.; Kautzky-Willer, A.; Bancher-Todesca, D.; Sager, M.; Gessl, A. Iodine deficiency in pregnant women in Austria. Eur. J. Clin. Nutr. 2015, 69, 349–354. [Google Scholar] [CrossRef] [PubMed]
- Zygmunt, A.; Adamczewski, Z.; Adamczewska, K.; Trofimiuk-Muldner, M.; Hubalewska-Dydejczyk, A.; Karbownik-Lewinska, M.; Lewinski, A. An assessment of the effectiveness of iodine prophylaxis in pregnant women–analysis in one of reference gynaecological-obstetric centres in Poland. Endokrynol. Pol. 2015, 66, 404–411. [Google Scholar] [CrossRef] [PubMed]
- Brantsaeter, A.L.; Abel, M.H.; Haugen, M.; Meltzer, H.M. Risk of suboptimal iodine intake in pregnant Norwegian women. Nutrients 2013, 5, 424–440. [Google Scholar] [CrossRef] [PubMed]
- Berg, V.; Nost, T.H.; Skeie, G.; Thomassen, Y.; Berlinger, B.; Veyhe, A.S.; Jorde, R.; Odland, J.O.; Hansen, S. Thyroid homeostasis in mother-child pairs in relation to maternal iodine status: The MISA study. Eur. J. Clin. Nutr. 2017, 71, 1002–1007. [Google Scholar] [CrossRef] [PubMed]
- Henjum, S.; Aakre, I.; Lilleengen, A.M.; Garnweidner-Holme, L.; Borthne, S.; Pajalic, Z.; Blix, E.; Gjengedal, E.L.F.; Brantsaeter, A.L. Suboptimal Iodine Status among Pregnant Women in the Oslo Area, Norway. Nutrients 2018, 10, 280. [Google Scholar] [CrossRef] [PubMed]
- Abel, M.H.; Caspersen, I.H.; Meltzer, H.M.; Haugen, M.; Brandlistuen, R.E.; Aase, H.; Alexander, J.; Torheim, L.E.; Brantsaeter, A.L. Suboptimal Maternal Iodine Intake Is Associated with Impaired Child Neurodevelopment at 3 Years of Age in the Norwegian Mother and Child Cohort Study. J. Nutr. 2017, 147, 1314–1324. [Google Scholar] [CrossRef] [PubMed]
- Ainy, E.; Ordookhani, A.; Hedayati, M.; Azizi, F. Assessment of intertrimester and seasonal variations of urinary iodine concentration during pregnancy in an iodine-replete area. Clin. Endocrinol. 2007, 67, 577–581. [Google Scholar] [CrossRef] [PubMed]
- Andersen, S.L.; Sorensen, L.K.; Krejbjerg, A.; Moller, M.; Laurberg, P. Challenges in the evaluation of urinary iodine status in pregnancy: The importance of iodine supplement intake and time of sampling. Eur. Thyroid J. 2014, 3, 179–188. [Google Scholar] [CrossRef] [PubMed]
- Bath, S.C.; Furmidge-Owen, V.L.; Redman, C.W.; Rayman, M.P. Gestational changes in iodine status in a cohort study of pregnant women from the United Kingdom: Season as an effect modifier. Am. J. Clin. Nutr. 2015, 101, 1180–1187. [Google Scholar] [CrossRef] [PubMed]
- Stilwell, G.; Reynolds, P.J.; Parameswaran, V.; Blizzard, L.; Greenaway, T.M.; Burgess, J.R. The influence of gestational stage on urinary iodine excretion in pregnancy. J. Clin. Endocrinol. Metab. 2008, 93, 1737–1742. [Google Scholar] [CrossRef] [PubMed]
- Dahl, L.; Maeland, C.A.; Bjorkkjaer, T. A short food frequency questionnaire to assess intake of seafood and n-3 supplements: Validation with biomarkers. Nutr. J. 2011, 10, 127. [Google Scholar] [CrossRef] [PubMed]
- Markhus, M.W.; Graff, I.E.; Dahl, L.; Seldal, C.F.; Skotheim, S.; Braarud, H.C.; Stormark, K.M.; Malde, M.K. Establishment of a seafood index to assess the seafood consumption in pregnant women. Food Nutr. Res. 2013, 57, 19272. [Google Scholar] [CrossRef] [PubMed]
- Barr, D.B.; Wilder, L.C.; Caudill, S.P.; Gonzalez, A.J.; Needham, L.L.; Pirkle, J.L. Urinary creatinine concentrations in the U.S. population: Implications for urinary biologic monitoring measurements. Environ. Health Perspect. 2005, 113, 192–200. [Google Scholar] [CrossRef] [PubMed]
- Knudsen, N.; Christiansen, E.; Brandt-Christensen, M.; Nygaard, B.; Perrild, H. Age- and sex-adjusted iodine/creatinine ratio. A new standard in epidemiological surveys? Evaluation of three different estimates of iodine excretion based on casual urine samples and comparison to 24 h values. Eur. J. Clin. Nutr. 2000, 54, 361–363. [Google Scholar] [CrossRef] [PubMed]
- Moreno-Reyes, R.; Glinoer, D.; Van Oyen, H.; Vandevijvere, S. High prevalence of thyroid disorders in pregnant women in a mildly iodine-deficient country: A population-based study. J. Clin. Endocrinol. Metab. 2013, 98, 3694–3701. [Google Scholar] [CrossRef] [PubMed]
- Konrade, I.; Kalere, I.; Strele, I.; Makrecka-Kuka, M.; Jekabsone, A.; Tetere, E.; Veisa, V.; Gavars, D.; Rezeberga, D.; Pirags, V.; et al. Iodine deficiency during pregnancy: A national cross-sectional survey in Latvia. Public Health Nutr. 2015, 18, 2990–2997. [Google Scholar] [CrossRef] [PubMed]
- Limbert, E.; Prazeres, S.; Sao Pedro, M.; Madureira, D.; Miranda, A.; Ribeiro, M.; Jacome de Castro, J.; Carrilho, F.; Oliveira, M.J.; Reguengo, H.; et al. Iodine intake in Portugese pregnant women: Results of a countrywide study. Eur. J. Endocrinol. 2010, 163, 631–635. [Google Scholar] [CrossRef] [PubMed]
- Aguayo, A.; Grau, G.; Vela, A.; Aniel-Quiroga, A.; Espada, M.; Martul, P.; Castano, L.; Rica, I. Urinary iodine and thyroid function in a population of healthy pregnant women in the North of Spain. J. Trace Elem. Med. Biol. 2013, 27, 302–306. [Google Scholar] [CrossRef] [PubMed]
- Gunnarsdottir, I.; Gunnarsdottir, B.E.; Steingrimsdottir, L.; Maage, A.; Johannesson, A.J.; Thorsdottir, I. Iodine status of adolescent girls in a population changing from high to lower fish consumption. Eur. J. Clin. Nutr. 2010, 64, 958–964. [Google Scholar] [CrossRef] [PubMed]
- Ghassabian, A.; Steenweg-de Graaff, J.; Peeters, R.P.; Ross, H.A.; Jaddoe, V.W.; Hofman, A.; Verhulst, F.C.; White, T.; Tiemeier, H. Maternal urinary iodine concentration in pregnancy and children’s cognition: Results from a population-based birth cohort in an iodine-sufficient area. BMJ Open 2014, 4, e005520. [Google Scholar] [CrossRef] [PubMed]
- Frey, H.; Tangen, T.; Lovik, J.; Thorsen, R.K.; Sand, T.; Rosenlund, B.; Kornstad, L. Endemic goiter no longer exists in the community of Modum. Tidsskr. Nor. Laegeforen. 1981, 101, 1184–1186. [Google Scholar] [PubMed]
- Dahl, L.; Johansson, L.; Julshamn, K.; Meltzer, H.M. The iodine content of Norwegian foods and diets. Public Health Nutr. 2004, 7, 569–576. [Google Scholar] [CrossRef] [PubMed]
- Dahl, L.; Opsahl, J.A.; Meltzer, H.M.; Julshamn, K. Iodine concentration in Norwegian milk and dairy products. Br. J. Nutr. 2003, 90, 679–685. [Google Scholar] [CrossRef] [PubMed]
- Troan, G.; Dahl, L.; Meltzer, H.M.; Abel, M.H.; Indahl, U.G.; Haug, A.; Prestlokken, E. A model to secure a stable iodine concentration in milk. Food Nutr. Res. 2015, 59, 29829. [Google Scholar] [CrossRef] [PubMed]
- Nerhus, I.; Markhus, M.; Nilsen, B.; Øyen, J.; Maage, A.; Ødegård, E.; Midtbø, L.; Frantzen, S.; Köge, l.T.; Graff, I.; et al. Iodine content of six fish species, Norwegian dairy products and hen’s eggs. Food Nutr. Res. 2018, in press. [Google Scholar]
- Andersen, S.; Karmisholt, J.; Pedersen, K.M.; Laurberg, P. Reliability of studies of iodine intake and recommendations for number of samples in groups and in individuals. Br. J. Nutr. 2008, 99, 813–818. [Google Scholar] [CrossRef] [PubMed]
- Li, C.; Peng, S.; Zhang, X.; Xie, X.; Wang, D.; Mao, J.; Teng, X.; Shan, Z.; Teng, W. The Urine Iodine to Creatinine as an Optimal Index of Iodine during Pregnancy in an Iodine Adequate Area in China. J. Clin. Endocrinol. Metab. 2016, 101, 1290–1298. [Google Scholar] [CrossRef] [PubMed]
- Mian, C.; Vitaliano, P.; Pozza, D.; Barollo, S.; Pitton, M.; Callegari, G.; Di Gianantonio, E.; Casaro, A.; Nacamulli, D.; Busnardo, B.; et al. Iodine status in pregnancy: Role of dietary habits and geographical origin. Clin. Endocrinol. 2009, 70, 776–780. [Google Scholar] [CrossRef] [PubMed]
- Brander, L.; Als, C.; Buess, H.; Haldimann, F.; Harder, M.; Hanggi, W.; Herrmann, U.; Lauber, K.; Niederer, U.; Zurcher, T.; et al. Urinary iodine concentration during pregnancy in an area of unstable dietary iodine intake in Switzerland. J. Endocrinol. Investig. 2003, 26, 389–396. [Google Scholar] [CrossRef] [PubMed][Green Version]
- Vejbjerg, P.; Knudsen, N.; Perrild, H.; Laurberg, P.; Andersen, S.; Rasmussen, L.B.; Ovesen, L.; Jorgensen, T. Estimation of iodine intake from various urinary iodine measurements in population studies. Thyroid 2009, 19, 1281–1286. [Google Scholar] [CrossRef] [PubMed]
- Garnweidner-Holme, L.; Aakre, I.; Lilleengen, A.M.; Brantsaeter, A.L.; Henjum, S. Knowlegde about iodine in pregnant and lactating women in the Oslo area, Norway. Nutrients 2017, 9, 493. [Google Scholar] [CrossRef] [PubMed]
- De Leo, S.; Pearce, E.; Braverman, L.E. Iodine supplementation in women during preconception, pregnancy, and lactating: Current clinical practice by US obstetricians and midwives. Thyroid 2017, 27, 434–439. [Google Scholar] [CrossRef] [PubMed]
- Govnerment (Ministry of Health and Care Services). National Actionplan for a Better Diet (2017–2021); Ministry of Health and Care Services: Oslo, Norway, 2017.


| n | UIC (µg/L) | p-Value * | UI/Cr Ratio (µg/g) | p-Value * | |
|---|---|---|---|---|---|
| Maternal age, years | 937 | 0.429 | 0.100 | ||
| <25 | 114 | 80 (53–143) | 71 (46–124) | ||
| 25–29 | 348 | 85 (50–130) | 79 (49–122) | ||
| 30–34 | 305 | 83 (54–120) | 86 (59–121) | ||
| ≥35 | 170 | 88 (51–160) | 86 (54–139) | ||
| Smoking (daily) while pregnant | 954 | 0.128 | 0.019 | ||
| No | 882 | 85 (57–140) | 83 (54–125) | ||
| Yes | 72 | 70 (44–120) | 64 (45–107) | ||
| Parity | 954 | 0.846 | 0.034 | ||
| 0 | 547 | 78 (44–130) | 90 a (55–138) | ||
| 1 | 337 | 82 (52–135) | 80 a,b (52–119) | ||
| ≥2 | 120 | 80 (43–130) | 75 b (45–118) | ||
| Educational level | 954 | 0.217 | <0.0001 | ||
| Primary 1/high school | 231 | 78 (48–130) | 73 a (45–121) | ||
| College/University < 4 year | 360 | 85 (47–140) | 82 a,b (53–123) | ||
| College/University ≥ 4 year | 413 | 78 (47–130) | 90 b (59–134) | ||
| Cohabitation | 954 | 0.632 | 0.844 | ||
| Living with partner | 912 | 79 (47–130) | 83 (53–127) | ||
| Not living with partner | 42 | 85 (47–130) | 83 (50–139) | ||
| Ethnicity | 954 | 0.126 | 0.229 | ||
| Norwegian | 945 | 78 (47–130) | 82 (53–127) | ||
| Other than Norwegian | 59 | 92 (56–140) | 90 (59–121) | ||
| Income (mother) | 954 | 0.331 | 0.007 | ||
| <300,000 NOK | 320 | 78 (45–130) | 82 a (50–124) | ||
| 300,000–449,000 NOK | 453 | 80 (47–130) | 80 a (51–126) | ||
| ≥450,000 NOK | 231 | 79 (50–140) | 94 b (60–138) |
| n | UIC (µg/L) | p-Value * | UI/Cr Ratio (µg/g) | p-Value * | |
|---|---|---|---|---|---|
| Trimester | 924 | 0.052 | 0.003 | ||
| First (0–13 week) | 10 | 66 (41–155) | 87 a (44–105) | ||
| Second (14–27 week) | 674 | 83 (50–130) | 79 a (50–119) | ||
| Third (28–44 week) | 240 | 92 (57–150) | 94 b (60–145) | 0.001 | |
| Residence in Norway | 954 | <0.0001 | <0.0001 | ||
| North | 144 | 82 b (49–128) | 83 a (52–113) | ||
| Mid | 255 | 72 a (44–110) | 66 a (47–107) | ||
| West | 217 | 83 b (53–130) | 75 a (48–112) | ||
| East | 338 | 100 b (61–150) | 98 b (64–147) | ||
| Time of urine sampling | 949 | 0.283 | <0.0001 | ||
| Morning (06 a.m.–10 a.m.) | 262 | 79 (50–120) | 72 a (47–105) | ||
| Noon (10 a.m.–02 p.m.) | 305 | 87 (54–140) | 81 a,c (50–117) | ||
| Afternoon (02 p.m.–07 p.m.) | 299 | 90 (54–140) | 95 b (59–142) | ||
| Evening/night (07 p.m.–06 a.m.) | 35 | 90 (40–150) | 107 b (58–148) | ||
| Season of urine sampling | 899 | 0.006 | 0.006 | ||
| Winter (Dec.–Feb.) | 264 | 91 a (51–140) | 93 a (58–132) | ||
| Spring (Mar.–May.) | 239 | 90 a (55–140) | 86 a,b (53–126) | ||
| Summer (Jun.–Aug.) | 132 | 85 a,b (50–130) | 76 b (44–120) | ||
| Autumn (Sep.–Nov.) | 264 | 73 b (46–120) | 74 b (52–114) |
| n | UIC (µg/L) | p-Value * | UI/Cr Ratio (µg/g) | p-Value * | |
|---|---|---|---|---|---|
| Dietary factors | |||||
| Seafood dinner | 934 | 0.539 | 0.103 | ||
| <2 portions/week | 653 | 78 (48–130) | 82 (51–126) | ||
| ≥2 portions/week | 281 | 80 (47–125) | 88 (57–129) | ||
| Egg | 821 | 0.430 | 0.156 | ||
| <3 eggs/week | 701 | 80 (49–130) | 82 (53–127) | ||
| ≥3 eggs/week | 120 | 78 (36–140) | 92 (55–145) | ||
| Dairy products | 806 | <0.0001 | <000.1 | ||
| 0–1 portion/day | 153 | 57 a (39–110) | 64 a (45–110) | ||
| 2–3 portion/day | 524 | 83 b (48–130) | 83 b (55–130) | ||
| 4–9 portions/day | 128 | 99 b (59–168) | 105 c (77–150) | ||
| Iodine supplement use | 948 | <0.0001 | <0.0001 | ||
| Yes (≥5 times/week) | 144 | 120 a (72–208) | 140 a (84–233) | ||
| No (<5 times/week) | 804 | 75 b (44–120) | 78 b (51–116) |
| Variable | B | SEB | β |
|---|---|---|---|
| Intercept | 43.963 | 12.961 | |
| Supplement user | 61.839 | 7.601 | 0.287 * |
| Dairy product intake | 16.124 | 4.909 | 0.116 * |
| Residence | 7.230 | 2.715 | 0.94 * |
| Variable | B | SEB | β |
|---|---|---|---|
| Intercept | −28.988 | 19.443 | |
| Supplement user | 87.751 | 7.955 | 0.381 * |
| Dairy product intake | 19.38 | 5.149 | 0.131 * |
| Time of urine sampling | 15.633 | 3.461 | 0.157 * |
| Trimester | 21.283 | 6.82 | 0.108 * |
© 2018 by the authors. Licensee MDPI, Basel, Switzerland. This article is an open access article distributed under the terms and conditions of the Creative Commons Attribution (CC BY) license (http://creativecommons.org/licenses/by/4.0/).
Share and Cite
Dahl, L.; Wik Markhus, M.; Sanchez, P.V.R.; Moe, V.; Smith, L.; Meltzer, H.M.; Kjellevold, M. Iodine Deficiency in a Study Population of Norwegian Pregnant Women—Results from the Little in Norway Study (LiN). Nutrients 2018, 10, 513. https://doi.org/10.3390/nu10040513
Dahl L, Wik Markhus M, Sanchez PVR, Moe V, Smith L, Meltzer HM, Kjellevold M. Iodine Deficiency in a Study Population of Norwegian Pregnant Women—Results from the Little in Norway Study (LiN). Nutrients. 2018; 10(4):513. https://doi.org/10.3390/nu10040513
Chicago/Turabian StyleDahl, Lisbeth, Maria Wik Markhus, Perla Vanessa Roldan Sanchez, Vibeke Moe, Lars Smith, Helle Margrete Meltzer, and Marian Kjellevold. 2018. "Iodine Deficiency in a Study Population of Norwegian Pregnant Women—Results from the Little in Norway Study (LiN)" Nutrients 10, no. 4: 513. https://doi.org/10.3390/nu10040513
APA StyleDahl, L., Wik Markhus, M., Sanchez, P. V. R., Moe, V., Smith, L., Meltzer, H. M., & Kjellevold, M. (2018). Iodine Deficiency in a Study Population of Norwegian Pregnant Women—Results from the Little in Norway Study (LiN). Nutrients, 10(4), 513. https://doi.org/10.3390/nu10040513