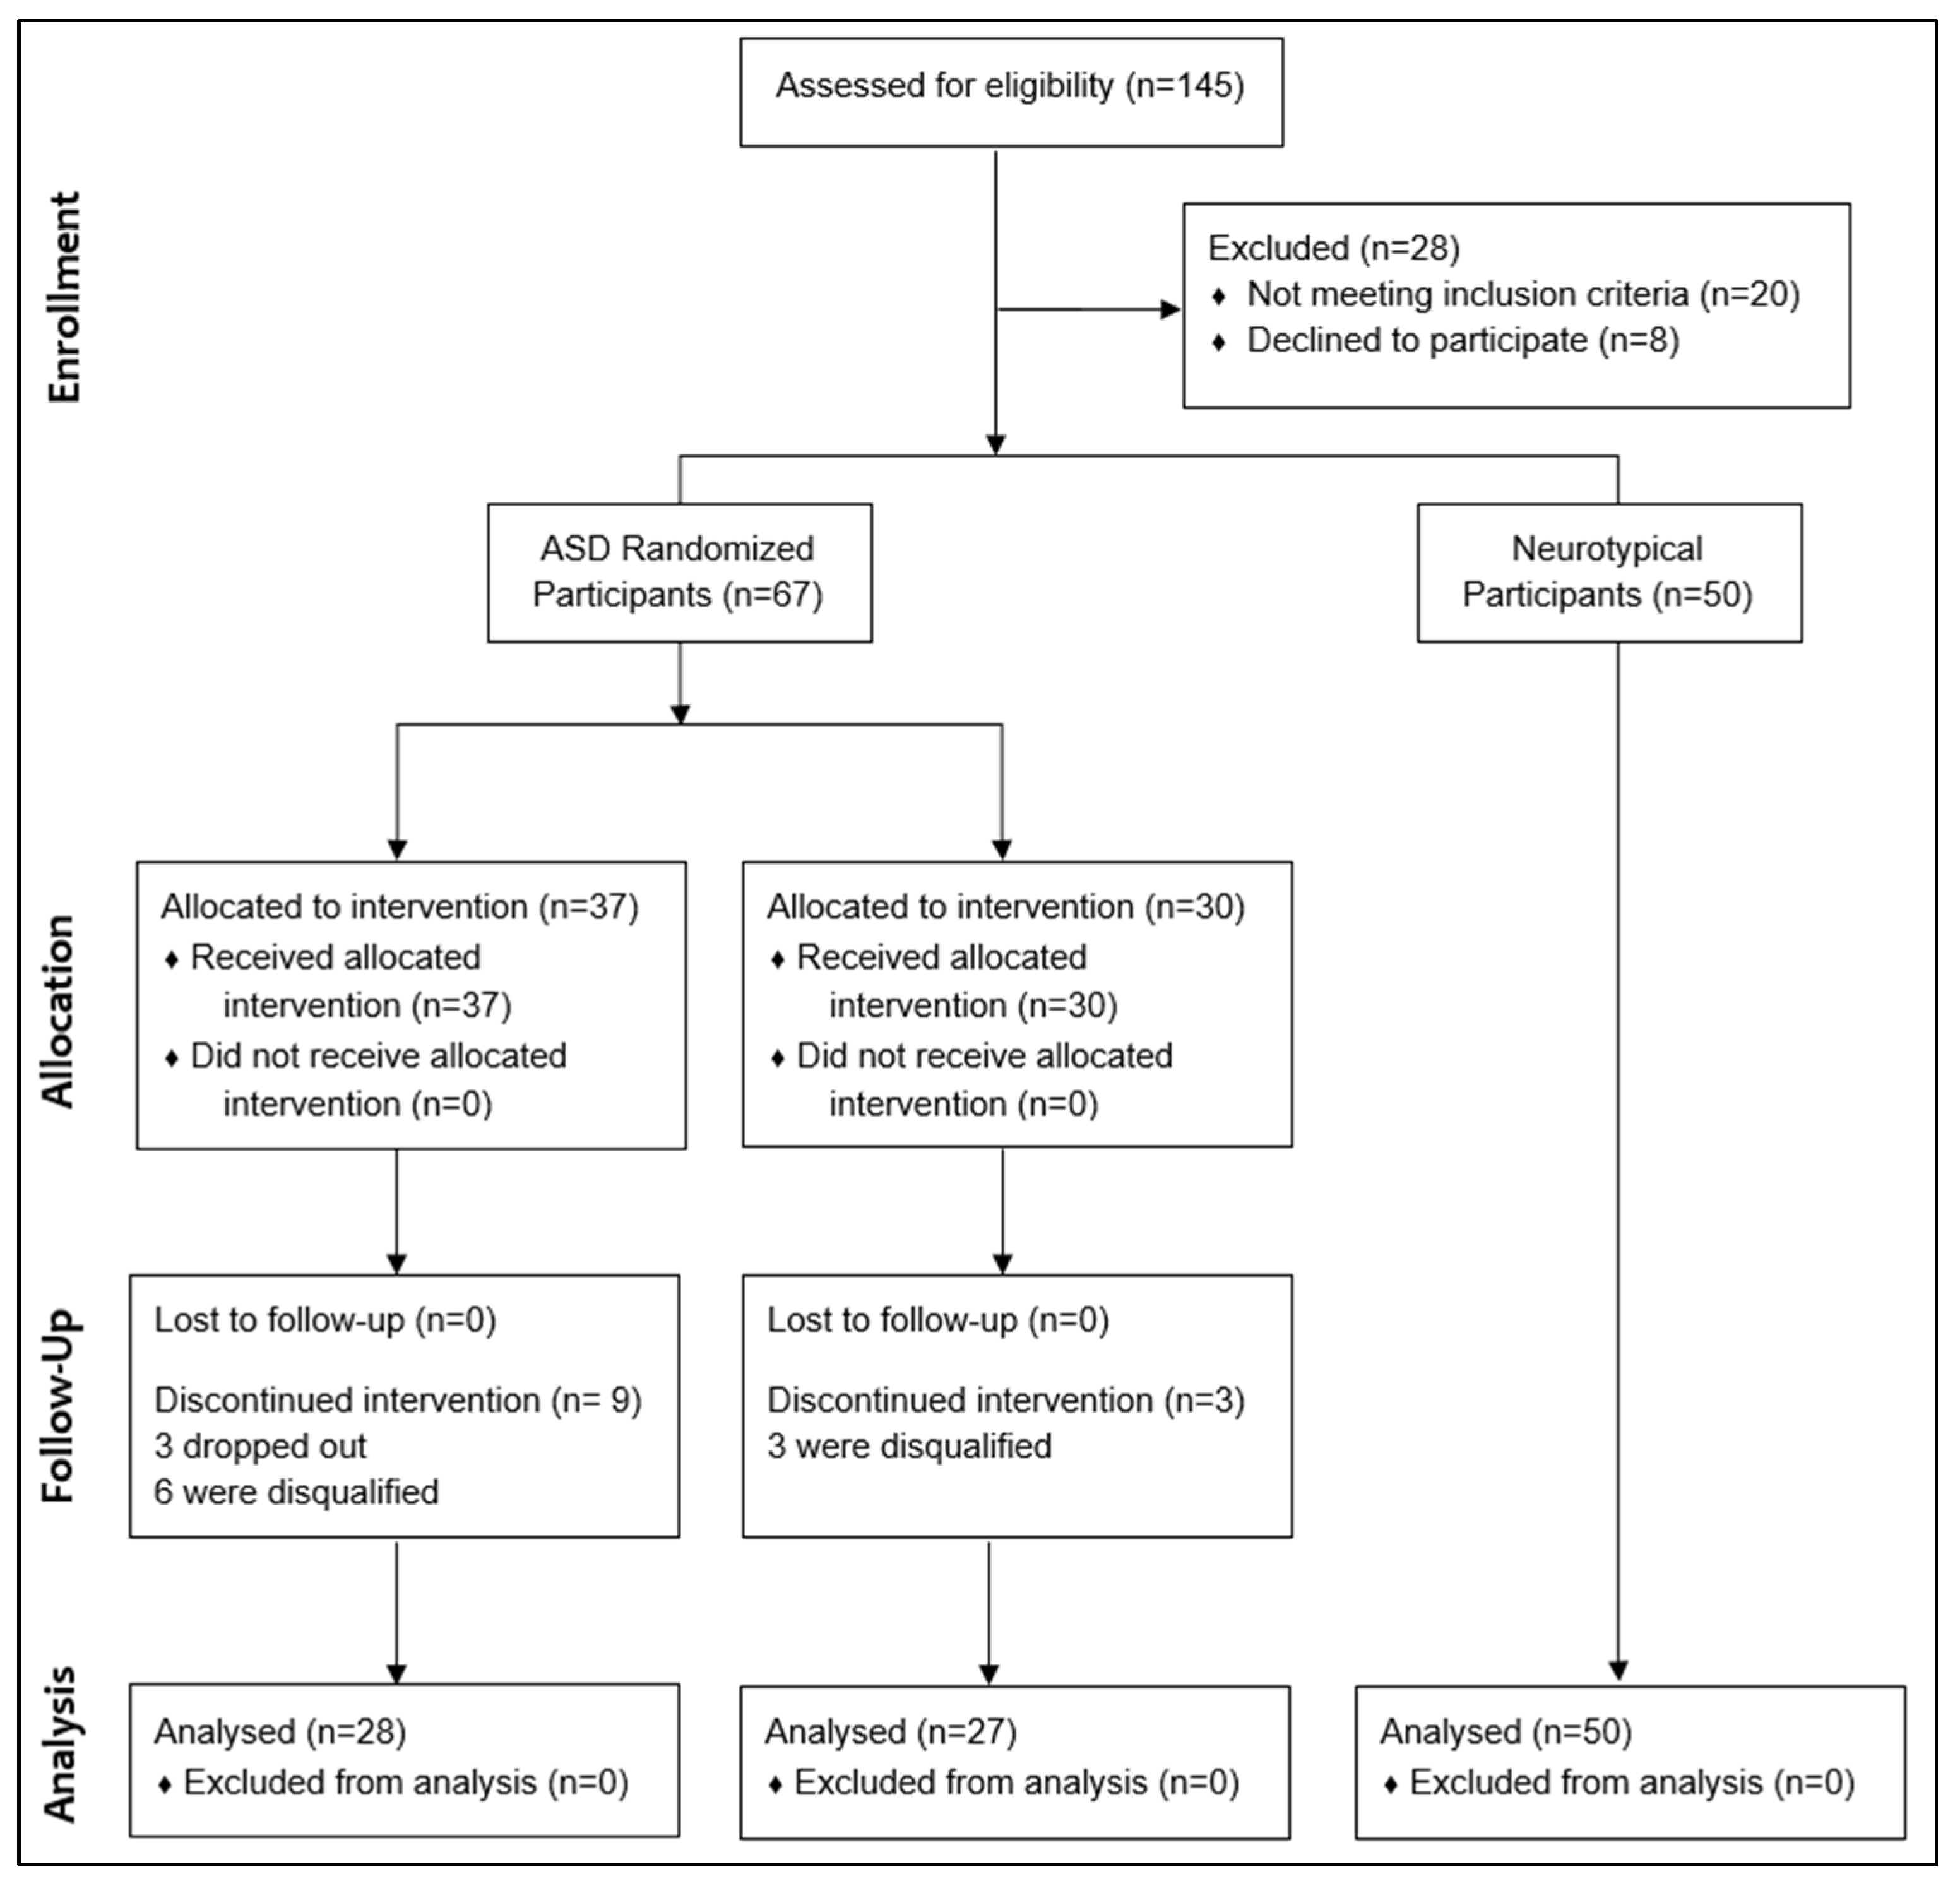
Figure 1.
Study Flowchart.
Figure 1.
Study Flowchart.
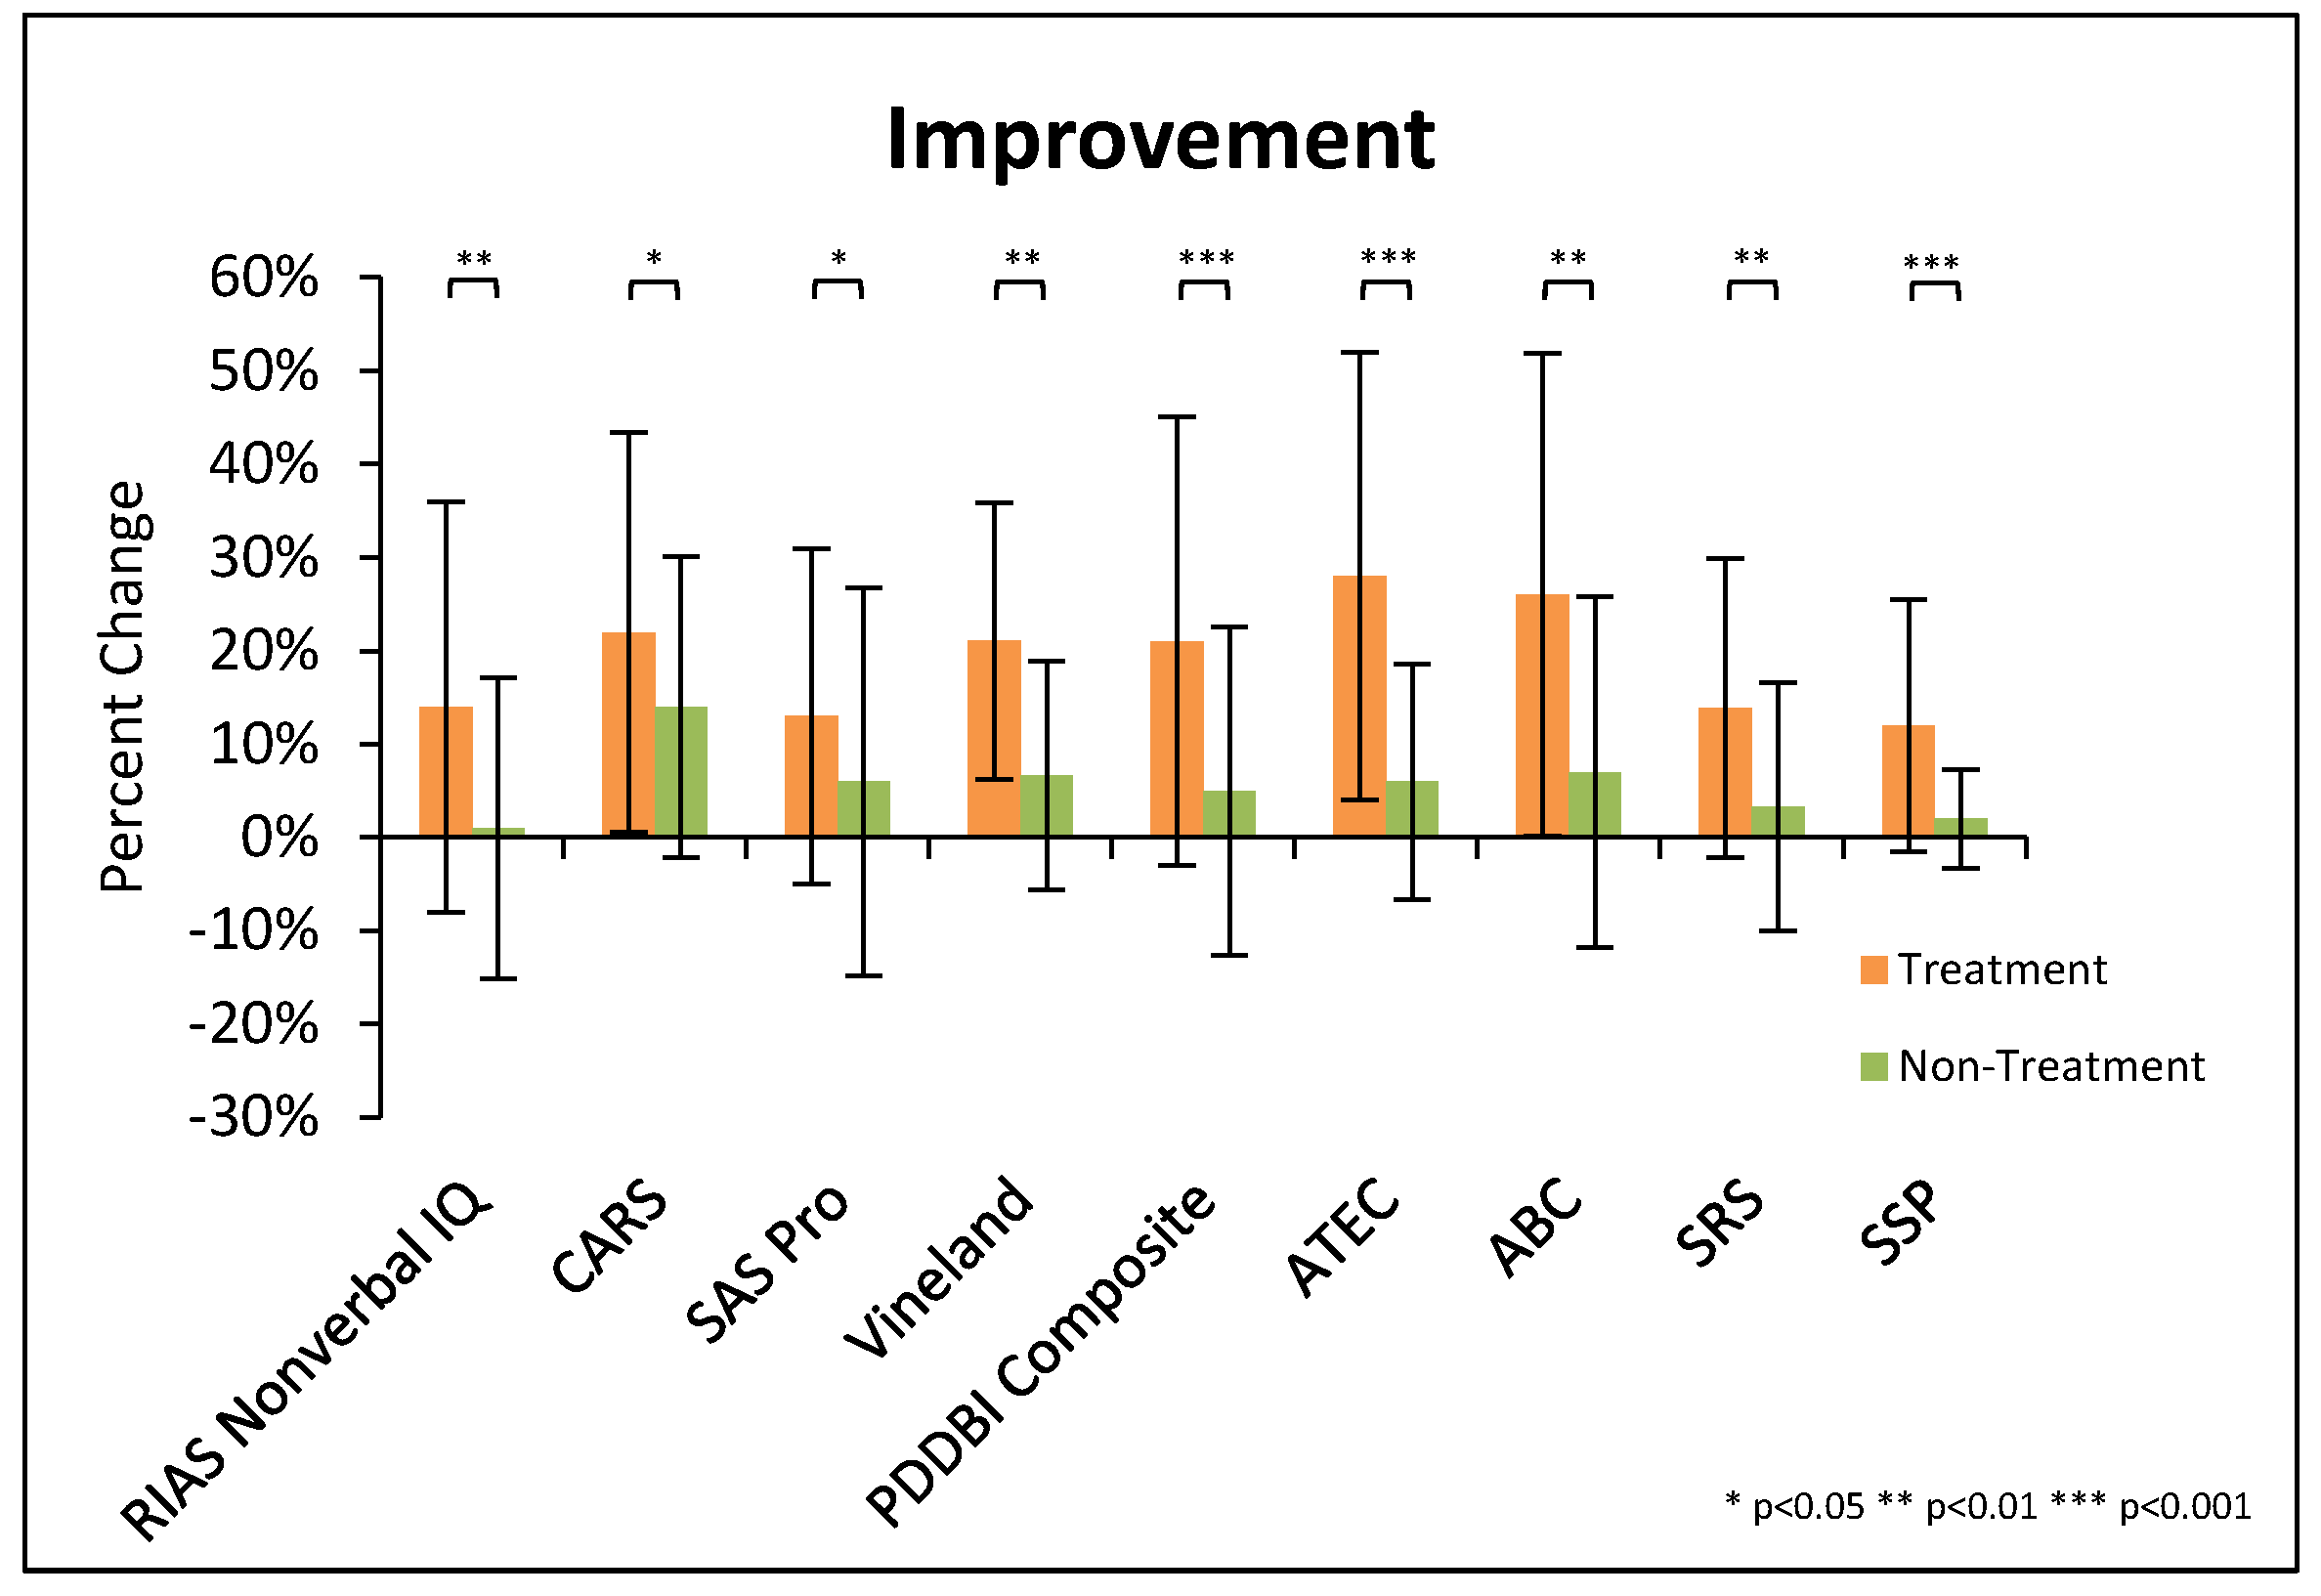
Figure 2.
Summary of significant changes in major evaluations, for both the treatment and non-treatment groups. For some scales an increase is an improvement, and for some the opposite is true; so, here we plot them with improvement being in the same direction on the y-axis. Note that the % change for the PDD-BI composite is based on the average change in each of the composite subscales. Error bars represent standard deviations.
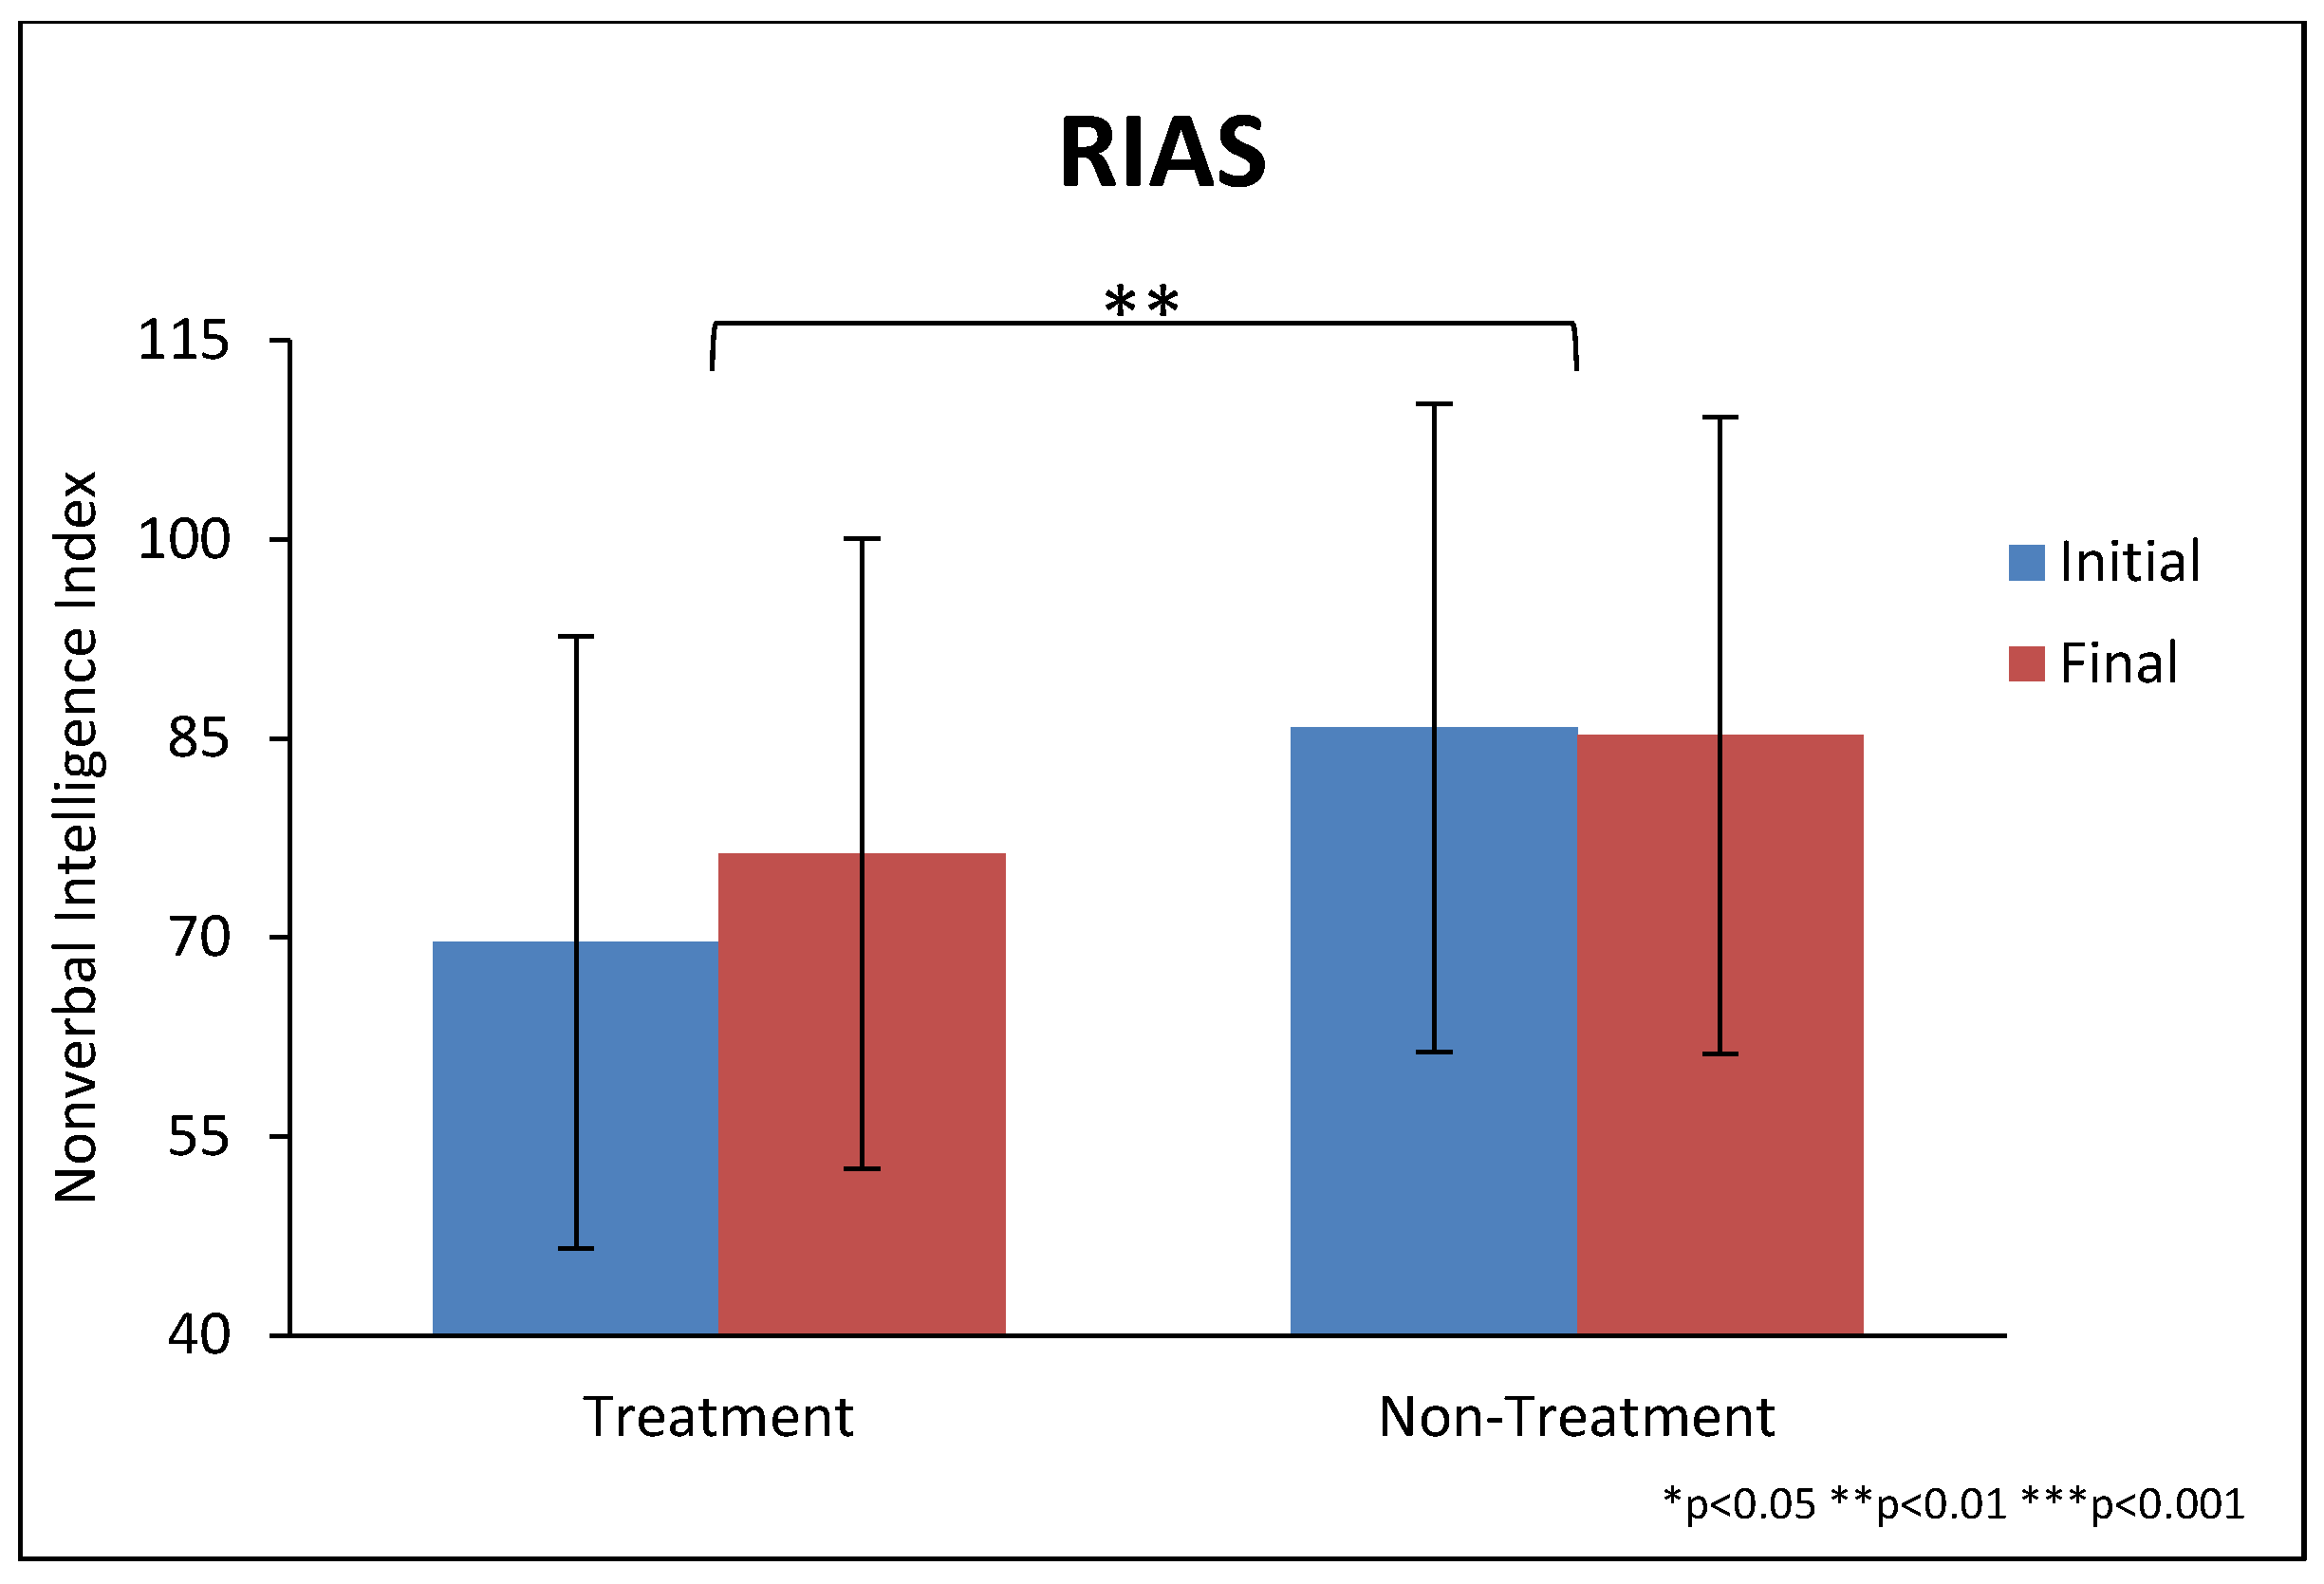
Figure 3.
Reynolds Intellectual Assessment Scales (RIAS) nonverbal IQ score at the beginning and end of the study, for the treatment and non-treatment groups. RIAS scores are normalized so that 100 is an “average” IQ; thus, the average of the ASD groups is substantially lower than the average for the general population. Error bars represent standard deviations.
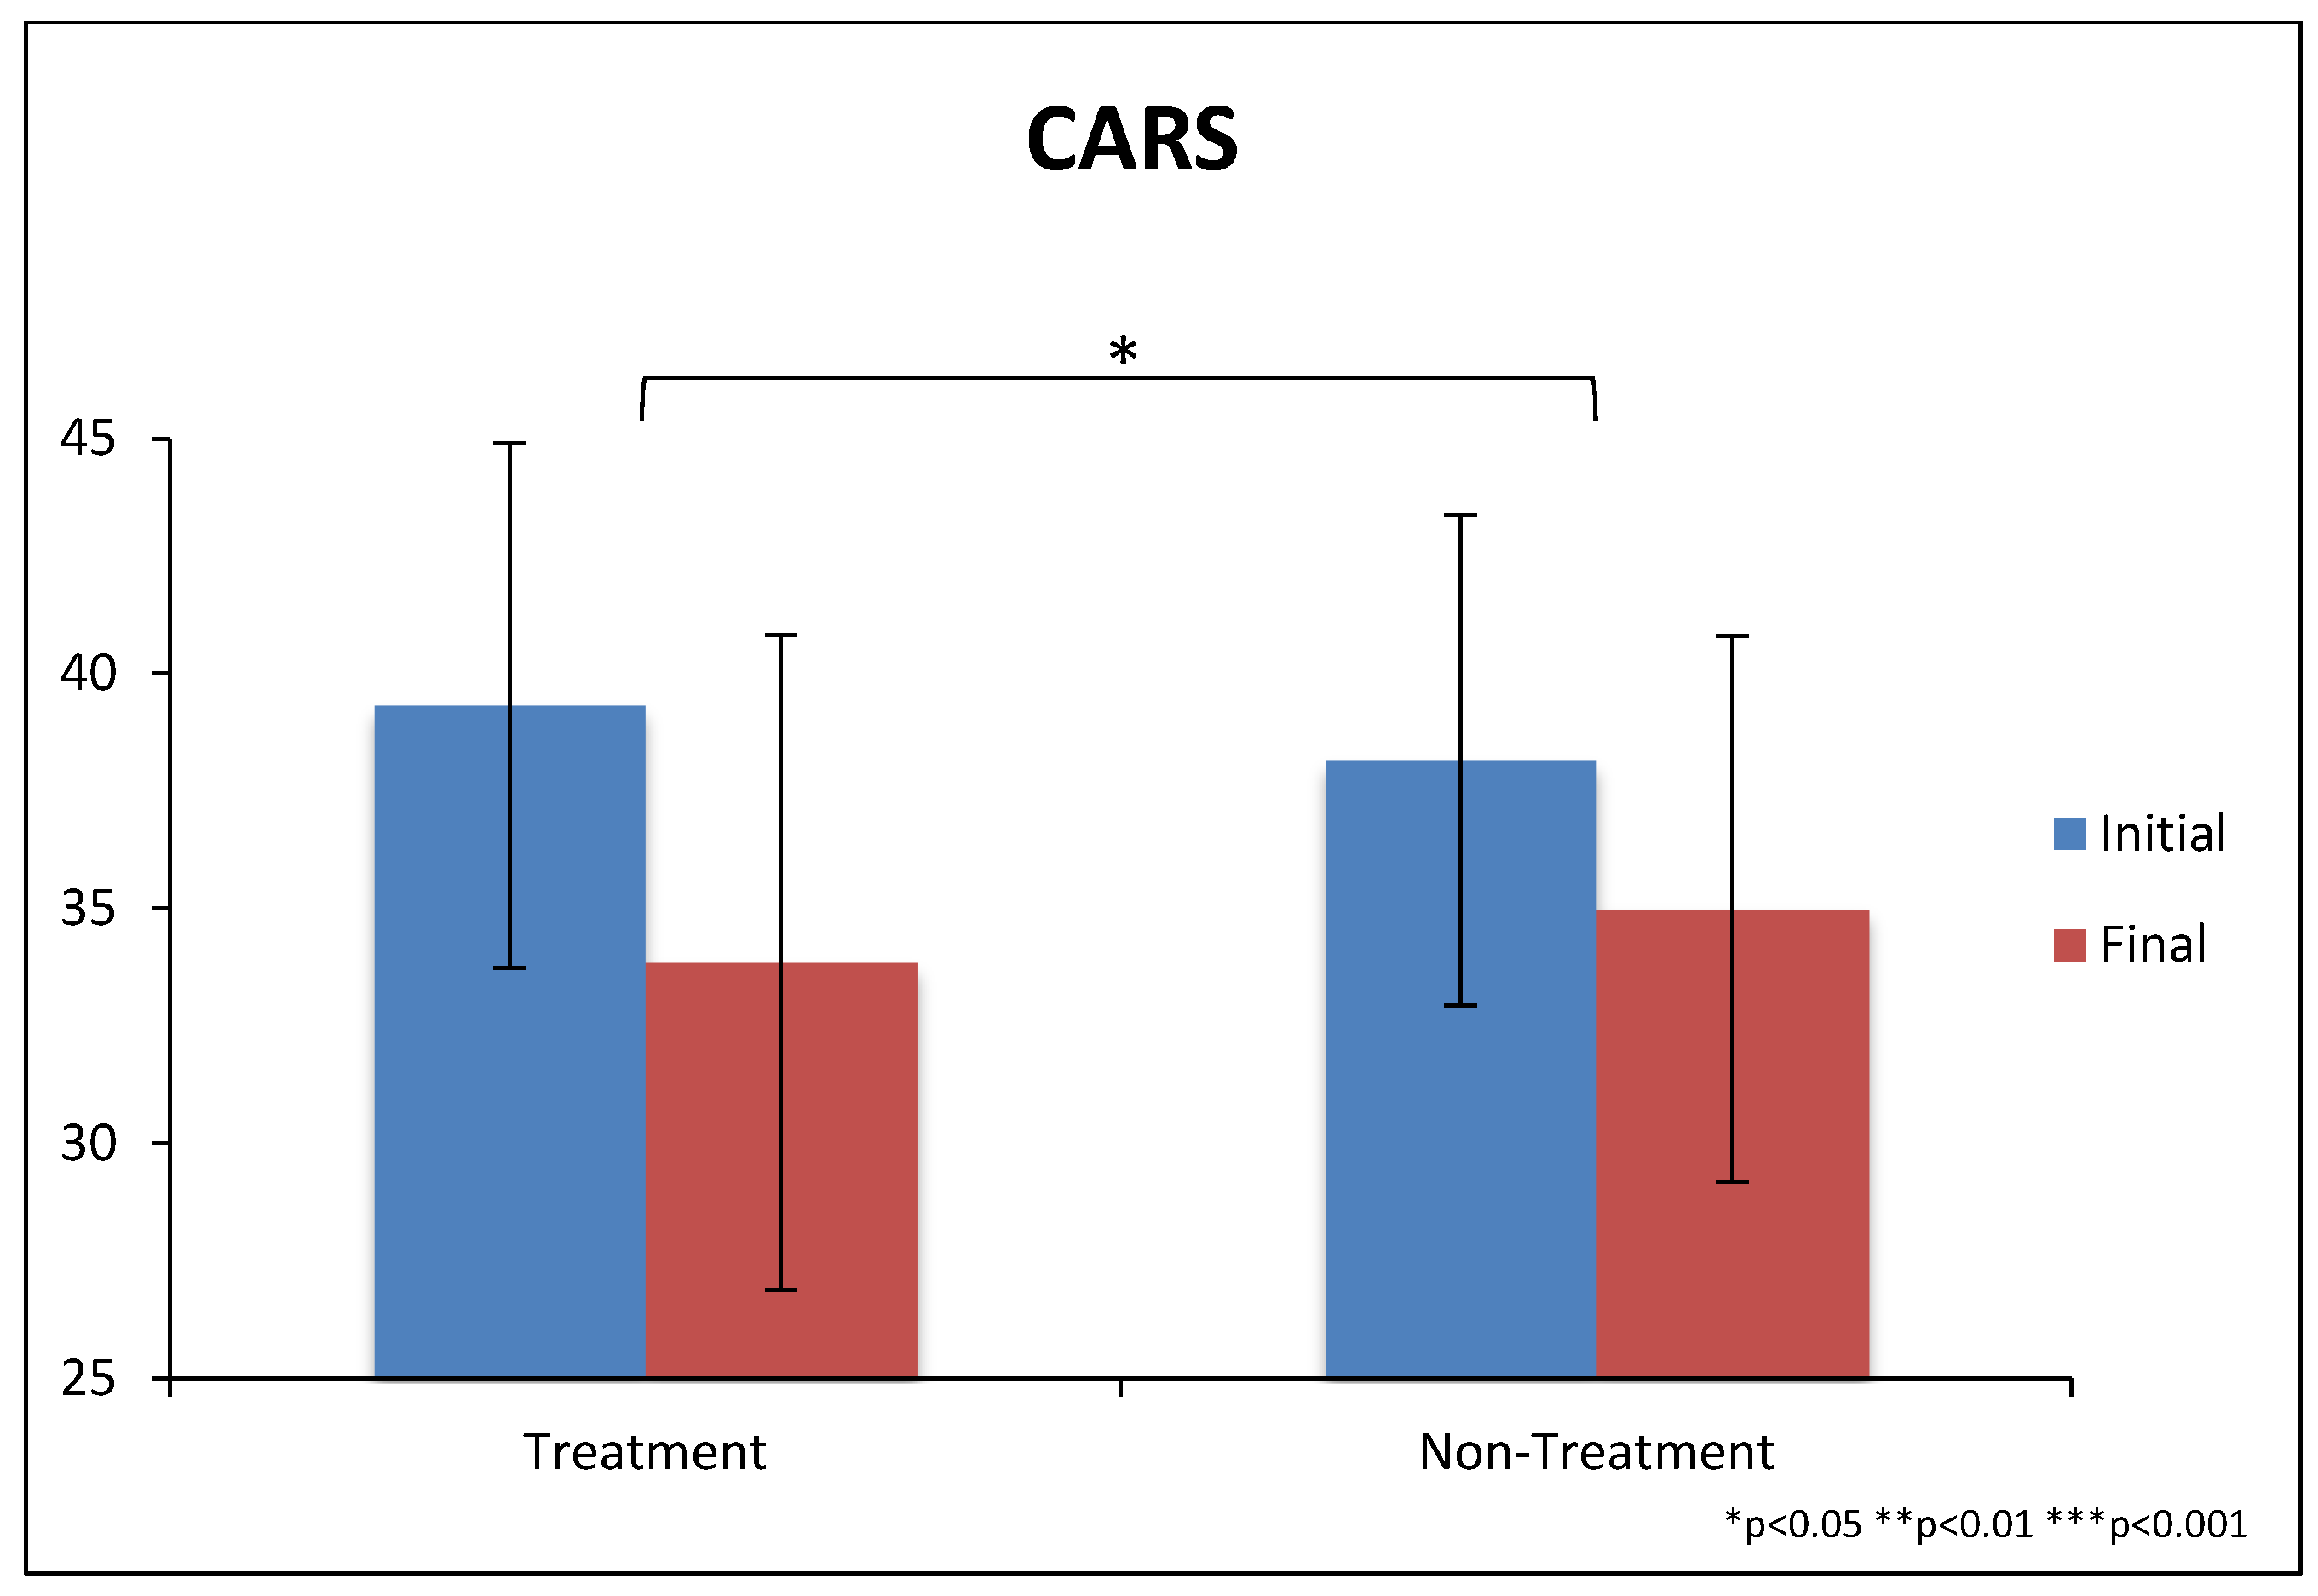
Figure 4.
CARS-2 scores at beginning and end of the study. The scale goes from 15 to 60, with scores of approximately 27 and above being the cut-off for ASD. Error bars represent standard deviations.
Figure 4.
CARS-2 scores at beginning and end of the study. The scale goes from 15 to 60, with scores of approximately 27 and above being the cut-off for ASD. Error bars represent standard deviations.
Figure 5.
SAS scores (as rated by the professional evaluator) at beginning and end of the study. The scale goes from zero (no symptoms) to 10 (severe autism). Error bars represent standard deviations.
Figure 5.
SAS scores (as rated by the professional evaluator) at beginning and end of the study. The scale goes from zero (no symptoms) to 10 (severe autism). Error bars represent standard deviations.
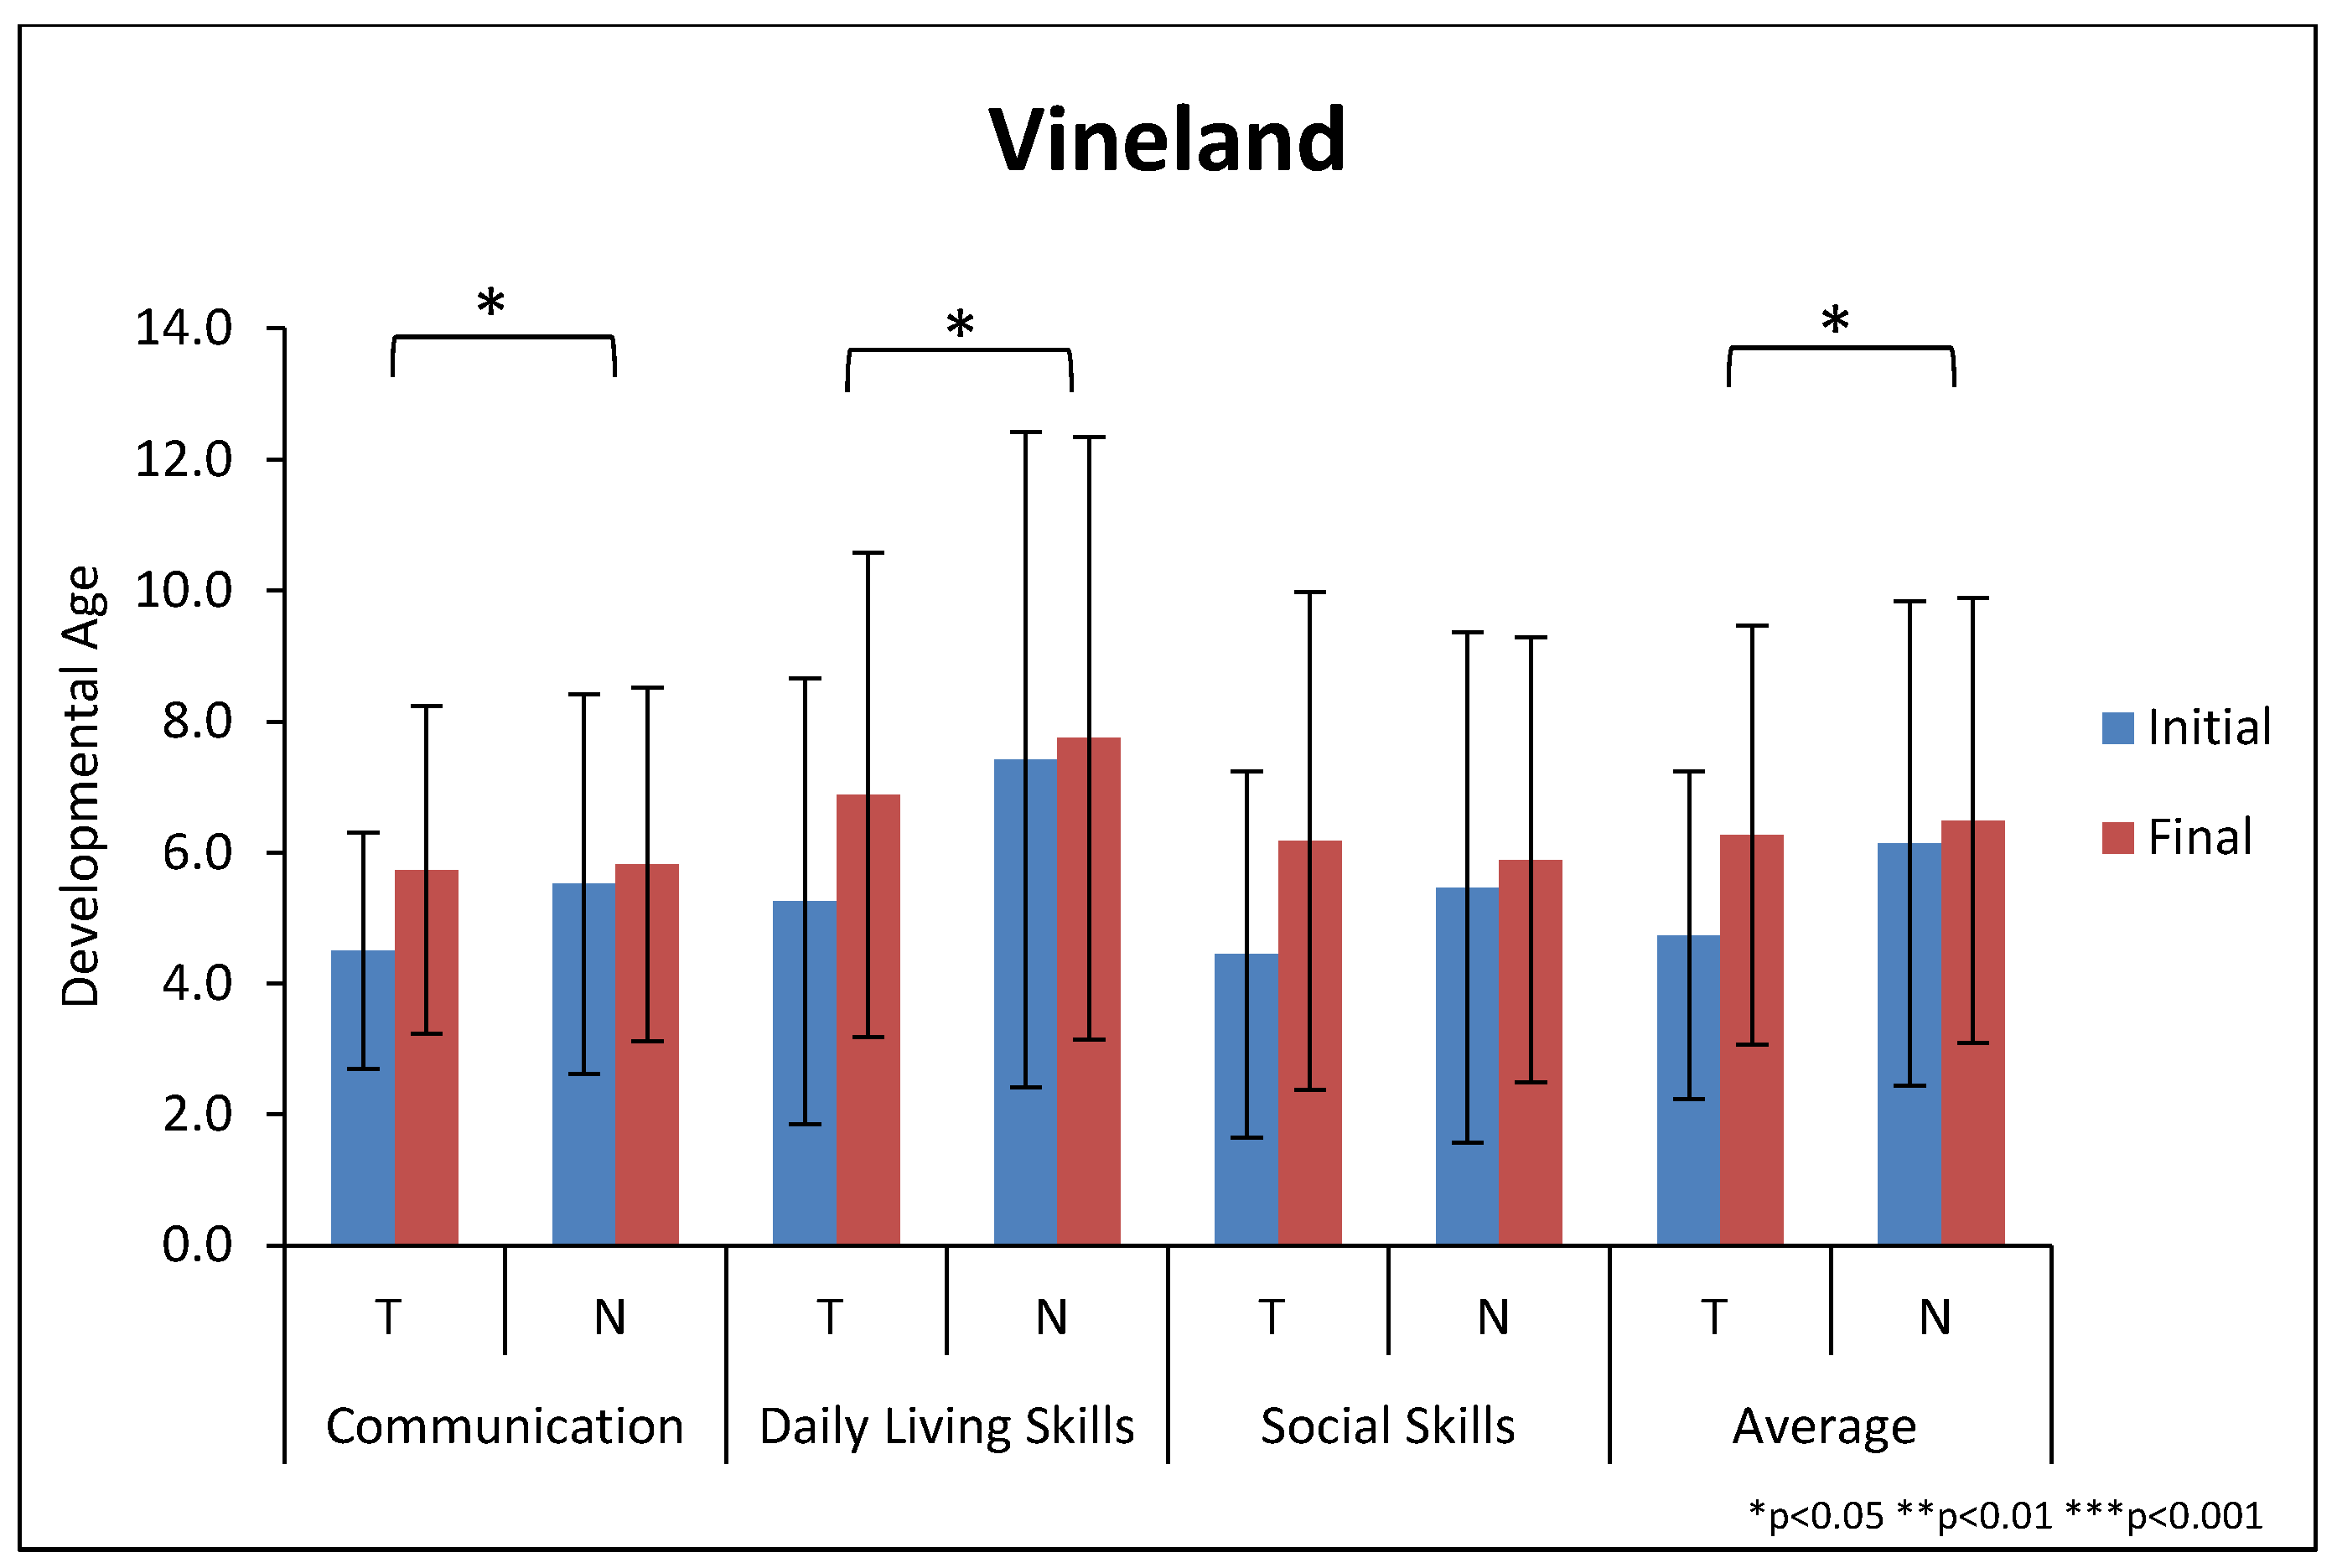
Figure 6.
Change in the developmental age for the Vineland domains, and the average of the three domains. “T” refers to the treatment group and “N” refers to the non-treatment group. Note that the physical age of the participants at the start of the study was 10.8 and 12.3 years for the treatment and non-treatment groups, respectively. So, their developmental age was far below their physical age, even after a significant increase for the treatment group. Error bars represent standard deviations.
Figure 7.
Vineland Subscale Changes.
Figure 7.
Vineland Subscale Changes.
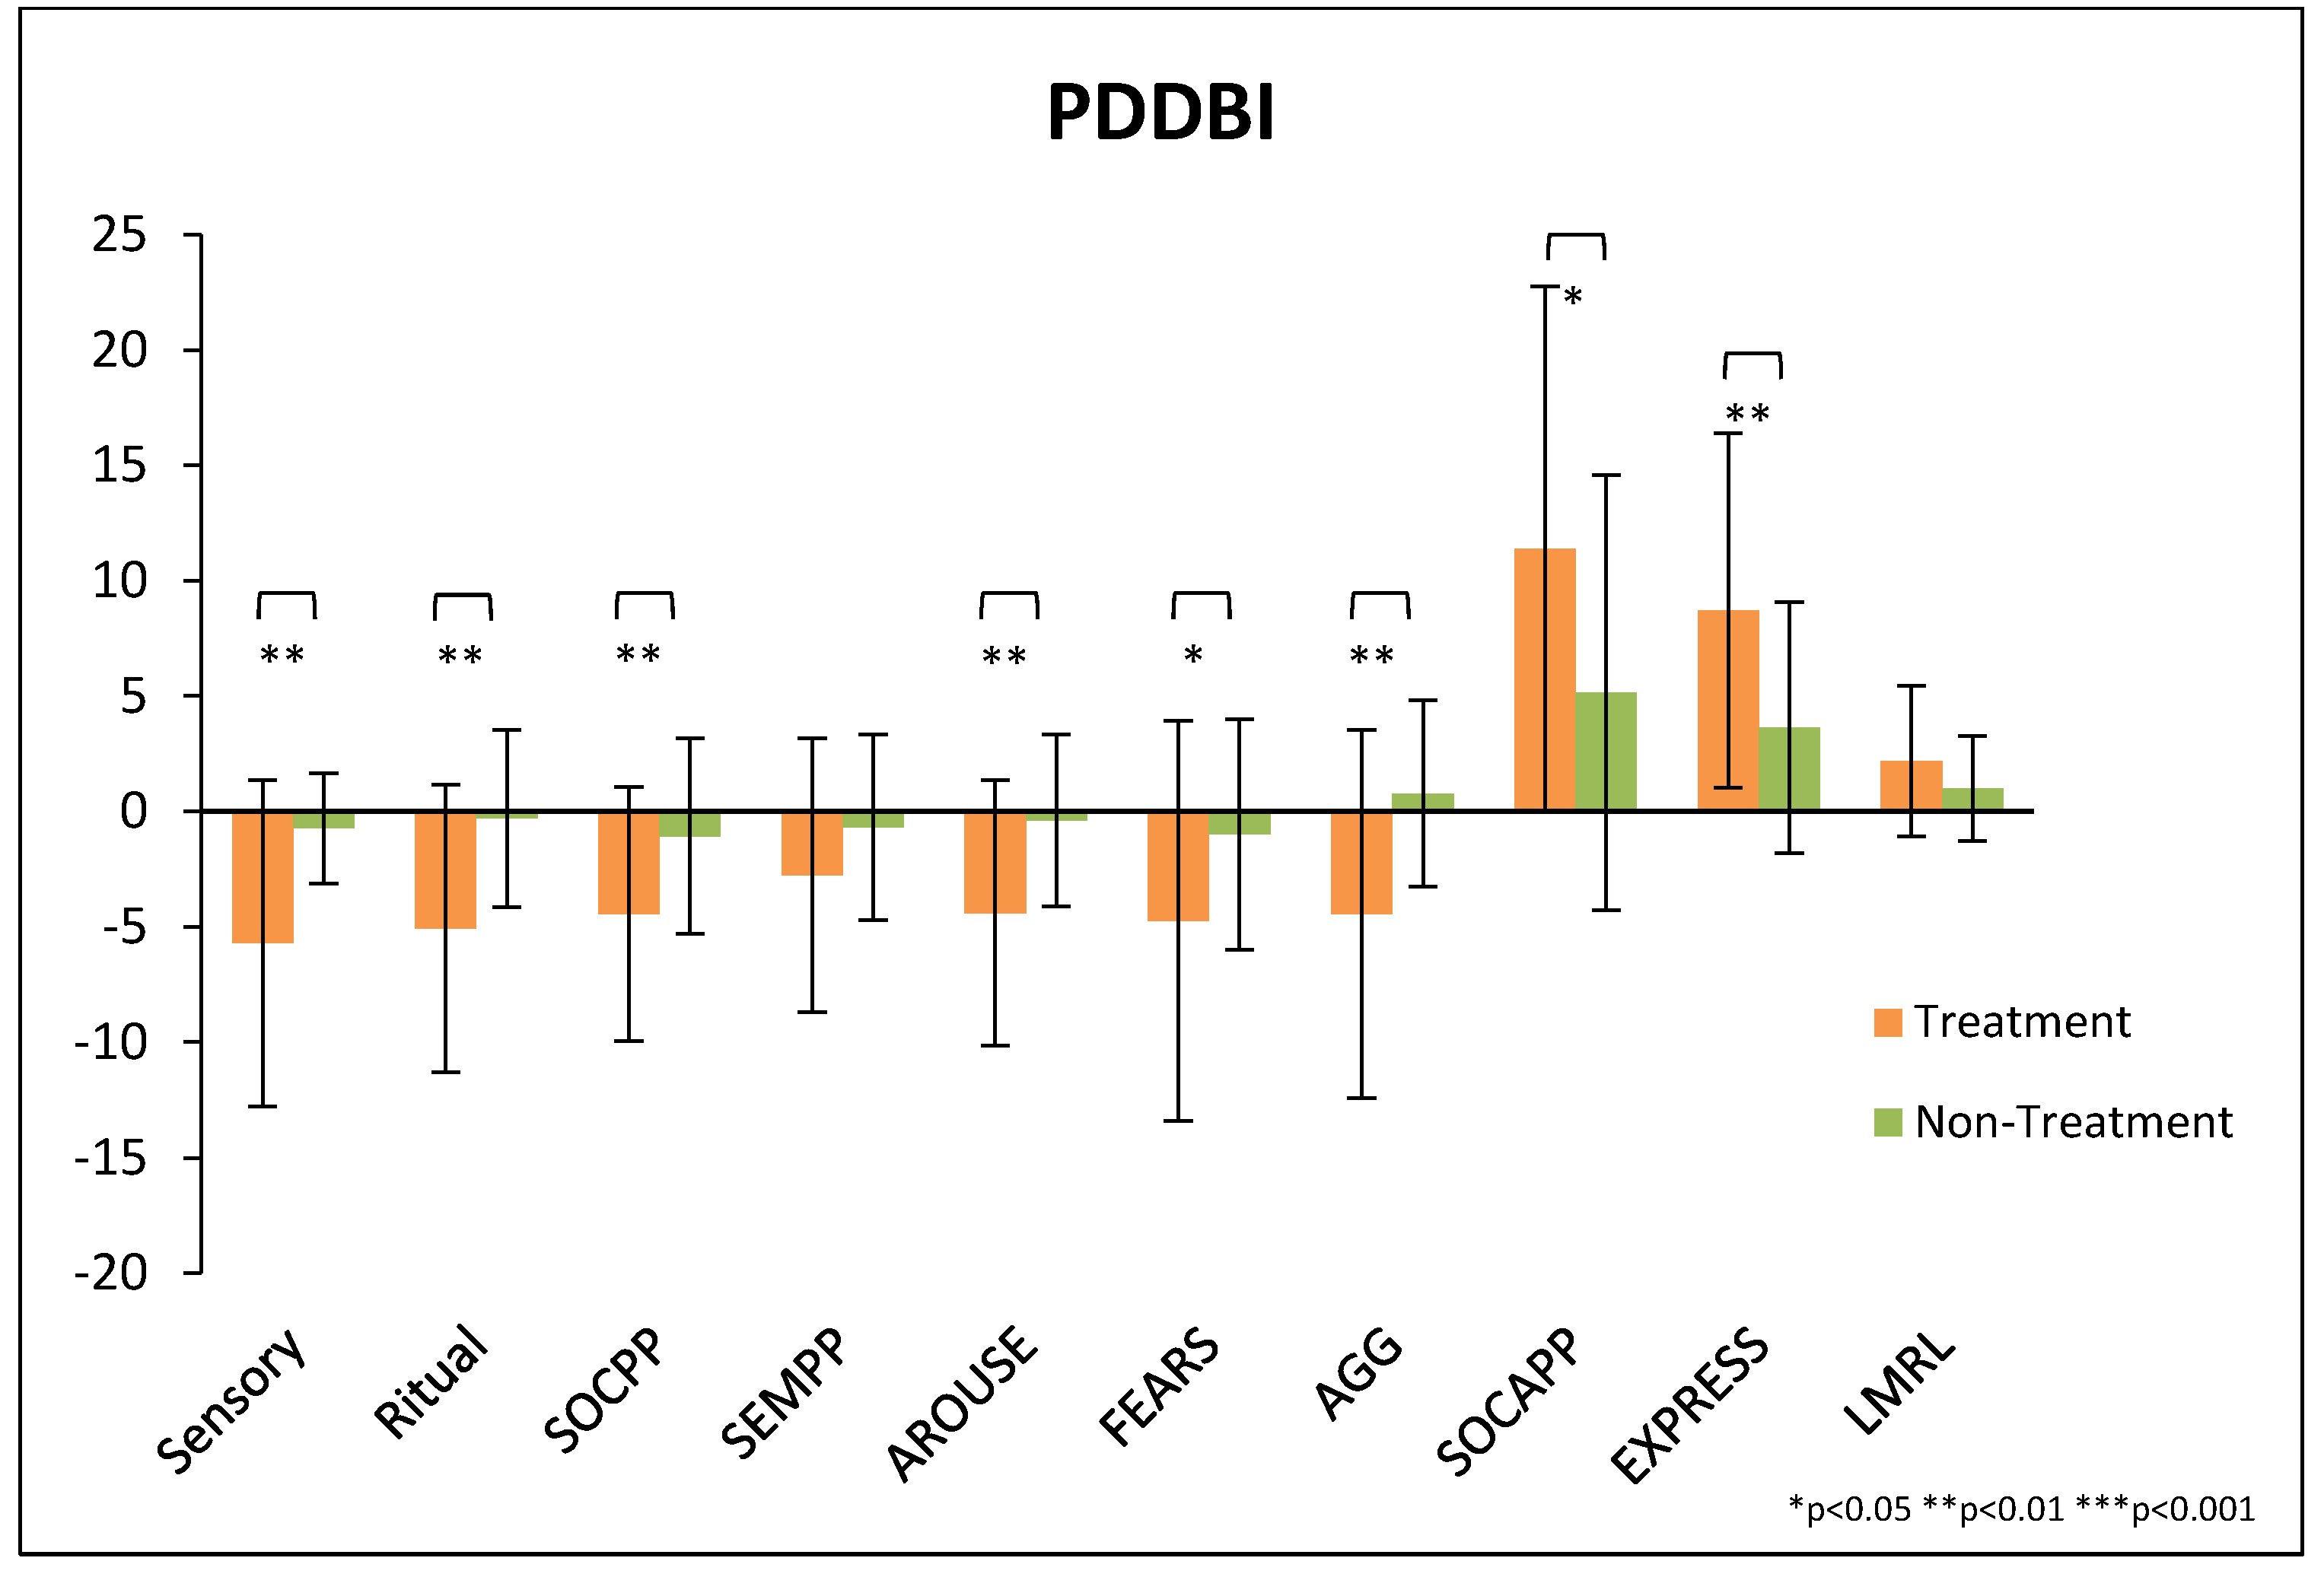
Figure 8.
Change in PDD-BI subscale scores. Note that the first seven subscales are for maladaptive behaviors, so a decrease is beneficial. The last three subscales are for adaptive behaviors, so an increase is beneficial. Error bars represent standard deviations.
Figure 8.
Change in PDD-BI subscale scores. Note that the first seven subscales are for maladaptive behaviors, so a decrease is beneficial. The last three subscales are for adaptive behaviors, so an increase is beneficial. Error bars represent standard deviations.
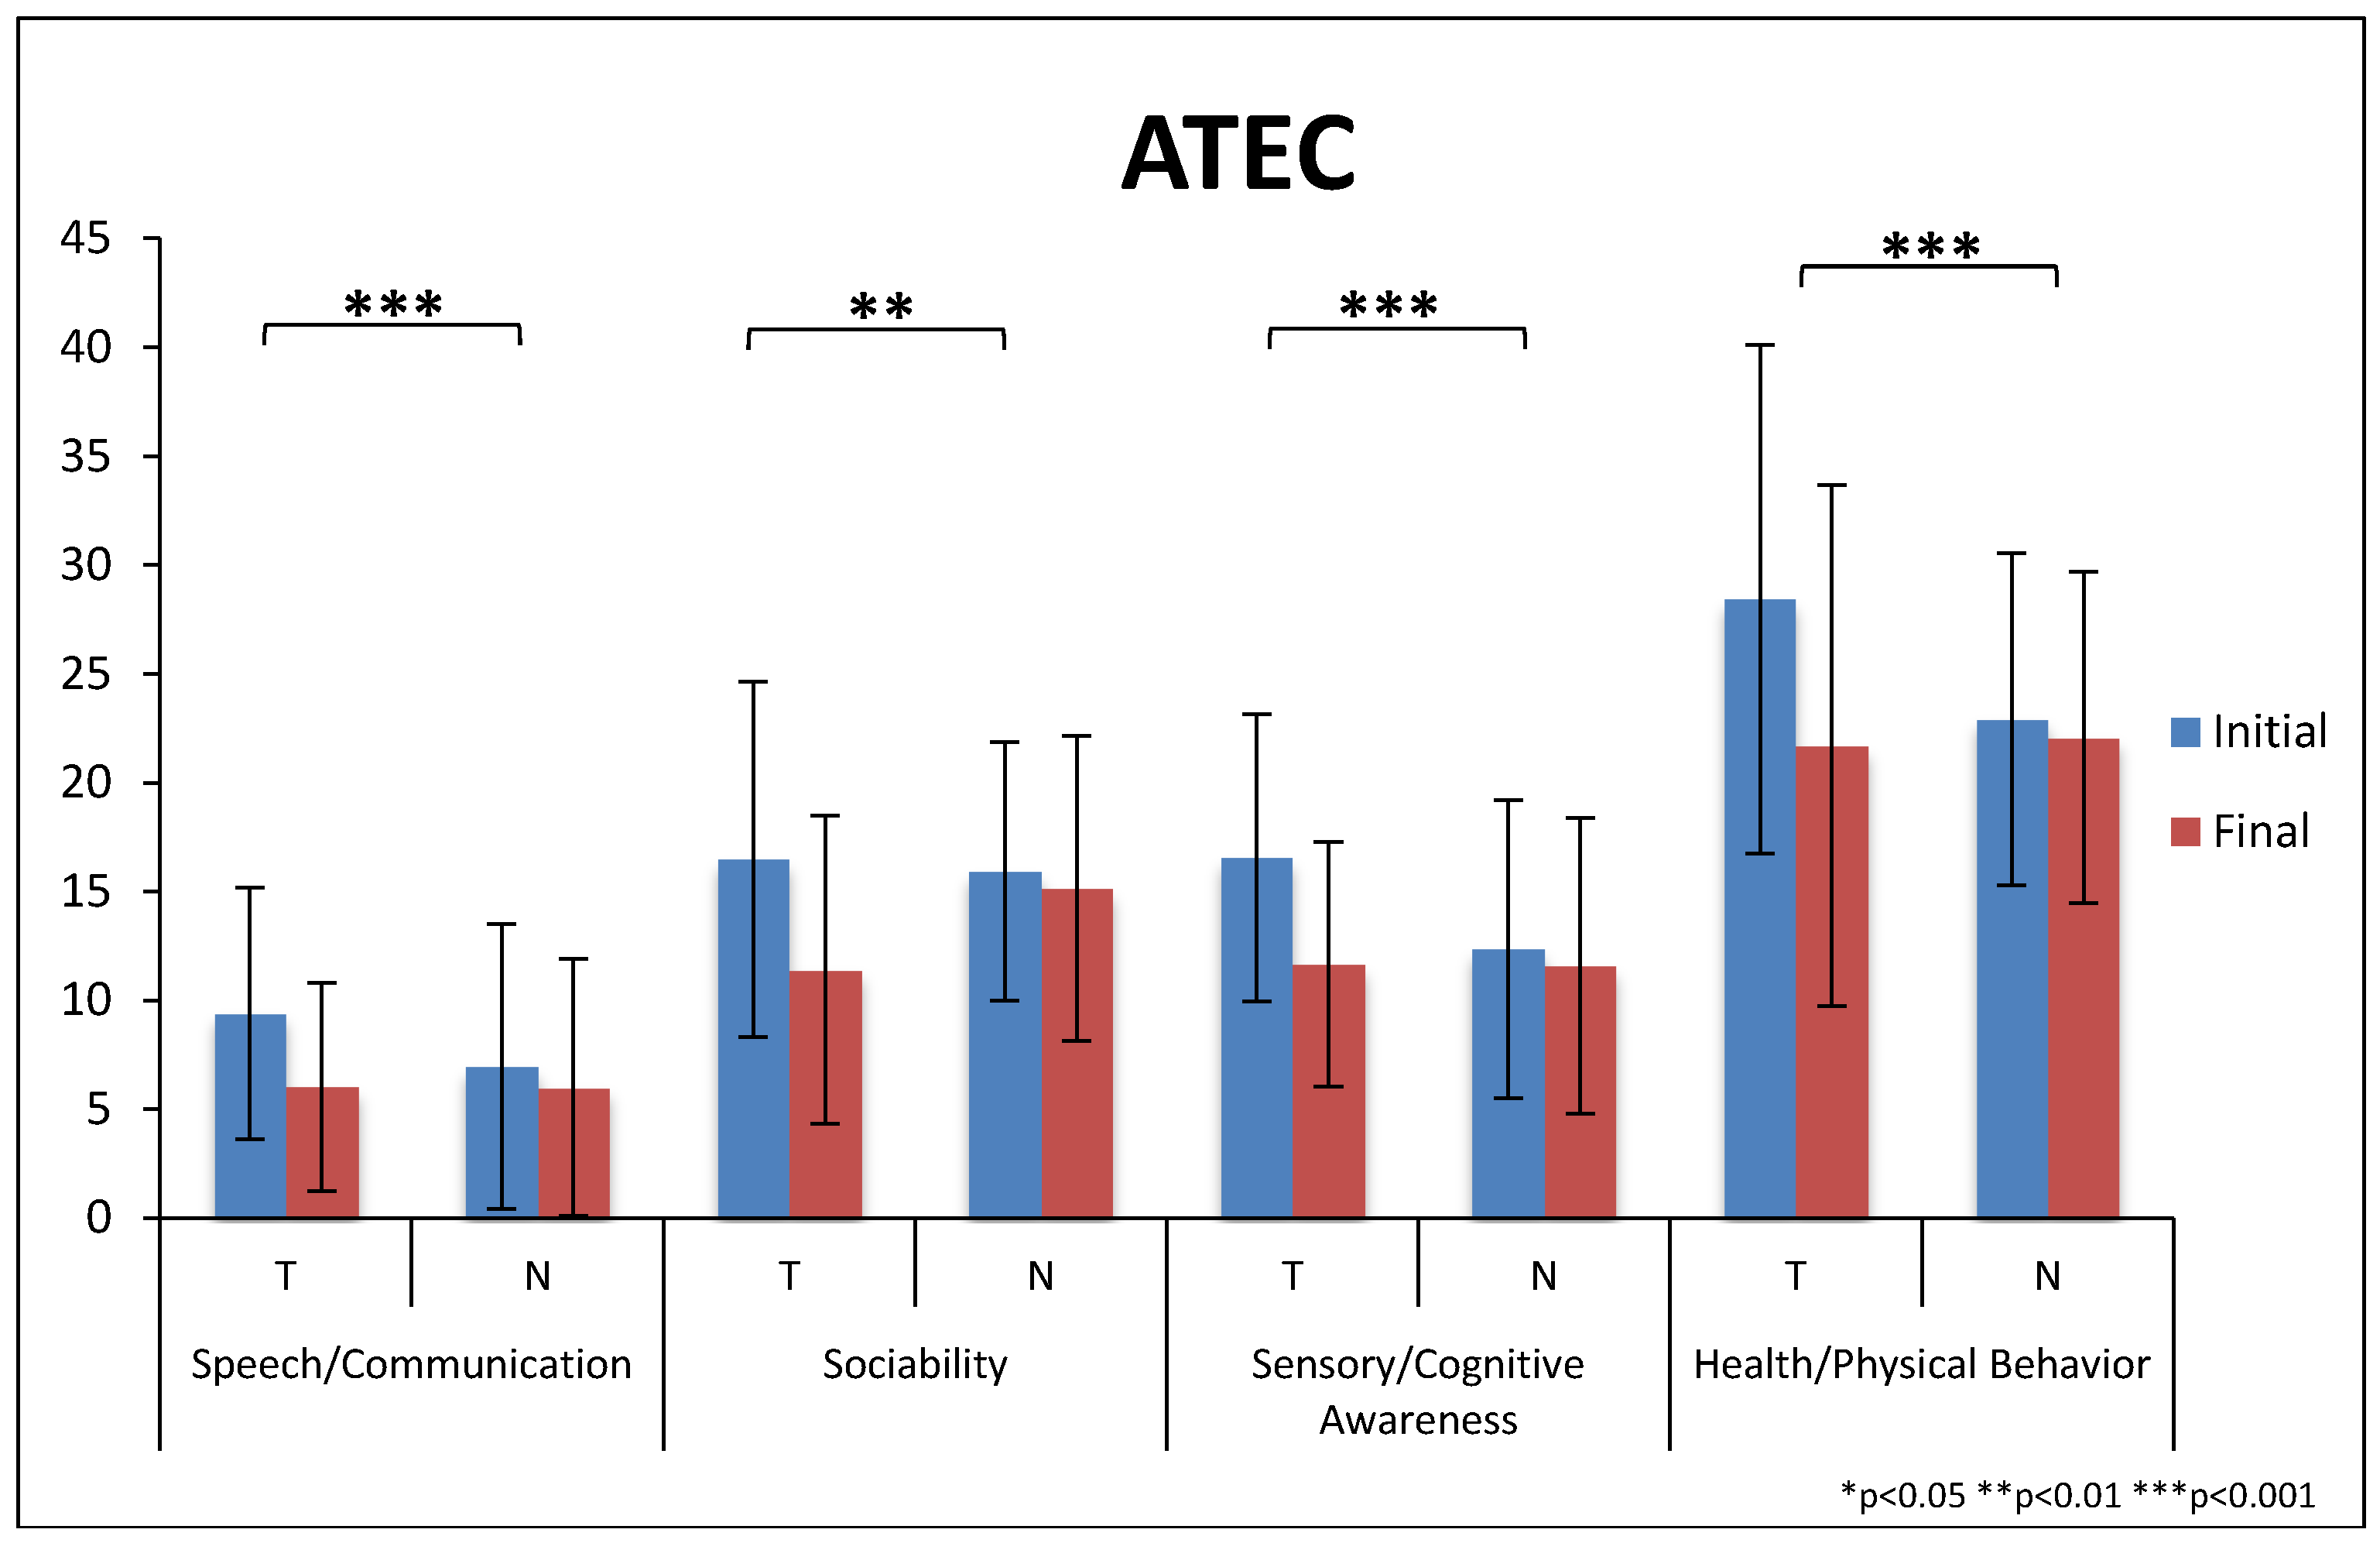
Figure 9.
The scores for the four ATEC subscales at the beginning and end of the study. “T” refers to the treatment group and “N” refers to the non-treatment group. Higher scores represent greater severity. Error bars represent standard deviations.
Figure 9.
The scores for the four ATEC subscales at the beginning and end of the study. “T” refers to the treatment group and “N” refers to the non-treatment group. Higher scores represent greater severity. Error bars represent standard deviations.
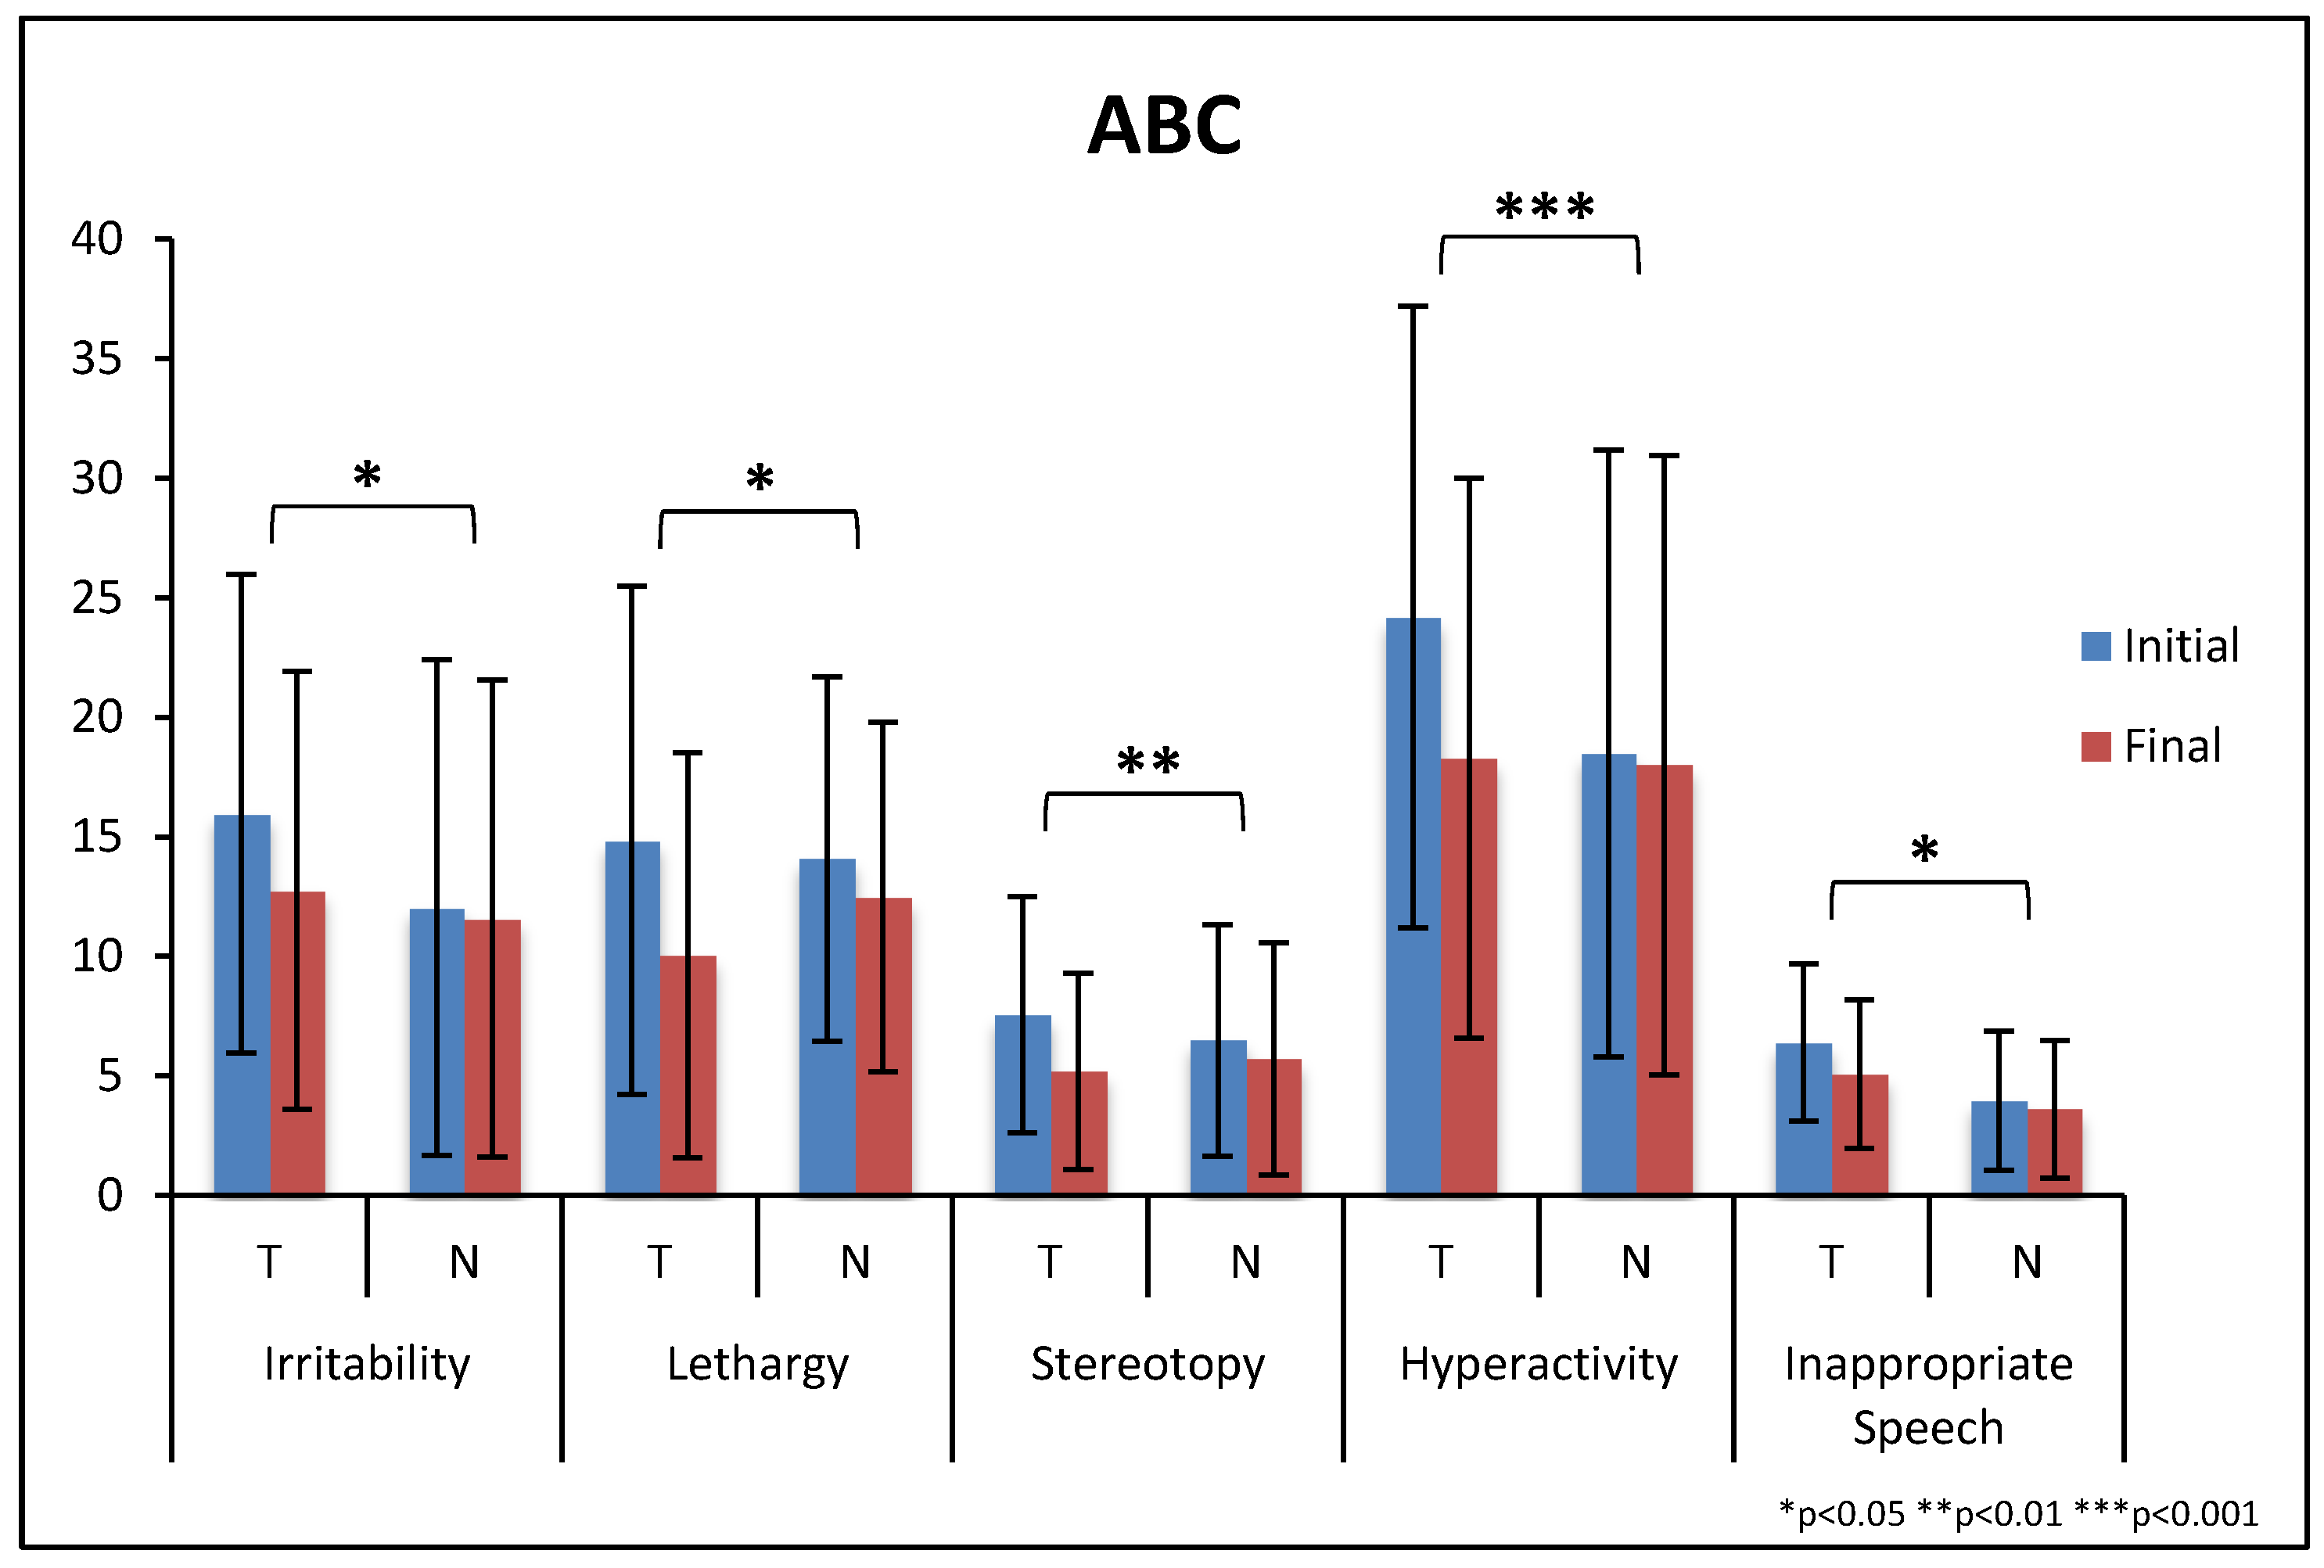
Figure 10.
ABC subscales at beginning and end of the study. “T” refers to the treatment group and “N” refers to the non-treatment group. Higher scores represent greater severity. Error bars represent standard deviations.
Figure 10.
ABC subscales at beginning and end of the study. “T” refers to the treatment group and “N” refers to the non-treatment group. Higher scores represent greater severity. Error bars represent standard deviations.
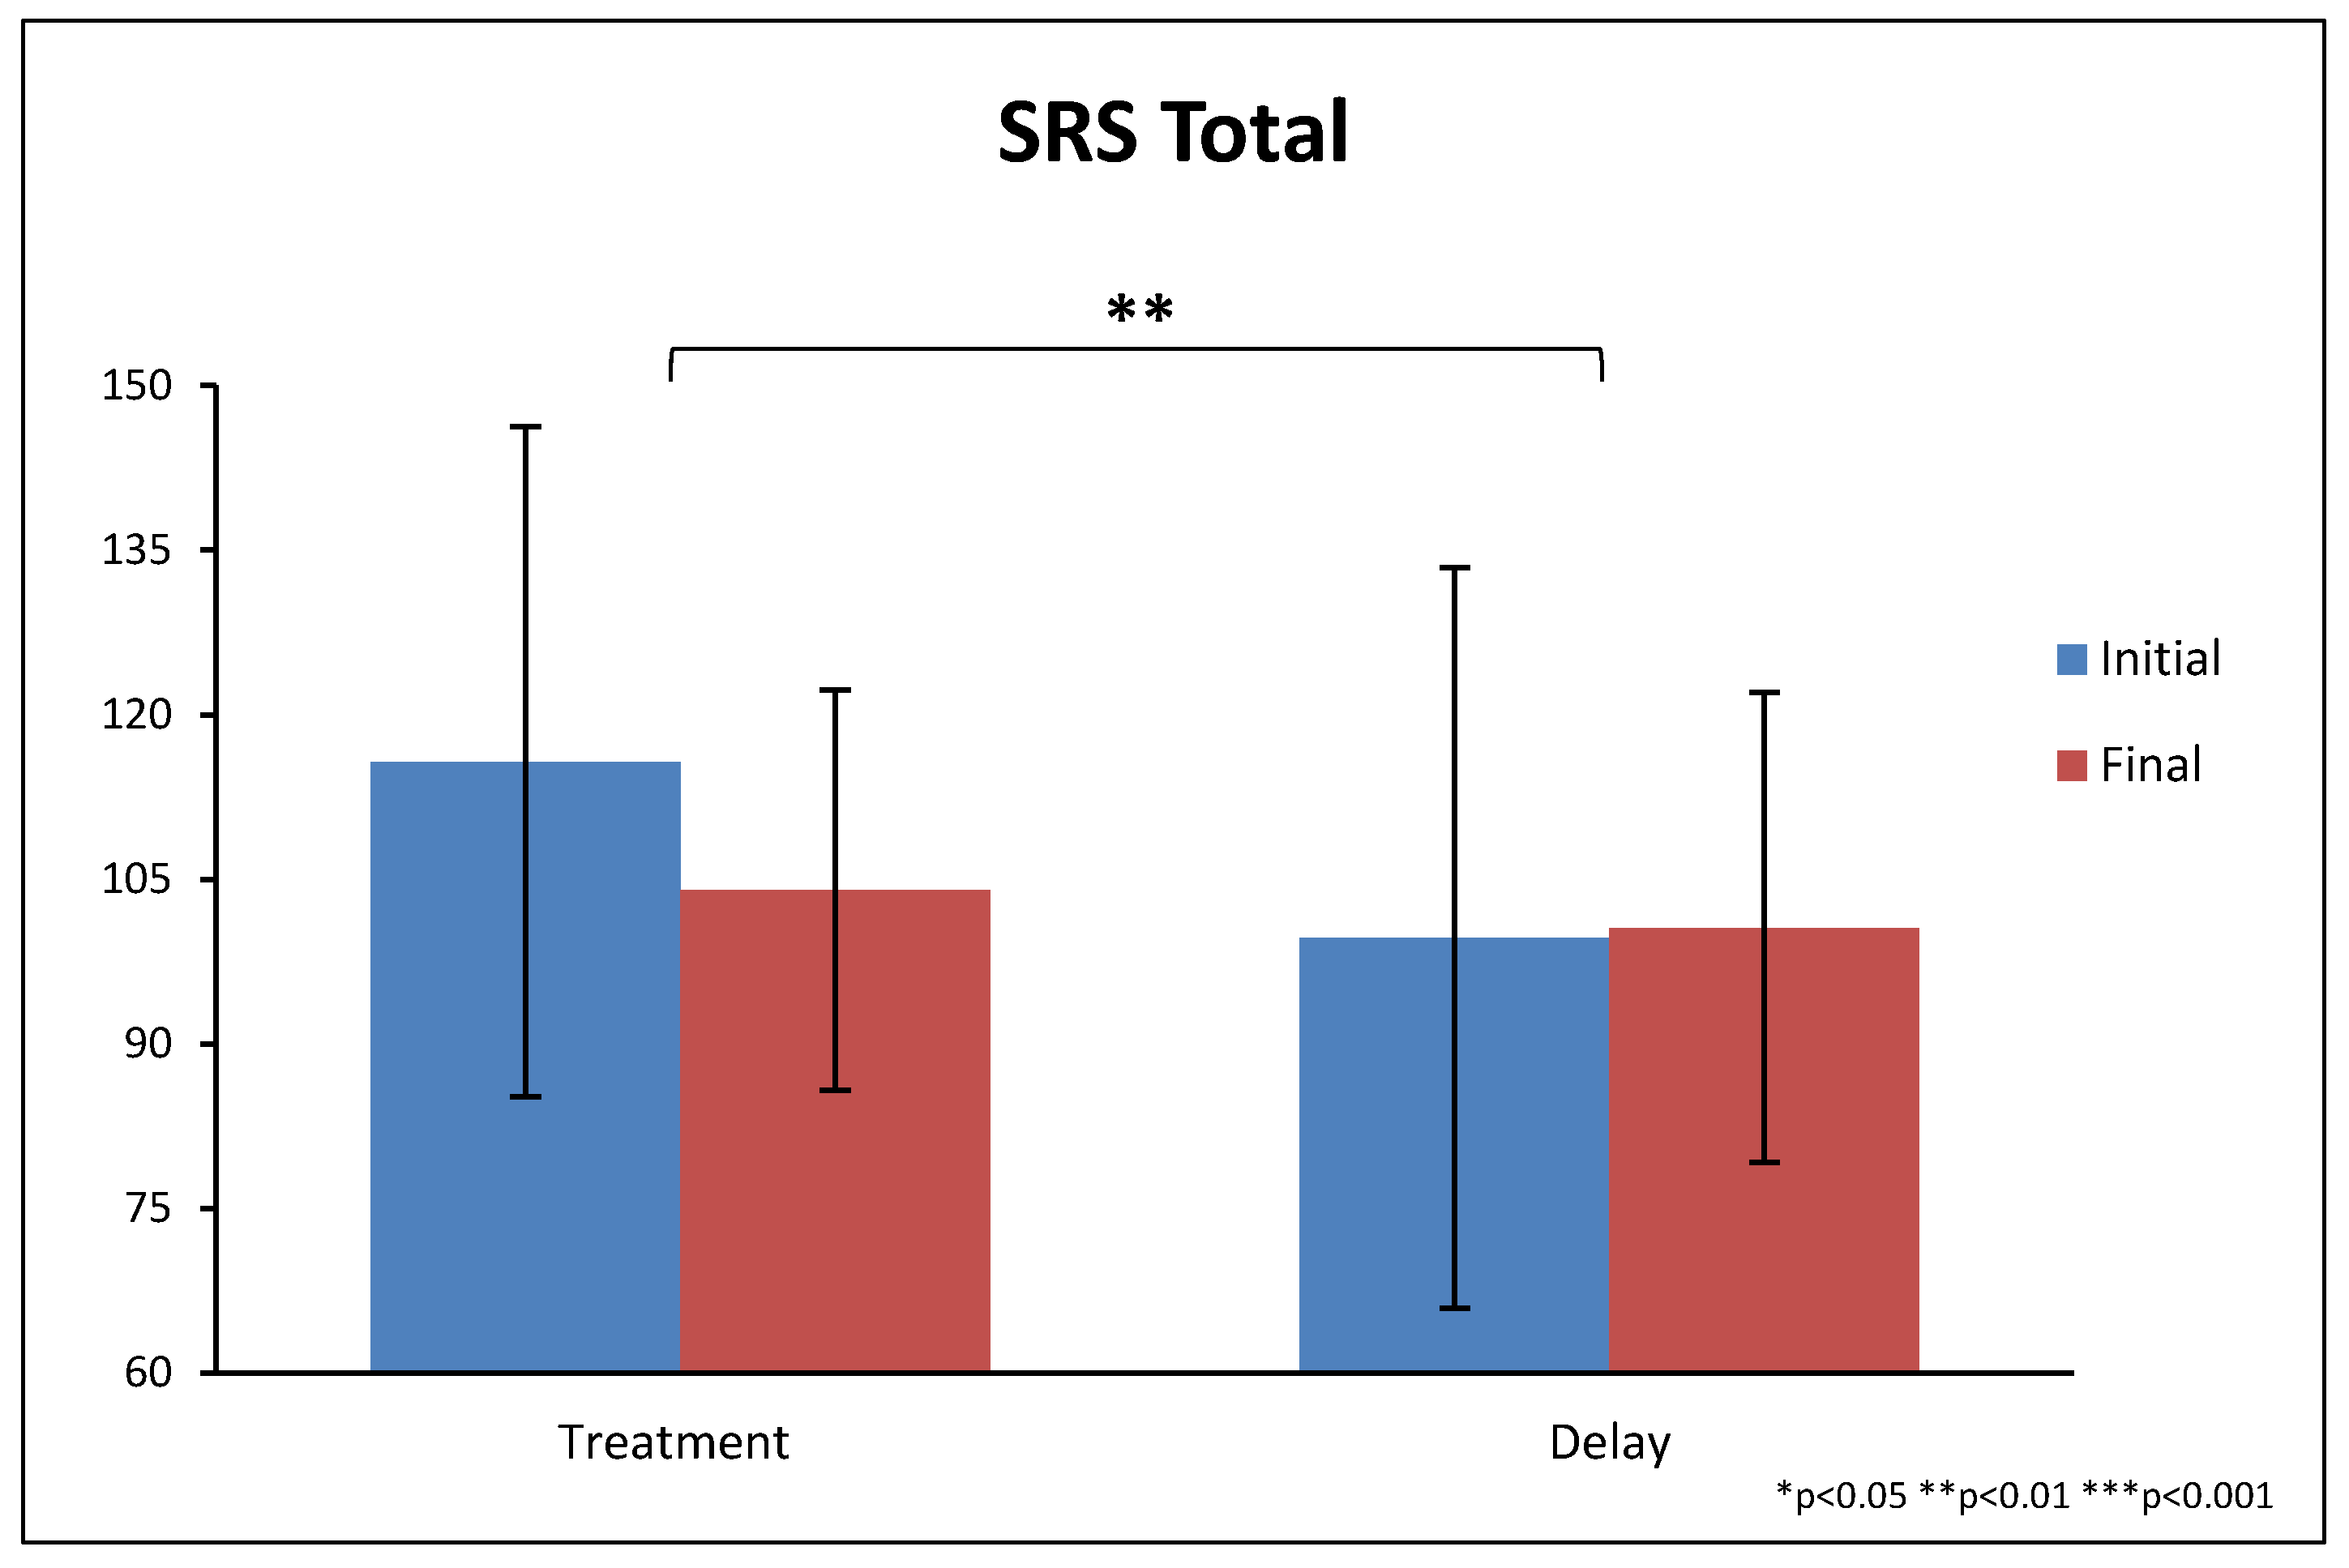
Figure 11.
Total SRS scores at the beginning and end of the study. Higher scores indicate greater severity, and 54 is the cut-off for an ASD diagnosis. Error bars represent standard deviations.
Figure 11.
Total SRS scores at the beginning and end of the study. Higher scores indicate greater severity, and 54 is the cut-off for an ASD diagnosis. Error bars represent standard deviations.
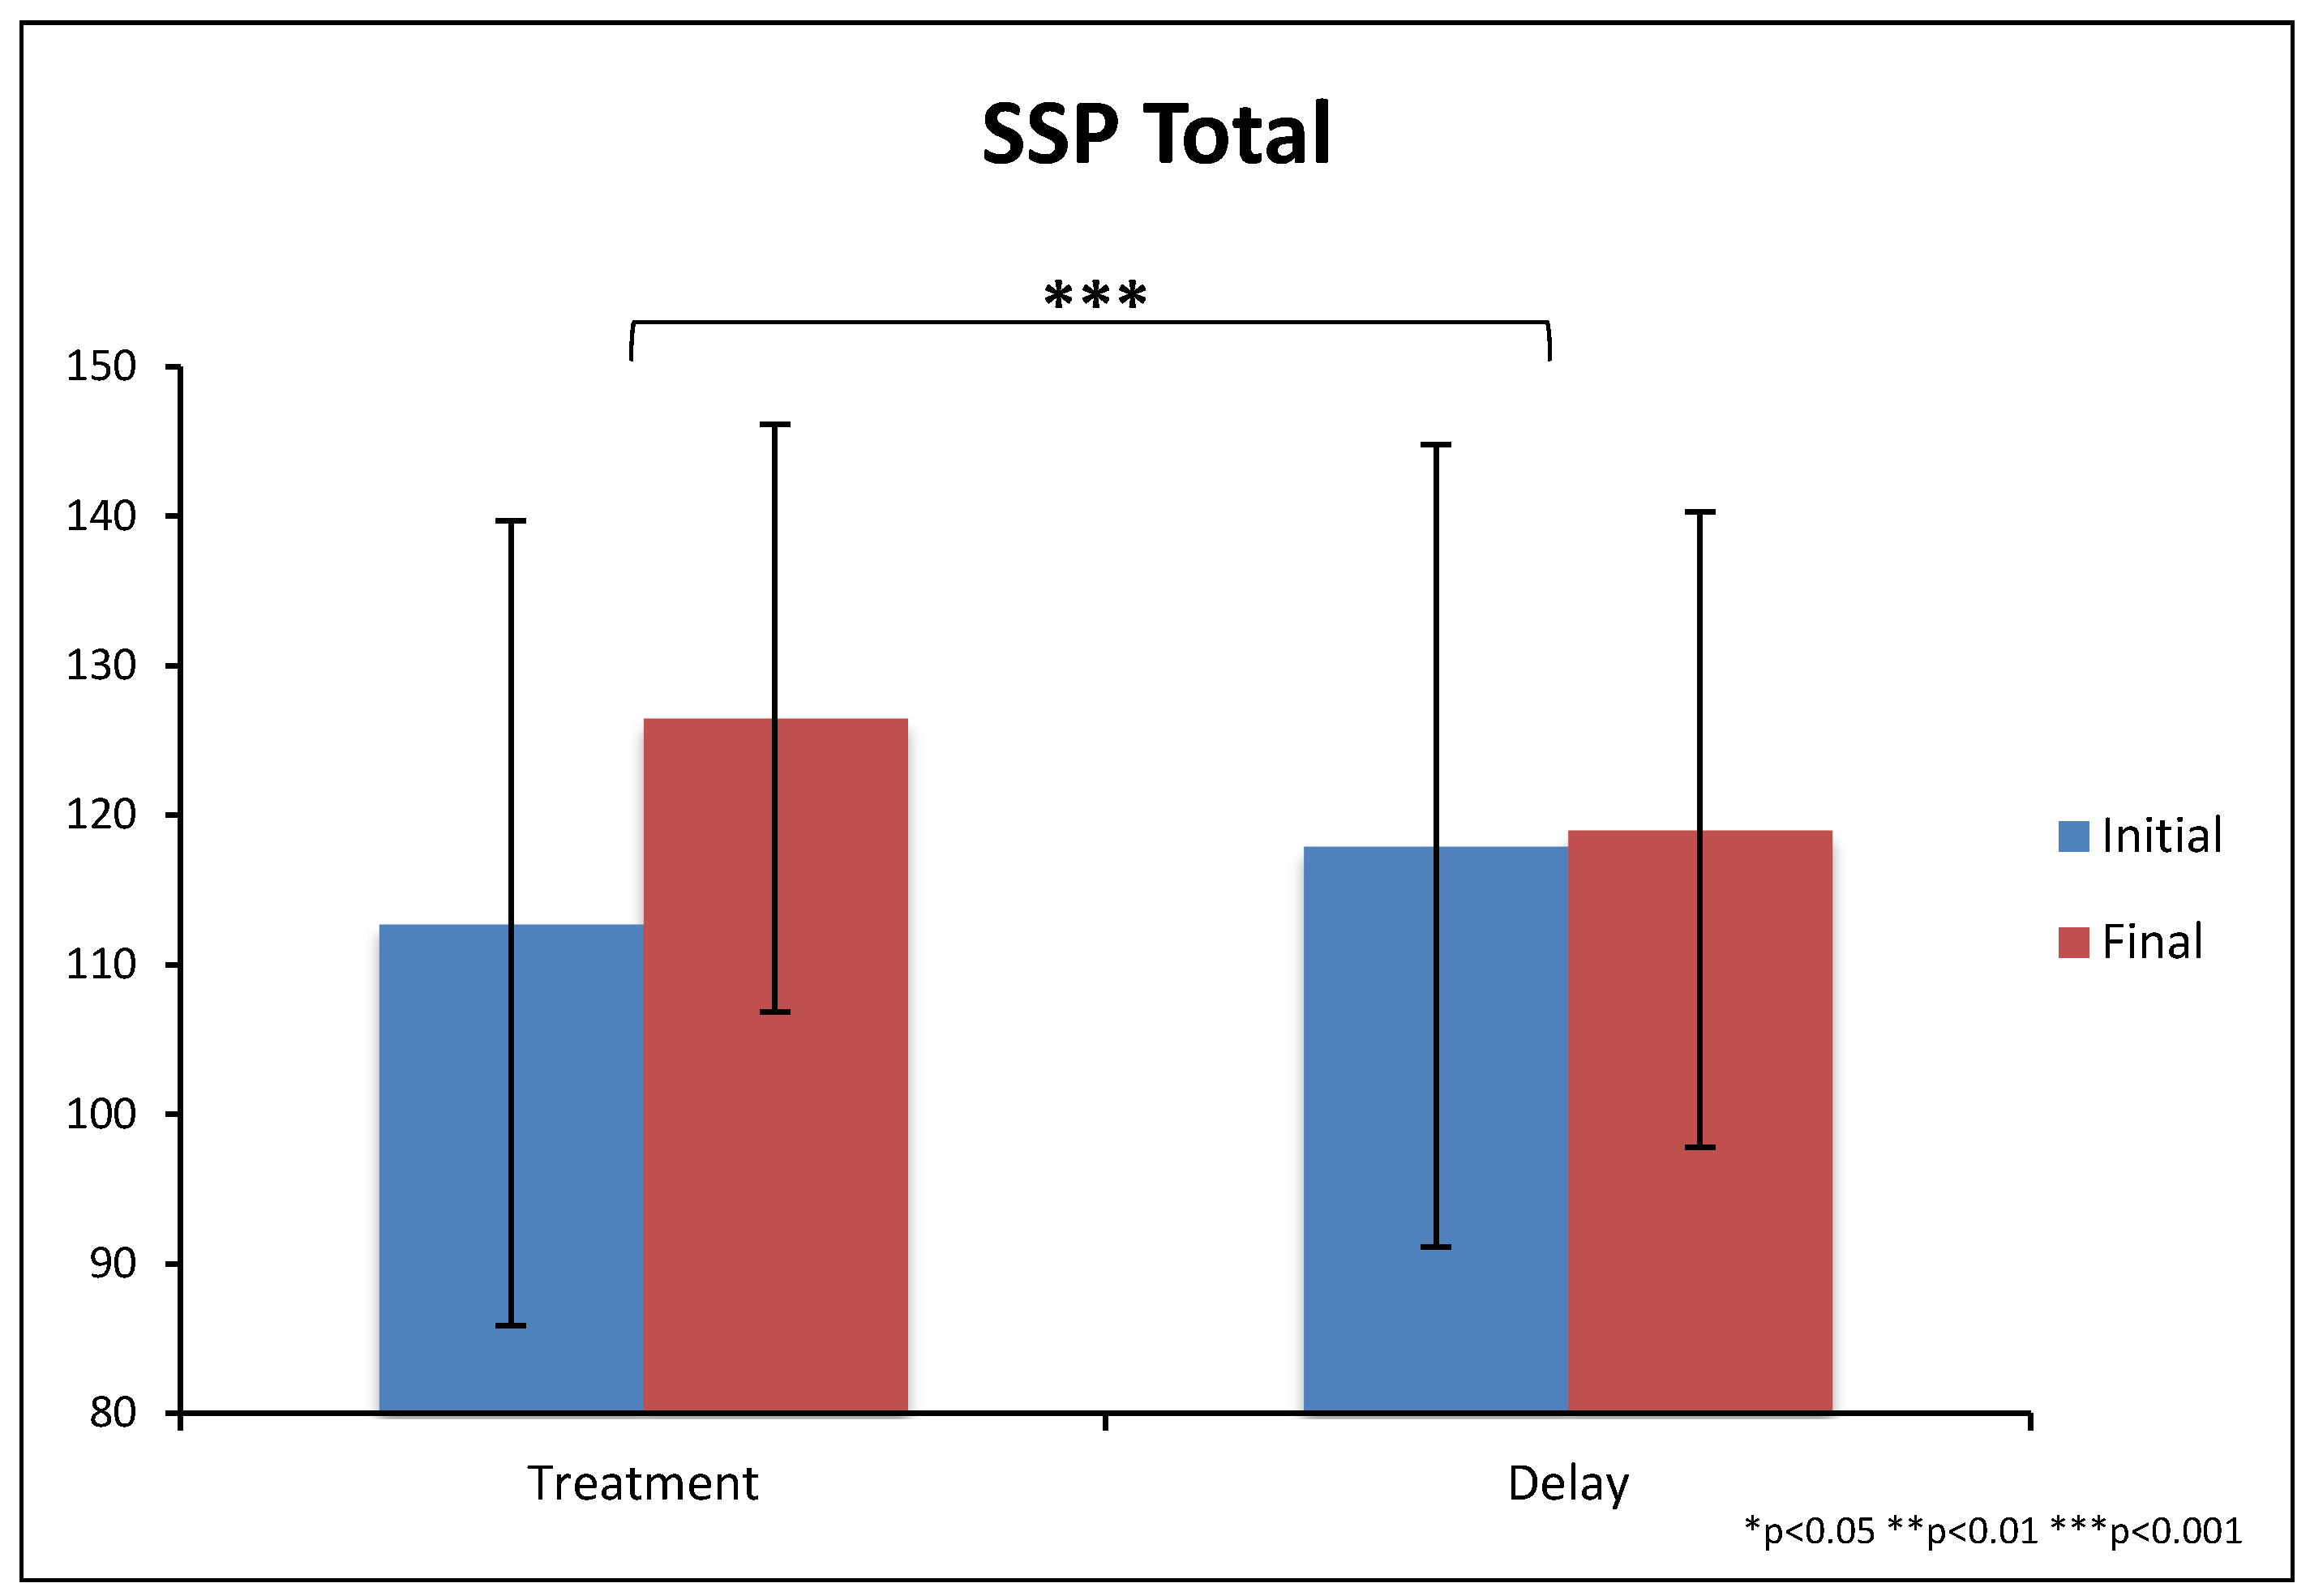
Figure 12.
SSP scores at the beginning and end of the study. Note that higher scores represent fewer sensory problems. Error bars represent standard deviations.
Figure 12.
SSP scores at the beginning and end of the study. Note that higher scores represent fewer sensory problems. Error bars represent standard deviations.
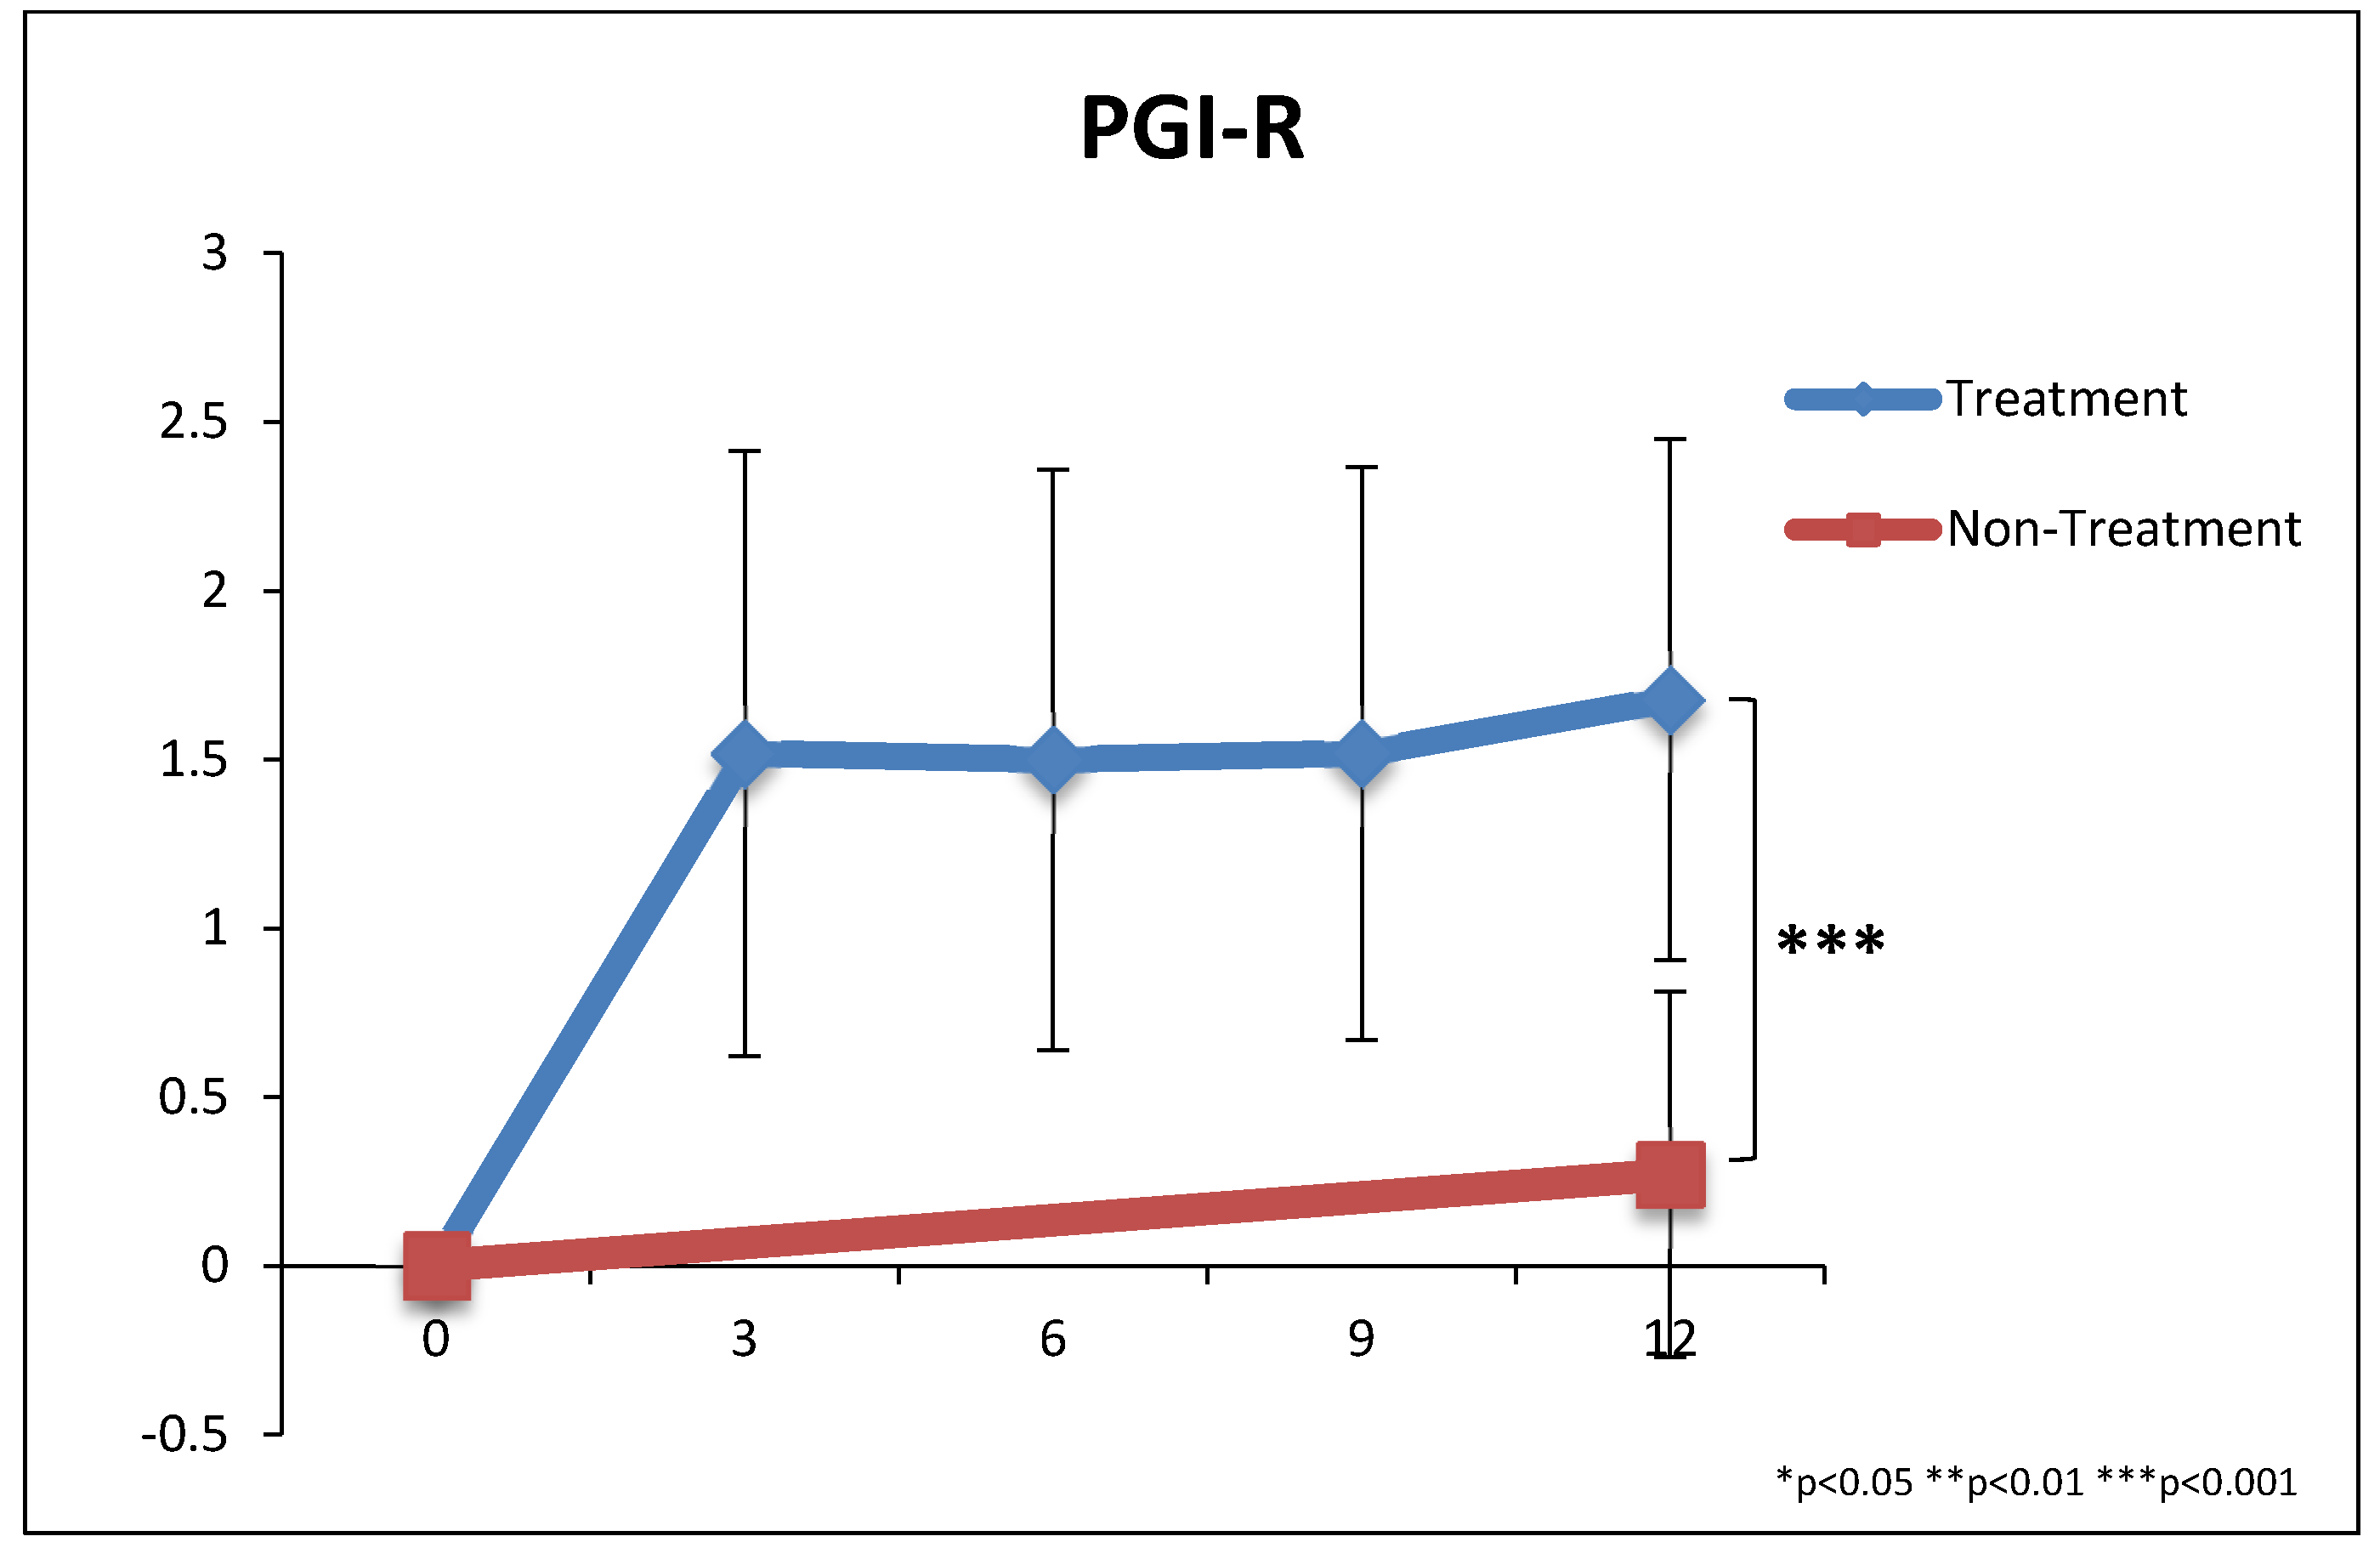
Figure 13.
PGI-R2 scores during the study. The scale goes from −3 (much worse) to 0 (no change) to 1 (slightly better), 2 (better), 3 (much better). Error bars represent standard deviations.
Figure 13.
PGI-R2 scores during the study. The scale goes from −3 (much worse) to 0 (no change) to 1 (slightly better), 2 (better), 3 (much better). Error bars represent standard deviations.
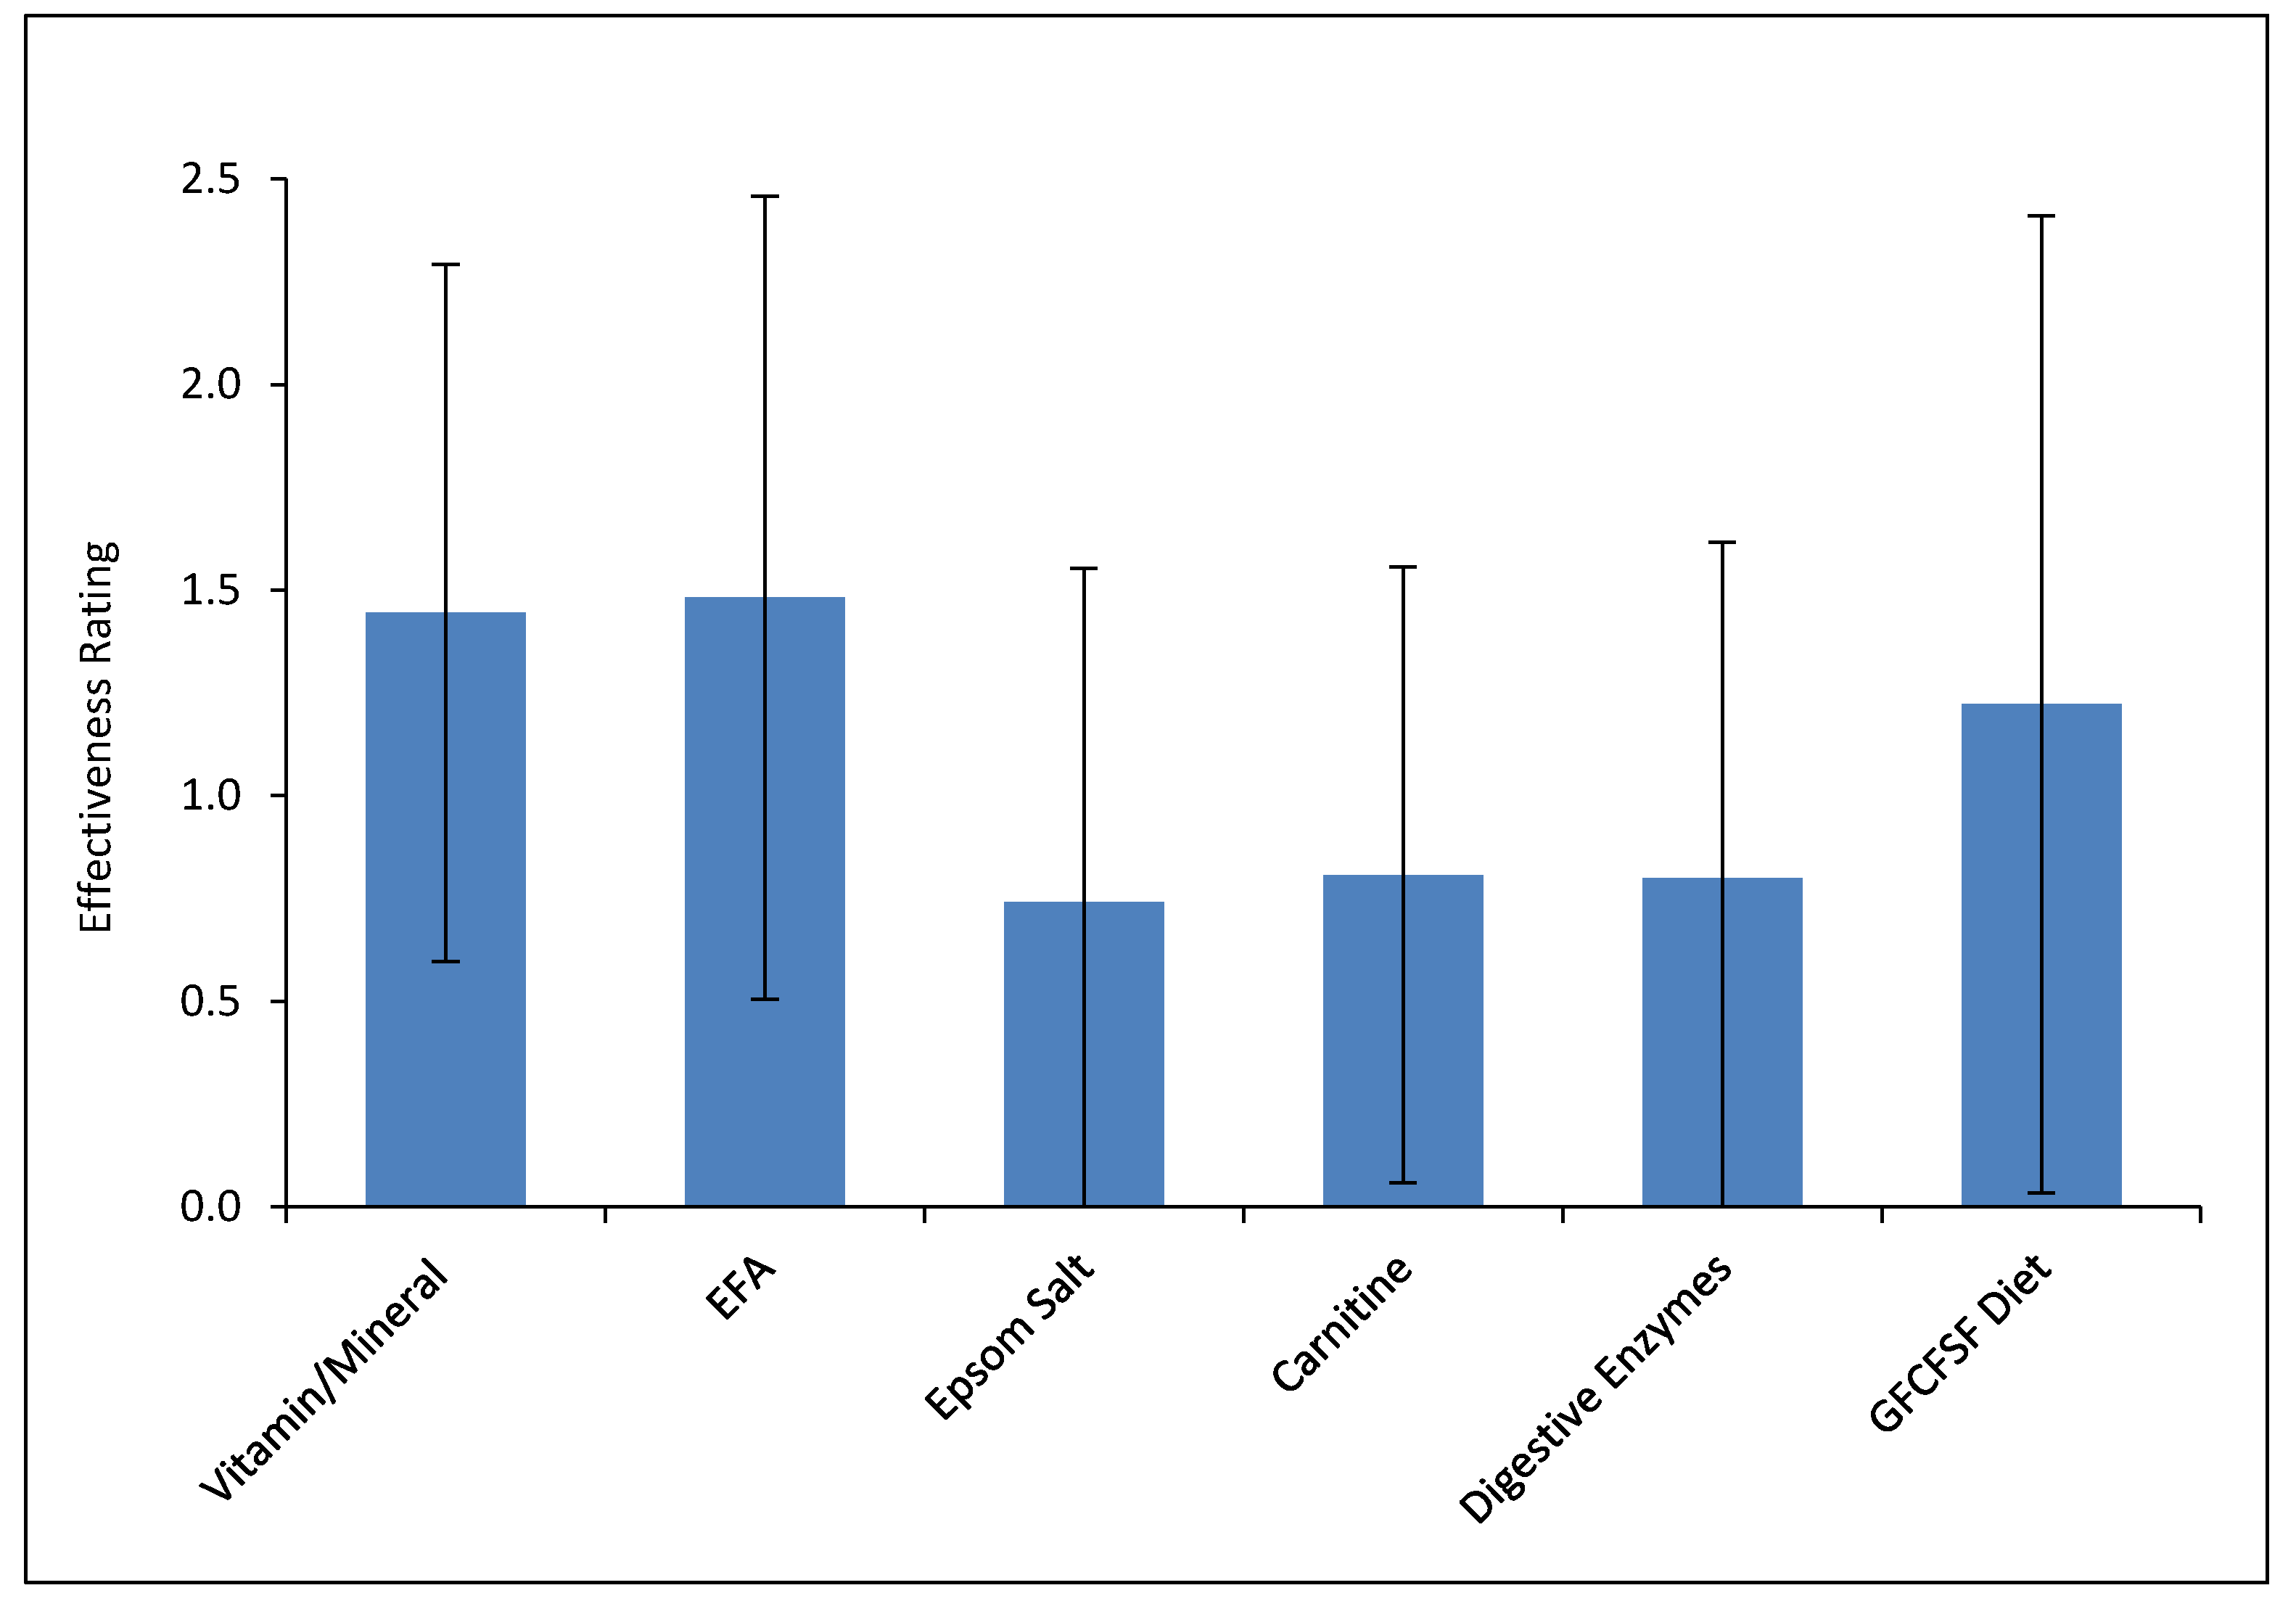
Figure 14.
Effectiveness of each treatment as rated by parents. This is rated on a scale of −3 (much worse) to 0 (no effect) to 1 (slightly better) to 2 (better) to 3 (much better). Error bars represent standard deviations.
Figure 14.
Effectiveness of each treatment as rated by parents. This is rated on a scale of −3 (much worse) to 0 (no effect) to 1 (slightly better) to 2 (better) to 3 (much better). Error bars represent standard deviations.
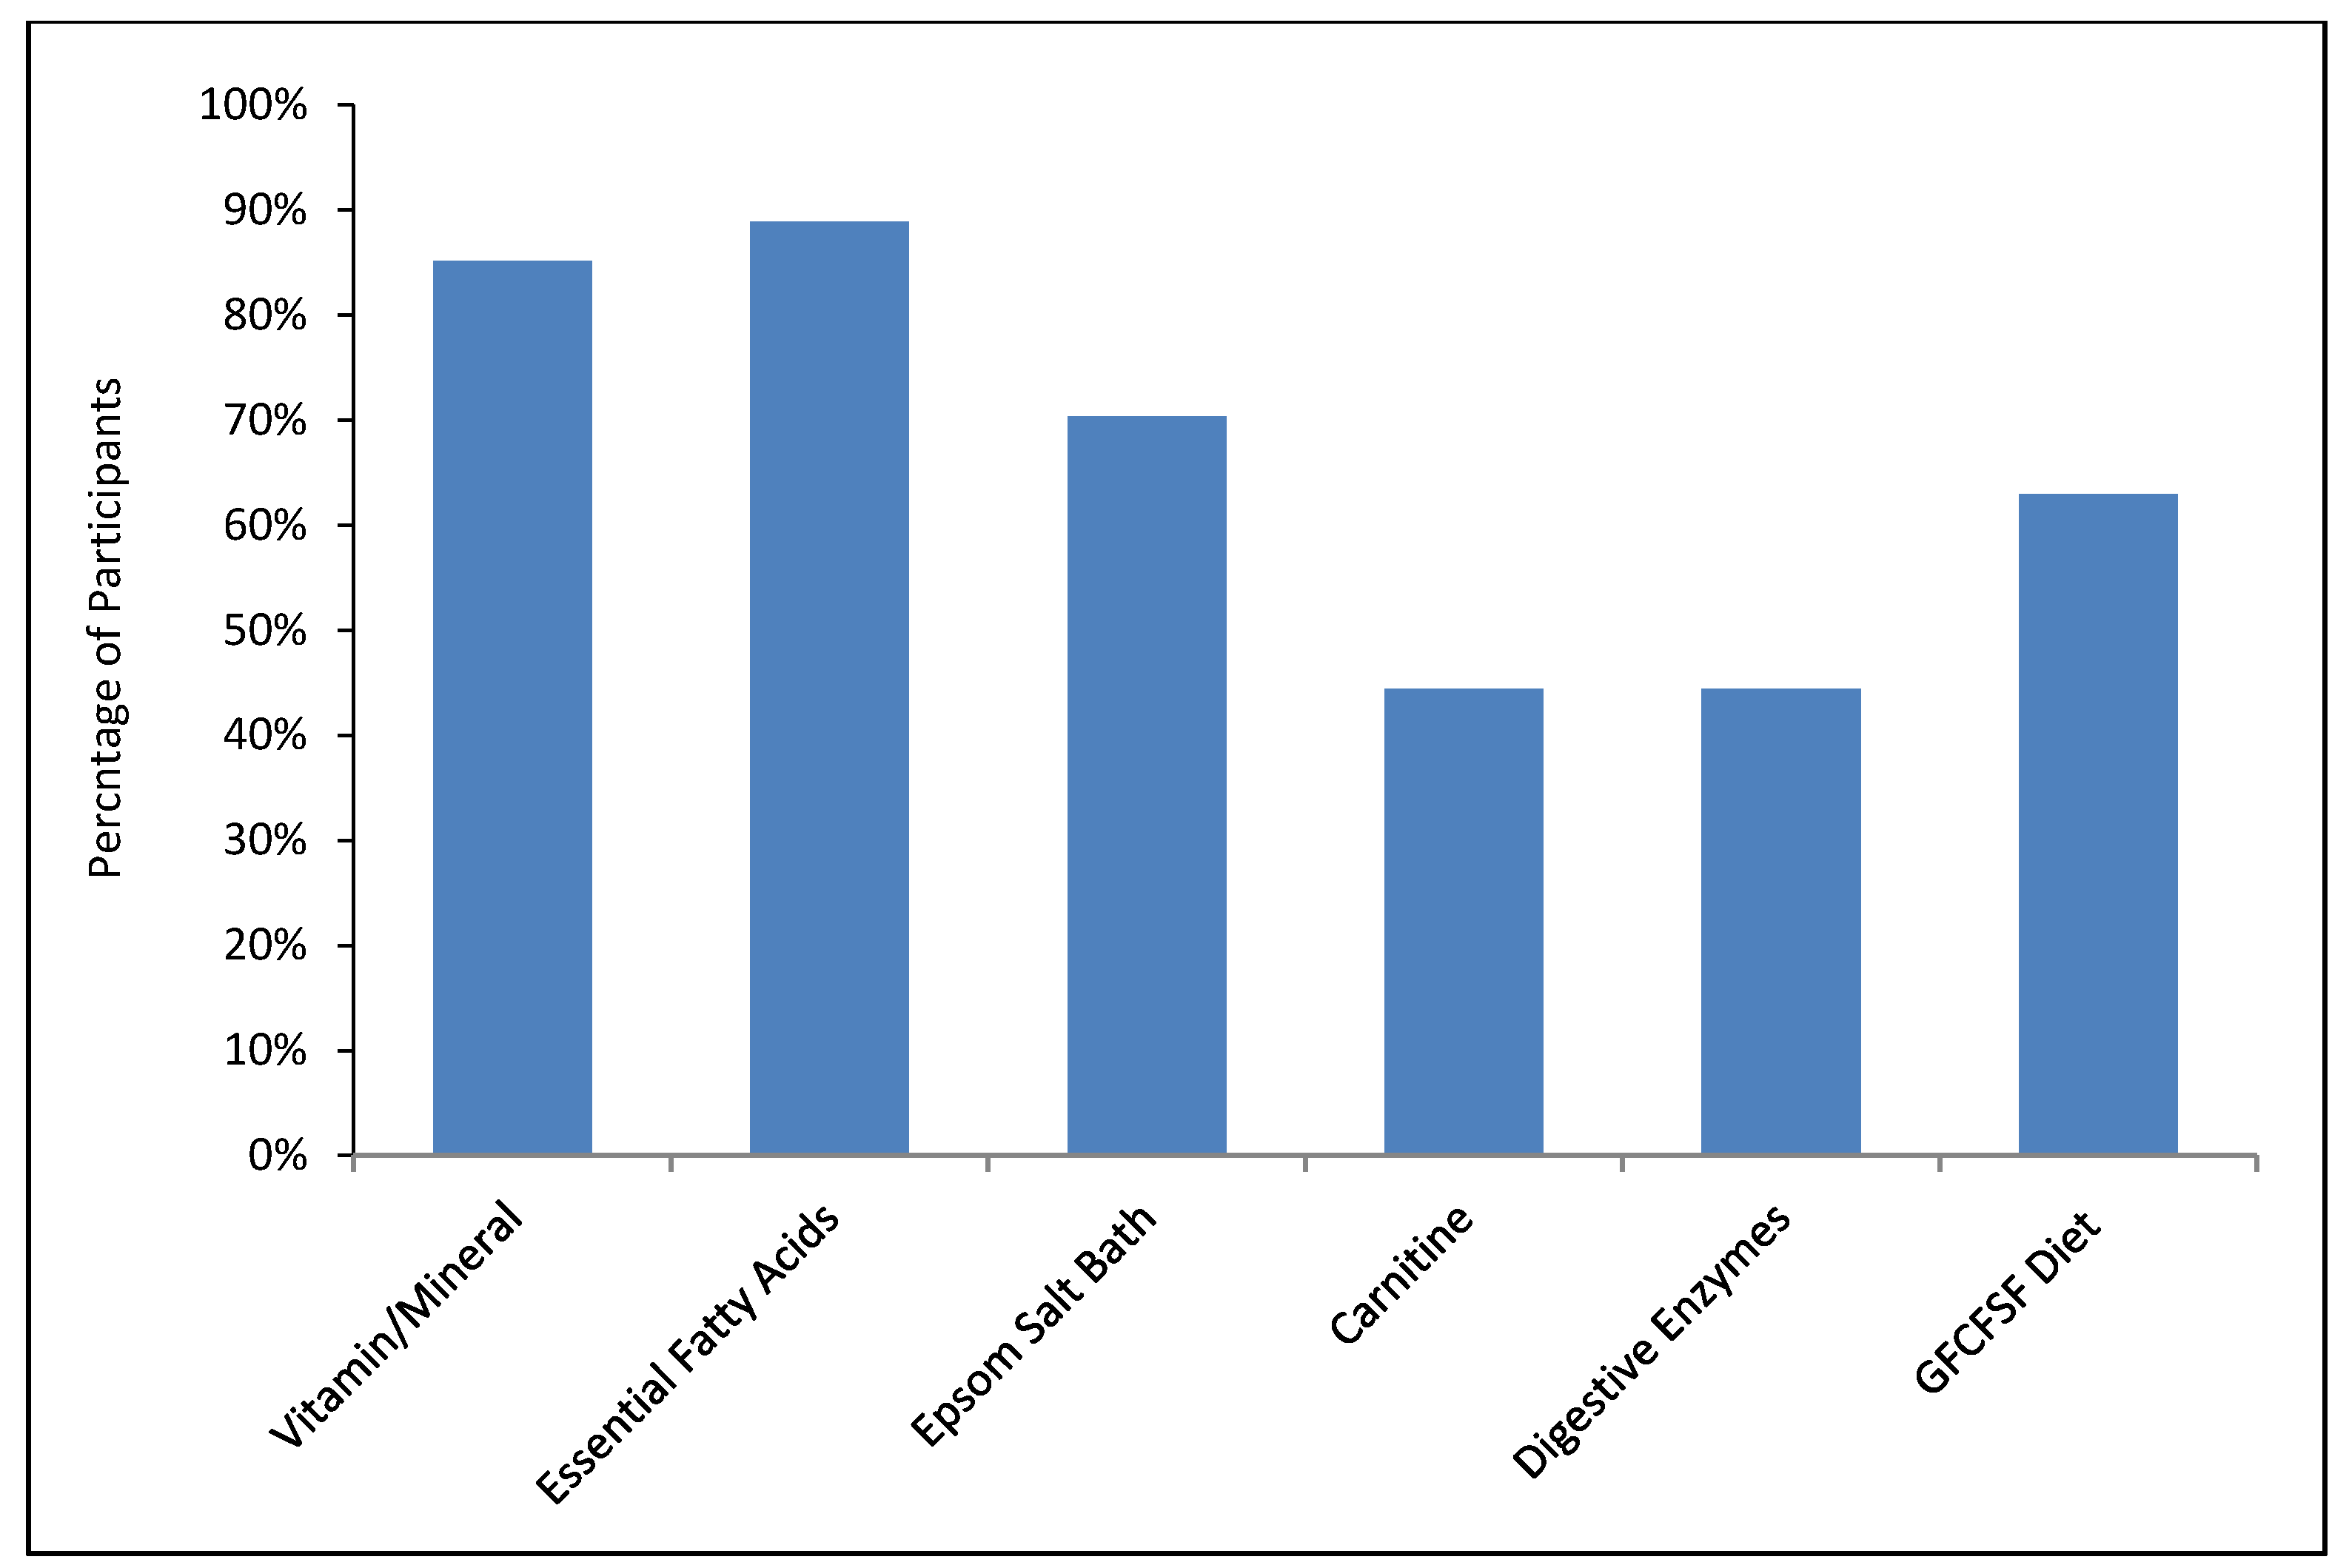
Figure 15.
Percentage of participants who plan to continue each treatment.
Figure 15.
Percentage of participants who plan to continue each treatment.
Table 1.
Participants.
| ASD–Treatment | ASD–Non–Treatment | Neurotypical |
|---|
| Total Participants | 37 | 30 | 50 |
| Male | 30 (81%) | 25 (83%) | 41 (82%) |
| Female | 7 (19%) | 5 (17%) | 9 (18%) |
| Age (years) | 10.8 ± 7.0 | 12.3 ± 10.1 | 12.2 ± 7.5 |
| Children (ages 3–12) | Children n = 28 (76%) | Children n = 20 (67%) | Children n = 34 (68%) |
| Teens (ages 13–20) | Teens n = 6 (16%) | Teens n = 7 (23%) | Teens n = 11 (22%) |
| Adults (ages 20+) | Adults n = 3 (8%) | Adults n = 3 (10%) | Adults n = 5 (10%) |
| Diagnosis | Autism = 29 (83%) | Autism = 21 (70%) | |
| Asperger’s = 3 (9%) | Asperger’s = 5 (17%) |
| PDD-NOS = 3 (9%) | PDD-NOS = 4 (13%) |
| Autism Onset | Regressive = 13 (36%) | Regressive = 9 (31%) | |
| Plateau = 8 (22%) | Plateau = 10 (34%) |
| Early Onset = 15 (42%) | Early Onset = 10 (34%) |
| Asthma | 9 (25%) | 8 (27%) | 8 (16%) |
| Food Allergies | 13 (36%) | 3 (10%) | 2 (4%) |
| Other Allergies | 19 (51%) | 13 (43%) | 15 (30%) |
| Other Health Issues—frequency | 15 (41%) | 14 (47%) | 2 (4%) |
| Other Health Issues—description (note: these are likely under-reported since we only asked a general question about “other health conditions”, and some of these symptoms might be viewed as part of autism) | ADHD-4; sensory problems-3; intellectual disability-2; seizures; early puberty; vascular malformation; mood disorder; spinal fusion; agenesis of lung; gastritis; eczema; apraxia; type 2 diabetes | ADHD-6, cerebral palsy-3, hypotonia-2, learning disability-2, depression-2, dysphagia, sensory disorder, reflux, seizures, sleep disorder, sexual prematurity, type 1 diabetes, OCD, anxiety | nocturnal enuresis; Hashimoto’s thyroiditis |
| Medications (participants taking one or more of the different types of medications) | allergy-6; psych-4; asthma-3; seizure-2; sleep-2; diabetes-1; cholesterol-1; laxative-1 | psych-8; allergy-4; seizure-2; thyroid-2; sleep-2; blood pressure-1; diabetes-1; acne-1 | Allergies-2; asthma-1; thyroid-1 |
Table 2.
Vitamin/Mineral Supplement.
Table 2.
Vitamin/Mineral Supplement.
| Ingredients | Amount |
|---|
| Vitamin A (85% beta carotene and 15% palmitate, IU) | 6500 |
| Vitamin C (from calcium ascorbate, mg) | 500 |
| Vitamin D3 (cholecalciferol, IU) | 1000 |
| Vitamin E (as alpha-tocopherol, IU) | 150 |
| Vitamin K (K1 and K2, mcg) | 55 |
| Vitamin B1 (thiamin hydrochloride, mg) | 20 |
| Vitamin B2 Riboflavin (mg) | 40 |
| Niacin (71% inositol hexanicotinate & 29% niacinamide, mg) | 35 |
| Vitamin B6 (50% as P5P pyridoxal 5 phosphate, 50% as pyridoxine hydrochloride, mg) | 40 |
| Folate (as folic acid, folinic acid, and l-5-methyltetrahydrofolate, mcg) | 600 |
| Vitamin B12 (50% as methylcobalamin & 50% as cyanocobalamin, mcg) | 500 |
| Biotin (mcg) | 225 |
| Pantothenic Acid (calcium d-pantothenate, mg) | 30 |
| Iodine (potassium iodide, mcg) | 100 |
| Lithium (mcg) | 350 |
| Choline (from choline bitartrate, mg) | 250 |
| Inositol (mg) | 100 |
| Calcium (mg) | 70 |
| Magnesium (magnesium citrate, mg) | 100 |
| Zinc (zinc gluconate, mg) | 15 |
| Selenium (selenomethionine and sodium selenite, mcg) | 40 |
| Manganese (manganese amino acid chelate, mg) | 1 |
| Chromium (chromium amino acid chelate, mcg) | 70 |
| Molybdenum (sodium molybdate dihydrate, mcg) | 100 |
| Potassium (from potassium chloride, mg) | 50 |
| MSM (methylsulfonylmethane, mg) | 500 |
| Vitamin E as mixed tocopherols (mg) | 100 |
| CoQ10 (mg) | 50 |
| N-acetyl-cysteine (mg) | 45 |
| Acetyl-l-carnitine (mg) | 200 |
| Vanadium (mcg) | 25 |
| Boron (mcg) | 250 |
Table 3.
Digestive Enzyme Ingredients (1 capsule).
Table 3.
Digestive Enzyme Ingredients (1 capsule).
| Ingredients |
|---|
| Amylase | 3500 DU |
| Peptidase | 13,000 HUT |
| Glucoamylase | 50 AGU |
| Xylanase | 7000 XU |
| Protease 4.5 | 22,000 HUT |
| Protease 3.0 | 35 SAPU |
| Amylase | 1500 DU |
| Invertase | 800 SU |
| Alpha-galactosidase | 100 GalU |
| Lactase | 500 ALU |
| Lipase | 500 FIP |
Table 4.
Professional Evaluations.
Table 4.
Professional Evaluations.
| Treatment Group (n = 28) | Non-Treatment Group (n = 27) | t-Test |
|---|
| Initial | S.D. | Final | S.D. | % Change | Initial | S.D. | Final | S.D. | % Change | |
|---|
| RIAS | | | | | | | | | | | |
| Nonverbal Intelligence Index | 69.6 | 23 | 76.3 | 24 | +10% | 85.8 | 24 | 85.3 | 24 | −1% | 0.01 |
| Verbal Intelligence Index | 63.1 | 24 | 66.0 | 26 | +5% | 77.6 | 24 | 81.5 | 25 | +5% | n.s. |
| Composite Memory Index | 71.3 | 20 | 75.3 | 23 | +6% | 81.0 | 23 | 87.9 | 25 | +8% | n.s. |
| CARS-2 | 39.3 | 5.6 | 33.9 | 7.0 | −22% # | 38.2 | 5.2 | 35.0 | 5.8 | −14% # | 0.03 |
| SAS-Pro | 6.9 | 1.7 | 6.0 | 2.1 | −13% | 6.0 | 1.9 | 5.6 | 2.3 | −6% | 0.04 |
Table 5.
Vineland Adaptive Behavior Scales II (VABS-II).
Table 5.
Vineland Adaptive Behavior Scales II (VABS-II).
| Treatment Group (n = 19) | Non-Treatment Group (n = 16) | t-Test |
|---|
| Initial | S.D. | Final | S.D. | % Change | Initial | S.D. | Final | S.D. | % Change | |
|---|
| Communication | 4.5 | 1.8 | 5.7 | 2.5 | +27% | 5.5 | 2.9 | 5.8 | 2.7 | +5% | 0.01 |
| Receptive | 3.3 | 2.3 | 4.8 | 2.8 | +43% | 3.8 | 2.1 | 4.5 | 2.6 | +17% | 0.09 |
| Expressive | 3.6 | 1.7 | 4.8 | 2.5 | +34% | 4.5 | 2.8 | 4.9 | 2.9 | +9% | 0.06 |
| Written | 6.6 | 2.3 | 7.6 | 2.7 | +16% | 8.2 | 4.1 | 8.1 | 3.1 | −2% | 0.03 |
| Daily Living Skills | 5.3 | 3.4 | 6.9 | 3.7 | +31% | 7.4 | 5.0 | 7.7 | 4.6 | +4% | 0.007 |
| Personal | 4.9 | 3.6 | 6.5 | 4.3 | +34% | 7.5 | 5.5 | 8.3 | 5.6 | +11% | n.s. |
| Domestic | 4.8 | 3.6 | 6.9 | 3.7 | +44% | 7.0 | 4.5 | 7.0 | 4.3 | −1% | 0.002 |
| Community | 6.1 | 4.1 | 7.1 | 3.7 | +18% | 8.2 | 5.5 | 8.4 | 4.5 | +2% | 0.07 |
| Social | 4.4 | 2.8 | 6.2 | 3.8 | +39% | 5.5 | 3.9 | 5.9 | 3.4 | +8% | 0.05 |
| Interpersonal Relationships | 3.5 | 2.5 | 5.6 | 4.2 | +59% | 3.9 | 3.1 | 3.9 | 2.6 | +2% | 0.01 |
| Play and Leisure Time | 4.3 | 2.6 | 5.4 | 2.7 | +25% | 5.4 | 3.5 | 6.9 | 4.2 | +28% | n.s. |
| Coping Skills | 5.5 | 3.9 | 7.5 | 5.3 | +37% | 7.1 | 5.8 | 6.8 | 4.8 | −5% | 0.03 |
| Motor Skills | 4.4 | 1.3 | 5.1 | 1.0 | +15% | 5.1 | 1.6 | 5.7 | 1.0 | +12% | n.s. |
| Gross Motor | 4.0 | 1.3 | 4.5 | 1.2 | +13% | 4.8 | 1.6 | 5.6 | 1.3 | +16% | n.s. |
| Fine Motor | 4.8 | 1.6 | 5.6 | 1.2 | +17% | 5.4 | 1.6 | 5.8 | 1.0 | +9% | n.s. |
| Average VABS (excluding motor skills) | 4.7 | 2.5 | 6.3 | 3.2 | +32% | 6.1 | 3.7 | 6.5 | 3.4 | +6% | 0.008 |
Table 6.
Pervasive Developmental Disorders Behavior Inventory (PDD-BI).
Table 6.
Pervasive Developmental Disorders Behavior Inventory (PDD-BI).
| Treatment Group (n = 27) | Non-Treatment Group (n = 26) | t-Test |
|---|
| Initial | S.D. | Final | S.D. | % Change | Initial | S.D. | Final | S.D. | % Change | |
|---|
| Maladaptive Behaviors—higher scores mean worse problems |
| Sensory | 24.4 | 14.1 | 18.7 | 12.3 | −23% | 14.4 | 11.0 | 13.7 | 11.2 | −5% | 0.001 |
| Ritual | 18.9 | 7.2 | 13.9 | 7.6 | −27% | 15.4 | 7.8 | 15.1 | 8.1 | −2% | 0.001 |
| SOCPP | 20.6 | 7.8 | 16.1 | 8.2 | −22% | 17.3 | 6.7 | 16.3 | 6.6 | −6% | 0.008 |
| SEMPP | 20.1 | 7.8 | 17.3 | 7.7 | −14% | 15.2 | 6.8 | 14.5 | 6.5 | −5% | 0.08 |
| AROUSE | 20.7 | 7.2 | 16.3 | 7.8 | −21% | 17.4 | 7.2 | 17.0 | 7.2 | −2% | 0.002 |
| FEARS | 23.4 | 9.0 | 18.7 | 9.4 | −20% | 24.4 | 8.1 | 23.4 | 8.8 | −4% | 0.03 |
| AGG | 18.6 | 12.4 | 14.2 | 11.0 | −24% | 14.0 | 11.0 | 14.8 | 11.2 | 5% | 0.002 |
| Adaptive Behaviors—higher scores mean higher ability |
| SOCAPP | 62.8 | 22.2 | 74.2 | 23.3 | +18% | 68.2 | 20.1 | 73.3 | 17.3 | +8% | 0.02 |
| EXPRESS | 57.4 | 24.7 | 66.1 | 24.2 | +15% | 66.8 | 24.3 | 70.5 | 21.0 | +5% | 0.004 |
| LMRL | 27.4 | 8.9 | 29.6 | 8.6 | +8% | 27.1 | 8.6 | 28.1 | 7.9 | +4% | 0.07 |
| Modified Autism Composite | −56.3 | 57.7 | −91.6 | 60.7 | −21% # | −85.2 | 53.0 | −96.0 | 50.2 | −5% # | 0.0002 |
Table 7.
Autism Treatment Evaluation Checklist (ATEC).
Table 7.
Autism Treatment Evaluation Checklist (ATEC).
| Treatment Group (n = 27) | Non-Treatment Group (n = 26) | t-Test |
|---|
| Initial | S.D. | Final | S.D. | % Change | Initial | S.D. | Final | S.D. | % Change | |
|---|
| Speech Communication | 9.4 | 5.8 | 6.0 | 4.8 | −36% | 7.0 | 6.5 | 6.0 | 5.9 | −14% | 0.0007 |
| Sociability | 16.5 | 8.2 | 11.4 | 7.1 | −31% | 15.9 | 5.9 | 15.2 | 7.0 | −5% | 0.003 |
| Sensory/Cognitive Awareness | 16.6 | 6.6 | 11.7 | 5.6 | −30% | 12.3 | 6.9 | 11.6 | 6.8 | −6% | 0.00002 |
| Health/Physical/Behavior | 28.4 | 11.7 | 21.7 | 12.0 | −24% | 22.9 | 7.6 | 22.1 | 7.6 | −4% | 0.0009 |
| Total ATEC Score | 70.9 | 25.7 | 50.8 | 24.2 | −28% | 58.2 | 20.7 | 54.8 | 22.7 | −6% | 0.00004 |
Table 8.
Aberrant Behavior Checklist.
Table 8.
Aberrant Behavior Checklist.
| Treatment Group (n = 27) | Non-Treatment Group (n = 25) | t-Test |
|---|
| Initial | S.D. | Final | S.D. | % Change | Initial | S.D. | Final | S.D. | % Change | |
|---|
| Irritability | 16.0 | 10.0 | 12.8 | 9.2 | −20% | 12.0 | 10 | 11.6 | 10.0 | −4% | 0.02 |
| Lethargy/Social Withdrawal | 14.9 | 10.6 | 10.1 | 8.5 | −32% | 14.1 | 7.6 | 12.5 | 7.3 | −11% | 0.01 |
| Stereotypy | 7.6 | 4.9 | 5.2 | 4.1 | −31% | 6.5 | 4.8 | 5.7 | 4.9 | −12% | 0.01 |
| Hyperactivity | 24.2 | 13.0 | 18.3 | 11.7 | −24% | 18.5 | 13 | 18.0 | 12.9 | −3% | 0.0001 |
| Inappropriate Speech | 6.4 | 3.3 | 5.1 | 3.1 | −21% | 4.0 | 2.9 | 3.6 | 2.9 | −9% | 0.05 |
| Total ABC Score | 68.9 | 33.5 | 51.4 | 31.7 | −26% | 55.0 | 27 | 51.4 | 27.5 | −7% | 0.001 |
Table 9.
Social Responsiveness Scale (SRS).
Table 9.
Social Responsiveness Scale (SRS).
| Treatment Group (n = 27) | Non-Treatment Group (n = 25) | t-Test |
|---|
| Initial | S.D. | Final | S.D. | % Change | Initial | S.D. | Final | S.D. | % Change | |
|---|
| Awareness | 15.0 | 4.1 | 13.4 | 4.0 | −11% | 12.4 | 2.7 | 11.7 | 2.5 | −6% | n.s. |
| Cognition | 21.4 | 6.4 | 18.6 | 7.4 | −13% | 18.8 | 4.1 | 18.3 | 4.5 | −3% | 0.01 |
| Communication | 38.8 | 11.6 | 33.2 | 12.4 | −14% | 34.5 | 6.8 | 33.3 | 8.0 | −4% | 0.01 |
| Motivation | 17.3 | 6.1 | 14.5 | 6.1 | −16% | 17.6 | 4.7 | 16.8 | 4.7 | −5% | 0.03 |
| Mannerisms | 23.3 | 6.1 | 20.0 | 7.0 | −14% | 20.7 | 6.4 | 20.6 | 6.8 | 0% | 0.02 |
| Total SRS | 115.7 | 30.6 | 99.7 | 33.7 | −14% | 104.0 | 18.2 | 100.6 | 21.4 | −3% | 0.01 |
Table 10.
Short Sensory Profile.
Table 10.
Short Sensory Profile.
| Treatment Group (n = 27) | Non-Treatment Group (n = 26) | t-Test |
|---|
| Initial | S.D. | Final | S.D. | % Change | Initial | S.D. | Final | S.D. | % Change | |
|---|
| Tactile Sensitivity | 22.7 | 5.9 | 26.4 | 5.2 | +16% | 24.1 | 4.9 | 25.2 | 5.1 | +4% | 0.007 |
| Taste/Smell Sensitivity | 10.5 | 6.0 | 11.8 | 5.3 | +12% | 11.1 | 5.4 | 11.5 | 5.5 | +3% | 0.05 |
| Movement Sensitivity | 11.2 | 4.4 | 11.7 | 4.0 | +4% | 10.8 | 3.5 | 10.6 | 3.3 | −1% | 0.06 |
| Underresponsiveness/Seeks Sensation | 17.9 | 6.9 | 20.5 | 5.5 | +14% | 22.0 | 7.1 | 22.3 | 7.3 | +2% | 0.006 |
| Auditory Filtering | 16.2 | 4.7 | 18.9 | 5.1 | +16% | 16.2 | 5.5 | 16.0 | 5.3 | −1% | 0.0003 |
| Low Energy/Weak | 19.3 | 7.5 | 20.4 | 7.3 | +6% | 17.5 | 7.1 | 17.9 | 7.4 | +2% | n.s. |
| Visual/Auditory Sensitivity | 14.9 | 4.8 | 16.9 | 4.5 | +13% | 16.0 | 4.1 | 16.0 | 4.2 | 0% | 0.004 |
| Total SSP | 113 | 27 | 127 | 27 | +12% | 118 | 20 | 120 | 21 | +2% | 0.0003 |
Table 11.
Parent Global Impressions 2 (PGI 2).
Table 11.
Parent Global Impressions 2 (PGI 2).
| | Treatment n = 28 | | Non-Treatment n = 26 | t-Test |
|---|
| n for Each Symptom at Start of Study | Change | S.D. | n for Each Symptom at Start of Study | Change | S.D. | |
|---|
| Expressive Language/Speech | 27 | 1.7 | 0.8 | 25 | 0.3 | 0.9 | 0.0000006 |
| Receptive Language/Comprehension | 26 | 1.9 | 0.9 | 26 | 0.3 | 0.7 | 0.000000003 |
| Play Skills | 27 | 1.5 | 0.8 | 24 | 0.3 | 0.8 | 0.0000008 |
| Cognition Thinking | 28 | 1.6 | 0.9 | 24 | 0.4 | 0.7 | 0.000003 |
| Attention Focus | 28 | 1.5 | 1.1 | 25 | 0.3 | 0.9 | 0.00006 |
| Stools/GI Issues | 24 | 0.9 | 1.5 | 19 | −0.1 | 0.6 | 0.003 |
| Sleep | 22 | 0.9 | 1.2 | 16 | −0.2 | 1.2 | 0.01 |
| Sociability | 28 | 1.4 | 1.0 | 25 | 0.1 | 0.8 | 0.000009 |
| Hyperactivity | 23 | 0.9 | 1.0 | 16 | −0.3 | 0.6 | 0.00008 |
| Tantruming | 23 | 1.2 | 1.3 | 19 | −0.1 | 1.3 | 0.003 |
| Eye Contact | 27 | 1.4 | 0.9 | 25 | 0.2 | 0.8 | 0.000003 |
| Mood/Happines | 24 | 1.6 | 1.0 | 23 | 0.1 | 0.9 | 0.000003 |
| Anxiety | 27 | 0.9 | 1.3 | 25 | −0.2 | 1.0 | 0.002 |
| Stimming/Preservation | 28 | 1.1 | 1.0 | 22 | −0.1 | 0.8 | 0.00001 |
| Sound Sensitivity | 26 | 1.0 | 1.0 | 23 | 0.1 | 0.5 | 0.0002 |
| Aggression | 21 | 0.9 | 1.2 | 16 | −0.3 | 1.3 | 0.01 |
| Self-Abusive | 16 | 0.8 | 1.4 | 12 | −0.2 | 1.5 | 0.089 |
| Overall | 28 | 1.68 | 0.77 | 26 | 0.27 | 0.92 | 0.0000002 |
| Average | 28 | 1.2 | 0.7 | 27 | 0.1 | 0.5 | 0.00000003 |
Table 12.
6-Item Gastrointestinal Symptom Index (6-GSI).
Table 12.
6-Item Gastrointestinal Symptom Index (6-GSI).
| Treatment Group (n = 22) | Non-Treatment Group (n = 20) | t-Test |
|---|
| Initial | S.D. | Final | S.D. | % Change | Initial | S.D. | Final | S.D. | % Change | |
|---|
| Constipation | 0.6 | 0.8 | 0.4 | 0.5 | −43% | 1.1 | 0.8 | 1.0 | 0.7 | −14% | n.s. |
| Diarrhea | 0.3 | 0.6 | 0.1 | 0.3 | −67% | 0.1 | 0.2 | 0.0 | 0.0 | −100% | n.s. |
| Average Stool Consistency | 0.4 | 0.5 | 0.3 | 0.5 | −13% | 0.3 | 0.5 | 0.2 | 0.4 | −50% | n.s. |
| Stool Smell | 0.7 | 0.8 | 0.4 | 0.6 | −44% | 0.8 | 0.9 | 0.9 | 1.0 | +20% | 0.020 |
| Flatulence | 1.0 | 0.8 | 0.9 | 0.8 | −13% | 1.1 | 0.8 | 1.0 | 0.9 | −10% | n.s. |
| Abdominal Pain | 0.3 | 0.6 | 0.3 | 0.6 | −14% | 0.4 | 0.5 | 0.4 | 0.6 | −13% | n.s. |
| Total Severity Score | 3.4 | 1.8 | 2.4 | 1.8 | −30% | 3.7 | 1.8 | 3.3 | 2.2 | −10% | 0.050 |
Table 13.
Handgrip Strength.
Table 13.
Handgrip Strength.
| Treatment Group (n = 28) | Non-Treatment Group (n = 25) | t-Test |
|---|
| Initial | S.D. | Final | S.D. | % Change | Initial | S.D. | Final | S.D. | % Change | |
|---|
| Handgrip Strength | 40.3 | 26.6 | 41.8 | 21.5 | +4% | 44.8 | 24.9 | 46.7 | 22.5 | +4% | n.s. |
Table 14.
Complete Blood Count.
Table 14.
Complete Blood Count.
| Treatment Group (n = 25) | Non-Treatment Group (n = 21) | t-Test |
|---|
| Initial | S.D. | Final | S.D. | % Change | Initial | S.D. | Final | S.D. | % Change | |
|---|
| WBC (×103/uL) | 6.86 | 2.02 | 6.88 | 2.41 | 0% | 6.08 | 1.57 | 5.79 | 1.57 | −5% | n.s. |
| RBC (×106/uL) | 4.98 | 0.50 | 4.89 | 0.52 | −2% | 4.92 | 0.31 | 4.93 | 0.28 | 0% | 0.04 |
| Hemogoblin (g/dL) | 14.2 | 1.44 | 14.1 | 1.55 | −1% | 14.1 | 1.12 | 14.2 | 1.10 | +1% | n.s. |
| Hematocrit (%) | 41.4 | 3.91 | 41.2 | 4.26 | −1% | 41.3 | 2.92 | 41.4 | 2.73 | 0% | n.s. |
| MCV (fL) | 83.4 | 5.70 | 84.4 | 5.96 | +1% | 84.0 | 2.78 | 84.0 | 2.94 | 0% | 0.02 |
| MCH (pg) | 28.5 | 2.09 | 28.8 | 2.23 | +1% | 28.6 | 1.33 | 28.7 | 1.33 | 0% | n.s. |
| MCHC (g/dL) | 34.2 | 0.71 | 34.1 | 0.76 | −0% | 34.1 | 0.81 | 34.2 | 0.96 | 0% | n.s. |
| RDW (%) | 13.7 | 0.68 | 13.5 | 0.71 | −1% | 13.6 | 0.77 | 13.5 | 0.69 | −1% | n.s. |
| Platelets (×103/uL) | 319 | 75.5 | 311 | 87.3 | −3% | 285 | 59.7 | 296 | 72.9 | 4% | n.s. |
| Neutrophils (Absolute) (×103/uL) | 3.34 | 1.46 | 3.58 | 1.88 | +7% | 2.86 | 1.05 | 2.70 | 0.93 | −6% | n.s. |
| Lymphs (Absolute) (×103/uL) | 2.65 | 0.94 | 2.47 | 1.03 | −7% | 2.46 | 0.93 | 2.40 | 0.85 | −3% | n.s. |
| Monocytes (Absolute) (×103/uL) | 0.56 | 0.16 | 0.58 | 0.19 | +4% | 0.50 | 0.16 | 0.45 | 0.14 | −11% | 0.08 |
| Eos (Absolute) (×103/uL) | 0.27 | 0.30 | 0.21 | 0.21 | −24% | 0.24 | 0.17 | 0.21 | 0.16 | −12% | n.s. |
| Baso (Absolute) (×103/uL) | 0.04 | 0.05 | 0.02 | 0.04 | −33% | 0.01 | 0.04 | 0.01 | 0.04 | 0% | n.s. |
| Immature Granulocytes (%) | 0.00 | 0.00 | 0.00 | 0.00 | | 0.00 | 0.00 | 0.00 | 0.00 | | |
| Immature Grans (Absolute) (×103/uL) | 0.00 | 0.00 | 0.00 | 0.00 | | 0.00 | 0.00 | 0.00 | 0.00 | | |
Table 15.
Blood Chemistry.
Table 15.
Blood Chemistry.
| Treatment Group (n = 25) | Non-Treatment Group (n = 21) | t-Test |
|---|
| Initial | S.D. | Final | S.D. | % Change | Initial | S.D. | Final | S.D. | % Change | |
|---|
| Glucose, Serum (mg/dL) | 87.6 | 5.63 | 90.0 | 8.98 | +3% | 92.7 | 28.1 | 95.6 | 21.9 | +3% | n.s. |
| BUN (mg/dL) | 13.5 | 3.77 | 11.3 | 3.77 | −16% | 13.3 | 3.29 | 14.0 | 3.56 | +5% | 0.01 |
| Creatinine, Serum (mg/dL) | 0.61 | 0.22 | 0.62 | 0.21 | 0% | 0.61 | 0.18 | 0.65 | 0.21 | +6% | n.s. |
| BUN/Creatinine Ratio | 25.0 | 11.8 | 20.3 | 8.53 | −19% | 23.4 | 9.83 | 24.0 | 12.1 | +3% | 0.04 |
| Sodium, Serum (mmol/L) | 139 | 2.39 | 140 | 2.64 | +1% | 139 | 4.04 | 139 | 2.19 | 0% | n.s. |
| Potassium, Serum (mmol/L) | 4.28 | 0.28 | 4.01 | 0.25 | −6% | 4.09 | 0.32 | 4.05 | 0.30 | −1% | 0.02 |
| Chloride, Serum (mmol/L) | 101 | 2.60 | 101 | 2.64 | 0% | 102 | 2.75 | 103 | 2.68 | +1% | n.s. |
| Carbon Dioxide, Serum (mmol/L) | 19.7 | 2.04 | 20.7 | 2.36 | +5% | 20.5 | 1.82 | 20.4 | 2.72 | −0% | n.s. |
| Calcium, Serum (mmol/L) | 10.1 | 0.43 | 9.96 | 0.41 | −2% | 10.1 | 0.49 | 9.8 | 0.62 | −4% | n.s. |
| Protein, Total, Serum (g/dL) | 7.07 | 0.47 | 7.22 | 0.49 | +2% | 7.04 | 0.47 | 7.08 | 0.51 | +1% | n.s. |
| Albunim spp., Serum (g/dL) | 4.49 | 0.40 | 4.58 | 0.31 | +2% | 4.33 | 0.38 | 4.54 | 0.21 | +5% | n.s. |
| Globulin, Total (g/dL) | 2.58 | 0.36 | 2.64 | 0.37 | +2% | 2.71 | 0.58 | 2.55 | 0.41 | −6% | 0.02 |
| A/G Ratio | 1.78 | 0.33 | 1.77 | 0.27 | −1% | 1.70 | 0.47 | 1.83 | 0.28 | +7% | n.s. |
| Bilirubin, Total (mg/dL) | 0.36 | 0.23 | 0.46 | 0.35 | +29% | 0.34 | 0.12 | 0.34 | 0.12 | 0% | 0.08 |
| Alkaline Phosphatase, S (IU/L) | 204 | 90.0 | 184 | 87.1 | −10% | 221 | 111 | 200 | 92.2 | −9% | n.s. |
| AST (SGOT) (IU/L) | 26.2 | 6.74 | 28.4 | 12.8 | +8% | 24.7 | 6.38 | 23.4 | 7.43 | −6% | n.s. |
| ALT (SGPT) (IU/L) | 22.1 | 10.5 | 26.1 | 21.2 | +18% | 18.9 | 9.58 | 20.5 | 11.9 | +9% | n.s. |
| Ammonia, Plasma (ug/dL) | 79.3 | 39.57 | 76.70 | 26.06 | −3% | 64.1 | 29.5 | 76.0 | 23.4 | +19% | n.s. |
| Creatine Kinase, Total, Serum (U/L) | 117 | 49.7 | 111 | 55.0 | −6% | 102 | 38.3 | 113 | 56.3 | +11% | n.s. |
| Lactic Acid, Plasma (mg/dL) | 16.9 | 10.1 | 16.7 | 12.5 | −1% | 13.0 | 6.22 | 13.3 | 11.4 | +2% | n.s. |
| TSH (uIU/mL) | 2.30 | 0.99 | 2.55 | 1.30 | +11% | 2.11 | 1.07 | 2.16 | 0.94 | +2% | n.s. |
| Triiodothyronine, Free, Serum (pg/mL) | 4.07 | 0.50 | 4.12 | 0.66 | +1% | 3.95 | 0.58 | 4.05 | 0.63 | +3% | n.s. |
| T4, Free (Direct) (ng/dL) | 1.33 | 0.15 | 1.32 | 0.14 | −1% | 1.27 | 0.19 | 1.21 | 0.20 | −5% | n.s. |
Table 16.
Red Blood Cell Fatty Acids.
Table 16.
Red Blood Cell Fatty Acids.
| Average—Treatment (n = 25) | Average—Non-Treatment (n = 24) | t-Test |
|---|
| Initial | SD | Final | SD | % Change | Initial | SD | Final | SD | % Change | |
|---|
| Arachidonic Acid (μmol/L) | 910 | 89 | 727 | 99 | −20% | 911 | 66 | 899 | 99 | −1% | 0.0000001 |
| Dihomo-g-linolenic (μmol/L) | 95 | 22 | 84 | 16 | −12% | 95 | 22 | 97 | 17 | +2% | 0.003 |
| Docosahexaenoic acid (μmol/L) | 175 | 58 | 320 | 78 | +83% | 183 | 54 | 207 | 54 | +13% | 0.000000001 |
| Eicosapentaenoic (μmol/L) | 21 | 13 | 130 | 60 | +525% | 17 | 7.4 | 20 | 8.0 | +22% | 0.000000001 |
| Elaidic (μmol/L) | 8.7 | 1.8 | 6.4 | 1.7 | −26% | 8.3 | 2.3 | 7.3 | 1.7 | −12% | 0.03 |
| Linoleic (μmol/L) | 670 | 93 | 568 | 90 | −15% | 622 | 98 | 617 | 77 | −1% | 0.0001 |
| Oleic (μmol/L) | 650 | 77 | 725 | 75 | +11% | 619 | 35 | 670 | 44 | +8% | n.s. |
| Palmitelaidic (μmol/L) | 0.92 | 0.23 | 0.76 | 0.17 | −17% | 0.89 | 0.23 | 0.74 | 0.20 | −17% | n.s. |
| Palmitic (μmol/L) | 1194 | 108 | 1197 | 75 | 0% | 1136 | 101 | 1153 | 65 | +1% | n.s. |
| Palmitoleic (μmol/L) | 10.9 | 3.9 | 9.6 | 4.4 | −13% | 11.2 | 4.2 | 12.4 | 5.4 | +11% | 0.01 |
| Stearic (μmol/L) | 885 | 82 | 833 | 40 | −6% | 872 | 55 | 862 | 55 | −1% | 0.08 |
Table 17.
Vitamin Levels.
Table 17.
Vitamin Levels.
| Average—Treatment (n = 27) | Average—Non-Treatment (n = 26) | t-Test |
|---|
| Initial | S.D. | Final | S.D. | % Change | Initial | S.D. | Final | S.D. | % Change | |
|---|
| Vit B2 (riboflavin) | 0.69 | 0.22 | 2.53 | 1.36 | +268% | 1.18 | 0.68 | 0.98 | 0.67 | −17% | 0.00000001 |
| Vit B3 (niacinamide) | 1.31 | 0.85 | 1.34 | 0.87 | +2% | 0.99 | 0.43 | 1.14 | 0.47 | +14% | n.s. |
| Vit B5 (pantothenic acid) | 1.01 | 1.28 | 4.54 | 3.21 | +351% | 0.86 | 0.65 | 1.63 | 1.34 | +90% | 0.0002 |
| Vit B6 (4-pyridoxic acid) | 1.21 | 1.30 | 6.45 | 3.85 | +435% | 1.21 | 1.29 | 1.29 | 1.07 | +6% | 0.000001 |
| Vit B6 (pyridoxine) | 1.21 | 0.55 | 1.51 | 0.73 | +25% | 1.26 | 0.75 | 0.85 | 0.42 | −33% | 0.008 |
| Folic acid | 0.65 | 0.61 | 1.42 | 1.07 | +119% | 1.10 | 1.25 | 0.73 | 1.86 | −34% | 0.02 |
| B12-(cyanocobalamin) | 0.86 | 0.49 | 1.24 | 0.54 | +44% | 0.94 | 0.41 | 0.90 | 0.26 | −5% | 0.006 |
| B12-(methylcobalamin) | 0.98 | 0.49 | 1.08 | 0.57 | +9% | 0.96 | 0.34 | 0.99 | 0.44 | +3% | n.s. |
| Vit C (ascorbic acid) | 0.79 | 0.32 | 1.18 | 0.56 | +48% | 0.81 | 0.49 | 1.01 | 0.50 | +24% | n.s. |
| Vit D3 | 1.03 | 0.63 | 1.12 | 0.44 | +9% | 0.85 | 0.29 | 1.00 | 0.37 | +18% | n.s. |
| Vit K2 | 0.97 | 0.55 | 1.22 | 0.47 | +26% | 0.83 | 0.54 | 1.09 | 0.44 | +32% | n.s. |
| Choline | 1.08 | 0.41 | 0.99 | 0.30 | −8% | 1.01 | 0.27 | 0.88 | 0.24 | −12% | n.s. |
| Myoinositol | 1.25 | 0.46 | 1.48 | 0.74 | +19% | 0.98 | 0.27 | 1.05 | 0.40 | +7% | n.s. |
| CoQ10 (oxidized) | 1.35 | 0.86 | 1.18 | 0.64 | −13% | 1.30 | 0.65 | 1.49 | 0.97 | +15% | n.s. |
| CoQ10 (reduced form, CoQ10H2) | 0.94 | 0.62 | 1.63 | 0.79 | +72% | 1.31 | 0.85 | 1.05 | 0.66 | −20% | 0.001 |
Table 18.
RBC Elements.
| Treatment Group (n = 26) | Non-Treatment Group (n = 24) | t-Test |
|---|
| Initial | S.D. | Final | S.D. | % Change | Initial | S.D. | Final | S.D. | % Change | |
|---|
| Ca (μg/g) | 18.0 | 4.0 | 17.0 | 3.0 | −5% | 17.0 | 4.0 | 17.0 | 5.0 | +3% | n.s. |
| Mg (μg/g) | 46.0 | 4.0 | 46.0 | 5.0 | 0% | 46.0 | 4.0 | 48.0 | 4.0 | +3% | n.s. |
| K (mEq/L) | 78.0 | 4.0 | 78.0 | 4.0 | 0% | 78.0 | 5.0 | 77.0 | 3.0 | −1% | n.s. |
| P (μg/g) | 599 | 36.0 | 580 | 43.0 | −3% | 597 | 50.0 | 581 | 44.0 | −3% | n.s. |
| Cu (μg/g) | 0.7 | 0.1 | 0.7 | 0.1 | +7% | 0.7 | 0.1 | 0.7 | 0.1 | +4% | n.s. |
| Zn (μg/g) | 9.6 | 1.5 | 9.6 | 1.5 | 0% | 9.5 | 1.1 | 9.5 | 1.2 | −1% | n.s. |
| Fe (μg/g) | 865 | 47.0 | 858 | 30.0 | −1% | 865 | 47.0 | 853 | 37.0 | −1% | n.s. |
| Mn (μg/g) | 0.02 | 0.01 | 0.02 | 0.01 | +2% | 0.02 | 0.01 | 0.02 | 0.01 | +5% | n.s. |
| Cr (μg/g) | 0.0005 | 0.0003 | 0.0006 | 0.0003 | +12% | 0.0005 | 0.0003 | 0.0004 | 0.0001 | −15% | 0.05 |
| Se (μg/g) | 0.3 | 0.03 | 0.3 | 0.04 | +5% | 0.3 | 0.04 | 0.2 | 0.03 | −8% | 0.001 |
Table 19.
Homocysteine Pathway.
Table 19.
Homocysteine Pathway.
| Treatment Group (n = 26) | Non-Treatment Group (n = 22) | t-Test |
|---|
| Initial | S.D. | Final | S.D. | % Change | Initial | S.D. | Final | S.D. | % Change | |
|---|
| Cysteine (μM/dL) | 24.5 | 4.1 | 24.1 | 3.8 | −2% | 24.4 | 2.7 | 24.2 | 3.1 | −1% | n.s. |
| Homocysteine (μM/L) | 7.1 | 2.7 | 5.0 | 1.4 | −29% | 6.1 | 1.7 | 5.7 | 1.4 | −7% | 0.00002 |
| Methionine (μM/dL) | 2.4 | 0.5 | 2.4 | 0.8 | 0% | 2.2 | 0.5 | 2.6 | 0.6 | +17% | 0.09 |
Table 20.
Carnitine levels in plasma.
Table 20.
Carnitine levels in plasma.
| Treatment Group (n = 27) | Non-Treatment Group (n = 26) | t-Test |
|---|
| Initial | S.D. | Final | S.D. | % Change | Initial | S.D. | Final | S.D. | % Change | |
|---|
| l-carnitine | 1.10 | 0.32 | 1.32 | 0.41 | +20% | 1.12 | 0.31 | 1.07 | 0.29 | −5% | 0.03 |
| Acetyl-l-carnitine | 1.05 | 0.42 | 1.39 | 0.47 | +32% | 0.96 | 0.53 | 1.01 | 0.39 | +4% | n.s. |

 ,
, 


