Breast Milk Lipidome Is Associated with Early Growth Trajectory in Preterm Infants

 , , ,
, , , 
Abstract
1. Introduction
2. Materials and Methods
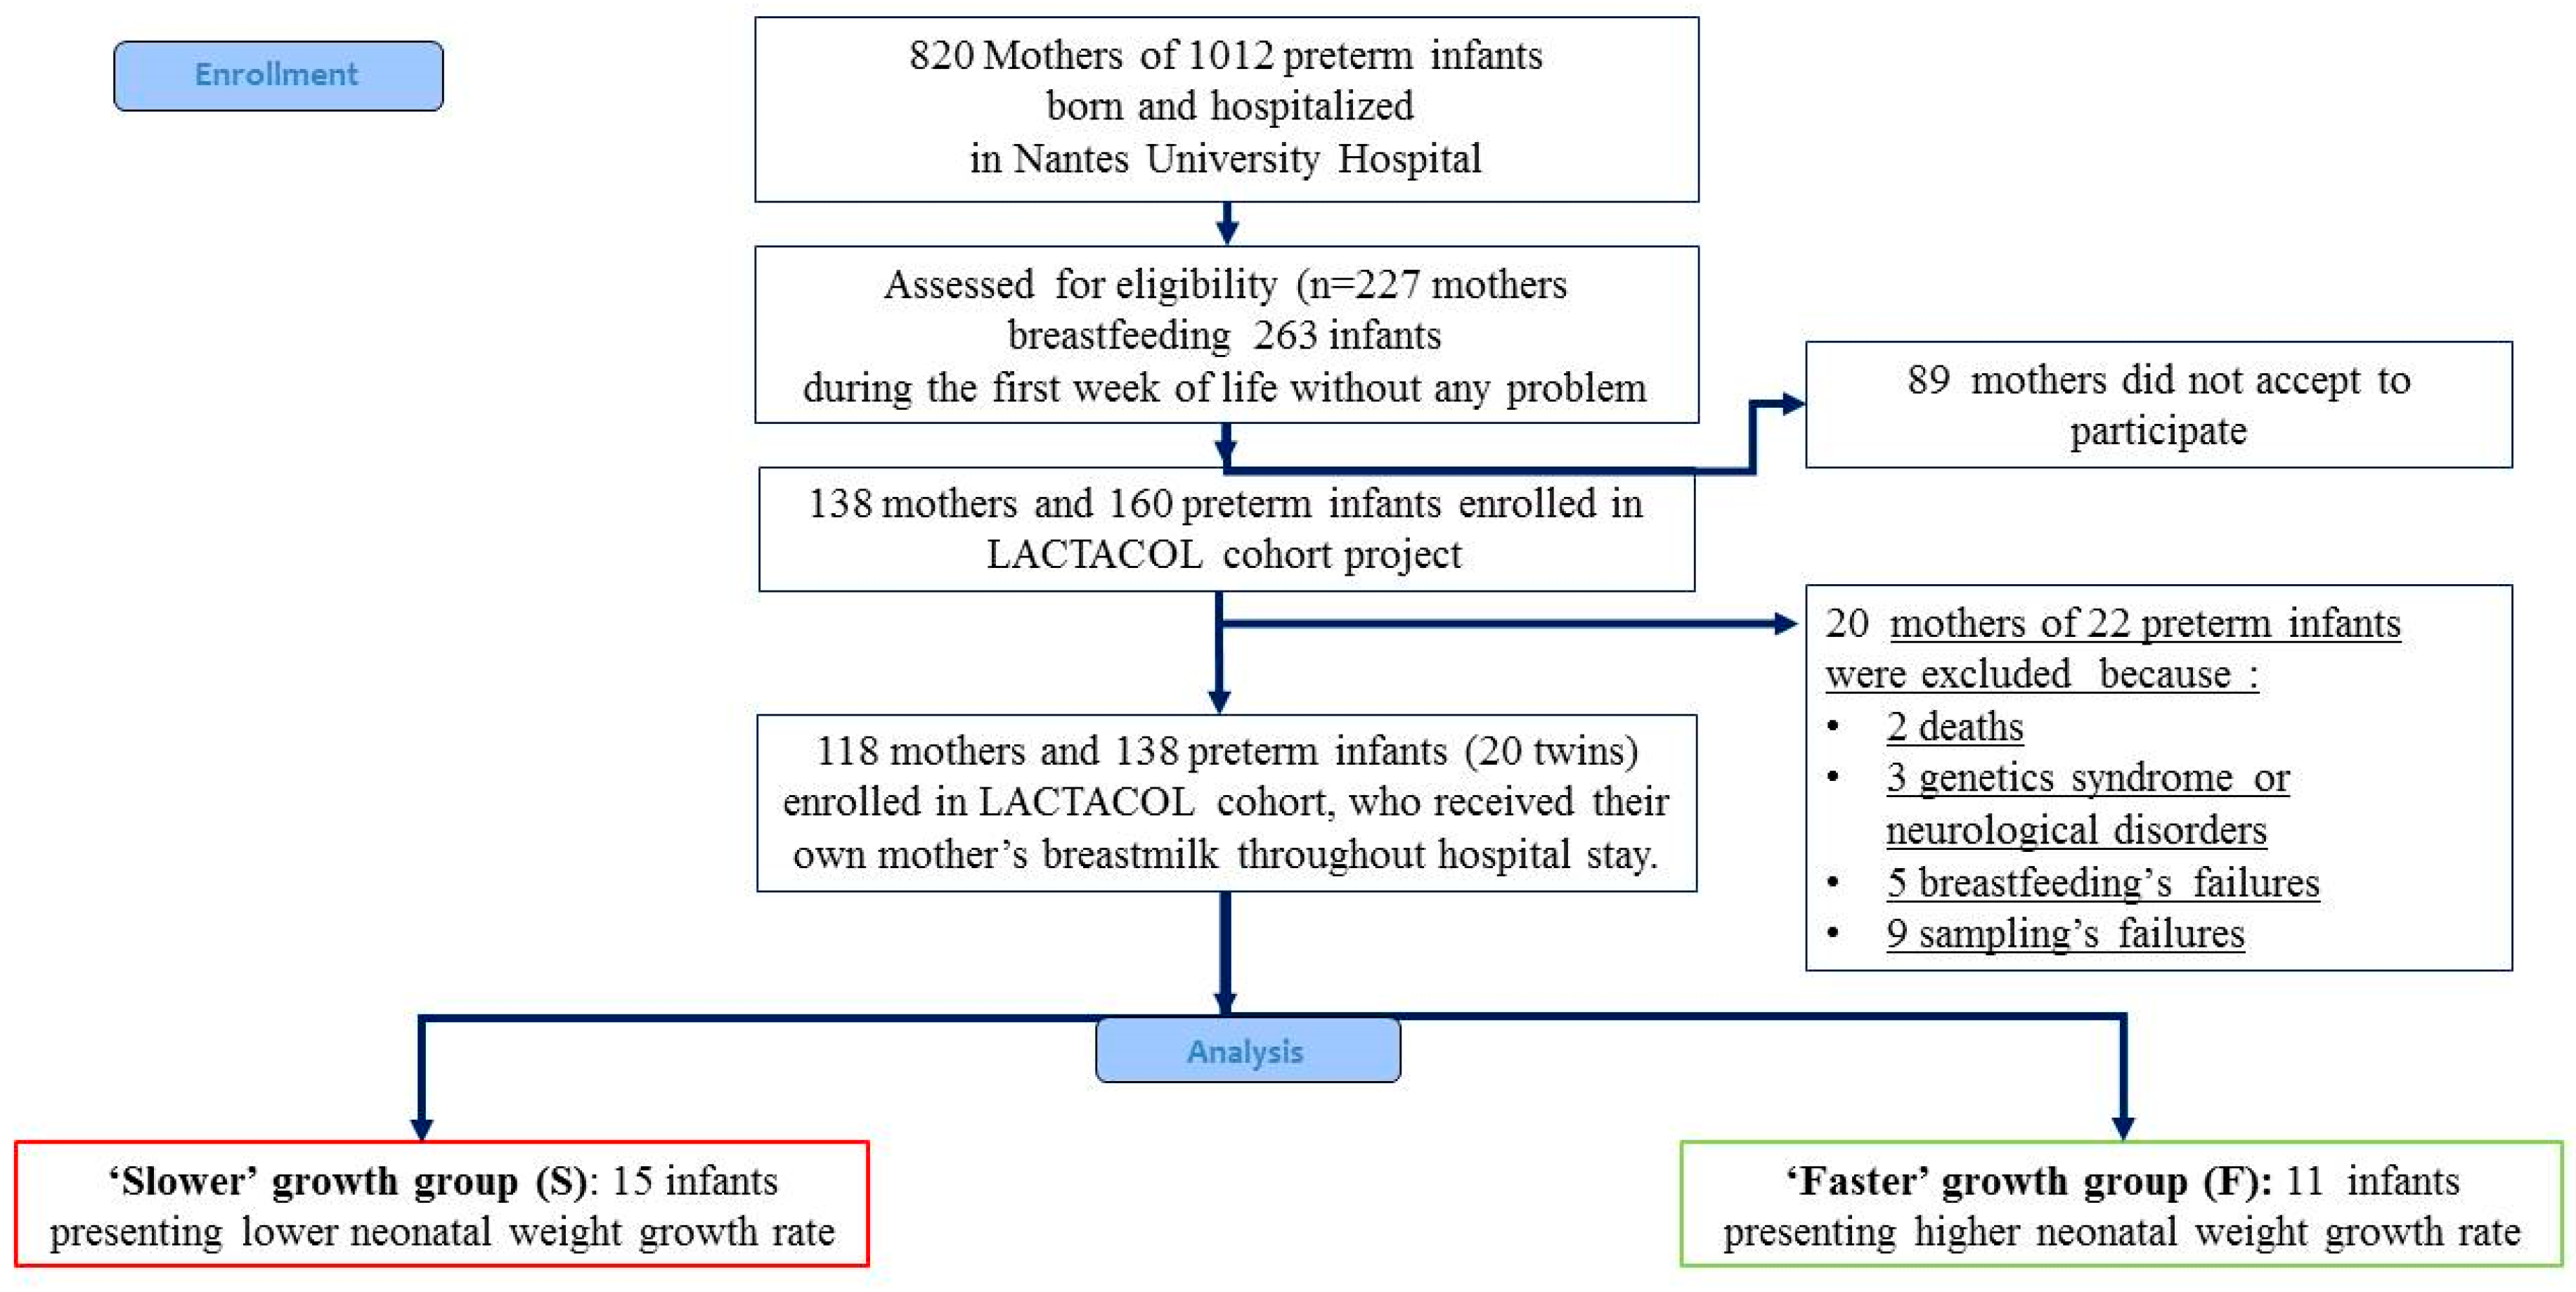
2.1. Study Design and Population
2.2. Ranking Infants According to Early Growth Trajectory
2.3. Ethics
2.4. Human Milk Collection and Targeted Fatty Acid Analysis
2.5. Breast Milk Liquid Chromatography–High-Resolution-Mass Spectrometry (LC-HRMS)-Based Lipidomic Profiling
2.6. Data Analysis and Lipid Species Characterization
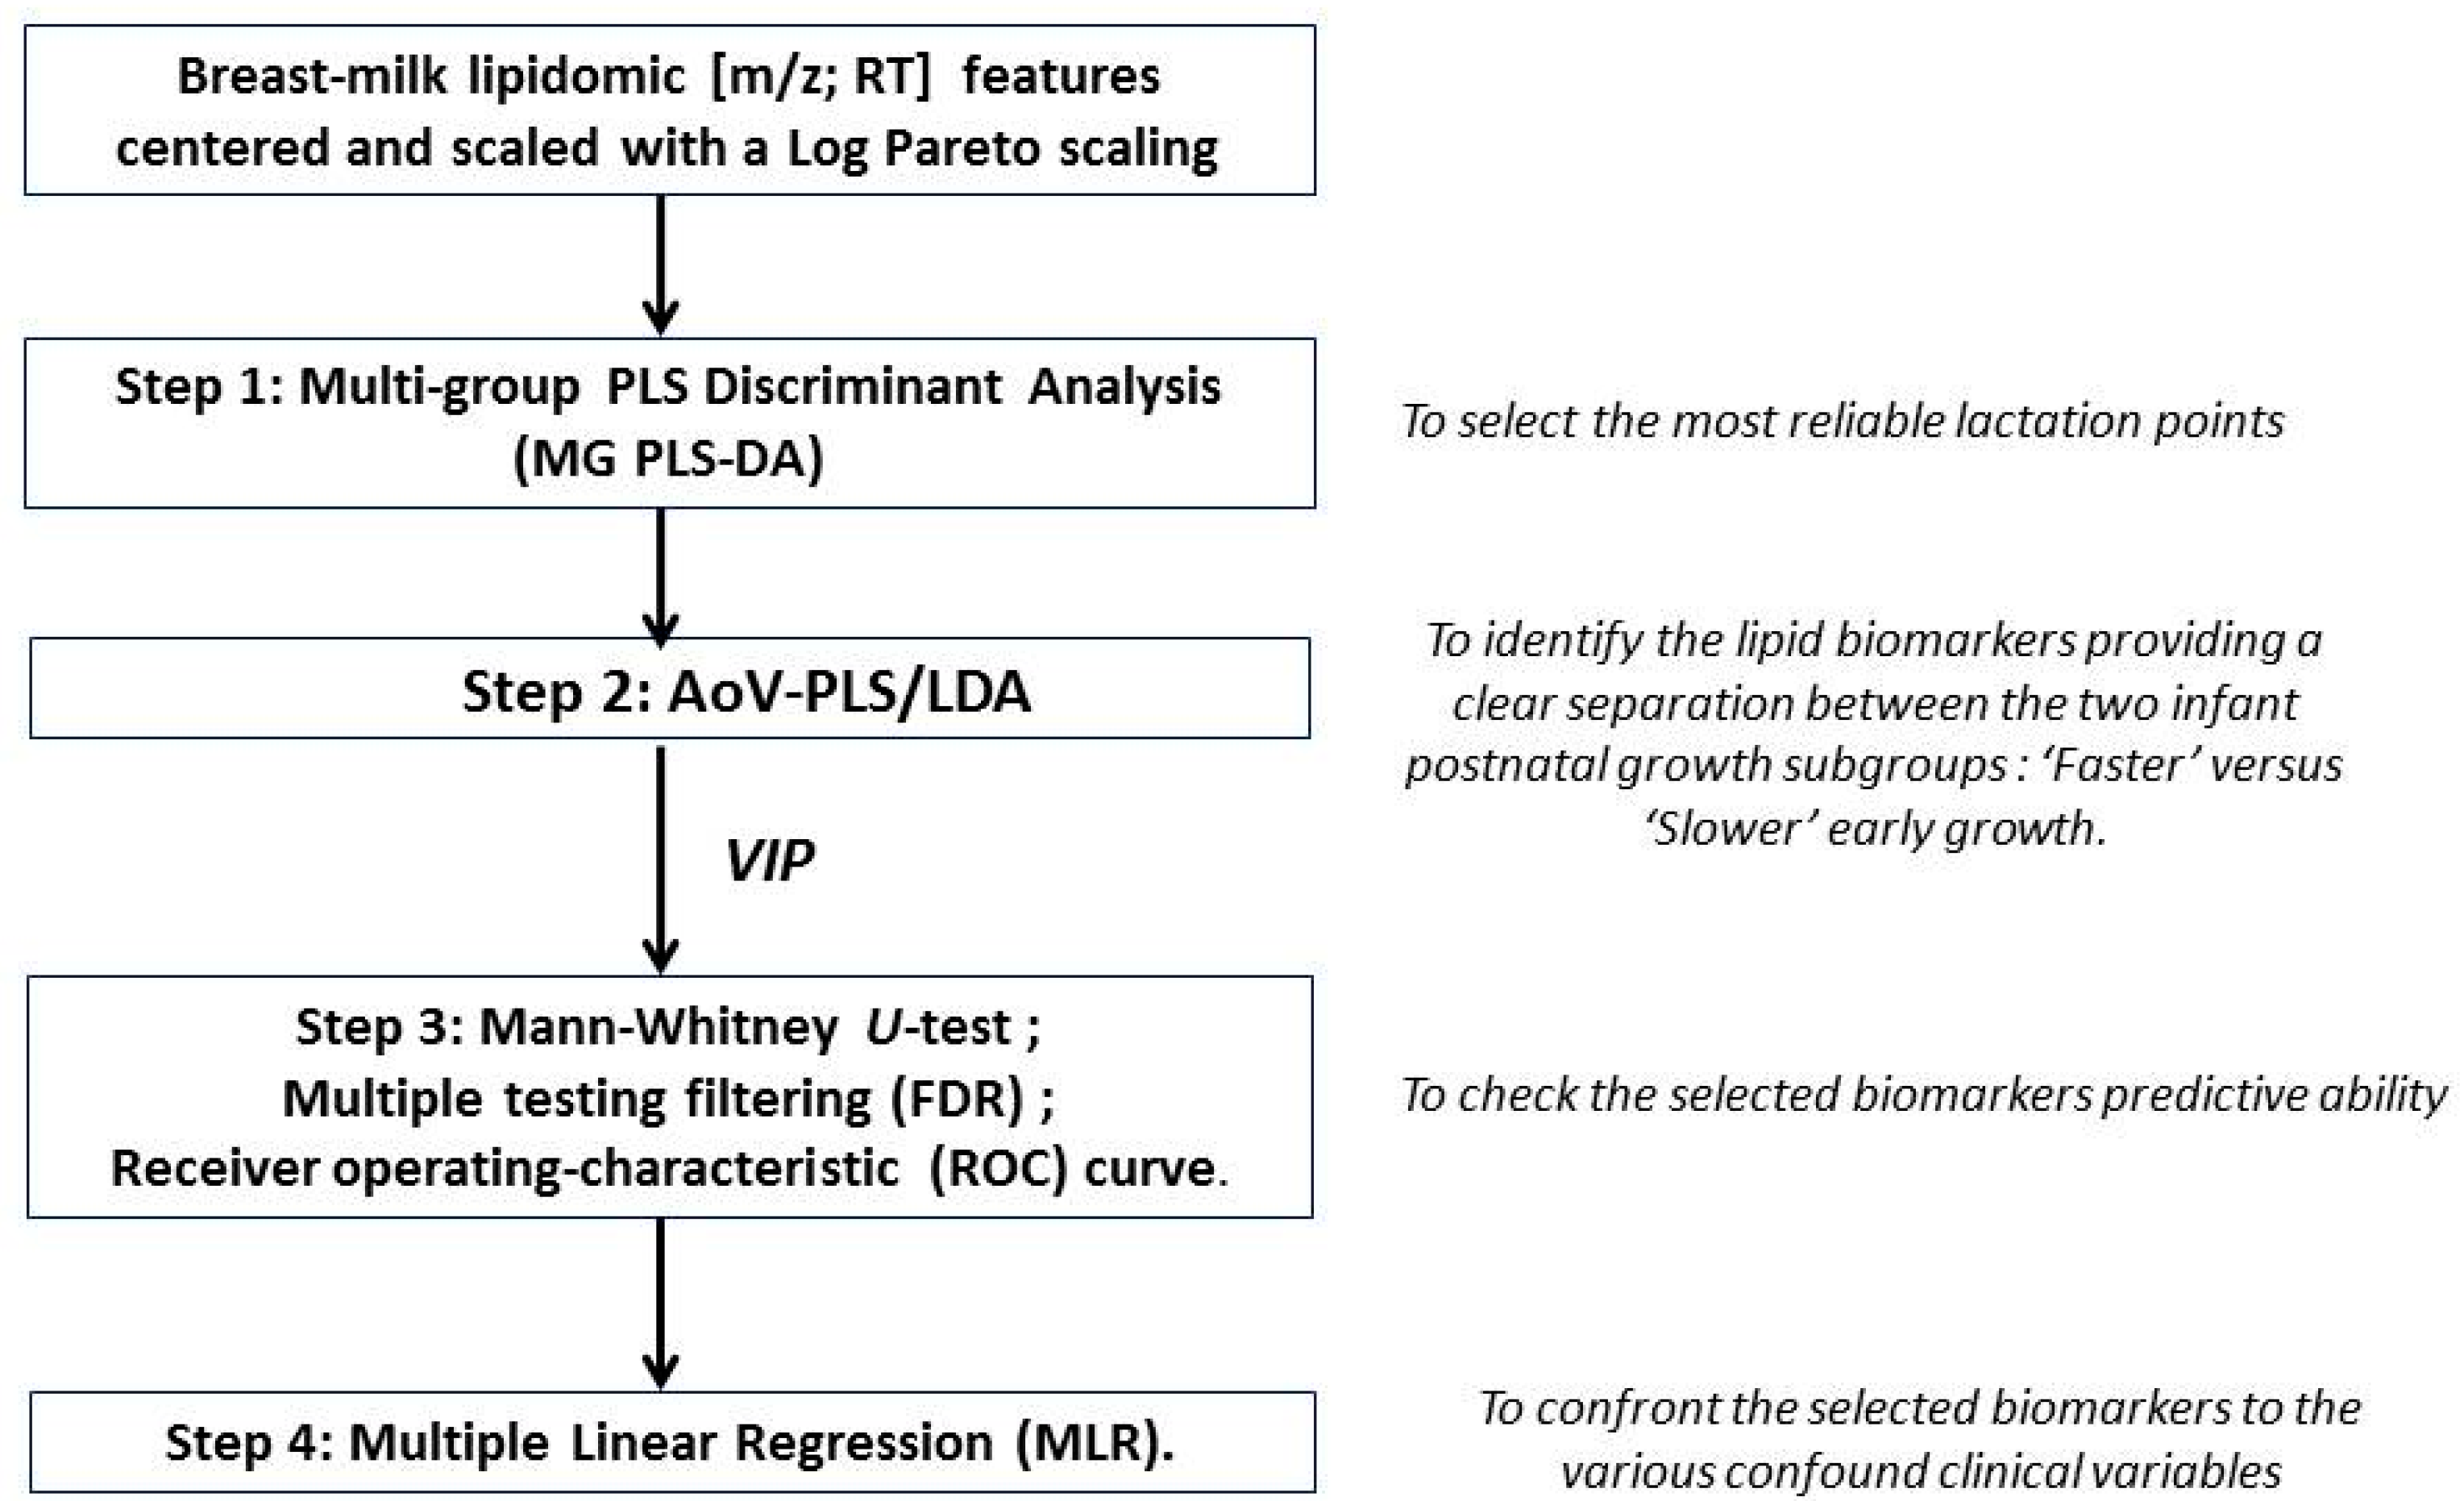
2.7. Statistical Analyses
3. Results
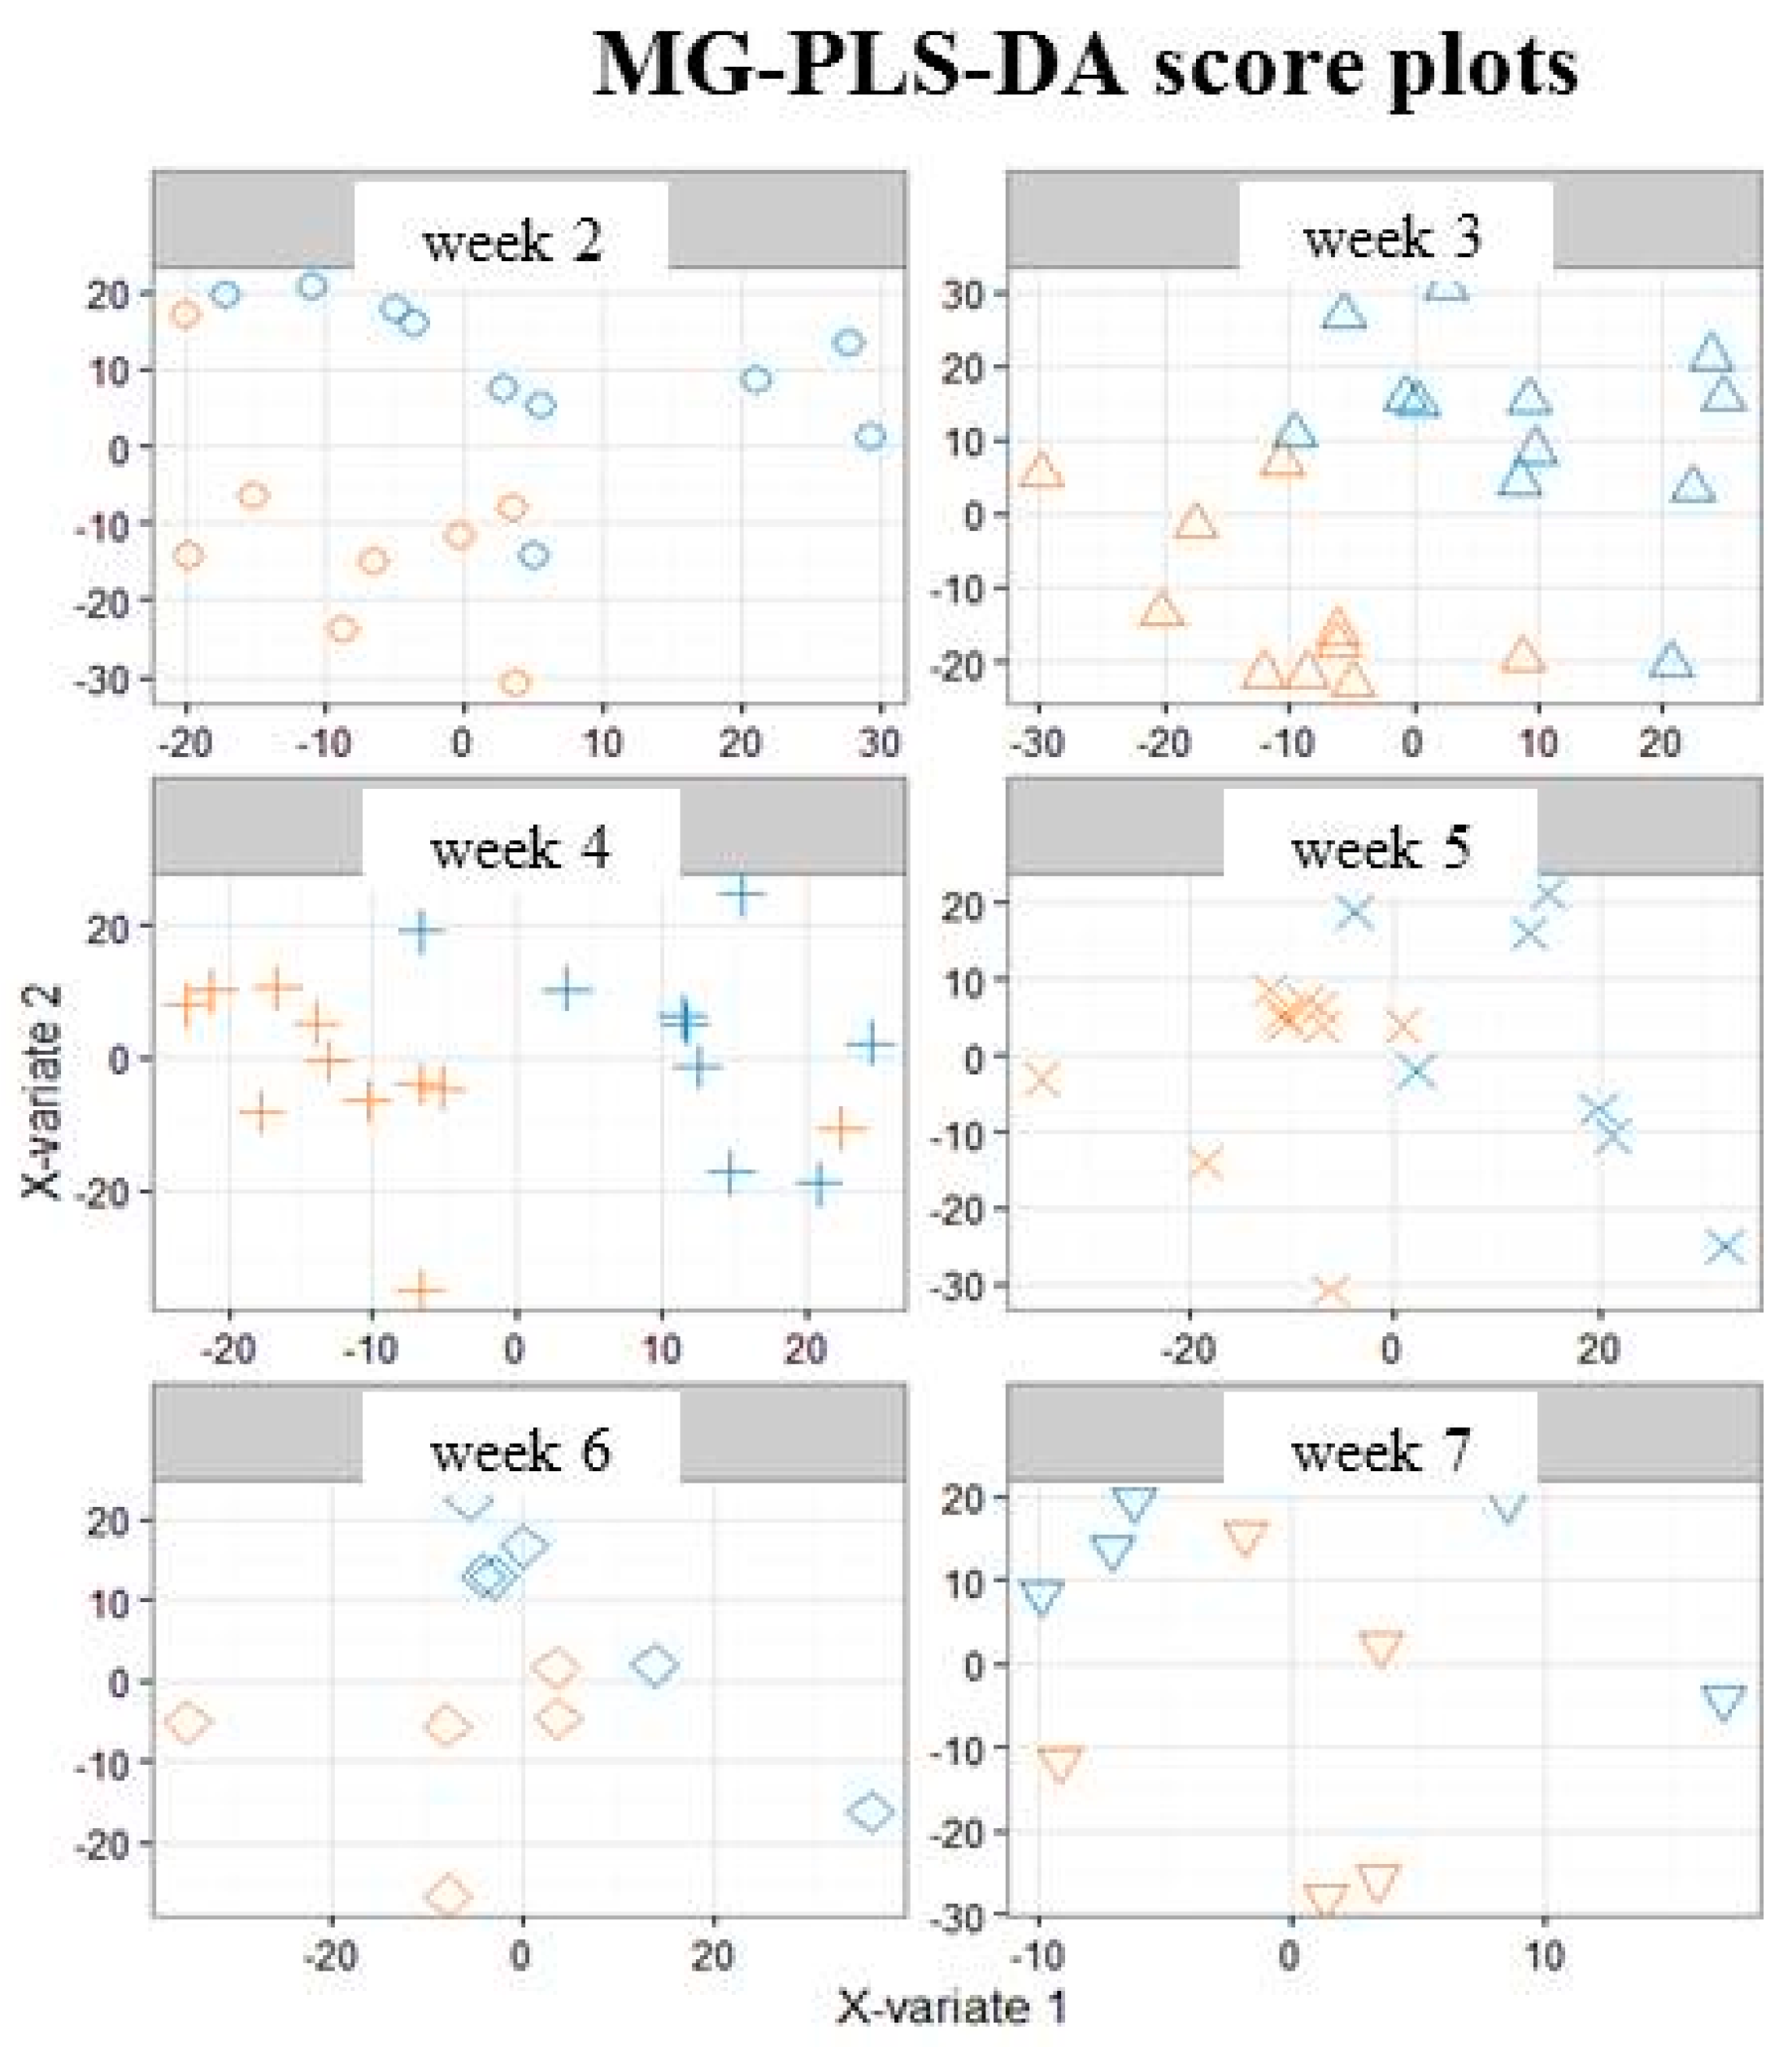
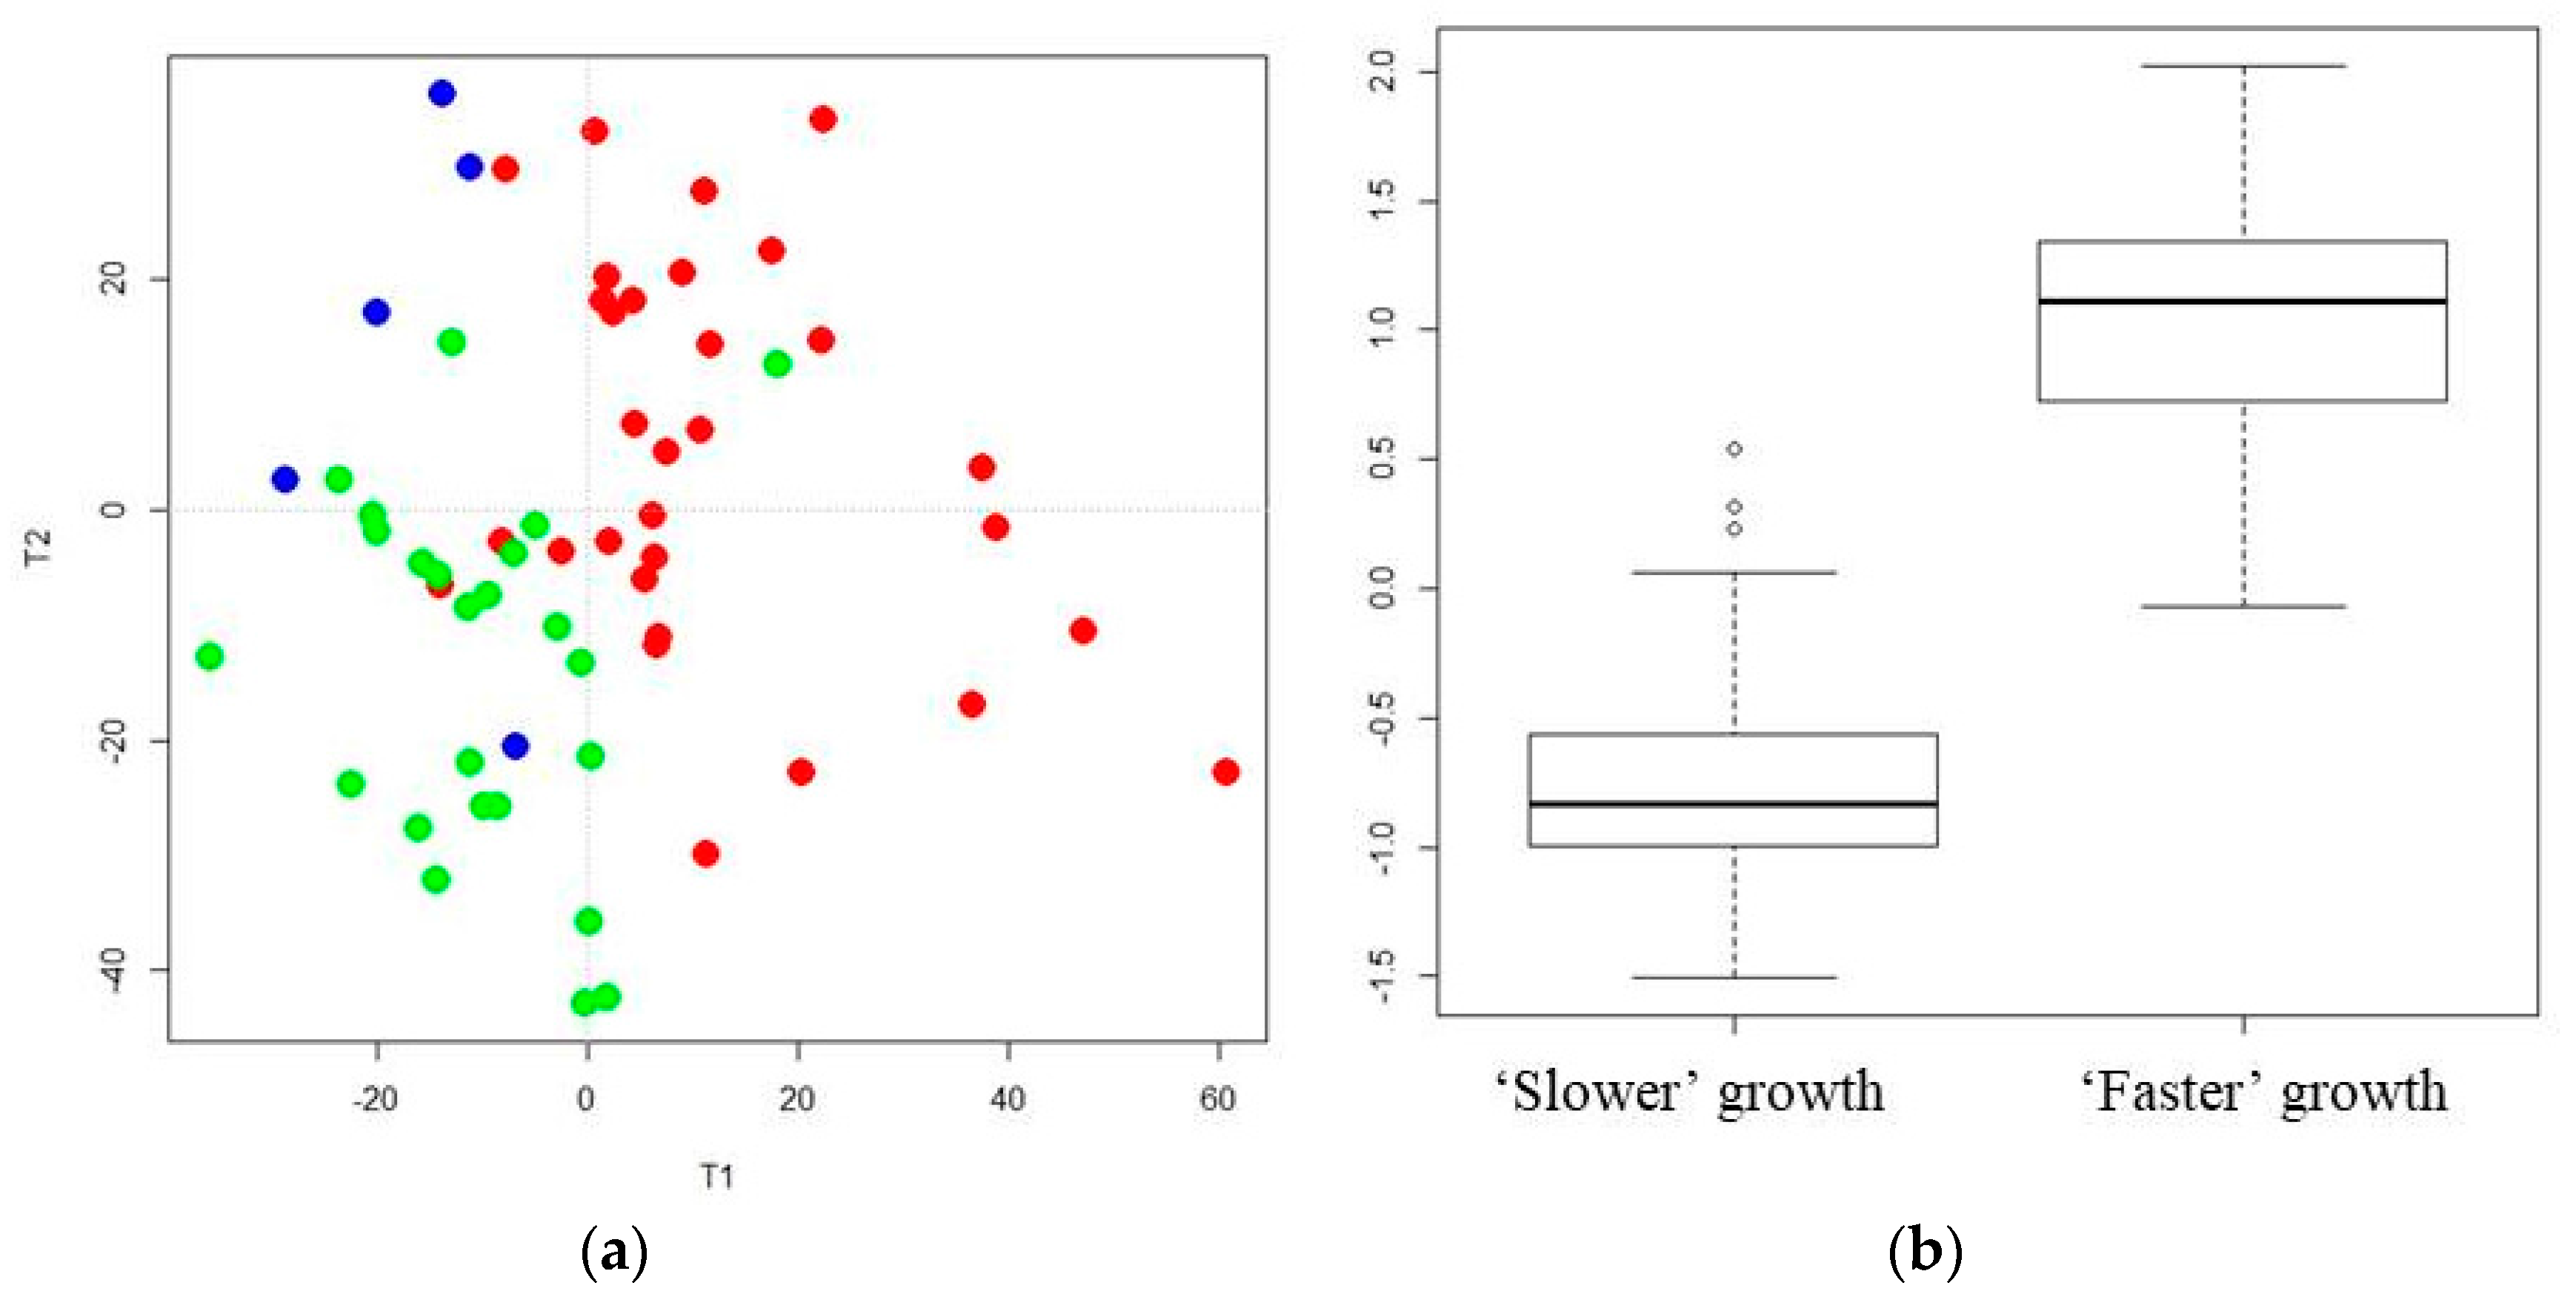
3.1. A Distinct Breast Milk Lipidomic Signature Is Associated with Infant Growth Rate during Hospital Stay
3.2. Characterization of Preterm Breast Milk Lipidotypes in the First Month of Lactation
3.3. Reliability of Maternal Milk Lipids Biomarkers Regarding Postnatal Infant’s Growth
4. Discussion
4.1. “Faster” Growth during Hospital Stay Is Associated with a Specific Maternal Milk Lipidomic Signature
4.2. The Abundance of Mcsat in Breast Milk Is Associated with “Faster” Growth during Hospital Stay
4.3. Medium-Chain Sphingomyelins and Choline-Containing Phospholipids in Breast Milk Reliably Predict Early Growth in Preterm Infant
4.4. Enhanced Breast Milk Levels of DHA-, Dihomo-γ-Linolenic Acid- and Plasmalogen-Containing PE Are Associated with “Faster” Growth in Preterm Neonates
4.5. Decreased Breast Milk Levels of Eicosanoids and Oleic Acid-Containing Triglycerides Are Associated with Early Weight Gain in Preterm Neonates
Supplementary Materials
Acknowledgments
Author Contributions
Conflicts of Interest
Abbreviations
| AA | arachidonic acid |
| ALNA | alpha-Linolenic acid |
| AoV-PLS | analysis of variance combined to partial least squares regression |
| AUC | area under the curve |
| CL | cardiolipine |
| DG | diacylglycerol |
| DGLA | dihomo-gamma-linolenic acid |
| DHA | docosahexanoic acid |
| GA | gestational age |
| GLNA | gamma-linolenic acid |
| EPA | eicosapentaenoic acid |
| ESI | electrospray ionization |
| FDR | false discovery rate |
| LA | linoleic acid |
| LC-HR-MS | liquid-chromatography–high-resolution-mass-spectrometry |
| LC-PUFA | long-chain PUFA |
| MG PLS-DA | multi-group partial least squares discriminant analysis |
| MLR | multiple linear regression |
| MCSAT | medium-chain saturated fatty acids |
| MUFA | mono-unsaturated fatty acids |
| PC | phosphocholine |
| PE | phsosphethanolamine |
| PG | phosphatidylglycerol |
| PI | phosphoinositol |
| PS | phosphoserine |
| PUFA | polyunsaturated fatty acid |
| SAT | saturated fatty acids |
| ROC | receiver operating-characteristic |
| SD | standard deviation |
| SM | sphingomyéline |
| TG | triacylglycerol |
| W4M | workflow4metabolomics® |
| AA | arachidonic acid |
| ALNA | alpha-linolenic acid |
| AoV-PLS | analysis of variance combined to partial least squares |
| AUC | area under the curve |
| CL | cardiolipine |
| DG | diacylglycerol |
| DGLA | dihomo-gamma-linolenic acid |
| DHA | docosahexanoic acid |
| GA | gestational age |
| GLNA | gamma-linolenic acid |
| EPA | eicosapentaenoic acid |
| ESI | electrospray ionization |
| FDR | false discovery rate |
| LA | linoleic acid |
| LC-HR-MS | liquid-chromatography–high-resolution-mass-spectrometry |
| LC-PUFA | long-chain PUFA |
| MCSAT | medium chain-saturated fatty acid |
| MG PLS-DA | multi-group partial least squares-discriminant analysis |
| MLR | multiple linear regression |
| MUFA | mono-unsaturated fatty acids |
| PC | phosphocholine |
| PE | phosphoethanolamine |
| PG | phosphatidylglycerol |
| PI | phosphoinositol |
| PS | phosphoserine |
| PUFA | polyunsaturated fatty acid |
| SAT | saturated fatty acids |
| ROC | receiver operating-characteristic |
| SD | standard deviation |
| SM | sphingomyéline |
| TG | triacylg lycerol |
| W4M | workflow4metabolomics® |
References
- Victora, C.G.; Bahl, R.; Barros, A.J.; França, G.V.; Horton, S.; Krasevec, J.; Murch, S.; Sankar, M.J.; Walker, N.; Rollins, N.C.; et al. Breastfeeding in the 21st century: Epidemiology, mechanisms, and lifelong effect. Lancet 2016, 387, 475–490. [Google Scholar] [CrossRef]
- World Health Organization; United Nations Children’s Fund. Global Strategy for Infant and Young Child Feeding, 1st ed.; World Health Organization: Geneva, Switzerland, 2003; p. 30. ISBN 9241562218. [Google Scholar]
- Schanler, R.J.; Hurst, N.M. The use of human milk and breastfeeding in premature infants. Clin. Perinatol. 1999, 26, 379–398. [Google Scholar] [CrossRef] [PubMed]
- Callen, J.; Pinelli, J. A review of the literature examining the benefits and challenges, incidence and duration, and barriers to breastfeeding in preterm infants. Adv. Neonatal Care 2005, 5, 72–88. [Google Scholar] [CrossRef] [PubMed]
- American Academy of Pediatrics. Section on Breastfeeding. Breastfeeding and the use of human milk. Pediatrics 2012, 129, e827–e841. [Google Scholar]
- Arslanoglu, S.; Corpeleijn, W.; Moro, G.; Braegger, C.; Campoy, C.; Colomb, V.; Decsi, T.; Domellöf, M.; Fewtrell, M.; Hojsak, I.; et al. Donor human milk for preterm infants: Current evidence and research directions. J. Pediatr. Gastroenterol. Nutr. 2013, 57, 535–542. [Google Scholar] [CrossRef] [PubMed]
- Corpeleijn, W.E.; de Waard, M.; Christmann, V.; van Goudoever, J.B.; Jansen-van der Weide, M.C.; Kooi, E.M.; Koper, J.F.; Kouwenhoven, S.M.P.; Hendrik, N.L.; Mank, E.; et al. Effect of donor milk on severe infections and mortality in very low-birth-weight infants: The early nutrition study randomized clinical trial. JAMA Pediatr. 2016, 170, 654–661. [Google Scholar] [CrossRef] [PubMed]
- Kumar, R.K.; Singhal, A.; Vaidya, U.; Banerjee, S.; Anwar, F.; Rao, S. Optimizing nutrition in preterm low birth weight infants—Consensus summary. Front. Nutr. 2017, 4, 20. [Google Scholar] [CrossRef] [PubMed]
- Johnson, T.J.; Patel, A.L.; Bigger, H.R.; Engstrom, J.L.; Meier, P.P. Economic benefits and costs of human milk feedings: A strategy to reduce the risk of prematurity-related morbidities in very-low-birth-weight infants. Adv. Nutr. Int. Rev. J. 2014, 5, 207–212. [Google Scholar] [CrossRef] [PubMed]
- Quigley, M.; McGuire, W. Formula versus donor breast milk for feeding preterm or low birth weight infants. Cochrane Database Syst. Rev. 2014, CD002971. [Google Scholar] [CrossRef]
- Meinzen-Derr, J.; Poindexter, B.; Wrage, L.; Morrow, A.L.; Stoll, B.; Donovan, E.F. Role of human milk in extremely low birth weight infants’ risk of necrotizing enterocolitis or death. J. Perinatol. 2009, 29, 57–62. [Google Scholar] [CrossRef] [PubMed]
- Rozé, J.C.; Ancel, P.Y.; Lepage, P.; Martin-Marchand, L.; Al Nabhani, Z.; Delannoy, J.; Picaud, J.C.; Lapillonne, A.; Aires, J.; Durox, M.; et al. Nutrition EPIPAGE 2 study group and the EPIFLORE Study Group. Nutritional strategies and gut microbiota composition as risk factors for necrotizing enterocolitis in very-preterm infants. Am. J. Clin. Nutr. 2017, 106, 821–830. [Google Scholar] [CrossRef] [PubMed]
- Boyd, C.A.; Quigley, M.A.; Brocklehurst, P. Donor breast milk versus infant formula for preterm infants: Systematic review and meta-analysis. Arch. Dis. Child. Fetal Neonatal Ed. 2007, 92, F169–F175. [Google Scholar] [CrossRef] [PubMed]
- Rozé, J.C.; Darmaun, D.; Boquien, C.Y.; Flamant, C.; Picaud, J.C.; Savagner, C.; Claris, O.; Lapillonne, A.; Mitanchez, D.; Branger, B. The apparent breastfeeding paradox in very preterm infants: Relationship between breastfeeding, early weight gain and neurodevelopment based on results from two cohorts, EPIPAGE and LIFT. BMJ Open 2012, 2, e000834. [Google Scholar] [CrossRef] [PubMed]
- Singhal, A.; Cole, T.J.; Fewtrell, M.; Lucas, A. Breastmilk feeding and lipoprotein profile in adolescents born preterm: Follow-up of a prospective randomised study. Lancet 2004, 363, 1571–1578. [Google Scholar] [CrossRef]
- Curtis, M.; Rigo, J. Extrauterine growth restriction in very-low-birthweight infants. Acta Paediatr. 2004, 93, 1563–1568. [Google Scholar] [CrossRef] [PubMed]
- Ehrenkranz, R.A.; Dusick, A.M.; Vohr, B.R.; Wrigh, L.L.; Wrage, L.A.; Poole, W.K. Growth in the neonatal intensive care unit influences neurodevelopmental and growth outcomes of extremely low birth weight infants. Pediatrics 2006, 117, 1253–1261. [Google Scholar] [CrossRef] [PubMed]
- Larroque, B.; Ancel, P.Y.; Marret, S.; Marchand, L.; André, M.; Arnaud, C.; Pierrat, V.; Rozé, J.C.; Messer, J.; Thiriez, G.; et al. Neurodevelopmental disabilities and special care of 5-year-old children born before 33 weeks of gestation (the EPIPAGE study): A longitudinal cohort study. Lancet 2008, 371, 813–820. [Google Scholar] [CrossRef]
- Agostoni, C.; Buonocore, G.; Carnielli, V.; De Curtis, M.; Darmaun, D.; Decsi, T.; Domellöf, M.; Embleton, N.D.; Fusch, C.; Genzel-Boroviczeny, O. Enteral nutrient supply for preterm infants: Commentary from the European Society of Paediatric Gastroenterology, Hepatology and Nutrition Committee on nutrition. J. Pediatr. Gastroenterol. Nutr. 2010, 50, 85–91. [Google Scholar] [CrossRef] [PubMed]
- Henriksen, C.; Westerberg, A.C.; Rønnestad, A.; Nakstad, B.; Veierød, M.B.; Drevon, C.A.; Iversen, P.O. Growth and nutrient intake among very-low-birth-weight infants fed fortified human milk during hospitalisation. Br. J. Nutr. 2009, 102, 1179–1186. [Google Scholar] [CrossRef] [PubMed]
- Saarela, T.; Kokkonen, J.; Koivisto, M. Macronutrient and energy contents of human milk fractions during the first six months of lactation. Acta Paediatr. 2005, 94, 1176–1181. [Google Scholar] [CrossRef] [PubMed]
- Innis, S.M. Human milk: Maternal dietary lipids and infant development. Proc. Nutr. Soc. 2007, 66, 397–404. [Google Scholar] [CrossRef] [PubMed]
- Dingess, K.A.; Valentine, C.J.; Ollberding, N.J.; Davidson, B.S.; Woo, J.G.; Summer, S.; Peng, Y.M.; Guerrero, M.L.; Ruiz-Palacios, G.M.; Ran-Ressler, R.R.; et al. Branched-chain fatty acid composition of human milk and the impact of maternal diet: The Global Exploration of Human Milk (GEHM) study. Am. J. Clin. Nutr. 2017, 105, 177–184. [Google Scholar] [CrossRef] [PubMed]
- Mäkelä, J.; Linderborg, K.; Niinikoski, H.; Yang, B.; Lagström, H. Breast milk fatty acid composition differs between overweight and normal weight women: The STEPS Study. Eur. J. Nutr. 2013, 52, 727–735. [Google Scholar] [CrossRef] [PubMed]
- Bachour, P.; Yafawi, R.; Jaber, F.; Choueiri, E.; Abdel-Razzak, Z. Effects of smoking, mother’s age, body mass index, and parity number on lipid, protein, and secretory immunoglobulin A concentrations of human milk. Breastfeed. Med. 2012, 7, 179–188. [Google Scholar] [CrossRef] [PubMed]
- Ilcol, Y.O.; Hizli, B. Active and total ghrelin concentrations increase in breast milk during lactation. Acta Paediatr. 2007, 96, 1632–1639. [Google Scholar] [CrossRef] [PubMed]
- Lubetzky, R.; Littner, Y.; Mimouni, F.B.; Dollberg, S.; Mandel, D. Circadian variations in fat content of expressed breast milk from mothers of preterm infants. J. Am. Coll. Nutr. 2006, 25, 151–154. [Google Scholar] [CrossRef] [PubMed]
- Giugliani, E.R.; Horta, B.L.; Loret de Mola, C.; Lisboa, B.O.; Victora, C.G. Effect of breastfeeding promotion interventions on child growth: A systematic review and meta-analysis. Acta Paediatr. 2015, 104, 20–29. [Google Scholar] [CrossRef] [PubMed]
- Gidrewicz, D.A.; Fenton, T.R. A systematic review and meta-analysis of the nutrient content of preterm and term breast milk. BMC Pediatr. 2014, 14, 216. [Google Scholar] [CrossRef] [PubMed]
- Koletzko, B.; Agostoni, C.; Bergmann, R.; Ritzenthaler, K.; Shamir, R. Physiological aspects of human milk lipids and implications for infant feeding: A workshop report. Acta Paediatr. 2011, 100, 1405–1415. [Google Scholar] [CrossRef] [PubMed]
- Gurnida, D.A.; Rowan, A.M.; Idjradinata, P.; Muchtadi, D.; Sekarwana, N. Association of complex lipids containing gangliosides with cognitive development of 6-month-old infants. Early Hum. Dev. 2012, 88, 595–601. [Google Scholar] [CrossRef] [PubMed]
- Verardo, V.; Gomez-Caravaca, A.M.; Arraez-Roman, D.; Hettinga, K. Recent advances in phospholipids from colostrum, milk and dairy by-products. Int. J. Mol. Sci. 2017, 18, 173. [Google Scholar] [CrossRef] [PubMed]
- Alexandre-Gouabau, M.C.; Courant, F.; Le Gall, G.; Moyon, T.; Darmaun, D.; Parnet, P.; Coupe, B.; Antignac, J.P. Offspring metabolomic response to maternal protein restriction in a rat model of Intrauterine Growth Restriction (IUGR). J. Proteome Res. 2011, 10, 3292–3302. [Google Scholar] [CrossRef] [PubMed]
- Fanos, V.; Atzori, L.; Makarenko, K.; Melis, G.B.; Ferrazzi, E. Metabolomics application in maternal-fetal medicine. Biomed. Res. Int. 2013. [Google Scholar] [CrossRef] [PubMed]
- German, J.B.; Dillard, C.J. Composition, structure and absorption of milk lipids: A source of energy, fat-soluble nutrients and bioactive molecules. Crit. Rev. Food Sci. Nutr. 2006, 46, 57–92. [Google Scholar] [CrossRef] [PubMed]
- Marincola, F.C.; Noto, A.; Caboni, P.; Reali, A.; Barberini, L.; Lussu, M.; Murgia, F.; Santoru, M.L.; Atzori, L.; Fanos, V. A metabolomic study of preterm human and formula milk by high resolution NMR and GC/MS analysis: Preliminary results. J. Matern. Fetal Neonatal Med. 2012, 25, 62–67. [Google Scholar] [CrossRef] [PubMed]
- Wu, J.; Domellöf, M.; Zivkovic, A.M.; Larsson, G.; Öhman, A.; Nording, M.L. NMR-based metabolite profiling of human milk: A pilot study of methods for investigating compositional changes during lactation. Biochem. Biophys. Res. Commun. 2016, 469, 626–632. [Google Scholar] [CrossRef] [PubMed]
- Andreas, N.J.; Hyde, M.J.; Gomez-Romero, M.; Lopez-Gonzalvez, M.A.; Villasenor, A.; Wijeyesekera, A.; Barbas, C.; Modi, N.; Holmes, E.; Garcia-Perez, I. Multiplatform characterization of dynamic changes in breast milk during lactation. Electrophoresis 2015, 36, 2269–2285. [Google Scholar] [CrossRef] [PubMed]
- Ancel, P.Y.; Goffinet, F.; Kuhn, P.; Langer, B.; Matis, J.; Hernandorena, X.; Chabanier, P.; Joly-Pedespan, L.; Lecomte, B.; Vendittelli, F.; et al. Survival and morbidity of preterm children born at 22 through 34 weeks’ gestation in France in 2011: Results of the EPIPAGE-2 cohort study. JAMA Pediatr. 2015, 169, 230–238. [Google Scholar] [CrossRef] [PubMed]
- Simon, L.; Frondas-Chauty, A.; Senterre, T.; Flamant, C.; Darmaun, D.; Rozé, J.C. Determinants of body composition in preterm infants at the time of hospital discharge. Am. J. Clin. Nutr. 2014, 100, 98–104. [Google Scholar] [CrossRef] [PubMed]
- Cole, T.J. The LMS method for constructing normalized growth standards. Eur. J. Clin. Nutr. 1990, 44, 45–60. [Google Scholar] [PubMed]
- Olsen, I.E.; Groveman, S.A.; Lawson, M.L.; Clark, R.H.; Zemel, B.S. New intrauterine growth curves based on United States data. Pediatrics 2010, 125, e214–e224. [Google Scholar] [CrossRef] [PubMed]
- Steward, D.K.; Pridham, K.F. Growth patterns of extremely low-birth-weight hospitalized preterm infants. J. Obstet. Gynecol. Neonatal Nurs. 2002, 31, 57–65. [Google Scholar] [CrossRef] [PubMed]
- Billard, H.; Simon, L.; Desnots, E.; Sochard, A.; Boscher, C.; Riaublanc, A.; Alexandre-Gouabau, M.C.; Boquien, C.Y. Calibration adjustment of the mid-infrared analyzer for an accurate determination of the macronutrient composition of human milk. J. Hum. Lact. 2016, 32, NP19–NP27. [Google Scholar] [CrossRef] [PubMed]
- Bligh, E.; Dyer, W.J. A rapid method of total lipid extraction and purification. Can. J. Biochem. Physiol. 1959, 37, 911–917. [Google Scholar] [CrossRef] [PubMed]
- Martin Agnoux, A.; Antignac, J.P.; Desnots, E.; Ferchaud-Roucher, V.; Darmaun, D.; Parnet, P.; Alexandre-Gouabau, M.C. Perinatal protein restriction effect on milk free amino acids and fatty acids profile in lactating rats and its potential role on growth and metabolic status of the pups. J. Nutr. Biochem. 2015, 26, 784–795. [Google Scholar] [CrossRef] [PubMed]
- Gallart-Ayala, H.; Courant, F.; Severe, S.; Antignac, J.P.; Morio, F.; Abadie, J.; Le Bizec, B. Versatile lipid profiling by liquid chromatography-high resolution mass spectrometry using all ion fragmentation and polarity switching. Preliminary application for serum samples phenotyping related to canine mammary cancer. Anal. Chim. Acta 2013, 796, 75–83. [Google Scholar] [CrossRef] [PubMed]
- Kessner, D.; Chambers, M.; Burke, R.; Agus, D.; Mallick, P. ProteoWizard: Open source software for rapid proteomics tools development. Bioinformatics 2008, 24, 2534–2536. [Google Scholar] [CrossRef] [PubMed]
- Giacomoni, F.; Le Corguillé, G.; Monsoor, M.; Landi, M.; Pericard, P.; Pétéra, M.; Duperier, C.; Tremblay-Franco, M.; Martin, J.F.; Jacob, D.; et al. Workflow4Metabolomics: A collaborative research infrastructure for computational metabolomics. Bioinformatics 2015, 31, 1493–1495. [Google Scholar] [CrossRef] [PubMed]
- Smith, C.A.; Want, E.J.; O’Maille, G.; Abagyan, R.; Siuzdak, G. XCMS: Processing mass spectrometry data for metabolite profiling using nonlinear peak alignment, matching, and identification. Anal. Chem. 2006, 78, 779–787. [Google Scholar] [CrossRef] [PubMed]
- Kuhl, C.; Tautenhahn, R.; Bottcher, C.; Larson, T.R.; Neumann, S. CAMERA: An integrated strategy for compound spectra extraction and annotation of liquid chromatography/mass spectrometry data sets. Anal. Chem. 2011, 84, 283–289. [Google Scholar] [CrossRef] [PubMed]
- Van Der Kloet, F.M.; Bobeldijk, I.; Verheij, E.R.; Jellema, R.H. Analytical error reduction using single point calibration for accurate and precise metabolomic phenotyping. J. Proteome Res. 2009, 8, 5132–5141. [Google Scholar] [CrossRef] [PubMed]
- Dunn, W.B.; Broadhurst, D.; Begley, P.; Zelena, E.; Francis-McIntyre, S.; Anderson, N.; Brown, M.; Knowles, J.D.; Halsall, A.; Haselden, J.N. Procedures for large-scale metabolic profiling of serum and plasma using gas chromatography and liquid chromatography coupled to mass spectrometry. Nat. Protoc. 2011, 6, 1060–1083. [Google Scholar] [CrossRef] [PubMed]
- Ferchaud-Roucher, V.; Croyal, M.; Krempf, M.; Ouguerram, K. Plasma lipidome characterization using UHPLC-HRMS and ion mobility of hypertriglyceridemic patients on nicotinic acid. Atherosclerosis 2015, 241, e123–e124. [Google Scholar] [CrossRef]
- Van den Berg, R.A.; Hoefsloot, H.C.; Westerhuis, J.A.; Smilde, A.K.; van der Werf, M.J. Centering, scaling, and transformations: Improving the biological information content of metabolomics data. BMC Genom. 2006, 7, 142. [Google Scholar] [CrossRef] [PubMed]
- Eslami, A.; Qannari, E.M.; Kohler, A.; Bougeard, S. Multi-Group PLS Regression: Application to epidemiology. In New Perspectives in Partial Least Squares and Related Methods; Springer: New York, NY, USA, 2013; pp. 243–255. [Google Scholar] [CrossRef]
- Eslami, A.; El Mostafa Qannari, S.B.; Sanchez, G.; Bougeard, S.; Eslami, M.A. Package ‘multigroup’. CRAN, Comprehensive R Archive Network for the R Programming Language. Available online: https://cran.r-project.org/package=multigroup (accessed on 12 April 2017).
- Harrington, P.D.B.; Vieira, N.E.; Espinoza, J.; Nien, J.K.; Romero, R.; Yergey, A.L. Analysis of variance–principal component analysis: A soft tool for proteomic discovery. Anal. Chim. Acta 2005, 544, 118–127. [Google Scholar] [CrossRef]
- Smilde, A.K.; Jansen, J.J.; Hoefsloot, H.C.; Lamers, R.J.A.; Van Der Greef, J.; Timmerman, M.E. ANOVA-simultaneous component analysis (ASCA): A new tool for analyzing designed metabolomics data. Bioinformatics 2005, 21, 3043–3048. [Google Scholar] [CrossRef] [PubMed]
- El Ghaziri, A.; Qannari, E.M.; Moyon, T.; Alexandre-Gouabau, M.C. AoV-PLS: A new method for the analysis of multivariate data depending on several factors. Electron. J. App. Stat. Anal. 2015, 8, 214–235. [Google Scholar] [CrossRef]
- Tenenhaus, M. La Régression P, Pratique. Te; Editions Technip: Paris, France, 1998; ISBN 2-7108-0735-1. [Google Scholar]
- Sanchez, G. DiscriMiner: Tools of the Trade for Discriminant Analysis. 2012. Available online: http://CRAN.R-project.org/package=DiscriMiner (accessed on 1 December 2013).
- Westerhuis, J.A.; Hoefsloot, H.C.; Smit, S.; Vis, D.J.; Smilde, A.K.; van Velzen, E.J.; van Duijnhoven, J.P.M.; van Dorsten, F.A. Assessment of PLSDA cross validation. Metabolomics 2008, 4, 81–89. [Google Scholar] [CrossRef]
- Xia, J.; Sinelnikov, I.V.; Han, B.; Wishart, D.S. MetaboAnalyst 3.0—Making metabolomics more meaningful. Nucleic Acids Res. 2015, 43, W251–W257. [Google Scholar] [CrossRef] [PubMed]
- Andreas, N.J.; Kampmann, B.; Le-Doare, K.M. Human breast milk: A review on its composition and bioactivity. Early Hum. Dev. 2015, 91, 629–635. [Google Scholar] [CrossRef] [PubMed]
- Garcia, C.; Lutz, N.W.; Confort-Gouny, S.; Cozzone, P.; Armand, M.; Bernard, M. Phospholipid fingerprints of milk from different mammalians determined by 31 P NMR: Towards specific interest in human health. Food Chem. 2012, 135, 1777–1783. [Google Scholar] [CrossRef] [PubMed]
- Contarini, G.; Povolo, M. Phospholipids in milk fat: Composition, biological and technological significance, and analytical strategies. Int. J. Mol. Sci. 2013, 14, 2808–2831. [Google Scholar] [CrossRef] [PubMed]
- Mills, S.; Ross, R.P.; Hill, C.; Fitzgerald, G.F.; Stanton, C. Milk intelligence: Mining milk for bioactive substances associated with human health. Int. Dairy J. 2011, 21, 377–401. [Google Scholar] [CrossRef]
- Innis, S.M. Impact of maternal diet on human milk composition and neurological development of infants. Am. J. Clin. Nutr. 2014, 99, 734S–741S. [Google Scholar] [CrossRef] [PubMed]
- Taltavull, N.; Ras, R.; Mariné, S.; Romeu, M.; Giralt, M.; Méndez, L.; Medina, I.; Ramos-Romero, S.; Torres, J.L.; Nogués, M.R. Protective effects of fish oil on pre-diabetes: A lipidomic analysis of liver ceramides in rats. Food Funct. 2016, 7, 3981–3988. [Google Scholar] [CrossRef] [PubMed]
- Montgomery, M.K.; Brown, S.H.; Lim, X.Y.; Fiveash, C.E.; Osborne, B.; Bentley, N.L.; Braude, J.P.; Mitchell, T.W.; Coster, A.C.F.; Don, A.S.; et al. Regulation of glucose homeostasis and insulin action by ceramide acyl-chain length: A beneficial role for very long-chain sphingolipid species. Biochim. Biophys. Acta Mol. Cell. Biol. Lipids 2016, 1861, 1828–1839. [Google Scholar] [CrossRef] [PubMed]
- Grażyna, C.; Hanna, C.; Adam, A.; Magdalena, B.M. Natural antioxidants in milk and dairy products. Int. J. Dairy Technol. 2017, 70, 165–178. [Google Scholar] [CrossRef]
- Wu, J.; Gouveia-Figueira, S.; Domellöf, M.; Zivkovic, A.M.; Nording, M.L. Oxylipins, endocannabinoids, and related compounds in human milk: Levels and effects of storage conditions. Prostaglandins Lipid Mediat. 2016, 122, 28–36. [Google Scholar] [CrossRef] [PubMed]
- Garcia, C.; Duan, R.D.; Brévaut-Malaty, V.; Gire, C.; Millet, V.; Simeoni, U.; Bernard, M.; Armand, M. Bioactive compounds in human milk and intestinal health and maturity in preterm newborn: An overview. Cell. Mol. Biol. 2013, 59, 108–131. [Google Scholar] [CrossRef] [PubMed]
- Liu, L.; Bartke, N.; van Daele, H.; Lawrence, P.; Qin, X.; Park, H.G.; Brenna, J.T. Higher efficacy of dietary DHA provided as a phospholipid than as a triglyceride for brain DHA accretion in neonatal piglets. J. Lipid Res. 2014, 55, 531–539. [Google Scholar] [CrossRef] [PubMed]
- Moukarzel, S.; Dyer, R.A.; Keller, B.O.; Elango, R.; Innis, S.M. Human milk plasmalogens are highly enriched in long-chain PUFAs. J. Nutr. 2016, 146, 2412–2417. [Google Scholar] [CrossRef] [PubMed]
- Alexandre-Gouabau, M.C.; Courant, F.; Moyon, T.; Küster, A.; Le Gall, G.; Tea, I.; Antignac, J.P.; Darmaun, D. Maternal and cord blood LC-HRMS metabolomics reveal alterations in energy and polyamine metabolism, and oxidative stress in very-low birth weight infants. J. Proteome Res. 2013, 12, 2764–2778. [Google Scholar] [CrossRef] [PubMed]
- Küster, A.; Tea, I.; Ferchaud-Roucher, V.; Le Borgne, S.; Plouzennec, C.; Winer, N.; Rozé, J.C.; Robins, R.J.; Darmaun, D. Cord blood glutathione depletion in preterm infants: Correlation with maternal cysteine depletion. PLoS ONE 2011, 6, e27626. [Google Scholar] [CrossRef] [PubMed]
- Liet, J.M.; Piloquet, H.; Marchini, J.S.; Maugère, P.; Bobin, C.; Rozé, J.C.; Darmaun, D. Leucine metabolism in preterm infants receiving parenteral nutrition with medium-chain compared with long-chain triacylglycerol emulsions. Am. J. Clin. Nutr. 1999, 69, 539–543. [Google Scholar] [PubMed]
- Delplanque, B.; Gibson, R.; Koletzko, B.; Lapillonne, A.; Strandvik, B. Lipid quality in infant nutrition: Current knowledge and future opportunities. J. Pediatr. Gastroenterol. Nutr. 2015, 61, 8–17. [Google Scholar] [CrossRef] [PubMed]
- Arnardottir, H.; Orr, S.K.; Dalli, J.; Serhan, C.N. Human milk proresolving mediators stimulate resolution of acute inflammation. Mucosal Immunol. 2016, 9, 757–766. [Google Scholar] [CrossRef] [PubMed]
- Robinson, D.T.; Palac, H.L.; Baillif, V.; van Goethem, E.; Dubourdeau, M.; van Horn, L.; Martin, C.R. Long chain fatty acids and related pro-inflammatory, specialized pro-resolving lipid mediators and their intermediates in preterm human milk during the first month of lactation. Prostaglandins Leuk. Essent. Fat. Acids 2017, 121, 1–6. [Google Scholar] [CrossRef] [PubMed]


| “Slower” Growth Rate | “Faster” Growth Rate | p-Value | |
|---|---|---|---|
| Maternal Characteristics | 11 | 11 | |
| Age | 30.00 ± 4.12 (26.00; 33.00) | 29.00 ± 4.52 (25.00; 35.00) | 0.908 |
| BMI before gestation | 24.00 ± 5.11 (20.83; 30.80) | 22.32 ± 5.26 (19.14; 28.91) | 0.789 |
| Infants characteristics at birth | 15 (10 males and 5 females) | 11 (7 males and 4 females) | |
| Neonatal Morbidity (N° of events) | |||
| Grade III IVH | 0 | 0 | |
| Cystic PVL | 0 | 0 | |
| Severe BPD | 0 | 0 | |
| Severe ROP | 0 | 0 | |
| Severe NEC | 0 | 0 | |
| Gestational age (w) | 30.00 ± 1.68 (29.00; 32.00) | 31.00 ± 1.37 (30.0; 32.00) | 0.288 |
| Hospital stay (d) | 49.50 ± 4.21 (36.75; 54.75) | 51.50 ± 3.16 (37.25; 56.25) | 0.849 |
| Birth weight (kg) | 1.605 ± 0.211 (1.465; 1.705) | 1.200 ± 0.293 (1.020; 1.445) | 0.005 |
| Birth length (cm) | 41.20 ± 1.38 (39.00; 41.60) | 38.00 ± 1.84 (37.00; 40.00) | 0.004 |
| Birth head circumference (cm) | 28.00 ± 1.53 (27.00; 29.00) | 26.20 ± 2.07 (25.505; 28.20) | 0.202 |
| Birth weight Z-score (SD) | 0.564 ± 0.718 (−0.290; 0.842) | −1.592 ± 0.958 (−2.079; −0.571) | 0.000 |
| Birth length Z-score (SD) | 0.210 ± 0.725 (−0.522; 0.746) | −0.793 ± 0.939 (−2.245; −0.129) | 0.003 |
| Birth head circumference Z-score (SD) | −0.036 ± 0.795 (−0.686; 0.386) | −1.528 ± 1.212 (−1.651; −0.128) | 0.015 |
| BMI at birth (kg/m2) | 9.455 ± 0.857 (8.843; 9.900) | 7.694 ± 1.573 (7.139; 9.884) | 0.161 |
| Discharge weight (kg) | 2.565 ± 0.270 (2.355; 2.720) | 2.340 ± 0.320 (2.029; 2.520) | 0.041 |
| Discharge length (cm) | 45.00 ± 1.529 (44.10; 46.00) | 44.00 ± 2.543 (41.00; 45.50) | 0.219 |
| Discharge head circumference (cm) | 33.00 ± 1.412 (32.50; 34.00) | 33.50 ± 1.511 (32.00; 34.00) | 0.787 |
| Discharge weight Z-score (SD) | −1.142 ± 0.682 (−1.552; −0.953) | −1.878 ± 0.857 (−2.264; −1.127) | 0.146 |
| Discharge length Z-score (SD) | −1.800 ± 0.713 (−2.242; −1.251) | −2.349 ± 1.054 (−2.803; −1.096) | 0.466 |
| Discharge head circumference Z-score (SD) | −0.681 ± 0.775 (−1.184; 0.301) | −0.216 ± 0.754 (−1.010; 0.1074) | 0.655 |
| BMI at Discharge (kg/m2) | 12.67 ± 0.955 (11.78; 13.36) | 11.98 ± 0.485 (11.66; 12.28) | 0.047 |
| Difference between discharge and birth weight Z-score (SD) | −1.538 ± 0.417 (−1.953; −1.230) | −0.479 ± 0.189 (−0.668; −0.294) | <0.001 |
| Difference between discharge and birth length Z-score (SD) | −2.010 ± 0.752 (−2.474; −1.278) | −0.940 ± 0.723 (−1.822; −0.343) | 0.015 |
| Difference between discharge and birth head circumference Z-score (SD) | −0.113 ± 0.887 (−1.351; 0.258) | 0.762 ± 1.122 (−0.248; 1.401) | 0.017 |
| Fatty Acids (%) | W2 to W4 | Mann–Whitney p-Value from W2 to W4 | FDR Corrected q-Value from W2 to W4 | |
|---|---|---|---|---|
| “Slower” Growth (n = 38) | “Faster” Growth (n = 29) | |||
| 8:0 | 0.176 (0.151–0.211) | 0.198 (0.157–0.236) | 0.201 | 0.183 |
| 10:0 | 1.654 (1.512–1.911) | 1.791 (1.591–2.082) | 0.101 | 0.132 |
| 12:0 | 6.203 (5.817–6.866) | 7.100 (6.069–8.127) a | 0.022 | 0.055 |
| 14:0 | 7.049 (6.053–8.045) | 8.039 (6.909–9.629) a | 0.013 | 0.046 |
| 16:0 | 23.19 (19.48–24.84) | 23.15 (21.21–24.84) | 0.677 | 0.353 |
| 18:0 | 6.872 (6.313–7.556) | 6.934 (5.883–7.435) | 0.406 | 0.279 |
| 20:0 | 0.195 (0.170–0.211) | 0.196 (0.178–0.211) | 0.872 | 0.379 |
| SAT | 45.74 (41.97–48.51) | 48.08 (45.81–49.54) a | 0.027 | 0.051 |
| MCSAT | 8.050 (7.506–8.871) | 8.976 (7.772–10.210) a | 0.019 | 0.051 |
| 16:1n−9 | 0.479 (0.419–0.530) | 0.4573 (0.393–0.514) | 0.192 | 0.183 |
| 16:1n−7 | 2.331 (2.030–2.737) | 2.239 (2.098–2.698) | 0.852 | 0.379 |
| 17:1n−7 | 0.222 (0.175–0.247) | 0.228 (0.190–0.261) | 0.310 | 0.249 |
| 18:1n−9 | 34.79 (32.25–37.88) | 32.82 (31.02–34.78) a | 0.027 | 0.055 |
| 18:1n−7 | 1.720 (1.495–1.993) | 1.818 (1.556–2.007) | 0.468 | 0.287 |
| 20:1n−9 | 0.532 (0.483–0.567) | 0.520 (0.462–0.597) | 0.801 | 0.379 |
| MUFA | 41.10 (37.77–44.35) | 39.58 (36.87–40.82) a | 0.047 | 0.059 |
| MUFA/SAT | 0.91 (0.79–1.04) | 0.82 (0.74–0.91) a | 0.037 | 0.059 |
| 18:1n−9 and n−7 | 36.67 (34.09–39.79) | 34.78 (32.76–36.61) a | 0.028 | 0.051 |
| cis 18:2n−6 (LA) | 9.651 (8.754–12.41) | 8.881 (7.859–11.64) | 0.078 | 0.117 |
| cis 18:3n−6 (GLNA) | 0.107 (0.086–0.133) | 0.099 (0.078–0.125) | 0.370 | 0.276 |
| cis 20:2n−6 | 0.295 (0.252–0.332) | 0.295 (0.235–0.343) | 0.615 | 0.337 |
| cis 20:3n−6 (DGLA) | 0.349 (0.317–0.443) | 0.404 (0.317–0.456) | 0.429 | 0.279 |
| cis 20:4n−6 (AA) | 0.502 (0.425–0.580) | 0.467 (0.379–0.591) | 0.544 | 0.315 |
| cis 22:2n−6 | 0.048 (0.040–0.061) | 0.048 (0.039–0.060) | 0.791 | 0.379 |
| cis 22:4n−6 | 0.113 (0.091–0.135) | 0.108 (0.086–0.134) | 0.945 | 0.394 |
| Total n-6 PUFA | 11.44 (10.20–14.14) | 10.38 (9.434–13.32) | 0.091 | 0.088 |
| cis 18:3n−3 (ALNA) | 0.831 (0.609–1.140) | 0.947 (0.720–1.285) | 0.210 | 0.183 |
| cis 20:5n−3 (EPA) | 0.058 (0.042–0.077) | 0.076 (0.061–0.092) b | 0.006 | 0.046 |
| cis 22:5n−3 (DPA) | 0.141 (0.114–0.172) | 0.164 (0.140–0.180) a | 0.057 | 0.098 |
| cis 22:6n−3 (DHA) | 0.320 (0.220–0.390) | 0.383 (0.316–0.477) a | 0.013 | 0.046 |
| Total n-3 PUFA | 1.598 (1.411–1.976) | 1.881 (1.466–2.213) a | 0.058 | 0.067 |
| Total PUFA | 12.96 (11.74–16.40) | 12.29 (11.15–15.65) | 0.201 | 0.159 |
| Unsaturated/saturated fatty acid | 1.18 (1.06–1.38) | 1.08 (1.02–1.18) a | 0.023 | 0.052 |
| PUFA/SFA | 0.29 (0.24–0.38) | 0.26 (0.22–0.32) | 0.101 | 0.088 |
| n-6/n-3 PUFA | 7.03 (5.83–8.23) | 5.71 (5.04–6.87) 2 | 0.005 | 0.052 |
| LC-PUFA | 2.088 (1.768–2.321) | 2.129 (1.978–2.383) | 0.268 | 0.200 |
| Essential FA (LA + ALNA) | 10.73 (9.46–13.81) | 9.83 (8.79–13.18) | 0.101 | 0.088 |
| LA/ALA | 10.86 (9.30–15.66) | 9.99 (8.35–11.69) a | 0.047 | 0.059 |
| AA/DHA | 1.679 (1.251–2.191) | 1.307 (0.983–1.690) b | 0.010 | 0.052 |
| BCFA | 29.82 (28.65–30.99) | 31.25 (29.99–32.51) | 0.104 | 0.088 |
| Total lipids (Miris) (g/100 mL) | 3.55 (3.12–4.57) | 4.75 (3.97–5.65) a | 0.027 | 0.052 |
| Lipids | mz | Median [25% and 75% Percentile] from W2 to W4 | Mann–Whitney U p-Value from W2 to W4 | FDR Corrected q-Value from W2 to W4 | |
|---|---|---|---|---|---|
| “Slower” Growth (n = 38) | “Faster” Growth (n = 29) | ||||
| Fatty acid | 9.47 (7.40–12.84) | 8.39 (5.53–13.00) | 0.191 | 0.192 | |
| Anandamide (C18:3. n-6) | 339.2889 [M + NH4]+ | 8.80 (7.02–11.77) | 7.43 (5.11–11.47) | 0.119 | 0.133 |
| 3-Hydroxyadipic acid | 161.0455 [M − H]− | 17.17 (14.02–20.25) | 11.85 (5.68–15.09) | 0.000 | 0.000 |
| N-formylmaleamic acid | 142.0203 [M − H]− | 1.26 (0.84–1.64) | 0.73 (0.59–0.97) c | 0.000 | 0.000 |
| Dodecatetraenedioic acid | 221.0667 [M − H]− | 0.77 (0.53–0.88) | 0.55 (0.34–0.73) b | 0.000 | 0.001 |
| Linderic acid | 187.1340 [M − H]− | 0.52 (0.38–1.43) | 0.76 (0.42–1.80) | 0.282 | 0.066 |
| alpha-hydroxy lauric acid | 215.1653 [M − H]− | 4.06 (2.39–8.23) | 5.08 (2.51–13.03) | 0.433 | 0.087 |
| 2-hydroxy palmitic acid | 271.2281 [M − H]− | 38.63 (22.48–48.63) | 37.44 (29.98–50.32) | 0.769 | 0.126 |
| 3-oxo-4-pentenoic acid | 113.0243 [M − H]− | 1.43 (1.18–1.71) | 0.94 (0.69–1.28) c | 0.000 | 0.000 |
| Dehydrocholic acid | 401.2312 [M − H]− | 0.43 (0.21–0.73) | 0.52 (0.33–0.97) | 0.211 | 0.054 |
| 7R.9.14R-trimethyl-2E.4E.8E.10E-hexadecatetraenoic acid | 289.2169 [M − H]− | 0.19 (0.10–0.48) | 0.27 (0.14–0.46) | 0.326 | 0.072 |
| Ceramide | 15.56 (12.98–18.63) | 20.27 (17.34–23.79) c | 0.000 | 0.000 | |
| Cer (18:1/22:0) | 622.6123 [M + H]+ 604.6017 [M + H-H2O]+ 644.5491 [M + Na]+ | 1.03 (0.89–1.38) | 1.36 (1.14–1.69) b | 0.005 | 0.032 |
| Cer (d18:1/24:0) | 632.6326 [M − H2O]+ | 14.59 (12.11–17.50) | 18.78 (16.21–22.15) c | 0.000 | 0.011 |
| 650.643 [M + H]+ | |||||
| GlucosylCeramide | 511.4 (487.8–574.5) | 519.5 (483.9–558.1) | 0.764 | 0.385 | |
| Glucosylceramide (d18:2/14:0) | 685.5361 [M + NH4]+ | 32.05 (13.43–46.52) | 26.70 (13.73–41.90) | 0.519 | 0.343 |
| Galactosylceramide (d18:1/18:1) | 743.614 [M + NH4]+ | 322.7 (309.6–355.8) | 340.8 (316.5–348.9) | 0.543 | 0.355 |
| Galactosylceramide (d18:1/20:0) | 773.652 [M + NH4]+ | 31.36 (29.58–33.78) | 31.52 (30.08–33.87) | 0.734 | 0.424 |
| Glucosylceramide (d18:1/16:0) | 717.5892 [M + NH4]+ | 42.06 (34.50–48.39) | 42.43 (35.90–48.07) | 0.9440 | 0.492 |
| Glucosylceramide (d18:1/18:0) | 728.5481 [M + H]+ | 2.28 (1.54–2.87) | 1.85 (1.18–2.24) b | 0.004 | 0.032 |
| Glucosylceramide (d18:1/20:0) | 773.6614 [M + NH4]+ | 20.89 (19.20–22.66) | 19.24 (15.94–22.67) | 0.092 | 0.116 |
| Glucosylceramide (d18:1/24:0) | 854.7266 [M + Na]+ | 57.94 (54.82–62.99) | 62.46 (56.55–66.47) t | 0.068 | 0.099 |
| Phosphocholine | 357.0 (315.6–456.2) | 453.3 (370.1–568.0) b | 0.006 | 0.009 | |
| PC (18:0/18:1) | 788.5863 [M + H]+ | 2.59 (1.55–4.34) | 4.16 (3.06–5.25) a | 0.025 | 0.064 |
| PC (14:0/16:0) | 706.5391 [M + H]+ | 1.54 (1.09–2.63) | 1.830 (1.47–3.3) t | 0.134 | 0.142 |
| PC (14:0/16:1) | 704.5237 [M + H]+ | 0.20 (0.09–0.40) | 0.25 (0.13–0.50) | 0.277 | 0.224 |
| PC (20:0/20:2) | 842.636 [M + H]+ | 1.49 (1.11–2.33) | 2.33 (178–3.33) b | 0.017 | 0.053 |
| PC (16:1/18:1) | 1620.1146 [M + HPO3 + 2H]+ | 1.06 (0.89–1.21) | 1.03 (0.89–1.14) | 0.351 | 0.358 |
| PC (16:1/18:0) | 1542.1426 [2M + Na]+ | 11.76 (8.45–13.37) | 10.58 (9.23–11.88) | 0.387 | 0.277 |
| PC (16:1/18:2) | 1512.1349 [2M + H]+ | 2.33 (1.70–2.96) | 3.23 (1.762–3.79) t | 0.030 | 0.069 |
| PC (18:0/18:1) | 1576.2229 [2M + H]+ | 12.09 (7.30–23.45) | 16.68 (8.09–28.81) | 0.150 | 0.153 |
| PC (18:1/18:1) | 1572.1908 [2M + H]+ | 103.2 (84.86–131.5) | 127.6 (99.45–164.00) a | 0.036 | 0.074 |
| PC (18:0/18:2) | 786.5899 [M + H]+ | 7.02 (5.92–9.61) | 10.60 (8.13–13.21) c | 0.000 | 0.016 |
| PC (16:0/20:3) | 784.5833 [M + H]+ | 51.58 (41.81–65.60) | 65.96 (52.12–85.89) b | 0.004 | 0.030 |
| PC (18:0/20:1) | 816.6456 [M + H]+ | 11.92 (7.23–18.88) | 12.22 (8.59–20.67) | 0.386 | 0.277 |
| PC (18 :0/20 :3) | 812.6143 [M + H]+ | 30.80 (25.22–44.50) | 46.59 (37.16–55.24) c | 0.000 | 0.016 |
| PC (18 :0/20 :5) | 808.5806 [M + H]+ | 93.34 (74.64–112.8) | 94.55 (78.87–119.9) | 0.343 | 0.256 |
| PC (20:1/20:4) | 836.6145 [M + H]+ | 3.72 (2.96–4.54) | 4.88 (3.77–6.26) a | 0.007 | 0.037 |
| PC (18:0/22:6) | 834.596 [M + H]+ | 11.95 (8.65–15.21) | 12.61 (10.11–17.45) | 0.153 | 0.154 |
| PC (20:3/22:6) | 856.5807 [M + H]+ | 5.42 (3.95–6.97) | 6.46 (5.06–7.62) a | 0.013 | 0.047 |
| PC (16:0/22:6) | 806.5678 [M + H]+ | 12.08 (7.25–16.08) | 16.07 (12.04–24.40) a | 0.007 | 0.037 |
| PC-plasmalogen | 8.16 (6.53–10.52) | 8.88 (6.97–12.23) | 0.273 | 0.236 | |
| PC (P-18:0/18:0) | 796.6199 [M + Na]+ | 1.72 (1.19–2.49) | 2.32 (1.85–3.09) b | 0.008 | 0.037 |
| PC (P-16:0/18:2) | 742.5723 [M + H]+ | 2.18 (1.61–2.98) | 1.59 (1.09–2.52] t | 0.104 | 0.124 |
| PC (O-16:0/18:1) | 768.5514 [M + H]+ | 4.11 (3.36–5.58) | 4.82 (3.42–6.81) | 0.114 | 0.131 |
| Phosphoethanolamine | 279.4(253.2–317.5) | 316.5 (283.1–356.3) b | 0.002 | 0.004 | |
| PE (16:0/16:1) | 690.5054 [M + H]+ | 1.79 (1.59–2.22) | 2.15 (1.93–2.45) b | 0.005 | 0.032 |
| PE (16:1/20:0) | 1492.1294 [2M + H]+ | 6.72 (5.45–8.88) | 8.38 (6.85–10.43) a | 0.037 | 0.074 |
| PE (16:0/20:2) | 1488.0975 [2M + H]+ | 21.16 (18.3–27.46) | 27.62 (18.61–34.14) a | 0.039 | 0.075 |
| PE (16:0/20:2) | 744.5519 [M + H]+ | 142.2 (132.7–168.4) | 166.6 (151.1–179.3) a | 0.016 | 0.050 |
| PE (16:0/20:4) | 779.5379 [M + Na]+ | 0.67 (0.57–0.87) | 0.81 (0.61–1.19) a | 0.044 | 0.079 |
| PE (18:0/20:0) | 776.60 [M + H]+ | 1.68 (1.29–2.50) | 1.52 (1.25–1.73) t | 0.131 | 0.141 |
| PE (20:1/20:4) | 794.5676 [M + H]+ | 7.45 (6.07–10.05) | 9.41 (8.22–10.29) a | 0.030 | 0.069 |
| PE (18:0/20:4) | 1536.0968 [2M + H]+ | 4.93 (3.62–7.23) | 7.71 (5.28–9.57) b | 0.004 | 0.030 |
| PE (22:0/20:3) | 826.6047 [M + H]+ | 2.09 (1.53–2.61) | 2.51 (2.18–3.48) b | 0.006 | 0.033 |
| PE (18:1/18:2) | 1484.067 [2M + H]+ | 2.79 (1.97–3.99) | 3.14 (2.07–4.36) | 0.665 | 0.398 |
| PE (16:0/20:4) | 740.5208 [M + H]+ | 7.75 (5.31–9.68) | 7.18 (5.44–9.98) | 0.468 | 0.321 |
| PE (18:2/18:2) | 740.5213 [M + H]+ | 4.76(3.58–5.70) | 6.21 (4.92–7.41) b | 0.006 | 0.035 |
| PE (20:0/18:1) | 774.599 [M + H]+ | 6.92 (5.61–9.12) | 9.24 (7.24–11.69) b | 0.004 | 0.030 |
| PE (18:0/20:4) | 768.5495 [M + H]+ | 13.52 (12.42–14.25) | 14.14 (13.13–15.75) t | 0.094 | 0.118 |
| PE (20:4/20:0) | 796.5836 [M + H]+ | 6.13 (4.98–8.72) | 8.63 (6.81–10.52) b | 0.007 | 0.035 |
| PE (22:6/18:0) | 792.5517 [M + H]+ | 17.55 (12.31–22.26) | 20.02 (15.51–25.01) | 0.085 | 0.112 |
| PE (20:3/22:6) | 814.5336 [M + H]+ | 2.63 (1.96–3.06) | 3.14 (2.58–3.59) c | 0.002 | 0.023 |
| PE (22:0/22:6) | 848.6566 [M + H]+ | 4.69 (3.55–6.02) | 4.25 (2.64–4.98) | 0.131 | 0.141 |
| PE (18:0/20:3) | 770.5672 [M + H]+ | 12.72 (10.13–16.13) | 17.21 (14.84–20.82) c | 0.000 | 0.001 |
| PE-plasmalogen | 39.91 (31.47–49.92) | 38.83 (34.83–52.40) | 0.592 | 0.385 | |
| PE (P-16:0/20:5) | 722.5102 [M + H]+ | 4.73 (3.96–7.45) | 5.92 (4.46–7.69) | 0.119 | 0.133 |
| PE (P-16:0/18:0) | 726.5323 [M + Na]+ | 10.82 (7.93–14.26) | 9.44 (5.92–13.33) | 0.186 | 0.173 |
| PE (P-16:0/20:0) | 754.5636 [M + Na]+ | 4.11 (2.58–5.23) | 3.94 (2.25–4.96) | 0.343 | 0.256 |
| PE (P-16:0/20:3) | 726.5417 [M + H]+ | 10.49 (8.45–12.70) | 11.39 (9.41–14.01) | 0.117 | 0.132 |
| PE (O-18:0/20:5) | 752.5551 [M + H]+ | 7.84 (6.04–9.98) | 9.95 (7.30–12.09) a | 0.019 | 0.056 |
| Phosphatidylglycerol | 16.41 (15.59–18.36) | 18.85 (16.90–22.25) b | 0.002 | 0.004 | |
| PG (16:0/16:0) | 723.5101 [M + H]+ | 3.31 (2.77–3.90) | 3.57 (2.85–3.79) | 0.475 | 0.324 |
| PG (18:0/20:4) | 799.5425 [M + H]+ | 2.11 (1.72–2.36) | 1.90 (1.48–2.25) | 0.202 | 0.181 |
| PG (P-16:0/22:4) | 783.5586 [M + H]+ | 1.58 (1.26–1.76) | 1.93 (1.47–2.26) a | 0.021 | 0.058 |
| PG (18:2/20:5) | 810.523 [M + NH4]+ | 6.52 (5.64–7.40) | 7.67 (6.61–9.94) b | 0.001 | 0.016 |
| PG (22:2/22:6) | 892.5991 [M +NH4]+ | 3.20 (2.97–3.61) | 3.56 (3.12–3.91) a | 0.035 | 0.074 |
| Phosphinositol | |||||
| PI (36:0) PI (18:0/18:0) | 889.5716 [M + Na]+ | 0.92 (0.78–1.39) | 1.26 (0.89–2.20) a | 0.055 | 0.087 |
| Phosphoserine | |||||
| PS (40:5) | 838.552 [M + H]+ | 2.72 (2.52–3.06) | 2.95 (2.64–3.11) | 0.186 | 0.173 |
| PS (18:0/20:4) | 812.5419 [M + H]+ | 2.13 (1.59–2.77) | 2.79 (2.29–3.26) b | 0.002 | 0.023 |
| Retinol | 287.2362 [M + H]+ | 2.02 (1.33–2.97) | 1.57 (1.10–3.11) | 0.752 | 0.429 |
| Diacylglyceride | 104.0 (66.98–163.6) | 92.39 (52.86–126.5) | 0.183 | 0.192 | |
| DG (14:0/18:3) | 580.5373 [M + Na]+ | 8.52 (3.30–15.47) | 4.92 (2.30–9.16) a | 0.025 | 0.064 |
| DG (16:0/16:1) | 567.4974 [M + H]+ | 6.61 (3.88–7.99) | 5.26 (3.05–11.07) | 0.656 | 0.395 |
| DG 18:0/18:1) | 645.544 [M + Na]+ | 7.56 (5.03–7.58) | 6.90 (5.51–11.53) | 0.797 | 0.444 |
| DG (18:0/18:2) | 638.5708 [M + NH4]+ | 55.02 (36.04–87.52) | 40.60 (22.83–66.09) t | 0.045 | 0.079 |
| DG (18:0/18:1) | 634.5395 [M + NH4]+ | 10.80 (5.53–17.81) | 10.46 (7.75–17.81) | 0.582 | 0.370 |
| DG (20:4/19:0) | 681.5402 [M + Na]+ | 0.92 (0.47–1.60) | 1.07 (0.60–2.03) | 0.292 | 0.233 |
| DG (20:3:/20:0) | 697.5727 [M + Na]+ | 4.98 (2.91–9.25) | 2.74 (1.64–4.81) a | 0.027 | 0.065 |
| DG (18:3/20:0) | 647.5574 [M + H]+ | 6.81 (2.59–13.46) | 4.06 (1.51–9.17) t | 0.079 | 0.107 |
| DG (20:4/22:5) | 713.5103 [M + Na]+ | 0.56 (0.24–0.79) | 0.26 (0.15–0.56) a | 0.040 | 0.076 |
| Triglyceride | 7758 (7304–8118) | 7572 (7236–8496) | 0.717 | 0.385 | |
| TG (14:0/16:1/17:2) | 804.7056 [M + NH4]+ | 55.94 (47.00–60.12) | 59.35 (52.54–69.66) a | 0.011 | 0.043 |
| TG (14:0/14:1/14:1) | 741.5983 [M + Na]+ | 415.0 (358.3–520.8) | 415.2 (371.5–448.9) | 0.972 | 0.499 |
| TG (14:0/16:0/16:0) | 796.7277 [M + NH4]+ | 337.3 (308.2–373.3) | 381.5 (340.2–439.9) b | 0.003 | 0.030 |
| TG (14:1/14:1/18:1) | 790.6895 [M + NH4]+ | 1074 (923.6–1296) | 1074 (911.2–1330) | 0.788 | 0.442 |
| TG (14:0/14:1/19:1) | 806.712 [M + NH4]+ | 9.17 (7.68–10.01) | 9.81 (8.58–10.81) a | 0.012 | 0.046 |
| TG (13:0/14:1/20:5) | 798.6639 [M + NH4]+ | 117.1 (114.0–124.0) | 118.9 (111.6–124.5) | 0.743 | 0.427 |
| TG (16:0/16:1/16:1) | 820.7365 [M + NH4]+ | 2033 (1831–2139) | 2142 (1937–2447) a | 0.028 | 0.067 |
| TG (14:0/16:0/16:0) | 801.6948 [M + Na]+ | 25.93 (21.63–28.64) | 29.18 (24.40–36.14) b | 0.019 | 0.057 |
| TG (16:1/16:1/16:1) | 823.676 [M + Na]+ | 257.9 (246.2–272.9) | 258.8 (244.0–270.8) | 0.639 | 0.388 |
| TG (16:1/16:1/17:1) | 832.7368 [M + NH4]+ | 74.98 (64.31–82.97) | 76.59 (69.19–90.90) | 0.178 | 0.169 |
| TG (14:0/15:0/20:5) | 828.7134 [M + NH4]+ | 10.48 (8.74–11.70) | 11.27 (9.79–12.47) | 0.178 | 0.169 |
| TG (16:0/16:1/18:0) | 850.7742 [M + NH4]+ | 320.2 (306.7–334.3) | 325.7 (308.6–364.5) | 0.099 | 0.121 |
| TG (16:0/17:1/18:1) | 862.8205 [M + NH4]+ | 3.37 (2.70–5.18) | 2.93 (2.00–3.59) t | 0.051 | 0.083 |
| TG (16:0/16:0/18:1) | 850.7655 [M + NH4]+ | 12.01 (10.70–13.14) | 11.06 (9.80–12.04)1 | 0.021 | 0.058 |
| TG (16:1/16:1/17:2) | 830.7291 [M + NH4]+ | 10.40 (9.81–10.85) | 10.65 (9.44–11.54) | 0.606 | 0.378 |
| TG (18:1/20:1/22:1) | 986.9093 [M + NH4]+ | 3.29 (2.50–4.13) | 2.51 (1.83–4.16] | 0.111 | 0.128 |
| TG (16:1/16:1/18:2) | 844.7364 [M + NH4]+ | 147.3 (130.4–182.8) | 182.8 (156.9–240.3) b | 0.002 | 0.022 |
| TG (16:1/16:1/17:2) | 835.6764 [M + Na]+ | 3.64 (3.20–4.61) | 3.53 (3.09–3.89) | 0.178 | 0.169 |
| TG (16:0/16:0/16:1) | 827.7101 [M + Na]+ | 19.01 (15.59–21.21) | 21.55 (17.11–25.06) t | 0.036 | 0.074 |
| TG (16:1/18:4/18:4) | 862.6902 [M + NH4]+ | 4.35 (2.97–6.41) | 6.37 (3848–9.41) a | 0.014 | 0.047 |
| TG (16:0/17:2/18:1) | 860.7679 [M + NH4]+ | 184.9 (156.0–222.3) | 190.3 (171.0–220.9) | 0.320 | 0.247 |
| TG (16:0/16:0/17:2) | 839.7451 [M + Na]+ | 1.57 (1.37–1.71) | 1.47 (1.32–1.64) | 0.114 | 0.131 |
| TG (18:1/18:3/20:0) | 935.7928 [M + Na]+ | 3.76 (3.35–4.49) | 4.00 (3.24–4.74) | 0.639 | 0.388 |
| TG (18:0/18:1/20:3) | 933.7851 [M + Na]+ | 19.46 (17.47–22.81) | 18.90 (17.36–23.78) | 0.963 | 0.497 |
| TG (18:2/18:2/20:0) | 930.8363 [M + NH4]+ | 21.21 (18.33–23.40) | 17.47(15.95–23.86) t | 0.055 | 0.088 |
| TG (18:0/18:1/18:1) | 904.83 [M + NH4]+ | 387.1 (333.1–451.4) | 341.6 (267.7–385.0) a | 0.015 | 0.049 |
| TG (18:0/18:1/18:1) | 906.8364 [M + NH4]+ | 81.24 (74.07–95.84) | 75.22 (56.50–84.79) a | 0.025 | 0.064 |
| TG (18:1/18:1/18:1) | 902.8144 [M + NH4]+ | 956.4 (818.7–1069) | 878.3 (810.2–1074) | 0.242 | 0.203 |
| TG (16:0/18:0/18:1) | 883.761 [M + Na]+ | 41.08 (33.90–44.66) | 42.83 (40.77–45.25) | 0.233 | 0.198 |
| TG (18:1/18:1/18:2) | 900.7896 [M + NH4]+ | 246.9 (224.0–277.0) | 225.1 (190.1–236.1) a | 0.005 | 0.032 |
| TG (18:1/18:2/18:2) | 898.7739 [M + NH4]+ | 120.3 (75.92–128.3) | 96.31 (70.34–119.4) t | 0.034 | 0.073 |
| TG (18:0/18:1/18:2) | 902.8052 [M + NH4]+ | 260.5 (233.8–281.8) | 243.6 (211.4–295.7) | 0.246 | 0.205 |
| TG (16:0/17:1/20:5) | 882.7478 [M + NH4]+ | 8.63 (8.18–9.64) | 8.31 (7.60–8.83) a | 0.001 | 0.016 |
| TG (18:1/20:1/22:3) | 982.8773 [M + NH4]+ | 2.52 (1.96–3.30) | 1.94 (1.43–3.51) | 0.119 | 0.133 |
| TG(18:1/18:2/20:0) | 930.8455 [M + NH4]+ | 78.44 (71.25–95.93) | 71.54 (58.23–93.06) t | 0.059 | 0.091 |
| TG(18:2/20:4/20:4) | 944.7669 [M + NH4]+ | 39.93 (29.65–52.66) | 29.27 (22.13–49.46) | 0.094 | 0.118 |
| TG(18:1/20:4/20:4) | 946.7742 [M + NH4]+ | 8.65 (6.97–10.87) | 6.77 (5.28–11.25) | 0.101 | 0.124 |
| TG (20:0/20:0/20:4) | 989.8484 [M + Na]+ | 2.27 (1.65–2.85) | 1.68 (1.41–2.63) | 0.106 | 0.125 |
| TG (18:2/20:1/20:1) | 956.8607 [M + NH4]+ | 18.75 (14.96–25.95) | 13.52 (11.70–23.93) | 0.071 | 0.102 |
| TG (18:1/20:2/20:4) | 950.814 [M + NH4]+ | 88.26 (75.04–95.26) | 74.00 (62.15–90.20) a | 0.022 | 0.059 |
| TG (18:0/20:3/20:5) | 953.7908 [M + Na]+ | 1.89 (1.72–2.32) | 1.87 (1.77–2.48) | 0.897 | 0.477 |
| TG (18:2/20:1/20:4) | 955.8051 [M + Na]+ | 2.89 (2.46–4.61) | 3.50 (2.50–4.72) | 0.331 | 0.250 |
| TG (16:0/18:0/18:0) | 880.8213 [M + NH4]+ | 119.5 (108.1–154.4) | 110.0 (82.96–128.8) t | 0.077 | 0.107 |
| TG (18:1/20:0/20:0) | 967.8653 [M + Na]+ | 1.69 (1.34–2.62) | 1.98 (1.67–3.13) | 0.331 | 0.250 |
| TG (20:1/20:1/20:4) | 980.8615 [M + NH4]+ | 3.64 (2.69–4.41) | 2.63 (2.16–4.60) | 0.119 | 0.133 |
| TG (18:0/20:1/20:4) | 959.801 [M + NH4]+ | 9.16 (8.57–10.72) | 8.57 (7.13–11.61) | 0.298 | 0.235 |
| TG (18:0/20:3/22:0) | 991.8645 [M + NH4]+ | 2.61 (1.95–3.24) | 1.96 (1.69–3.57) | 0.153 | 0.154 |
| TG (20:2/20:4/20:4) | 977.7533 [M + NH4]+ | 3.58 (2.55–4.31) | 2.76 (2.17–4.20) | 0.137 | 0.144 |
| Sphingomyéline | 178.6 (122.6–220.0) | 188.4 (157.9–245.9] | 0.480 | 0.363 | |
| SM (d18:0/12:0) | 651.5340 [M + H]+ (isotopic peak) | 0.88 (0.52–1.02) | 1.04 (0.68–1.54) a | 0.011 | 0.044 |
| SM (d18:1/12:0) | 647.5119 [M + H]+ | 3.80 (2.89–5.56) | 5.24 (3.99–7.00) b | 0.003 | 0.029 |
| SM (18:1/14:0) | 675.5425 [M + H]+ | 72.48 (45.46–98.60) | 86.28 (68.91–111.24) a | 0.036 | 0.074 |
| SM (d18:1/16:0) | 725.5552 [M + Na]+ | 41.85 (31.37–52.33) | 39.63 (32.05–50.87) | 0.907 | 0.481 |
| SM (d18:1/16:1) | 701.5583 [M + H]+ | 13.98 (10.63–20.40) | 15.97 (12.92–17.79) | 0.574 | 0.367 |
| SM (d16:1/18:1) | 723.5399 [M + Na]+ | 2.76 (2.15–4.12) | 2.96 (2.47–3.65) | 0.682 | 0.405 |
| SM (18:1/20:1) | 779.6015 [M + Na]+ | 3.82 (3.20–4.93) | 3.29 (2.50–4.30) b | 0.026 | 0.065 |
| SM (d18:1/20:2) | 755.5768 [M + H]+ | 1.49 (1.19–2.17) | 1.15 (1.01–1.44) a | 0.010 | 0.042 |
| SM (18:1/20:1) | 757.6205 [M + H]+ | 13.82 (11.32–18.54) | 14.51 (12.06–19.27) | 1.000 | 0.506 |
| SM (d18:1/23:0) | 801.6827 [M + H]+ | 5.97 (3.64–7.23) | 7.21 (5.42–9.30) a | 0.048 | 0.081 |
| SM (d18:1/24:0) | 815.6983 [M + H]+ | 7.59 (5.81–10.37) | 7.50 (5.59–9.53) | 0.433 | 0.302 |
| Eicosanoid | |||||
| 10.11-dihydro-20-trihydroxy-leukotriene B4 | 385.2364 [M − H]− | 9.88 (6.00–12.19) | 5.66 (4.12–7.09) c | 0.000 | 0.000 |
| 20-Trihydroxy-leukotriene-B4 | 383.2208 [M − H]− | 11.22 (4.99–24.61) | 9.62 (7.27–15.02) | 0.566 | 0.104 |
| HETE | 319.2278 [M − H]− | 2.32 (1.04–0.90) | 2.31 (1.31–4.47) | 0.607 | 0.109 |
| Leukotriene B4 | 335.2227 [M − H]− | 0.51 (0.28–0.94) | 0.32 (0.22–0.60) | 0.277 | 0.065 |
| 7.8-epoxy-17S-HDHA | 357.2051 [M − H]− | 1.78 (0.80–3.71) | 1.60 (0.90–2.47) | 0.691 | 0.119 |
| 15S-HpEDE | 339.2537 [M − H]− | 1.68 (1.29–2.45) | 1.50 (1.27–2.00) | 0.292 | 0.068 |
| 11-deoxy-16.16-dimethyl-PGE2 | 363.252 [M − H]− | 52.64 (32.17–70.29) | 40.19 (25.54–50.40) a | 0.014 | 0.007 |
| 9-deoxy-9-methylene-16.16-dimethyl -PGE2 | 377.2676 [M − H]− | 1.38 (0.92–3.30) | 0.99 (0.72–1.56) | 0.099 | 0.031 |
| PGF2alpha | 353.2314 [M − H]− | 4.89 (3.26–7.50) | 4.12 (2.76–6.73) | 0.150 | 0.042 |
| 11-dehydro-2.3-dinor-TXB2 | 339.2001 [M − H]− | 2.98 (1.54–4.17) | 3.29 (2.23–4.75) | 0.147 | 0.041 |
| Lyso-PC/PE | 31.55 (25.78–38.13) | 29.07 (20.34–40.91) | 0.658 | 0.385 | |
| LysoPC (16:0) | 454.2921 [M + H]+ | 3.76 (2.85–4.60) | 3.21 (2.42–4.48) | 0.099 | 0.121 |
| LysoPC (14:0) | 468.3079 [M + H]+ | 4.40 (3.16–6.06) | 5.39 (3.52–9.12) | 0.131 | 0.141 |
| LysoPE (16:1) | 452.3133 [M + H]+ | 1.37 (1.03–1.66) | 1.65 (1.25–2.02) a | 0.056 | 0.088 |
| LysoPE (18:1) | 480.3079 [M + H]+ | 11.25 (7.84–16.01) | 8.82 (6.71–12.77) | 0.079 | 0.107 |
| LysoPE (20:5) | 500.274 [M + H]+ | 3.34(2.75–4.56) | 2.94 (2.13–5.07) | 0.198 | 0.179 |
| LysoPE (20:3) | 504.3058 [M + H]+ | 2.96 (2.23–3.56) | 3.09 (2.42–4.50) | 0.122 | 0.058 |
| LysoPE (20:4) | 502.2902 [M + H]+ | 3.58 (2.49–4.38) | 2.43 (1.74–3.27) a | 0.020 | 0.043 |
| LysoPS (22:0) | 580.3535 [M − H]− | 0.51 (0.32–1.07) | 0.43 (0.18–0.86) | 0.157 | 0.001 |
| LysoPG (22:4) | 559.2853 [M − H]− | 0.70 (0.49–0.89) | 0.30 (0.20–0.68) c | 0.000 | 0.019 |
| LysoPA (20:0) | 465.3048 [M − H]− | 4.19 (3.39–4.93) | 5.75 (3.75–8.59) a | 0.052 | 0.038 |
| Cardiolipine | |||||
| CL (18:1/18:1/20:4/18:0) | 739.5129 [M − 2H]− | 2.40 (1.32–3.57) | 2.74 (2.04–3.22) | 0.419 | 0.086 |
| CL (18:2/20:0/20:0/20:4) | 767.5439 [M − 2H]− | 3.21 (1.45–4.41) | 2.87 (1.68–4.54) | 0.842 | 0.134 |
| Infant’ Weight Growth between Birth and Discharge (SD) (p-Value Corrected–MLR) | |
|---|---|
| Fatty Acids (Targeted Analysis) | |
| 12:00 | 0.0043 |
| 14:00 | 0.0005 |
| SAT | 0.2429 |
| MCSAT | 0.0065 |
| 18:1n−9 | 0.0101 |
| MUFA | 0.0059 |
| MUFA/SFA | 0.0509 |
| 18:1n−9 et n−7 | 0.0104 |
| cis 20:5n−3 (EPA) | 0.0606 |
| cis 22:5n−3 (DPA) | 0.2651 |
| cis 22:6n−3 (DHA) | 0.1081 |
| Total n-3 PUFA | 0.3299 |
| Unsaturated/saturated fatty acid | 0.3179 |
| n-6/n-3 PUFA | 0.5089 |
| LA/ALA | 0.674 |
| AA/DHA | 0.3199 |
| Fatty acids (lipidomics analysis) | |
| 3-Hydroxyadipic acid | 0.3109 |
| N-formylmaleamic acid | 0.3362 |
| Dodecatetraenedioic acid | 0.1633 |
| Linderic acid | 0.1977 |
| alpha-hydroxy lauric acid | 0.0993 |
| 3-oxo-4-pentenoic acid | 0.2546 |
| Dehydrocholic acid | 0.3842 |
| 7R,9,14R-trimethyl-2E,4E,8E,10E-hexadecatetraenoic acid | 0.3054 |
| Ceramide | |
| Cer(d18:1/24:0) | 0.2395 |
| Sphingomyeline | |
| SM (d18:0/12:0) | 0.0919 |
| SM (d18:1/12:0) | 0.4359 |
| SM (18:1/14:0) | 0.6205 |
| SM (18:1/20:1) | 0.3694 |
| SM (d18:1/20:2) | 0.2828 |
| SM (d18:1/23:0) | 0.8853 |
| SM (d18:1/24:0) | 0.1673 |
| Glucosy/Galactosyl-Ceramide | |
| GlucosylCeramide (d18:1/18:0) | 0.5277 |
| Phosphatidylcholine | |
| PC (18:0/18:1) | 0.0445 |
| PC (20:0/20:2) | 0.3251 |
| PC (16:1/18:2) | 0.7613 |
| PC (18:1/18:1) | 0.6294 |
| PC (18:0/18:2) | 0.8524 |
| PC (16:0/20:3) | 0.3092 |
| PC (18:0/20:3) | 0.4509 |
| PC (20:1/20:4) | 0.8255 |
| PC (20:3/22:6) | 0.2408 |
| PC (16:0/22:6) | 0.6206 |
| PC-plasmalogen | |
| PC (P-18:0/18:0) | 0.6294 |
| Phosphatidylethanolamine | |
| PE (16:0/16:1) | 0.7887 |
| PE (16:1/20:0) | 0.958 |
| PE (16:0/20:2) | 0.3531 |
| PE (18:0/20:4) | 0.4997 |
| PE (22:0/20:3) | 0.9017 |
| PE (18:2/18:2) | 0.8205 |
| PE (20:0/18:1) | 0.4662 |
| PE (20:4/20:0) | 0.7422 |
| PE (20:3/22:6) | 0.0497 |
| PE (18:0/20:3) | 0.1121 |
| PE-plasmalogen | |
| PE (O-18:0/20:5) | 0.0331 |
| Phosphatidylglycerol | |
| PG (P-16:0/22:4) | 0.846 |
| PG (18:2/20:5) | 0.3118 |
| PG (22:2/22:6) | 0.2912 |
| Diacylglyceride | |
| DG (20:3:/20:0) | 0.2475 |
| Triglyceride | |
| TG (14:0/16:0/16:0) | 0.1971 |
| TG (14:0/14:1/19:1) | 0.5987 |
| TG (16:0/16:1/16:1) | 0.9338 |
| TG (14:0/16:0/16:0) | 0.7951 |
| TG (16:0/17:1/18:1) | 0.0122 |
| TG (16:1/16:1/18:2) | 0.6581 |
| TG (16:0/16:0/16:1) | 0.9685 |
| TG (16:1/18:4/18:4) | 0.0034 |
| TG (18:2/18:2/20:0) | 0.8228 |
| TG (18:0/18:1/18:1) | 0.066 |
| TG (18:1/18:1/18:2) | 0.4819 |
| TG (18:1/18:2/18:2) | 0.4212 |
| TG (16:0/17:1/20:5) | 0.9923 |
| TG (18:1/18:2/20:0) | 0.3693 |
| TG (18:1/20:2/20:4) | 0.5425 |
| Eicosanoïd | |
| 10,11-dihydro-20-trihydroxy-leukotriene B4 | 0.909 |
| Leukotriene B4 | 0.3869 |
| 15S-HpEDE | 0.0042 |
| 11-deoxy-16,16-dimethyl-PGE2 | 0.0017 |
| 9-deoxy-9-methylene-16,16-dimethyl-PGE2 | 0.0075 |
| PGF2alpha | 0.2057 |
| 11-dehydro-2,3-dinor-TXB2 | 0.5135 |
| Lyso PS/PG | |
| LysoPS (22:0) | 0.0849 |
| LysoPG (22:4) | 0.0741 |
| LysoPA (20:0) | 0.9564 |
| Cardiolipine | |
| CL (18:1/18:1/20:4/18:0) | 0.3702 |
© 2018 by the authors. Licensee MDPI, Basel, Switzerland. This article is an open access article distributed under the terms and conditions of the Creative Commons Attribution (CC BY) license (http://creativecommons.org/licenses/by/4.0/).
Share and Cite
Alexandre-Gouabau, M.-C.; Moyon, T.; Cariou, V.; Antignac, J.-P.; Qannari, E.M.; Croyal, M.; Soumah, M.; Guitton, Y.; David-Sochard, A.; Billard, H.; et al. Breast Milk Lipidome Is Associated with Early Growth Trajectory in Preterm Infants. Nutrients 2018, 10, 164. https://doi.org/10.3390/nu10020164
Alexandre-Gouabau M-C, Moyon T, Cariou V, Antignac J-P, Qannari EM, Croyal M, Soumah M, Guitton Y, David-Sochard A, Billard H, et al. Breast Milk Lipidome Is Associated with Early Growth Trajectory in Preterm Infants. Nutrients. 2018; 10(2):164. https://doi.org/10.3390/nu10020164
Chicago/Turabian StyleAlexandre-Gouabau, Marie-Cécile, Thomas Moyon, Véronique Cariou, Jean-Philippe Antignac, El Mostafa Qannari, Mikaël Croyal, Mohamed Soumah, Yann Guitton, Agnès David-Sochard, Hélène Billard, and et al. 2018. "Breast Milk Lipidome Is Associated with Early Growth Trajectory in Preterm Infants" Nutrients 10, no. 2: 164. https://doi.org/10.3390/nu10020164
APA StyleAlexandre-Gouabau, M.-C., Moyon, T., Cariou, V., Antignac, J.-P., Qannari, E. M., Croyal, M., Soumah, M., Guitton, Y., David-Sochard, A., Billard, H., Legrand, A., Boscher, C., Darmaun, D., Rozé, J.-C., & Boquien, C.-Y. (2018). Breast Milk Lipidome Is Associated with Early Growth Trajectory in Preterm Infants. Nutrients, 10(2), 164. https://doi.org/10.3390/nu10020164