Intakes of Zinc, Potassium, Calcium, and Magnesium of Individuals with Type 2 Diabetes Mellitus and the Relationship with Glycemic Control

 ,
,
Abstract
:1. Introduction
2. Materials and Methods
2.1. Study Design and Participants
2.2. Anthropometric Parameters, Bioelectric Impedance and Blood Pressure Measurements
2.3. Biochemical Analyses
2.4. Food Intake
2.5. Statistical Analyses
3. Results
4. Discussion
5. Conclusions
Author Contributions
Funding
Acknowledgments
Conflicts of Interest
References
- International Diabetes Federation. IDF Diabetes Atlas, 8th ed.; IDF: Brussels, Belgium, 2017. [Google Scholar]
- Shah, M.; Vasandani, C.; Adams-Huet, B.; Garg, A. Comparison of nutrient intakes in South Asians with type 2 diabetes mellitus and controls living in the United States. Diabetes Res. Clin. Pract. 2018, 138, 47–56. [Google Scholar] [CrossRef] [PubMed]
- Perez, A.; Rojas, P.; Carrasco, F.; Basfi-fer, K.; Perez-Bravo, F.; Codoceo, J.; Inostroza, J.; Galgani, J.E.; Gilmore, L.A.; Ruz, M. Association between zinc nutritional status and glycemic control in individuals with well-controlled type-2 diabetes. J. Trace Elem. Med. Biol. 2018, 50, 560–565. [Google Scholar] [CrossRef] [PubMed]
- Veronese, N.; Watutantrige-Fernando, S.; Luchini, C.; Solmi, M.; Sartore, G.; Sergi, G.; Manzato, E.; Barbagallo, M.; Maggi, S.; Stubbs, B. Effect of magnesium supplementation on glucose metabolism in people with or at risk of diabetes: A systematic review and meta-analysis of double-blind randomized controlled trials. Eur. J. Clin. Nutr. 2016, 70, 1354–1359. [Google Scholar] [CrossRef] [PubMed]
- Chatterjee, R.; Biggs, M.L.; de Boer, I.H.; Brancati, F.L.; Svetkey, L.P.; Barzilay, J.; Djoussé, L.; Ix, J.H.; Kizer, J.R.; Siscovick, D.S.; et al. Potassium and Glucose Measures in Older Adults: The Cardiovascular Health Study. J. Gerontol. A Biol. Sci. Med. Sci. 2015, 70, 255–261. [Google Scholar] [CrossRef] [PubMed]
- American Diabetes Association. Lifestyle Management: Standards of Medical Care in Diabetes-2018. Diabetes Care 2018, 41, S38–S50. [Google Scholar] [CrossRef] [PubMed]
- Fu, Z.; Gilbert, E.R.; Liu, D. Regulation of insulin synthesis and secretion and pancreatic Beta-cell dysfunction in diabetes. Curr. Diabetes Rev. 2013, 9, 25–53. [Google Scholar] [CrossRef]
- Solati, M.; Ouspid, E.; Hosseini, S.; Soltani, N.; Keshavarz, M.; Dehghani, M. Oral magnesium supplementation in type II diabetic patients. Med. J. Islam. Repub. Iran 2014, 28, 67. [Google Scholar]
- Wijesekara, N.; Chimienti, F.; Wheeler, M.B. Zinc, a regulator of islet function and glucose homeostasis. Diabetes Obes. Metab. 2009, 11, 202–214. [Google Scholar] [CrossRef] [Green Version]
- Sun, Q.; Van Dam, R.M.; Willett, W.C.; Hu, F.B. Prospective Study of Zinc Intake and Risk of Type 2 Diabetes in Women. Diabetes Care 2009, 32, 629–634. [Google Scholar] [CrossRef] [Green Version]
- Bonfanti, D.H.; Alcazar, L.P.; Arakaki, P.A.; Martins, L.T.; Agustini, B.C.; de Moraes Rego, F.G.; Frigeri, H.R. ATP-dependent potassium channels and type 2 diabetes mellitus. Clin. Biochem. 2015, 48, 476–482. [Google Scholar] [CrossRef]
- Sales, C.H.; Pedrosa, L.F.; Lima, J.G.; Lemos, T.M.; Colli, C. Influence of magnesium status and magnesium intake on the blood glucose control in patients with type 2 diabetes. Clin. Nutr. 2011, 30, 359–364. [Google Scholar] [CrossRef] [PubMed]
- Hruby, A.; Meigs, J.B.; O’Donnell, C.J.; Jacques, P.F.; McKeown, N.M. Higher magnesium intake reduces risk of impaired glucose and insulin metabolism and progression from prediabetes to diabetes in middle-aged americans. Diabetes Care 2014, 37, 419–427. [Google Scholar] [CrossRef] [PubMed]
- Chabosseau, P.; Rutter, G.A. Zinc and Diabetes. Arch. Biochem. Biophys. 2016, 611, 79–85. [Google Scholar] [CrossRef] [PubMed]
- Villegas, R.; Gao, Y.T.; Dai, Q.; Yang, G.; Cai, H.; Li, H.; Zheng, W.; Shu, X.O. Dietary calcium and magnesium intakes and the risk of type 2 diabetes: The Shanghai Women’s Health Study. Am. J. Clin. Nutr. 2009, 89, 1059–1067. [Google Scholar] [CrossRef] [PubMed]
- de Carvalho, G.B.; Brandão-Lima, P.N.; Maia, C.S.; Barbosa, K.B.F.; Pires, L.V. Zinc’s role in the glycemic control of patients with type 2 diabetes: A systematic review. BioMetals 2017, 30, 151–162. [Google Scholar] [CrossRef] [PubMed]
- Chatterjee, R.; Colangelo, L.A.; Yeh, H.C.; Anderson, C.A.; Daviglus, M.L.; Liu, K.; Brancati, F.L. Potassium intake and risk of incident type 2 diabetes mellitus: The Coronary Artery Risk Development in Young Adults (CARDIA) Study. Diabetologia 2012, 55, 1295–1303. [Google Scholar] [CrossRef] [PubMed]
- Drake, I.; Hindy, G.; Ericson, U.; Orho-Melander, M. A prospective study of dietary and supplemental zinc intake and risk of type 2 diabetes depending on genetic variation in SLC30A8. Genes Nutr. 2017, 12, 30. [Google Scholar] [CrossRef] [PubMed]
- World Health Organization. Obesity: Preventing and Managing the Global Epidemic; WHO Technical Report Series 894; WHO: Geneva, Switzerland, 2000; ISBN 92 4 120894 5. [Google Scholar]
- World Health Organization. Waist Circumference and Waist-Hip Ratio: Report of a WHO Expert Consultation; World Health Organization: Geneva, Switzerland, 2011; ISBN 978 92 4 150149 1. [Google Scholar]
- Brazilian Society of Cardiology. 7ª Diretriz Brasileira de Hipertensão Arterial; Arq Bras Cardiol: Rio de janeiro, Brazil, 2016; ISSN 0066-782X. [Google Scholar]
- Guenther, P.M.; DeMaio, T.J.; Ingwersen, L.A.; Berlin, M. The multiple-pass approach for the 24 hour recall in the Continuing Survey of food intakes by individuals (CSFII) 1994–1996. In Proceedings of the 2nd International Conference on Dietary Assessment Methods, Boston, MA, USA, 22–24 January 1995. [Google Scholar]
- Institute of Medicine. Dietary Reference Intakes for Calcium and Vitamin D; National Academy of Sciences: Washington, DC, USA, 2011; ISBN 978-0-309-16394-1. [Google Scholar]
- Institute of Medicine. Dietary Reference Intakes: The Essential Guide to Nutrient Requirements; National Academy of Sciences: Washington, DC, USA, 2006; ISBN 978-0-309-10091-5. [Google Scholar]
- Mccrory, M.A.; Hajduk, C.L.; Roberts, S.B. Procedures for screening out inaccurate reports of dietary energy intake. Public Health Nutr. 2002, 5, 873–882. [Google Scholar] [CrossRef] [PubMed]
- Vinken, A.G.; Bathalon, G.P.; Sawaya, A.L.; Dallal, G.E.; Tucker, K.L.; Roberts, S.B. Equations for predicting the energy requirements of healthy adults aged 18–81 y. Am. J. Clin. Nutr. 1999, 69, 920–926. [Google Scholar] [CrossRef] [Green Version]
- German Institute of Human Nutrition Potsdam-Rehbrücke (DIfE). The Multiple Source Method (MSM); DIfE: Nuthetal, Germany, 2012; Available online: https://msm.dife.de (accessed on 25 April 2018).
- Willett, W.C.; Howe, G.R.; Kushi, L.H. Adjustment for total energy intake in epidemiologic studies. Am. J. Clin. Nutr. 1997, 65, 1220S–1231S. [Google Scholar] [CrossRef] [PubMed]
- Wang, Q.; Koval, J.J.; Mills, C.A.; Lee, K.-I.D. Determination of the Selection Statistics and Best Significance Level in Backward Stepwise Logistic Regression. Commun. Stat. Simul. C 2007, 37, 62–72. [Google Scholar] [CrossRef]
- American Diabetes Association. Glycemic Targets: Standards of Medical Care in Diabetes-2018. Diabetes Care 2018, 41, S55–S64. [Google Scholar] [CrossRef]
- Sampaio, F.A.; Feitosa, M.M.; Sales, C.H.; Silva, D.M.C.; Cruz, K.J.C.; Oliveira, F.E.; Colli, C.; Marreiro, D.N. Influence of magnesium on biochemical parameters of iron and oxidative stress in patients with type 2 diabetes. Nutr. Hosp. 2014, 30, 570–576. [Google Scholar] [CrossRef]
- Eshak, E.S.; Iso, H.; Maruyama, K.; Muraki, I.; Tamakoshi, A. Associations between dietary intakes of iron, copper and zinc with risk of type 2 diabetes mellitus: A large population-based prospective cohort study. Clin. Nutr. 2018, 37, 667–674. [Google Scholar] [CrossRef] [PubMed]
- Vashum, K.P.; McEvoy, M.; Shi, Z.; Milton, A.H.; Islam, M.R.; Sibbritt, D.; Patterson, A.; Byles, J.; Loxton, D.; Attia, J. Is dietary zinc protective for type 2 diabetes? Results from the Australian longitudinal study on women’s health. BMC Endocr. Disord. 2013, 13, 40. [Google Scholar] [CrossRef] [PubMed]
- Kanoni, S.; Nettleton, J.A.; Hivert, M.F.; Ye, Z.; van Rooij, F.J.; Shungin, D.; Sonestedt, E.; Ngwa, J.S.; Wojczynski, M.K.; Lemaitre, R.N.; et al. Total Zinc Intake May Modify the Glucose-Raising Effect of a Zinc Transporter (SLC30A8) Variant: A 14-Cohort Meta-analysis. Diabetes 2011, 60, 2407–2416. [Google Scholar] [CrossRef] [PubMed] [Green Version]
- Ige, A.O.; Ajayi, O.A.; Adewoye, E.O. Anti-inflammatory and insulin secretory activity in experimental type-2 diabetic rats treated orally with magnesium. J. Basic Clin. Physiol. Pharmacol. 2018, 29, 507–514. [Google Scholar] [CrossRef] [PubMed]
- Morakinyo, A.O.; Samuel, T.A.; Adekunbi, D.A. Magnesium upregulates insulin receptor and glucose transporter-4 in streptozotocin-nicotinamide-induced type-2 diabetic rats. Endocr. Regul. 2018, 52, 6–16. [Google Scholar] [CrossRef] [Green Version]
- Dong, J.Y.; Xun, P.; He, K.; Qin, L.Q. Magnesium Intake and Risk of Type 2 Diabetes: Meta-analysis of prospective cohort studies. Diabetes Care 2011, 34, 2116–2122. [Google Scholar] [CrossRef] [Green Version]
- Barbagallo, M.; Dominguez, L.J. Magnesium and type 2 diabetes. World J. Diabetes 2015, 6, 1152–1157. [Google Scholar] [CrossRef]
- Rodríguez-Morán, M.; Guerrero-Romero, F. Oral magnesium supplementation improves insulin sensitivity and metabolic control in type 2 diabetic subjects: A randomized double-blind controlled trial. Diabetes Care 2003, 26, 1147–1152. [Google Scholar] [CrossRef]
- Paolisso, G.; Sgambato, S.; Pizza, G.; Passariello, N.; Varricchio, M.; D’Onofrio, F. Improved insulin response and action by chronic magnesium administration in aged NIDDM subjects. Diabetes Care 1989, 12, 265–269. [Google Scholar] [CrossRef]
- Paolisso, G.; Scheen, A.; Cozzolino, D.; Di Maro, G.; Varricchio, M.; D’Onofrio, F.; Lefebvre, P.J. Changes in glucose turnover parameters and improvement of glucose oxidation after 4-week magnesium administration in elderly noninsulin-dependent (type II) diabetic patients. J. Clin. Endocrinol. Metab. 1994, 78, 1510–1514. [Google Scholar] [CrossRef] [PubMed]
- Navarrete-Cortes, A.; Ble-Castillo, J.L.; Guerrero-Romero, F.; Cordova-Uscanga, R.; Juárez-Rojop, I.E.; Aguilar-Mariscal, H.; Tovilla-Zarate, C.A.; Lopez-Guevara Mdel, R. No effect of magnesium supplementation on metabolic control and insulin sensitivity in type 2 diabetic patients with normomagnesemia. Magnes. Res. 2014, 27, 48–56. [Google Scholar] [CrossRef] [PubMed]
- Lima, M.L.; Cruz, T.; Pousada, J.C.; Rodrigues, L.E.; Barbosa, K.; Cangucu, V. The Effect of Magnesium Supplementation in Increasing Doses on the Control of Type 2 Diabetes. Diabetes Care 1998, 21, 682–686. [Google Scholar] [CrossRef]
- de Valk, H.W.; Verkaaik, R.; van Rijn, H.J.; Geerdink, R.; Struyvenberg, A. Oral magnesium supplementation in insulin-requiring Type 2 diabetic patients. Diabet. Med. 1998, 15, 503–507. [Google Scholar] [CrossRef]
- Gullestad, L.; Jacobsen, T.; Dolva, L. Effect of Magnesium Treatment on Glycemic Control and Metabolic Parameters in NIDDM Patients. Diabetes Care 1994, 17, 460–461. [Google Scholar] [CrossRef] [PubMed]
- Purvis, J.R.; Cummings, D.M.; Landsman, P.; Carroll, R.; Barakat, H.; Bray, J.; Whitley, C.; Horner, R.D. Effect of oral magnesium supplementation on selected cardiovascular risk factors in non-insulin-dependent diabetics. Arch. Fam. Med. 1994, 3, 503–508. [Google Scholar] [CrossRef] [PubMed]
- Eibl, N.L.; Kopp, H.P.; Nowak, H.R.; Schnack, C.J.; Hopmeier, P.G.; Schernthaner, G. Hypomagnesemia in Type II Diabetes: Effect of a 3-month replacement therapy. Diabetes Care 1995, 18, 188–192. [Google Scholar] [CrossRef]
- Song, Y.; He, K.; Levitan, E.B.; Manson, J.E.; Liu, S. Effects of oral magnesium supplementation on glycaemic control in Type 2 diabetes: A meta-analysis of randomized double-blind controlled trials. Diabet. Med. 2006, 23, 1050–1056. [Google Scholar] [CrossRef]
- Shalileh, M.; Shidfar, F.; Haghani, H.; Eghtesadi, S.; Heydari, I. The influence of calcium supplement on body composition, weight loss and insulin resistance in obese adults receiving low calorie diet. J. Res. Med. Sci. 2010, 15, 191–201. [Google Scholar]
- Pikilidou, M.I.; Lasaridis, A.N.; Sarafidis, P.A.; Befani, C.D.; Koliakos, G.G.; Tziolas, I.M.; Kazakos, K.A.; Yovos, J.G.; Nilsson, P.M. Insulin sensitivity increase after calcium supplementation and change in intraplatelet calcium and sodium-hydrogen exchange in hypertensive patients with Type 2 diabetes. Diabet. Med. 2009, 26, 211–219. [Google Scholar] [CrossRef] [PubMed]
- Dong, J.Y.; Qin, L.Q. Dietary calcium intake and risk of type 2 diabetes: Possible confounding by magnesium. Eur. J. Clin. Nutr. 2012, 66, 408–410. [Google Scholar] [CrossRef] [PubMed]
- Van Dam, R.M.; Hu, F.B.; Rosenberg, L.; Krishnan, S.; Palmer, J.R. Dietary Calcium and Magnesium, Major Food Sources, and Risk of Type 2 Diabetes in U.S. Black Women. Diabetes Care 2006, 29, 2238–2243. [Google Scholar] [CrossRef] [PubMed] [Green Version]
- Santos, R.K.F.; Brandão-Lima, P.N.; Tete, R.M.D.D.; Freire, A.R.S.; Pires, L.V. Vitamin D ratio and glycaemic control in individuals with type 2 diabetes mellitus: A systematic review. Diabetes Metab. Res. Rev. 2018, 34, 1–11. [Google Scholar] [CrossRef] [PubMed]
- Chatterjee, R.; Yeh, H.C.; Shafi, T.; Selvin, E.; Anderson, C.; Pankow, J.S.; Miller, E.; Brancati, F. Serum and dietary potassium and risk of incident type 2 diabetes mellitus: The Atherosclerosis Risk in Communities (ARIC) study. Arch. Intern. Med. 2010, 170, 1745–1751. [Google Scholar] [CrossRef] [PubMed]
- Becker, W.; Welten, D. Under-reporting in dietary surveys—Implications for development of food-based dietary guidelines. Public Health Nutr. 2001, 4, 683–687. [Google Scholar] [CrossRef] [PubMed]
- Mirmiran, P.; Esmaillzadeh, A.; Azizi, F. Under-reporting of energy intake affects estimates of nutrient intakes. Asia Pac. J. Clin. Nutr. 2006, 15, 459–464. [Google Scholar] [PubMed]


| Variables | T2DM (n = 95) |
|---|---|
| Age, years | 48.6 ± 8.4 |
| Sex | |
| Men, n (%) | 29 (30.5) |
| Women, n (%) | 66 (69.5) |
| Time of T2DM diagnosis 1, years | 7.3 ± 6.2 |
| Insulin therapy 2, n (%) | 21 (22.1) |
| Oral antidiabetic agents 2, n (%) | 70 (73.7) |
| Lipid-lowering agents 2, n (%) | 24 (25.3) |
| Antihypertensive agents 2, n (%) | 46 (48.4) |
| Weight, kg | 78.9 ± 19.3 |
| BMI, kg/m2 | 30.2 ± 6.8 |
| Fat mass 2, % | 35.0 ± 7.9 |
| Waist circumference, cm | 99.8 ± 14.3 |
| Men, n (%) | |
| <94 cm | 8 (27.6) |
| ≥94 cm | 21 (72.4) |
| Women, n (%) | |
| <80 cm | 6 (9.1) |
| ≥80 cm | 60 (90.9) |
| SBP 3, mmHg | 129.2 ± 17.0 |
| DBP 3, mmHg | 83.5 ± 15.3 |
| Fasting glucose, mg/dL | 180.1 ± 84.1 |
| %Hb1Ac | 8.1 ± 2.1 |
| Insulin, µU/mL | 13.8 ± 13.5 |
| C-peptide, ng/mL | 2.7 ± 0.8 |
| HOMA2-%B | 77.0 ± 56.2 |
| HOMA2-%S | 42.8 ± 20.9 |
| HOMA2-IR | 3.3 ± 2.9 |
| Total cholesterol, mg/dL | 193.4 ± 47.3 |
| HDL-c, mg/dL | 41.1 ± 10.4 |
| LDL-c, mg/dL | 117.4 ± 39.8 |
| Triglycerides, mg/dL | 174.3 ± 117.1 |
| Energy intake, kcal/day | 1469.4 ± 478.5 |
| Protein intake, g/day | 80.0 ± 20.2 |
| Carbohydrate intake, g/day | 210.1 ± 73.6 |
| Lipid intake, g/day | 37.1 ± 15.6 |
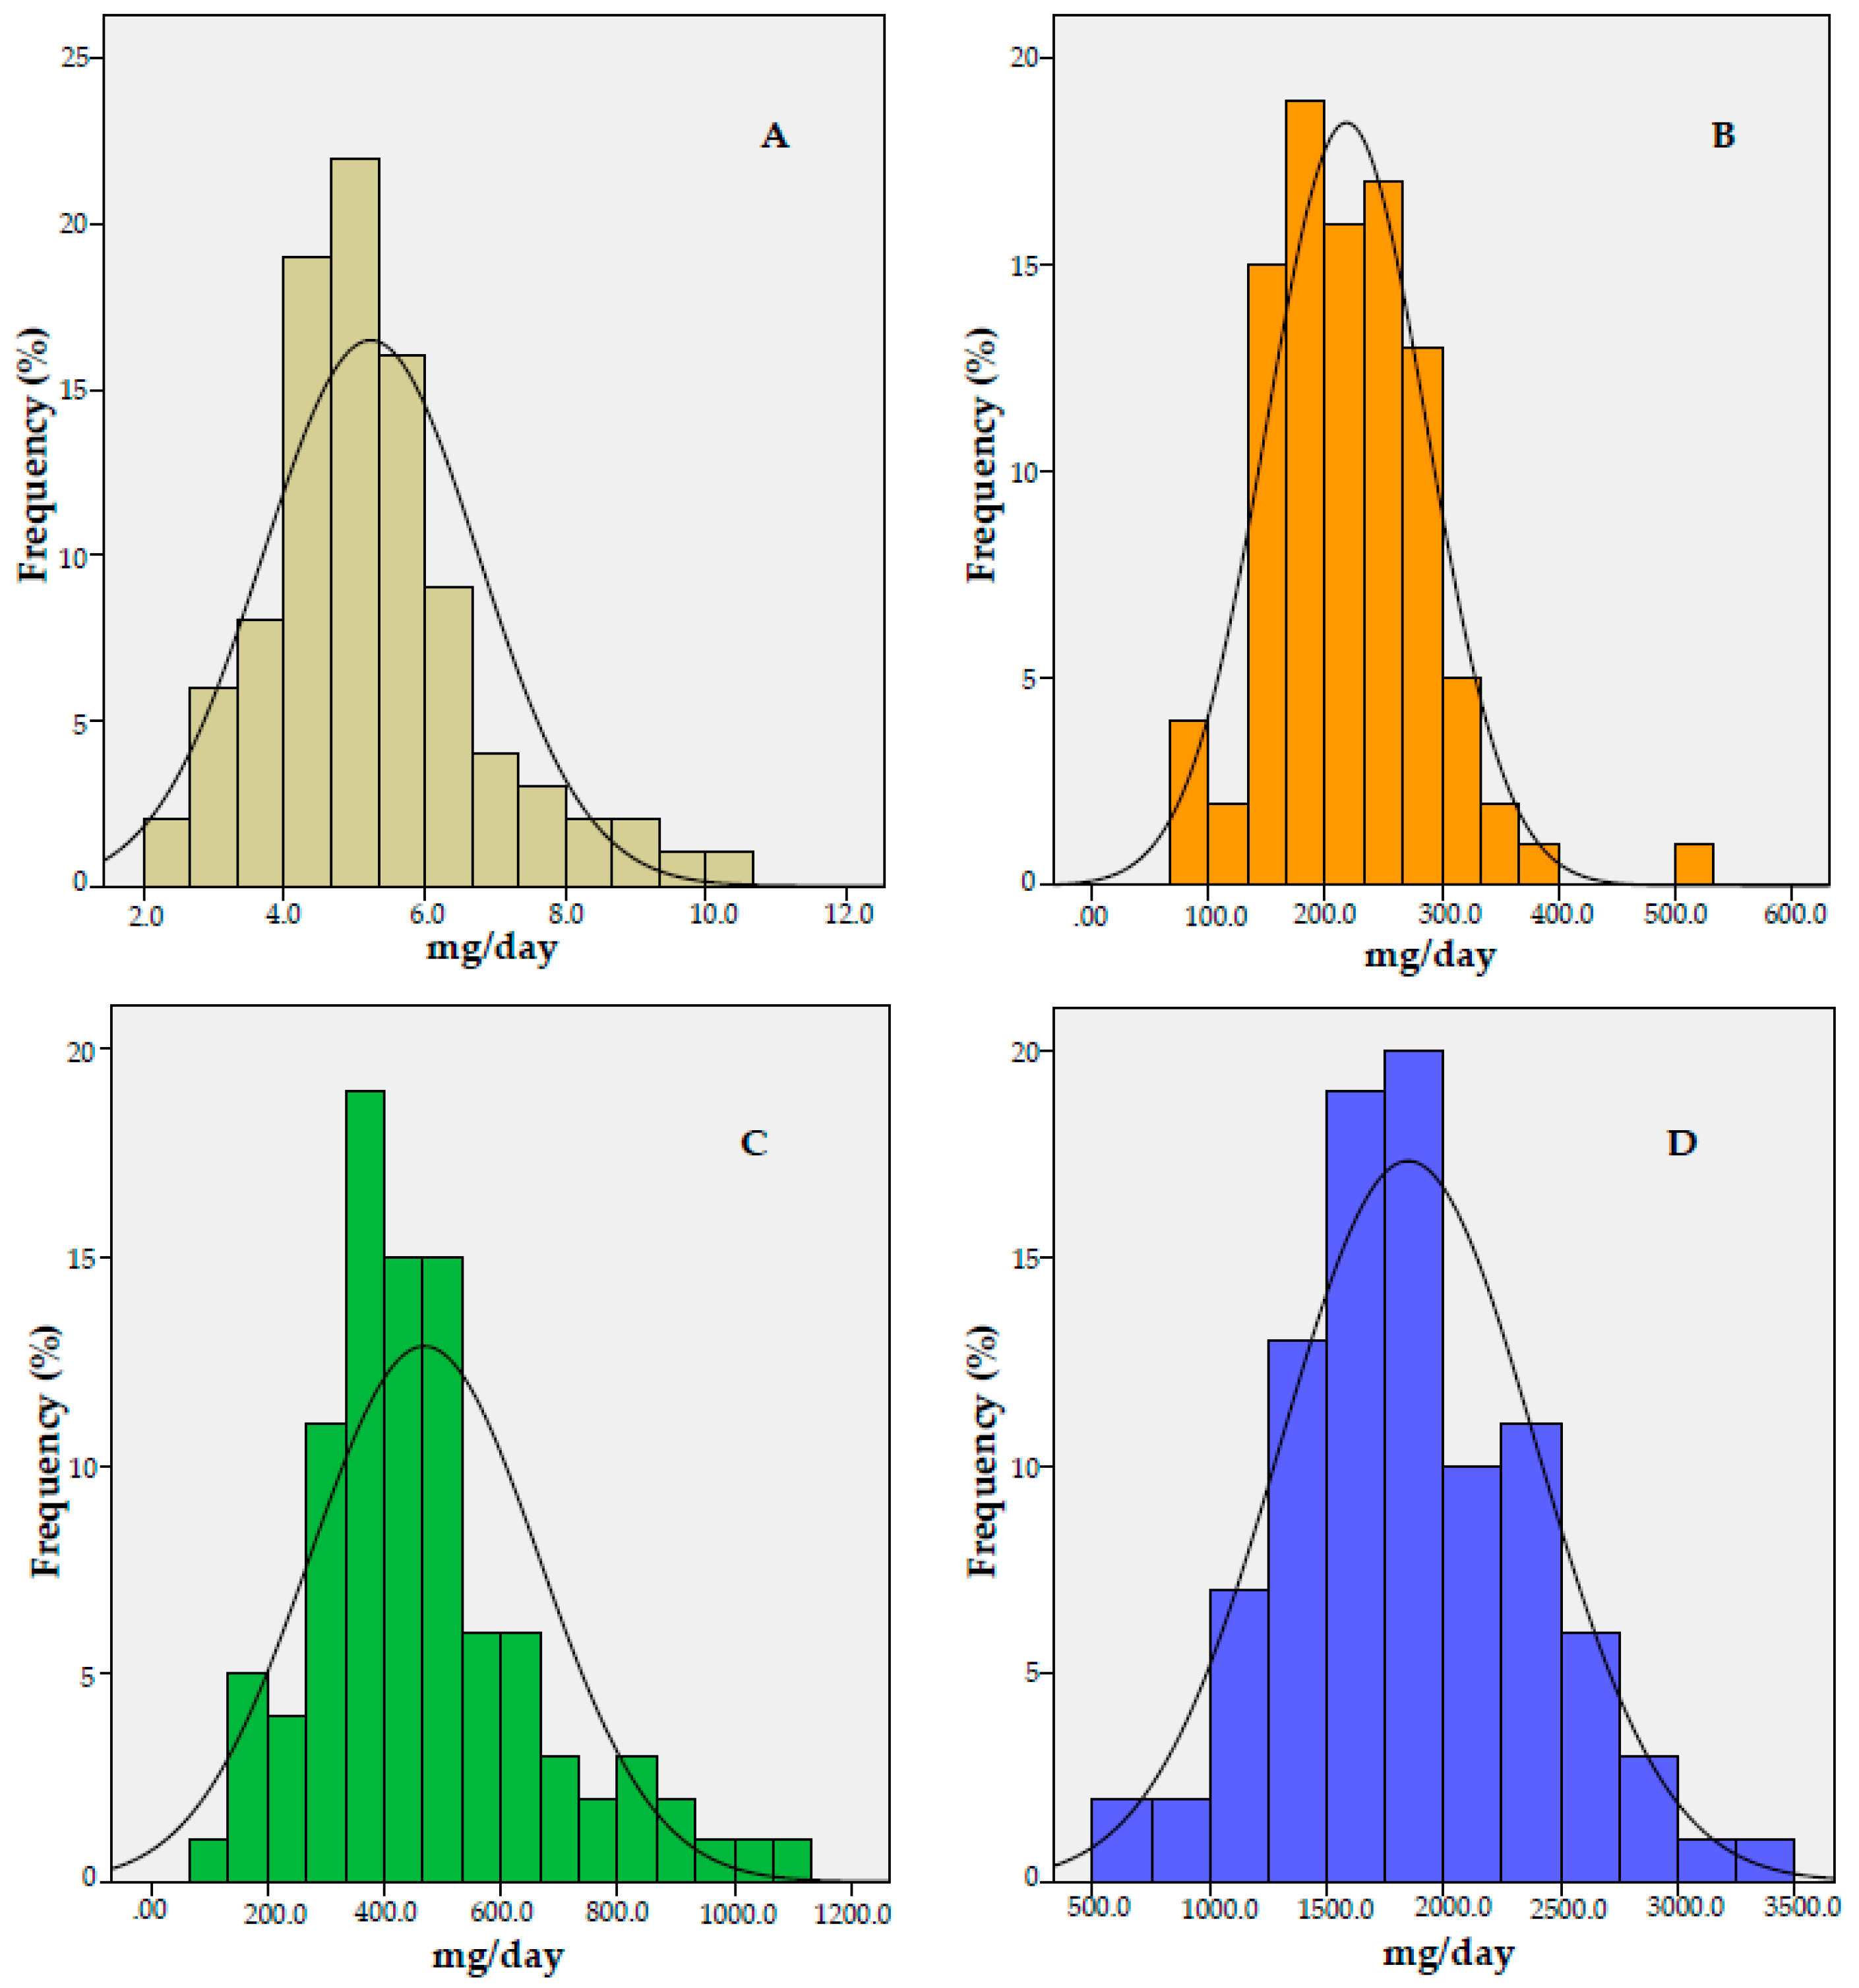
| Zinc intake, mg/day | 5.2 ± 1.5 |
| Potassium intake, mg/day | 1848.5 ± 543.4 |
| Calcium intake, mg/day | 469.0 ± 195.3 |
| Magnesium intake mg/day | 218.4 ± 68.1 |
| Variables | Cluster 1 (n = 65) | Cluster 2 (n = 30) | p-value |
|---|---|---|---|
| Age, years | 48.6 ± 8.6 | 48.9 ± 7.9 | 0.866 ¥ |
| Time of T2DM diagnosis, years | 7.2 ± 6.4 | 7.4 ± 6.0 | 0.909 |
| BMI, kg/m2 | 30.4 ± 6.9 | 29.9 ± 6.7 | 0.762 ¥ |
| Waist circumference, cm | 100.8 ± 13.7 | 97.7 ± 15.5 | 0.332 |
| Fat mass, % | 34.6 ± 8.0 | 35.8 ± 7.8 | 0.483 |
| Total cholesterol, mg/dL | 198.8 ± 49.7 | 181.5 ± 40.0 | 0.097 |
| HDL-c, mg/dL | 41.9 ± 10.5 | 39.2 ± 10.3 | 0.247 |
| LDL-c, mg/dL | 117.9 ± 42.2 | 116.4 ± 34.5 | 0.867 |
| Triglycerides, mg/dL | 194.9 ± 131.1 | 129.6 ± 58.5 | 0.010 |
| %Hb1Ac | 8.3 ± 2.1 | 7.2 ± 1.7 | 0.006 |
| C-peptide, ng/mL | 2.7 ± 0.9 | 2.7 ± 0.7 | 0.963 |
| Fasting glucose, mg/dL | 190.3 ± 88.2 | 158.1 ± 70.7 | 0.082 ¥ |
| Insulin, µU/mL | 13.2 ± 11.7 | 15.1 ± 16.8 | 0.525 |
| HOMA2-%B | 73.7 ± 59.4 | 84.0 ± 48.8 | 0.407 ¥ |
| Energy intake, kcal/day | 1452.3 ± 471.4 | 1506.3 ± 499.7 | 0.611 |
| Lipid intake, g/day | 37.4 ± 15.1 | 36.5 ± 16.8 | 0.796 |
| Protein intake, g/day | 80.2 ± 19.7 | 79.4 ± 21.4 | 0.856 |
| Carbohydrate intake, g/day | 203.6 ± 74.1 | 224.2 ± 71.7 | 0.207 |
| Zinc intake, mg/day | 4.8 ± 1.4 | 6.1 ± 1.5 | <0.001 |
| Potassium intake, mg/day | 1556.5 ± 344.3 | 2480.9 ± 301.4 | <0.001 |
| Calcium intake, mg/day | 400.6 ± 136.4 | 616.9 ± 222.4 | <0.001 |
| Magnesium intake mg/day | 191.5 ± 54.2 | 276.6 ± 58.5 | <0.001 |
| Dependent Variable | Covariables | OR (95% CI) | p-value |
|---|---|---|---|
| %Hb1Ac § | Age (years) £ | 0.987 (0.931; 1.046) | 0.661 |
| Sex § | 1.598 (0.580; 4.405) | 0.365 | |
| Time of T2DM diagnosis (years) £ | 1.155 (1.043; 1.278) | 0.005 | |
| Cluster 1 § | 3.041 (1.131; 8.175) | 0.028 |
| Independent Variables | β (95%CI) | p-value | r2 Adjusted | |
|---|---|---|---|---|
| Model 1 1 | Age (years) | −0.032 (−0.082; 0.019) | 0.216 | 0.143 |
| Sex § | 1.069 (0.209; 1.930) | 0.015 | ||
| Time of T2DM diagnosis (years) | 0.117 (0.051; 0.183) | 0.001 | ||
| Zinc intake (mg/day) | −0.017 (−0.283; 0.250) | 0.902 | ||
| Model 2 2 | Age (years) | −0.028 (−0.077; 0.021) | 0.259 | 0.198 |
| Sex § | 0.925 (0.086; 1.765) | 0.031 | ||
| Time of T2DM diagnosis (years) | 1.118 (0.054; 0.182) | <0.001 | ||
| Potassium intake (mg/day) | −0.001 (−0.002; 0.000) | 0.017 | ||
| Model 3 2 | Age (years) | −0.029 (−0.079; 0.021) | 0.253 | 0.151 |
| Sex § | 1.025 (0.163; 1.887) | 0.020 | ||
| Time of T2DM diagnosis (years) | 0.119 (0.053; 0.184) | 0.001 | ||
| Calcium intake (mg/day) | −0.001 (−0.003; 0.001) | 0.377 | ||
| Model 4 2 | Age (years) | −0.031 (0.080; 0.017) | 0.206 | 0.201 |
| Sex § | 1.009 (0.177; 1.840) | 0.018 | ||
| Time of T2DM diagnosis (years) | 0.117 (0.053; 0.181) | <0.001 | ||
| Magnesium intake (mg/day) | −0.007 (−0.012; −0.001) | 0.015 |
© 2018 by the authors. Licensee MDPI, Basel, Switzerland. This article is an open access article distributed under the terms and conditions of the Creative Commons Attribution (CC BY) license (http://creativecommons.org/licenses/by/4.0/).
Share and Cite
Brandão-Lima, P.N.; Carvalho, G.B.d.; Santos, R.K.F.; Santos, B.D.C.; Dias-Vasconcelos, N.L.; Rocha, V.D.S.; Barbosa, K.B.F.; Pires, L.V. Intakes of Zinc, Potassium, Calcium, and Magnesium of Individuals with Type 2 Diabetes Mellitus and the Relationship with Glycemic Control. Nutrients 2018, 10, 1948. https://doi.org/10.3390/nu10121948
Brandão-Lima PN, Carvalho GBd, Santos RKF, Santos BDC, Dias-Vasconcelos NL, Rocha VDS, Barbosa KBF, Pires LV. Intakes of Zinc, Potassium, Calcium, and Magnesium of Individuals with Type 2 Diabetes Mellitus and the Relationship with Glycemic Control. Nutrients. 2018; 10(12):1948. https://doi.org/10.3390/nu10121948
Chicago/Turabian StyleBrandão-Lima, Paula Nascimento, Gabrielli Barbosa de Carvalho, Ramara Kadija Fonseca Santos, Beatriz Da Cruz Santos, Natalia Lohayne Dias-Vasconcelos, Vivianne De Sousa Rocha, Kiriaque Barra Ferreira Barbosa, and Liliane Viana Pires. 2018. "Intakes of Zinc, Potassium, Calcium, and Magnesium of Individuals with Type 2 Diabetes Mellitus and the Relationship with Glycemic Control" Nutrients 10, no. 12: 1948. https://doi.org/10.3390/nu10121948