1. Introduction
The European Common Agricultural Policy provides financial support to agricultural producers via a number of different subsidies and measures [
1]. Thus, the administrations of the European Community states make great efforts to meet the necessary requirements to receive this aid. In this context, and due to its significant spatial presence and economic relevance, agricultural geographical databases of olive groves, vineyards, orchards and citrus trees should be kept up-to-date by the regional public bodies.
The combination of photointerpretation and field visits is a very popular up-dating technique because of the high level of accuracy it provides [
2]. However, it is very costly in terms of both the economic and time investments it requires. For this reason, developing an effective methodology to detect changes in AGDBs is a topic of high interest among public administrations at both the regional and national levels. Automatic crop identification methodologies based on the processing of remotely sensed images reduce the cost and accelerate the updating process, making this technique a viable option for detecting changes in AGDB [
3]. Different authors have assessed the utility of remotely sensed image processing for automatic identification and management of crops [
4,
5,
6,
7] as well as for updating GDBs [
8,
9].
To update AGDBs using remotely sensed sub-metric resolution images, there should be, at minimum, an annual coverage of the entire territory. However, the acquisition of multi-spectral satellite data with very high spatial resolution of a large territory is very costly. Besides, cloud cover further compromises the acquisition of useful observations in many regions of the World. This suggests the need to find alternative sources of information with enough spatial resolution to tackle this issue.
Digital orthophotos are routinely acquired in many countries of the world, since they are a crucial information source for land planning and related activities. Orthophotos are high resolution aerial images that have been subjected to a photogrammetric process. This process gives the image the right scale and coordinates, allowing its use as a map. Historically, the orthophoto has been used in cartography generation and in photointerpretation processes. Therefore, the development of photogrammetric systems has been focused on obtaining geospatial information as accurate as possible. In this context, the orthophoto radiometry has been utilized from a visual and not quantitative point of view. Nowadays, an intense research effort is being made to introduce a rigorous radiometric correction in the orthophoto production. This correction will be useful for: (1) eliminating discontinuities in the radiometry of orthophoto mosaics; (2) obtaining “real“ color orthophoto; and (3) using the orthophoto to calculate biophysical parameters. Generating a uniform regional or country level orthophoto from individual ones (in most cases acquired in different dates, with different illumination conditions, etc.) involves a process of mosaicking that necessarily modifies the spectral values of pixels to homogenize their color and brightness settings. This fact precludes the use of orthophotos as a source of spectral information in the process of automatic detection of crops in studies that consider wide areas. However, due to their high spatial resolution their textural information can still be useful to identify different crops and land covers [
10,
11,
12]. The use of spectral information from orthophoto should be limited to small areas covered by a single or by contiguous orthophotos captured under the same conditions to achieve comparable spectral values. Therefore, the spatial characteristics such as texture become an interesting alternative for studies based on orthophotos at the regional level.
Image texture is an important spatial component of remotely sensed images. The texture of an image can be defined as the relationship between the grey levels of neighboring pixels that contribute to the general appearance of the image [
13,
14]. Texture is essential for the perception of different regions and cover types on images [
15]. Because the textural characteristics of images provide useful information for discrimination, it is important to set features to quantitatively evaluate it [
16].
Many scientists have tackled the problem of texture feature extraction; thus, a variety of methods for quantifying spatial patterns have been proposed, such as variograms [
17], fractals [
18], scale-invariant feature transform (SIFT) [
19,
20,
21], wavelet transformation [
10] and both first and second order statistics [
22]. One of the most common procedures used to measure texture involves the use of a grey level co-occurrence matrix [
13,
23,
24]. This matrix includes the relative frequencies with which two neighbor pixels, separated at distance
with direction
, occur in the image, one with a grey tone
, and other with a grey tone
. The set of features proposed by Haralick et al. [
16] based on GLCM has been recently assessed for diverse applications using very high resolution (VHR) imagery such as GeoEye [
25,
26], WorldView-2 [
27,
28,
29,
30], WorldView-3 [
31] or Unmanned Aerial Vehicles (UAVs) imagery [
32,
33]. GLCM based features (H) have been successfully used in the agroforestry field for diverse applications as land cover mapping of forested areas [
24] and for crops identification in agriculture [
3,
34], such as vineyards and orchards [
4,
34,
35,
36,
37]. Regarding previous work in VHR image texture analysis using wavelet decomposition, different texture features have been extracted and assessed using VHR imagery, such as the local energy [
38], the variance filter [
39] or histogram signatures [
40], among others. In the field of agriculture, Recio [
41] applied features based on wavelet planes (W) to update agricultural AGDBs.
According to Tuceryan and Jain [
42], texture is a property of the context, and the definition of the context is associated with the choice of a neighborhood of pixels, so called objects. Working at object level allows neighboring pixels to be grouped in homogeneous areas with physical meaning, which will later be characterized texturally and identified as independent units. In agriculture, it is common to use pixel grouping methodologies based on Geographic Information System (GIS) data that is superimposed on the image [
9,
43]. This process is known as parcel-level segmentation and is applied especially in agriculture, where the dominant spatial unit is the cadastral parcel [
44]. The boundaries between adjacent parcels are helpful for detecting changes and updating agricultural databases because these boundaries are relatively stable, while crops change frequently [
45]. This approach assumes that cartographic boundaries are stable over time and homogeneous in relation to a selected legend, so crops can be identified but the boundaries between them are not modified. In parcel-level classification, every pixel of the parcel is classified in the same category, which reduces the typical
salt and pepper effect obtained when classifying very high-resolution images at pixel level. This technique reduces the amount of data that must be classified and produces results that are easily interpretable. Multiple classification algorithms have been developed; the choice of one depends on the nature of the data and the sample size. Classifiers can differ greatly in terms of the training information they require for an accurate classification [
46]. A training set that could be used to derive a highly accurate classification from one classifier may yield a lower accuracy if used with another classifier [
47]. For example, unequal size of classes and small training samples do not influence the results of the Discriminant Analysis classifier [
48], which could be useful when a minority class wants to be identified among a big population. Discriminant Analysis classifier has been assessed in Remote Sensing (RS) to identify rainforest types [
49], forest types [
50] grass weeds [
51,
52] or crop stress [
52,
53,
54].
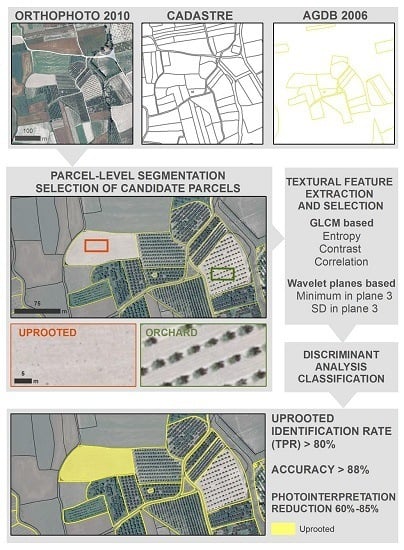
The objective of this study is to determine whether it is possible to automatically detect uprooted orchards by using only textural information calculated from orthophotos, with the aim of reducing the amount of photointerpretation needed in the updating process of agricultural databases. The use of orthophotos in automated RS applications would extend the utility of this image, which is freely available in most cases, and thus reduce the need to purchase VHR satellite imagery for this particular application To this aim, a combination of textural features based on GLCM and Wavelet planes were used in this paper due to its acceptance in research scenarios analogous to the analyzed in this investigation [
4,
34,
37,
41], and because it is widely acknowledged that properly combining multiple features results in good classification performance [
55]. The proposed approach is based on supervised Discriminant Analysis classification performed at parcel-level in order to discriminate between orchards and uprooted orchard parcels. Due to the large number of textural features that can be drawn from each parcel, a statistical analysis was performed based on the study of both relevancy and redundancy. This analysis aims to reduce the number of features without losing information and maximizing the separability between uprooted orchard parcels and orchard parcels.
2. Materials and Methods
2.1. Study Area
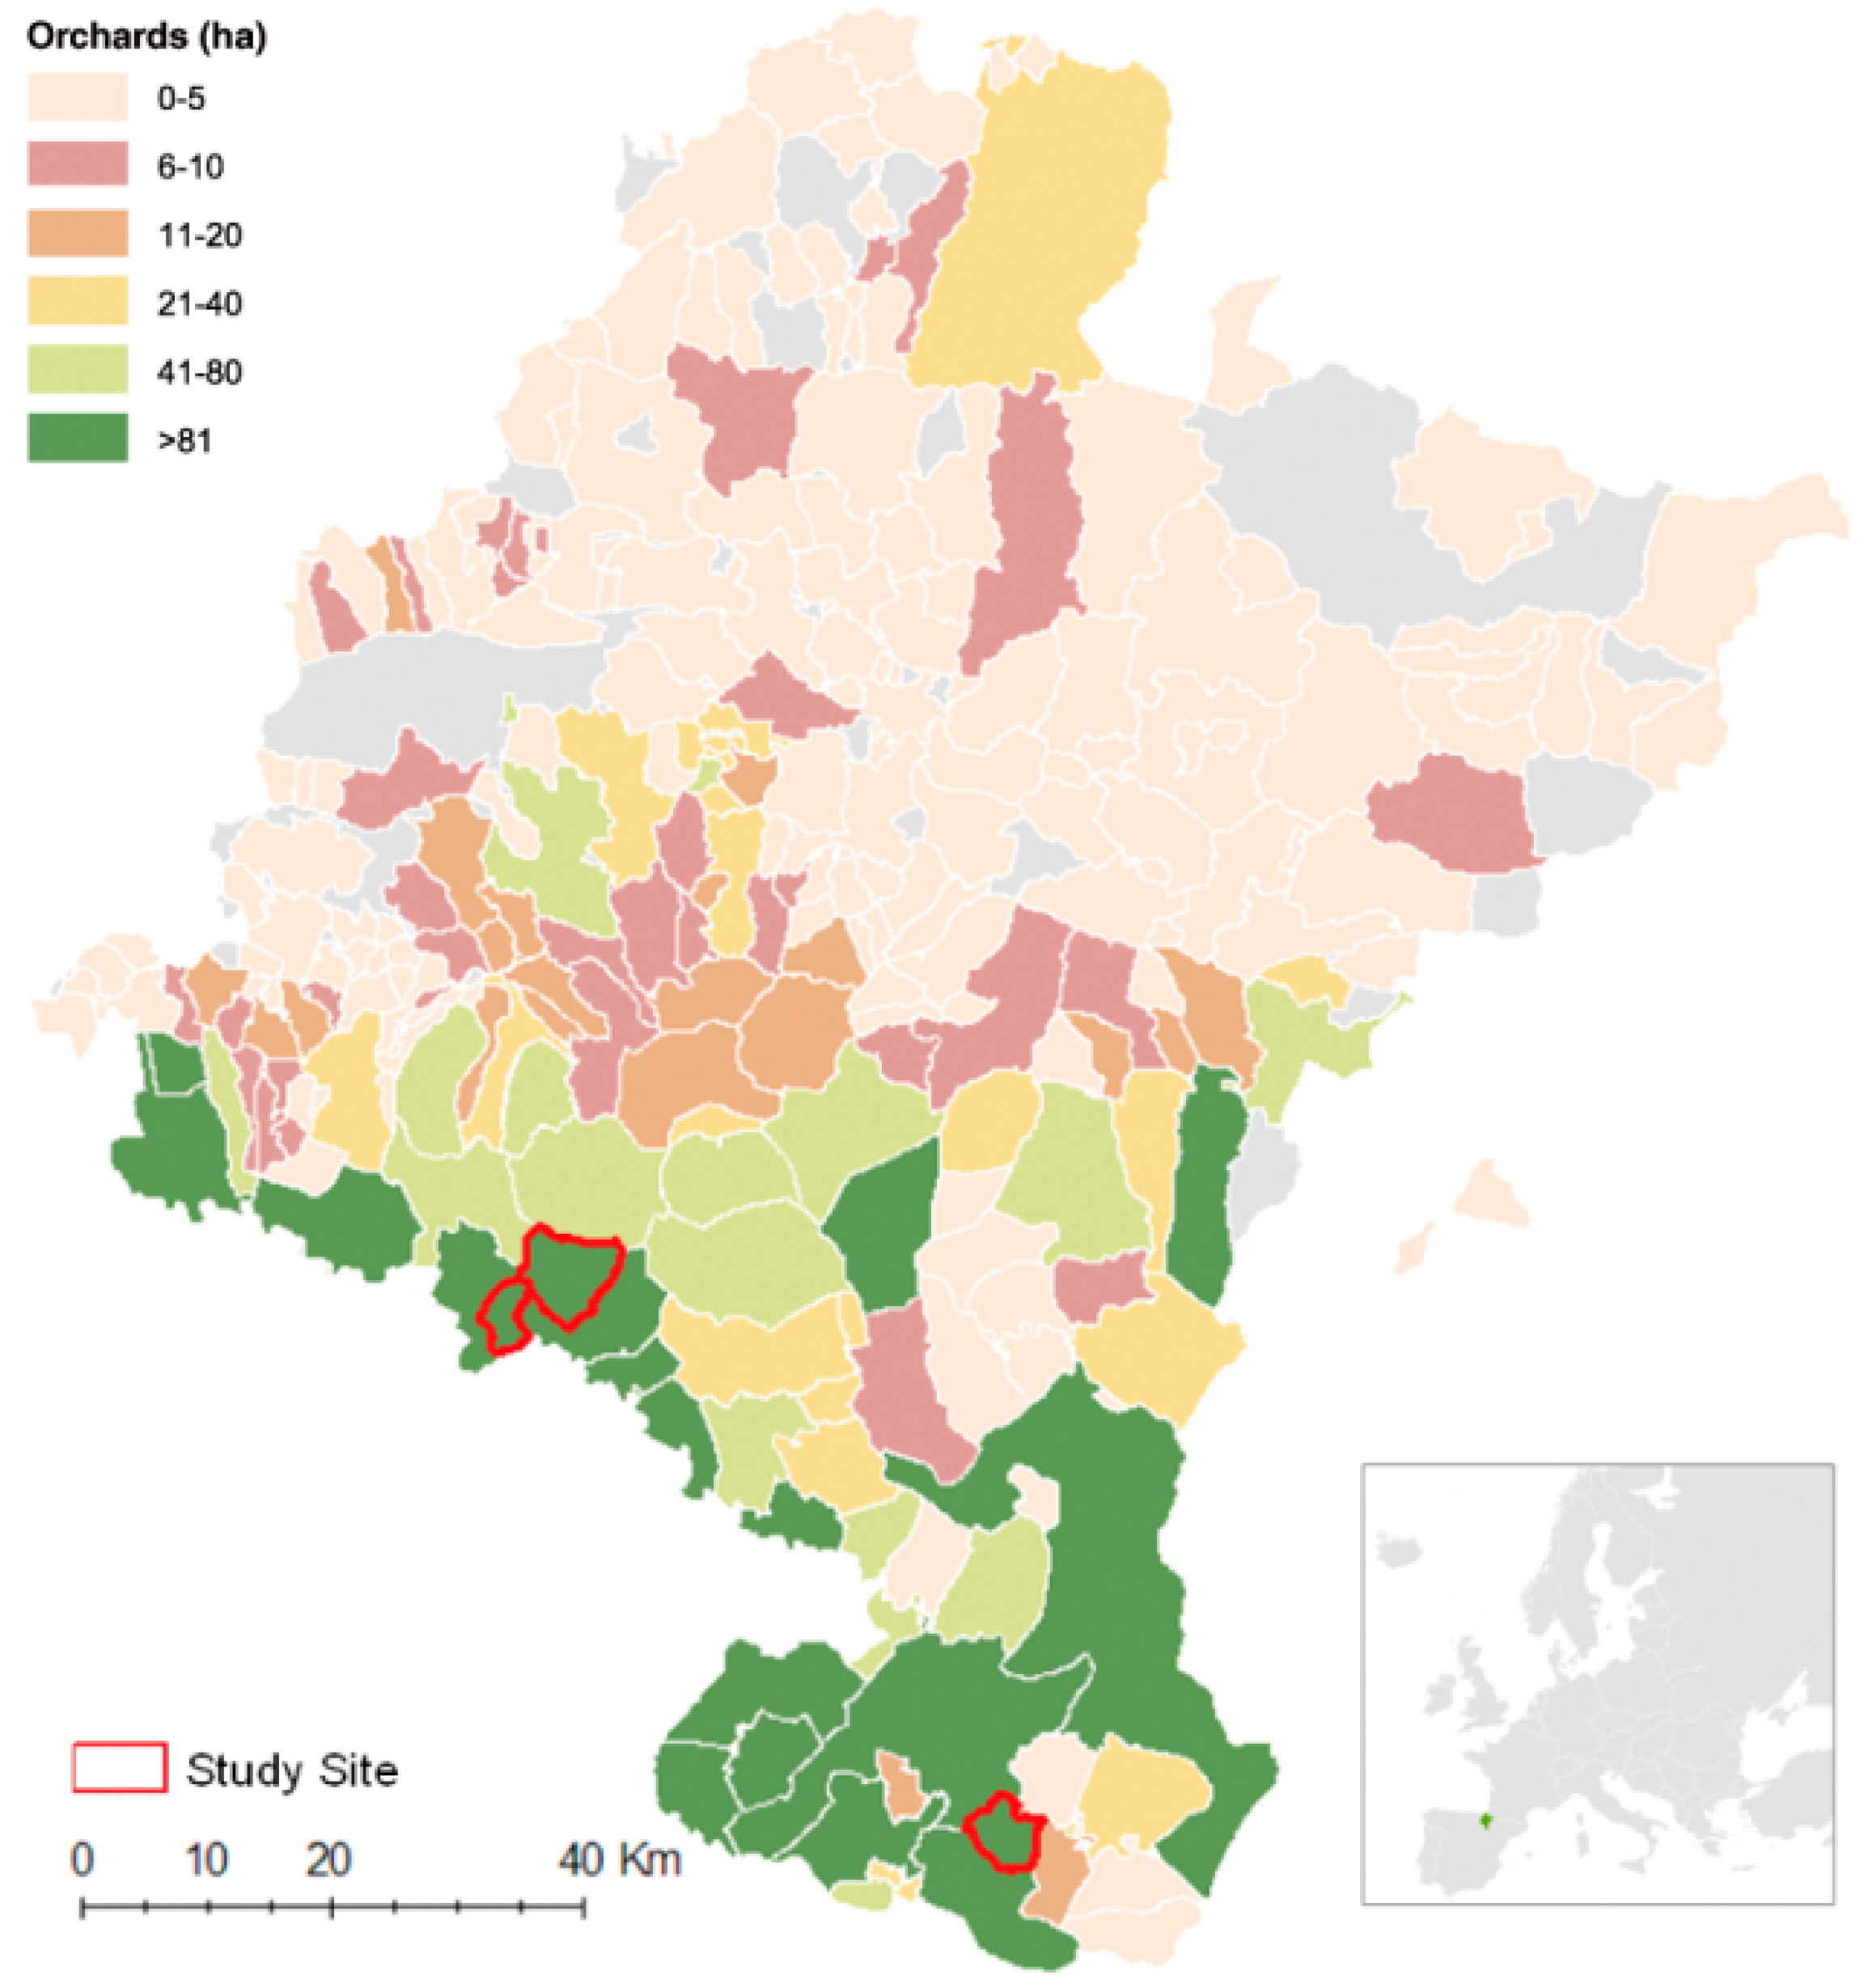
Navarre, with a surface area of 10,400 km
2, is located in the northern part of Spain at the western end of the Pyrenees. Permanent crops represent approximately 10% of the agricultural area of Navarre, and normally consist of small parcels scattered throughout the territory.
Figure 1 shows the location of the study sites and the area occupied by orchards in each of the municipalities of Navarre. The study is focused on the parcels of the Orchard Register of 2006 that belong to the municipalities of Sartaguda, Fontellas and Carcar, involving a total of 2072 study parcels. These parcels are candidates that are likely to contain an uprooted orchard, as uprooted orchards can only occur in parcels in which an orchard was previously located. Parcel size in hectares (ha) ranges approximately from 0.01 ha to 20 ha, 0.4 ha and 0.23 ha being the mean and the median of the parcels size, respectively.
2.2. Data Preparation
The textural data were obtained from the National Plan of Aerial Orthophotography (PNOA) digital orthophoto. Since 2004, in Spain, the PNOA provides annual, complete, country-wide coverage with a spatial resolution of at least 0.5 m. This image is available for free and can be requested from the website of the Spanish National Institute of Geography. Specifically, the used orthophoto was an 8-bit RGB-NIR image with a spatial resolution of 0.25 m. This orthophoto was acquired in June 2010 with a Digital Mapping Camera (DMC) sensor.
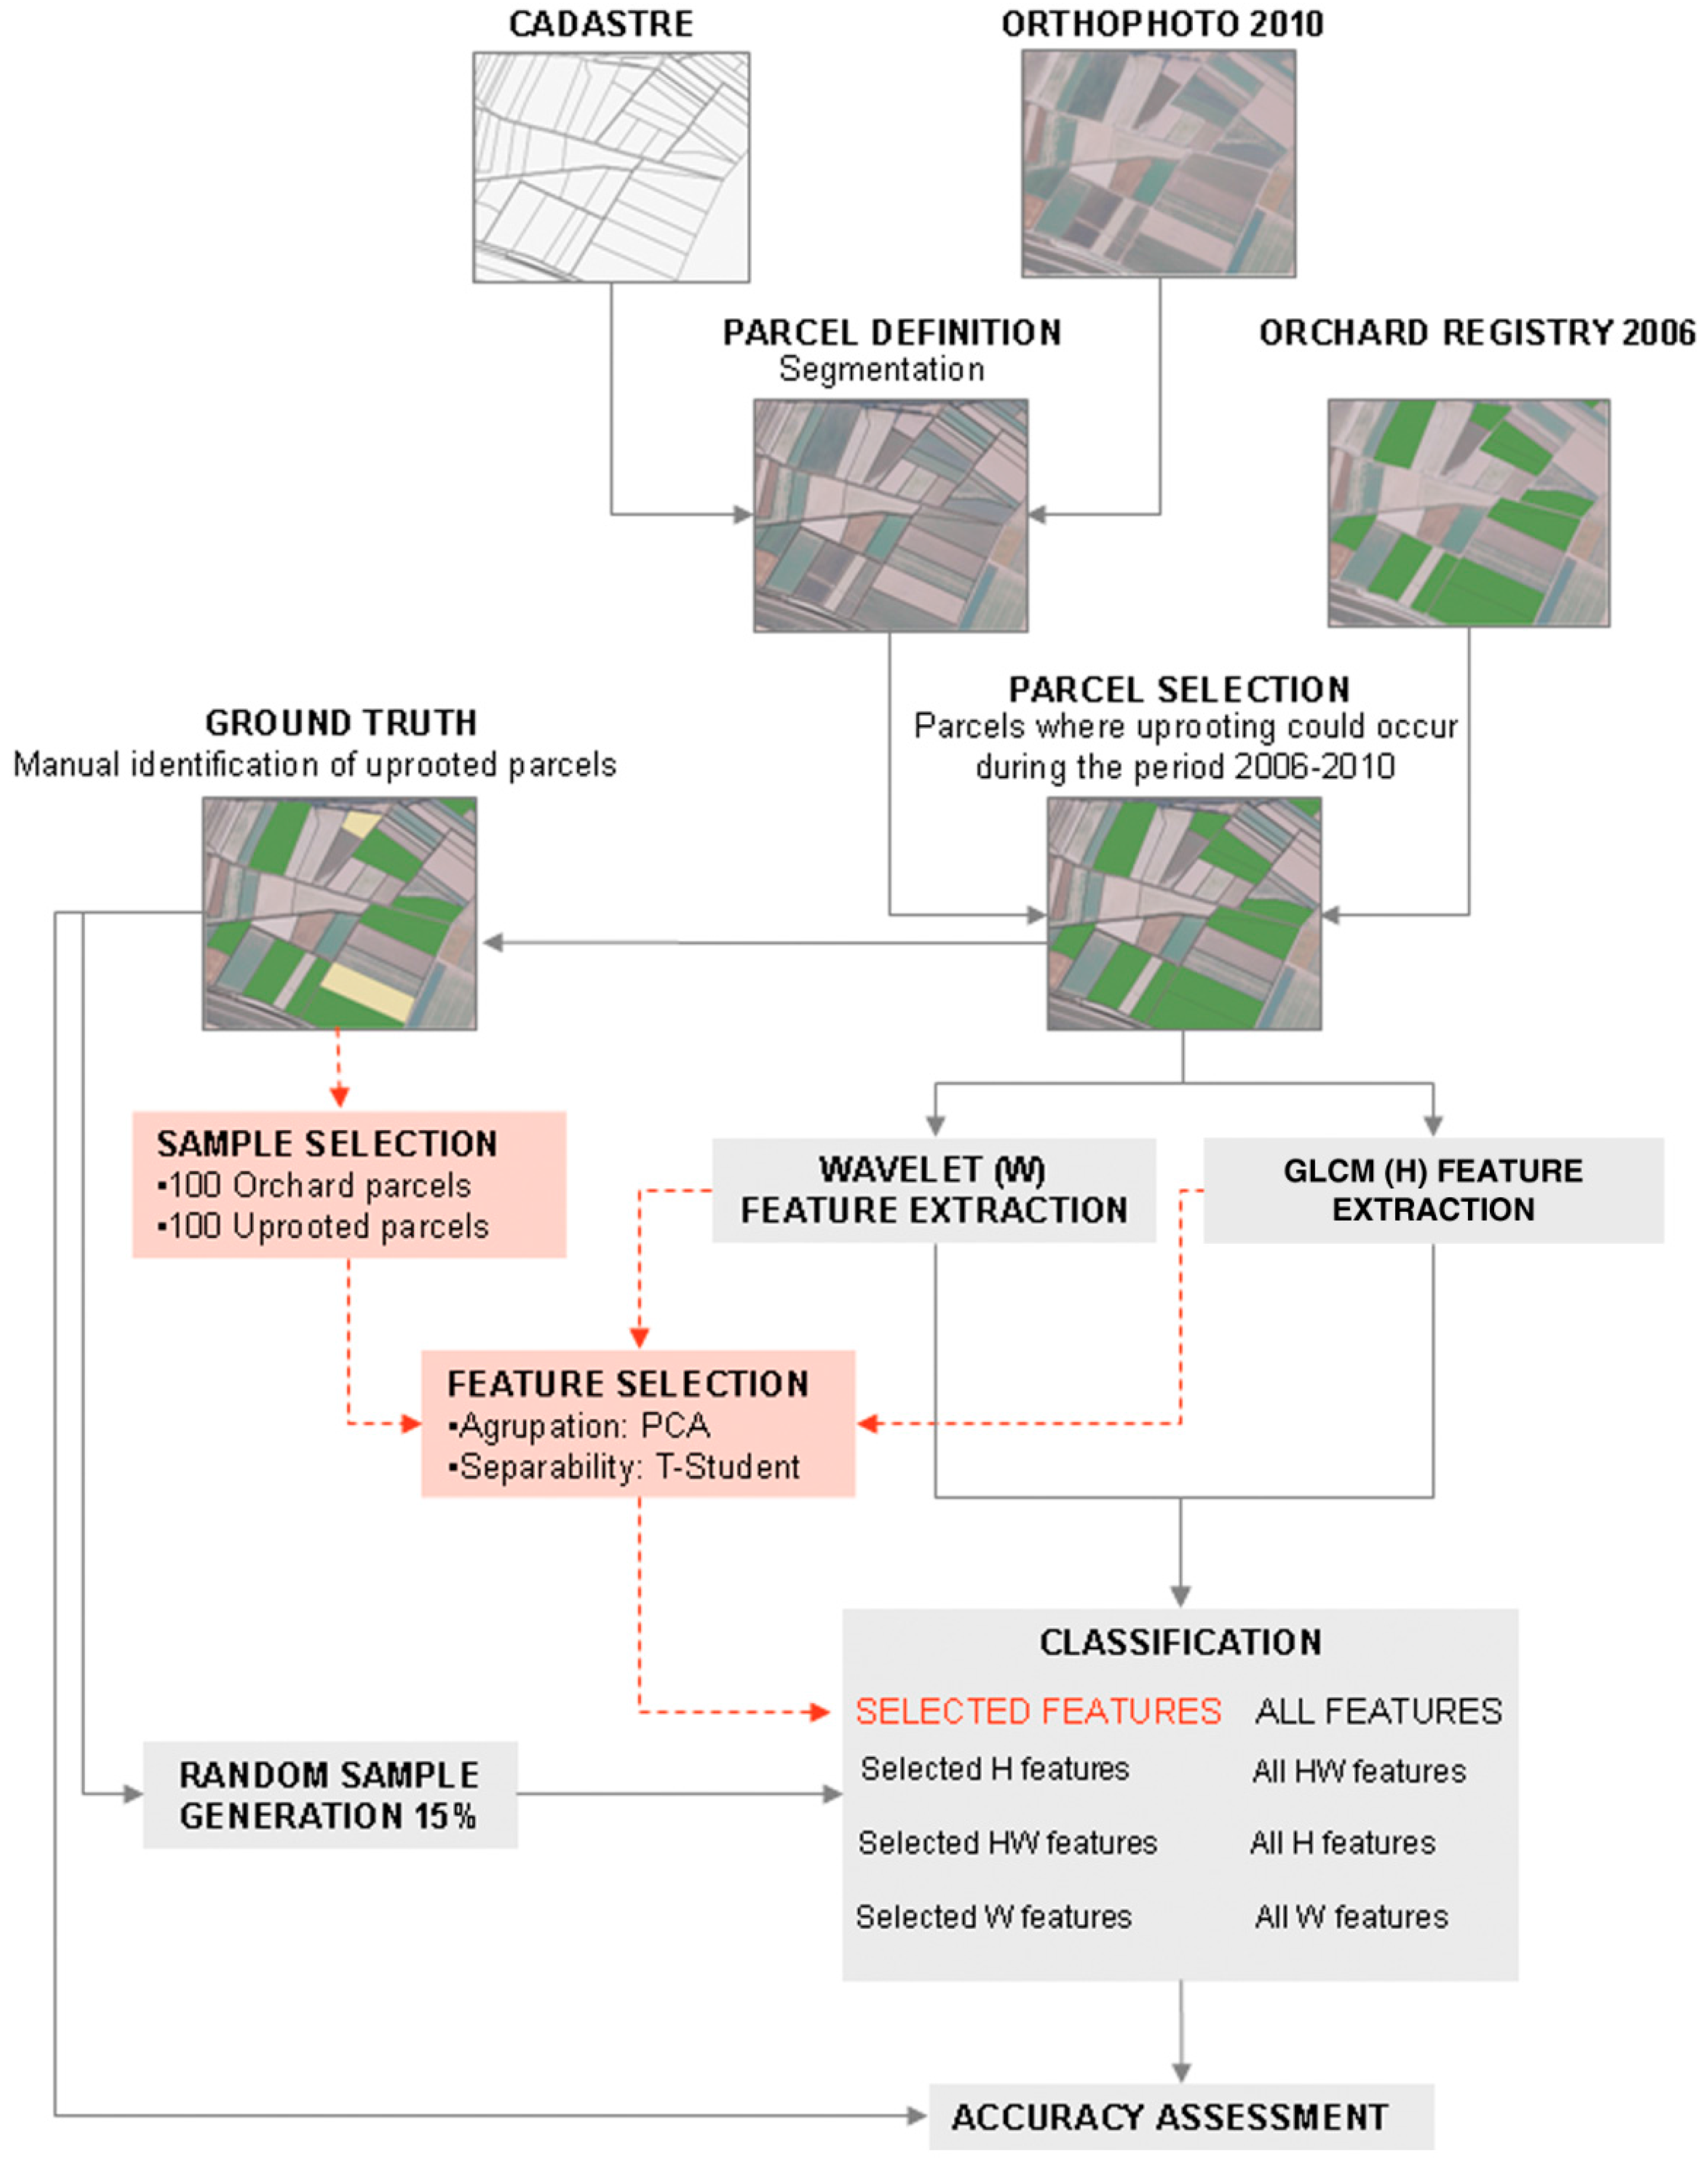
The definition of the study parcels, which constitute the basic unit of analysis in this research, was based on the cartographic limits obtained from the cadaster corresponding to the study site. The class Orchard (O) included different orchard species, i.e., apricot (Prunus armeniaca), almond (Prunus dulcis), cherry (Prunus cerasus), plum (Prunus domestica), peach (Prunus persica), apple (Malus dulcis), walnut (Juglans regia), pear (Pyrus communis) and blackthorn (Prunus spinosa). In orchards, the trees are grown following three geometric patterns: regular (i.e., open-vase planting system following square, rectangular, and triangular planting arrangements), linear (i.e., hedgerow planting system following a rectangular planting arrangement in which the plant-to-plant distance within the row is 1/3 to 1/2 of the distance between rows) and random (i.e., open-vase planting system following an arbitrary distribution). The Uprooted class (U) consisted of parcels in which fruit trees have been eliminated, and thus show no defined texture pattern. The reasons that can lead to an orchard owner to uproot it are multiple. However, in commercial fruit cultivation, this practice is mainly related to low productivity and cost effectiveness. After the removal of the trees, new orchards could be planted again, or the land use of the parcel could change (e.g., arable crops, fallow lands, greenhouses, and urban covers.) The Uprooted class includes this last type of parcels.
To train the classification algorithm and to assess the results obtained with this methodology, reliable data regarding land use are needed. With the aim of obtaining an accurate ground truth (GT), the 2072 study parcels of the Orchard Register of 2006 were photointerpreted using the image from 2010. During this period, 1813 parcels remained as orchards, while 259 were found to be uprooted. This imbalance between classes reflects a real scenario, where the number of uprooted parcels is much less than the number of tree orchards. Once ground truth was carried out, 15% of the parcels were randomly chosen as training samples for the classification process. The training sample is composed of 14% uprooted parcels and 86% orchard parcels. The remaining 85%—approximately 1760 parcels—were used to verify the classification model.
Figure 2 presents the general process.
2.3. Parcel Level Image Segmentation
The segmentation is the process in which an image is totally divided into non overlapping regions or objects [
56] with a real physical meaning [
57]. The objective is to simplify the representation of an image in an easier way to analyze [
58]. In the segmentation process, the minimum units of classification are created, and to be correct or not depends on the pursued objectives.
In this study, the parcel-level segmentation of the images of 2006 and 2010 was performed using the cartographic boundaries of the Cadaster of Navarre of 2006, so the cadastral parcel is the basic unit of classification.
2.4. Textural Feature Extraction
The textural features based on GLCM and wavelet planes were calculated in this step of the methodology.
2.4.1. Textural Features Based on GLCM
One of the most commonly used methods for mathematically measuring texture is based on the extraction of second-order statistical features from the GLCM [
59]. Haralick et al. [
16] proposed spatial co-occurrence as a basic structure in the derivation of quantitative features that characterize the texture of digital images. They assumed that the spatial variability information of an image was contained in the “average” spatial relationships that grey tones in the image had with one another. These relationships are summarized in co-occurrence matrices, which are calculated for four directions (0°, 45°, 90°, and 135°) between neighboring pixels within a given parcel. The GLCM is a two-dimensional histogram of grey level for a pair of pixels that are separated by a fixed spatial relationship and distance. The GLCM approximates the joint probability distribution of a pair of pixels.
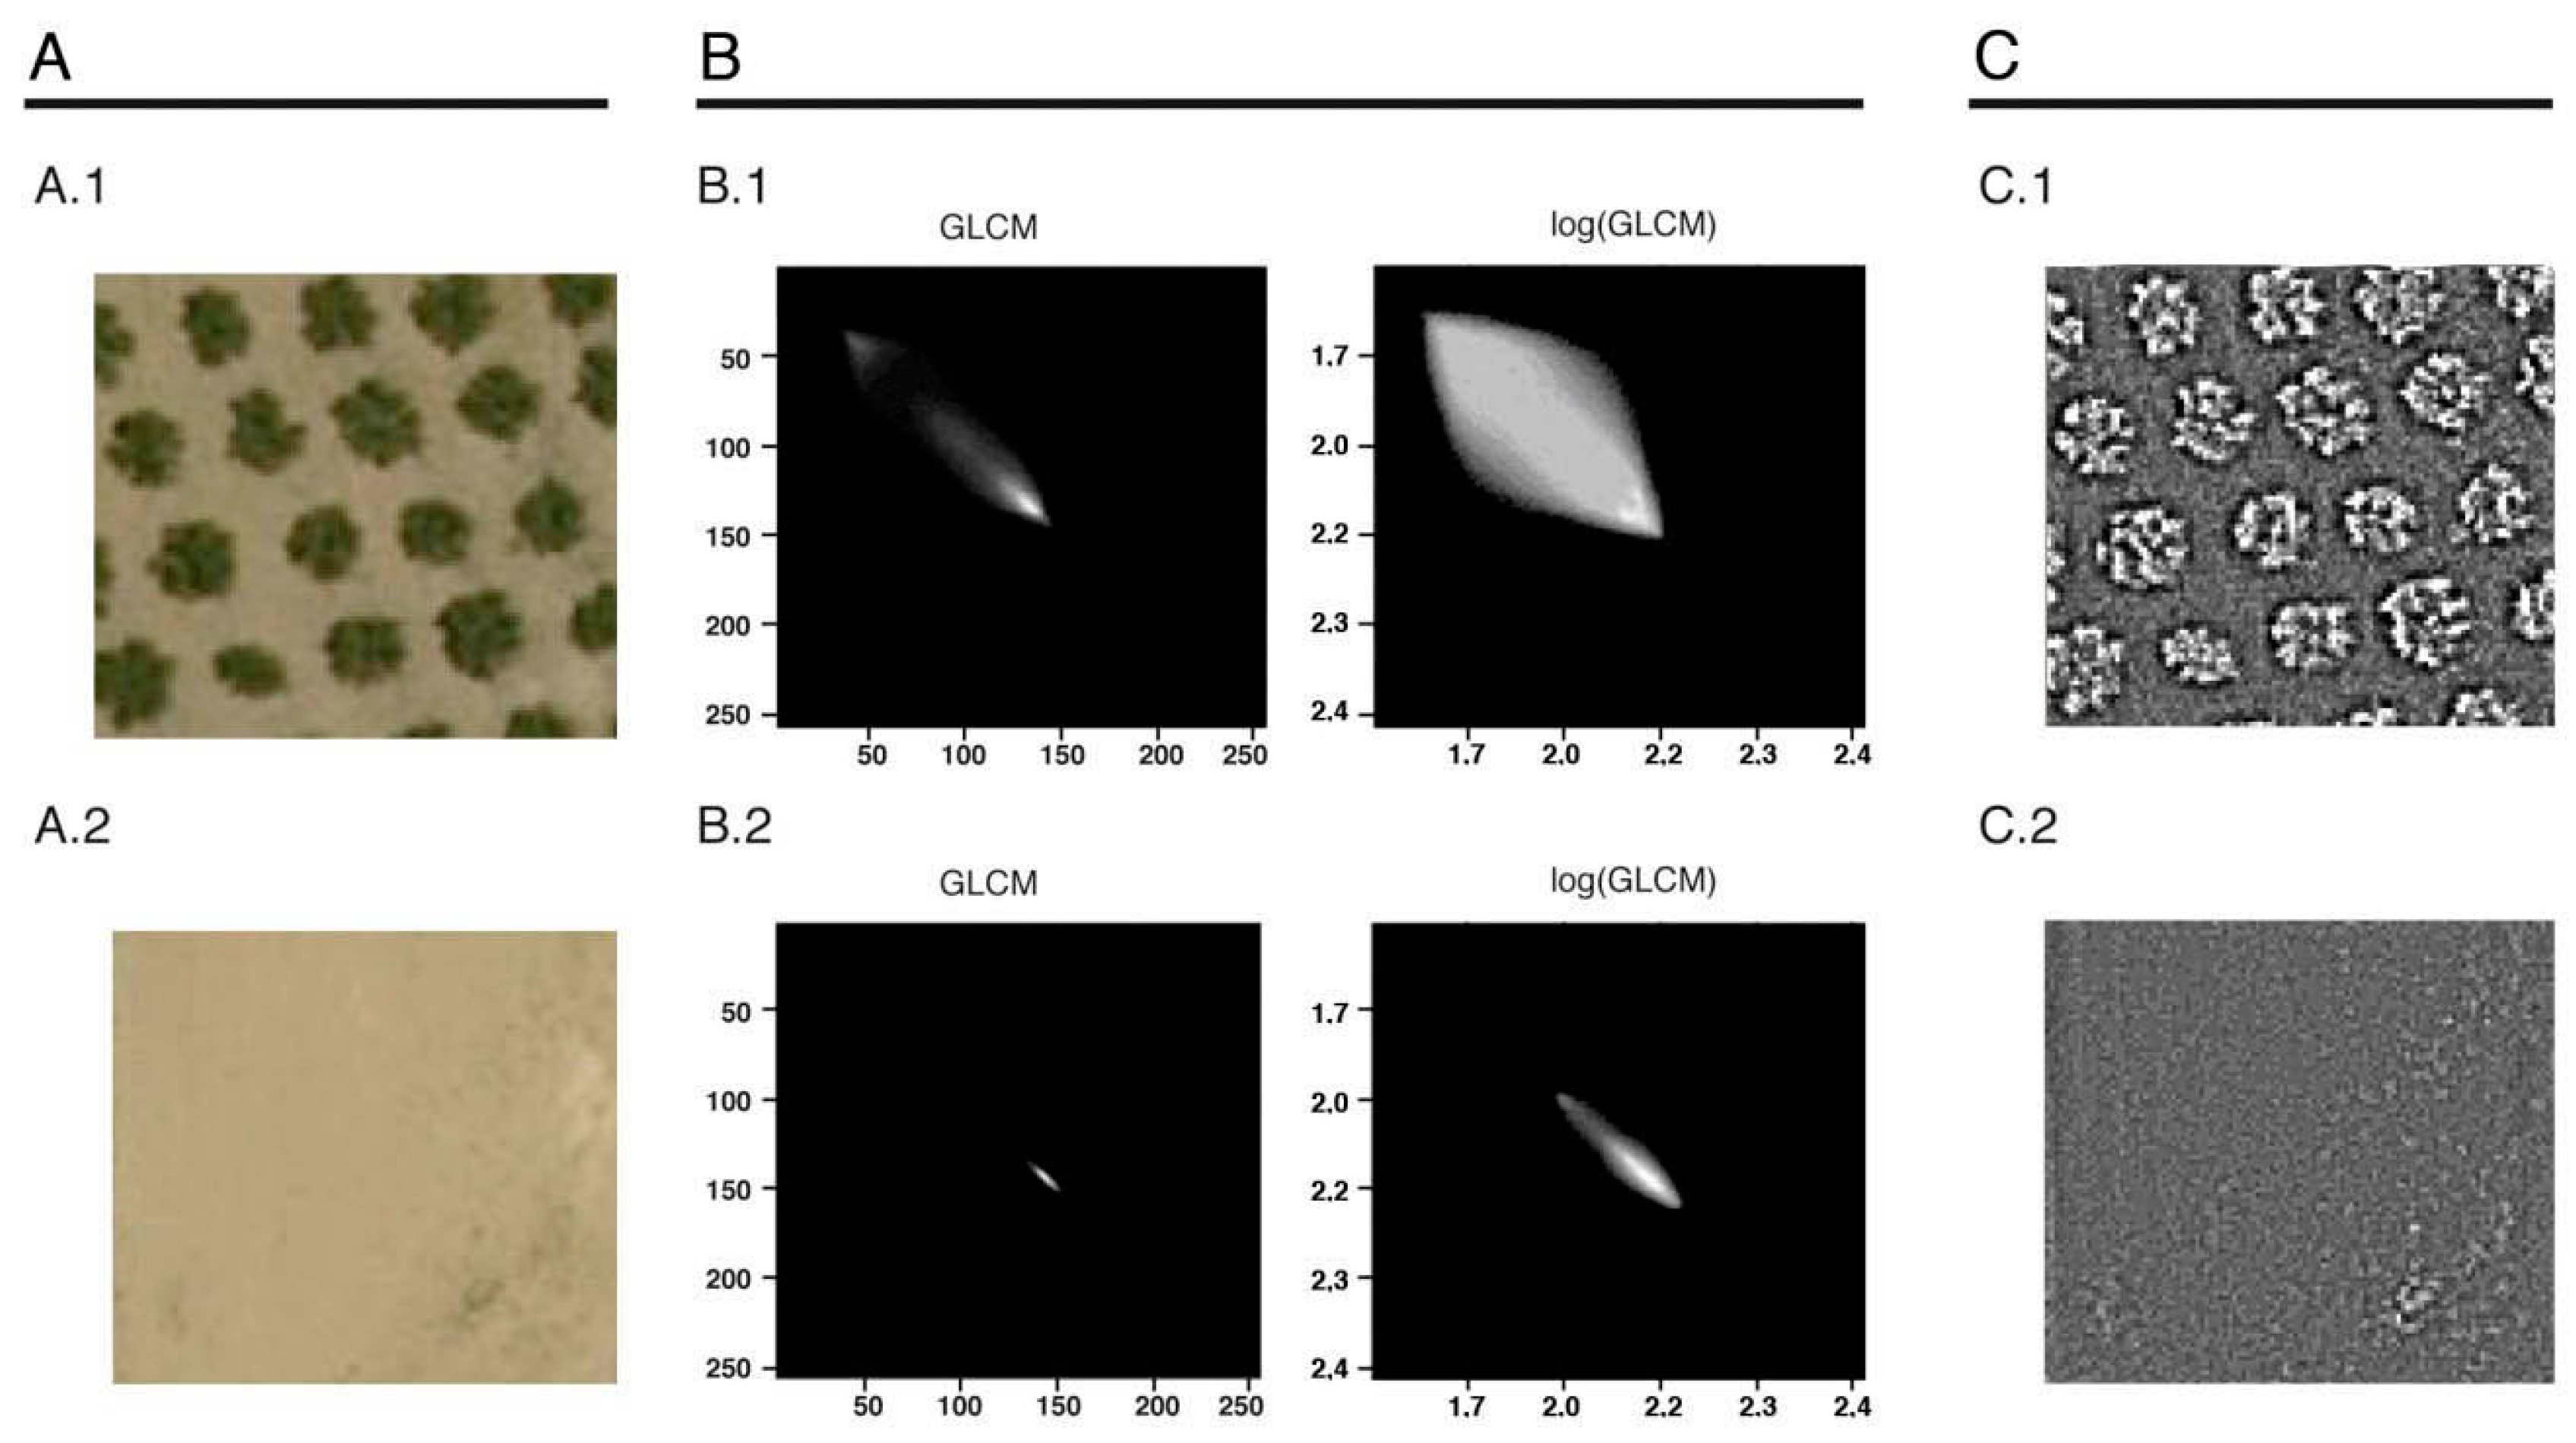
Figure 3B represents the GLCM of an orchard (
Figure 3(B.1)) and an uprooted orchard (
Figure 3(B.2)). It also includes the logarithmic transformation of both GLCMs. Since the GLCM is calculated from an orthophoto of 8 bits, a square matrix of 256 × 256 pixels is obtained. Each pixel in the matrix represents a co-occurrence combination, with the pixels of the main diagonal representing pairs of pixels in the orthophoto with same grey level. Lighter pixels represent more frequent co-occurrence combinations of their corresponding grey levels. As the pixels move away from the diagonal, they represent greater differences in grey levels. In the Uprooted class case (
Figure 3(B.2)), the information is located near the diagonal because in an homogeneous image, most pixels show a grey level identical to that of their neighbors. On the other hand, the highly contrasted texture of an Orchard (
Figure 3(B.1)) generates a GLCM with more expansion with respect to the diagonal. Haralick et al. [
16] proposed a set of textural features that describe the distribution of data in the GLCM. In this study, we calculated 8 of these features: homogeneity, entropy, angular second moment (ASM), contrast, dissimilarity, mean, standard deviation and correlation (definitions are provided in
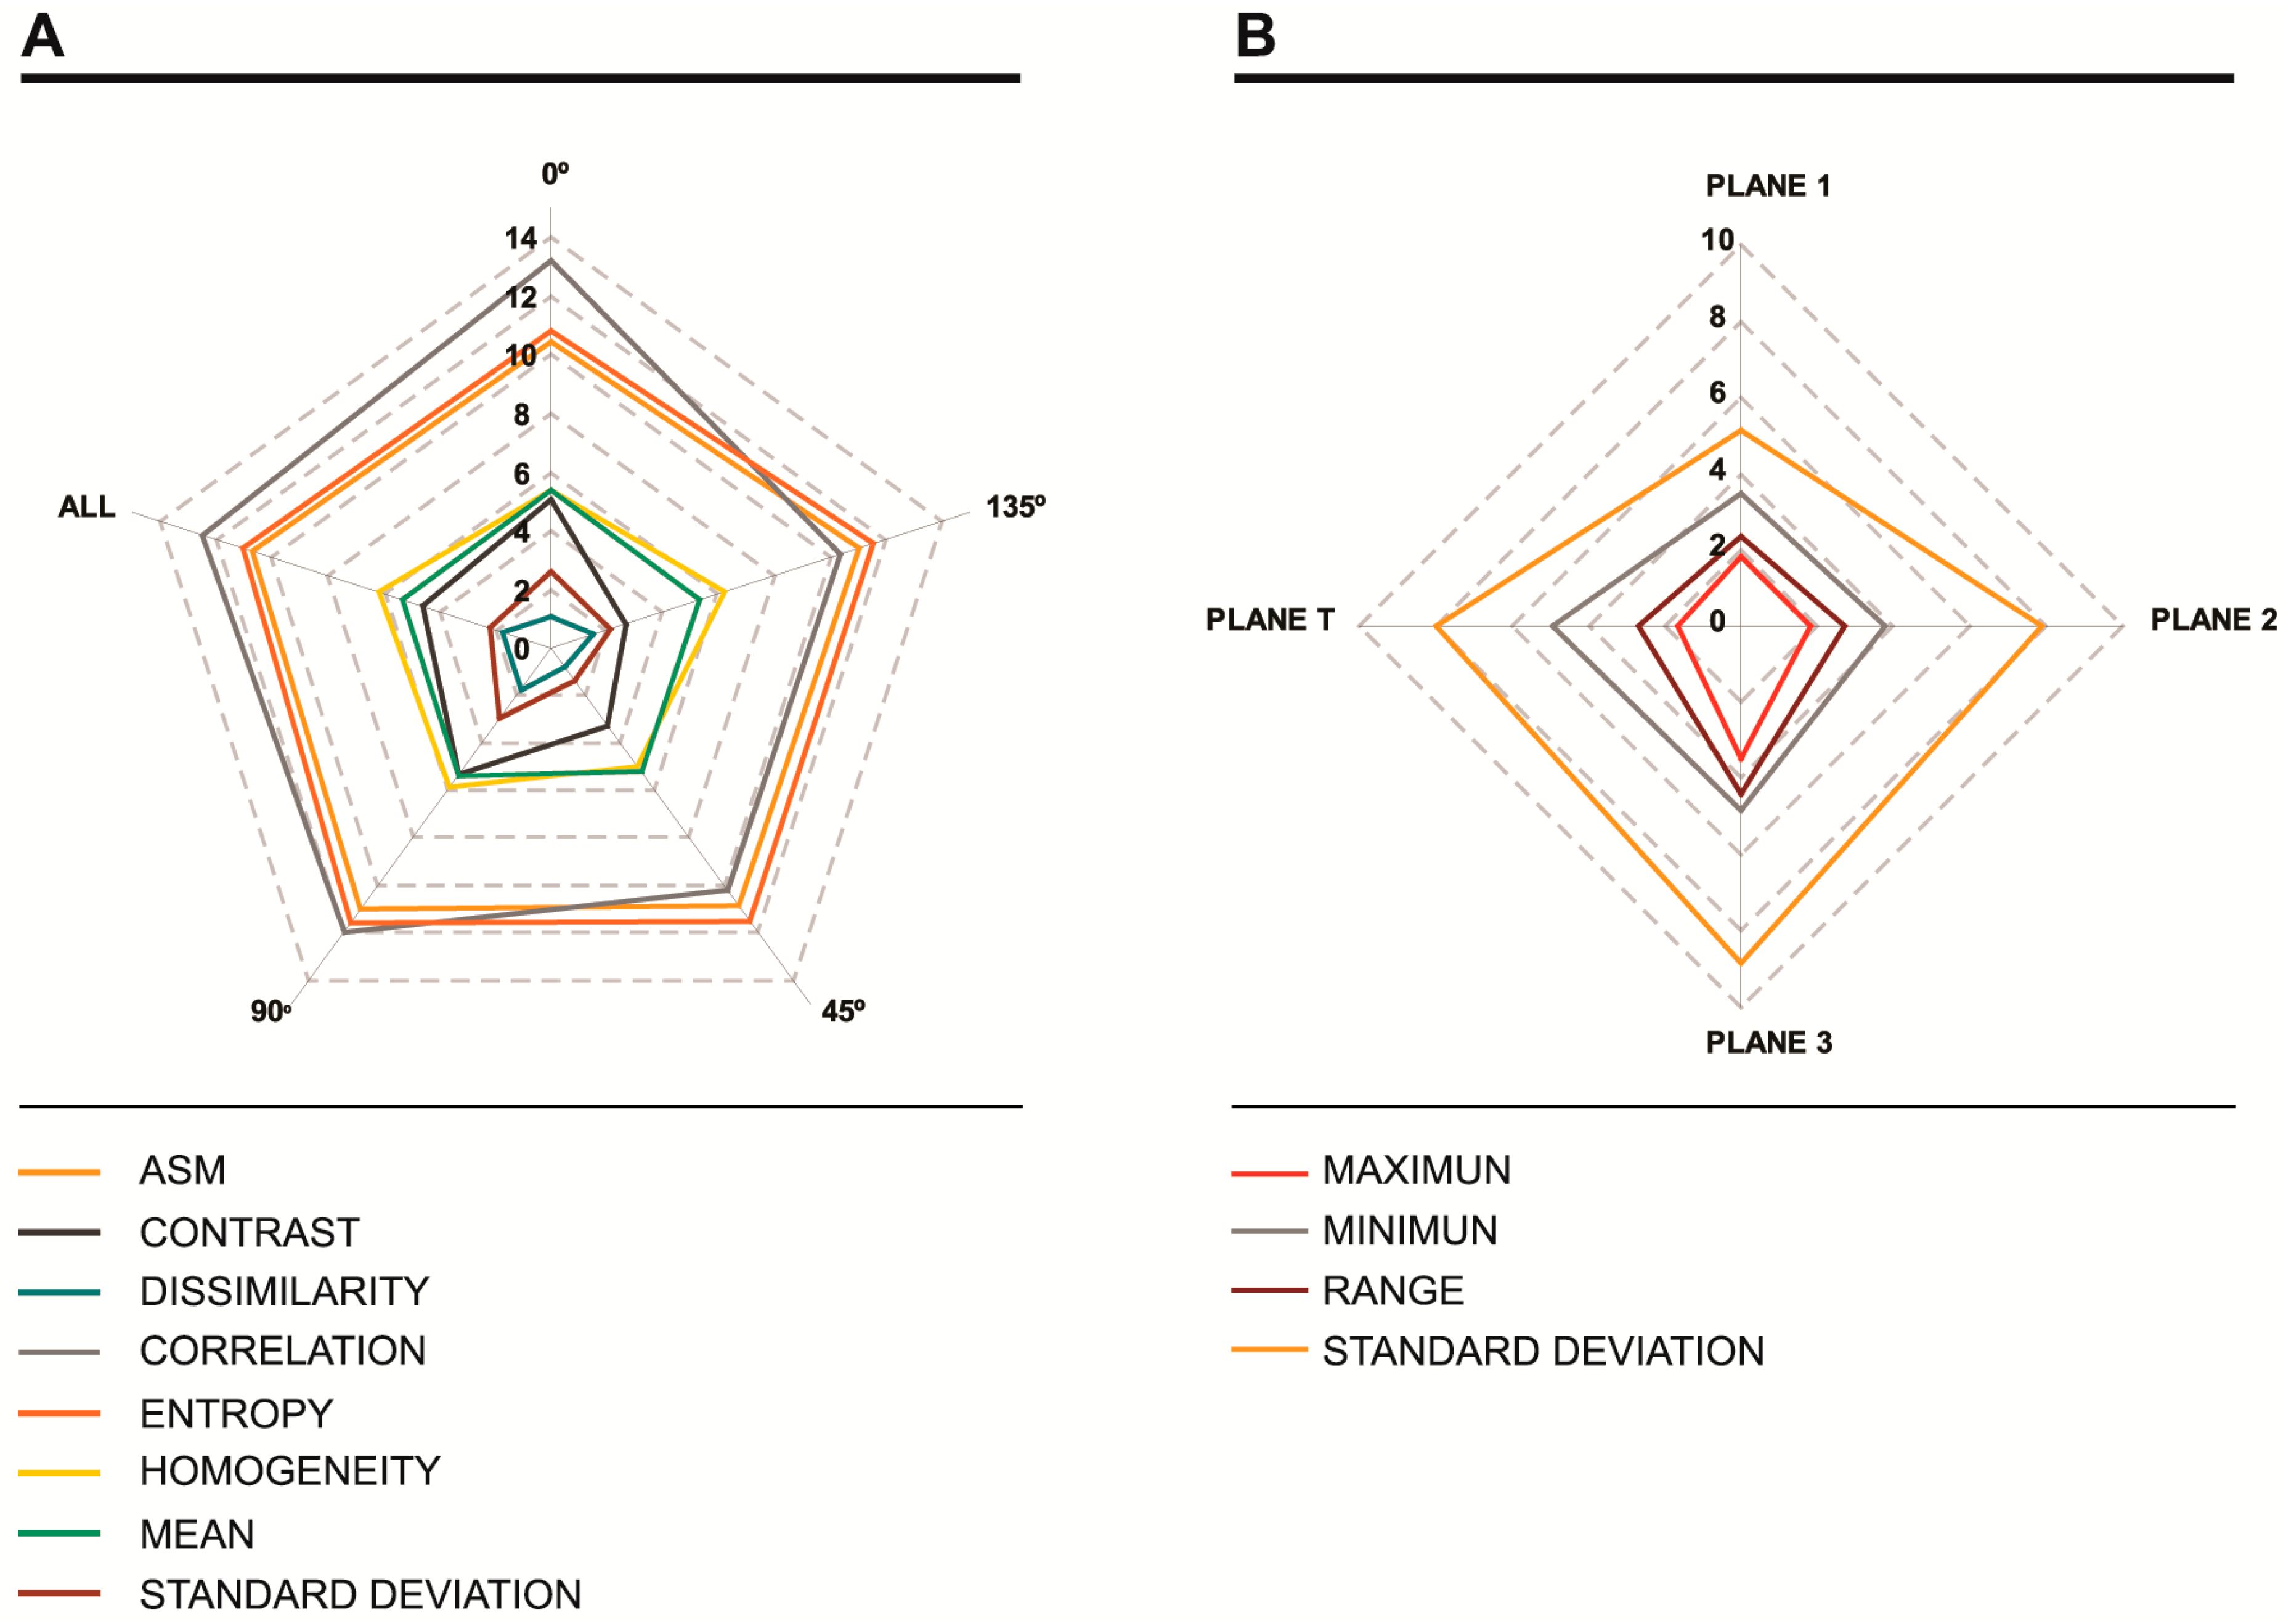
Table 1). All features were calculated considering four different directions (0°, 45°, 90°, and 135°) and a multi-directional relationship (All) in the red and green semi-sum band; thus, each parcel is characterized by 40 textural features based on GLCM.
2.4.2. Plane-Based Wavelet Features
Wavelet transform is a powerful tool for discriminating textures [
60,
61], as it allows an image’s spatial variability to be decomposed into different frequency components. If an object exhibits a fine texture, as observed in uprooted parcels, its information is mostly concentrated in the low-frequency region. On the contrary, if an object exhibits a coarse texture, most of its information is centered in the high-frequency region.
The discrete wavelet transform can be performed with several different algorithms. One of the most popular ones is the
à trous algorithm [
62]. In this study, the
à trous algorithm is implemented by using a bi-dimensional low pass filter associated to a B3 cubic spline function. The convolution of an original 2
j resolution image with the mentioned filter results in a degraded image with a 2
j-1 resolution. The difference between an image and its degraded version will generate a wavelet plane or wavelet image that contains the spatial detail information that is lost between 2
j and 2
j-1 resolution images, that is, the high frequency information. To perform this analysis, we have obtained wavelet images at 3 different levels (plane 1, plane 2 and plane 3), which are added to obtain a total wavelet or detail image (plane T). From these wavelet images, maximum, minimum, standard deviation and range are calculated for each parcel, resulting in a vector of 16 features for each parcel (definitions are provided in
Table 2).
Figure 3C shows an example of the wavelet images in plane 1 corresponding to the orchard (
Figure 3(C.1)) and the uprooted parcel (
Figure 3(C.2)). Wavelet planes obtained from uprooted parcels are very homogenous, while those calculated with orchard parcels present high-frequency information derived from the trees’ borders. As observed in
Figure 3(C.1), in these wavelet planes, the difference between maximum and minimum is lower than that in the orchards parcels (
Figure 3(C.2)), which indicates a greater range and standard deviation in the latter. This fact could allow for the discrimination between these two classes.
2.5. Feature Selection
After calculating the textural features, the most appropriate to discriminate between the Uprooted and Orchard classes are selected. Detecting the most suitable features reduces the computational complexity and increases the generalization capability of the classification algorithm [
63]. Therefore, suitable feature selection is expected to enhance the discrimination between uprooted and orchard parcels in this study. For this, the features evaluated are classified as: (1) relevant, i.e. those that influence the discrimination of a specific class; (2) not relevant, i.e. those that do not influence the discrimination; and (3) redundant, i.e., those that do not provide any different information [
64]. Redundant features can be both relevant and not relevant. The objective of any feature selection analysis is to identify relevant and non-redundant features. The methodology used here is based on the study of relevance and redundancy.
To analyze the relevance of each variable, Student’s t-test was performed. The T statistic is particularly suitable for measuring the separability between two groups [
64] and can be used as distance measure to analyze the efficacy of each feature for discriminating between Orchard and Uprooted classes [
65]. T between two classes is defined as follows:
where,
, and
are the mean, variance and size of each class, respectively. Low T values indicate that the differences between Uprooted and Orchard classes are low, whereas by increasing the differences between the classes, T increases as well. Before performing the t-test, the assumption of normality was evaluated using a Kolmogorov–Smirnov test. In the case of a negative result, a logarithmic transformation was applied.
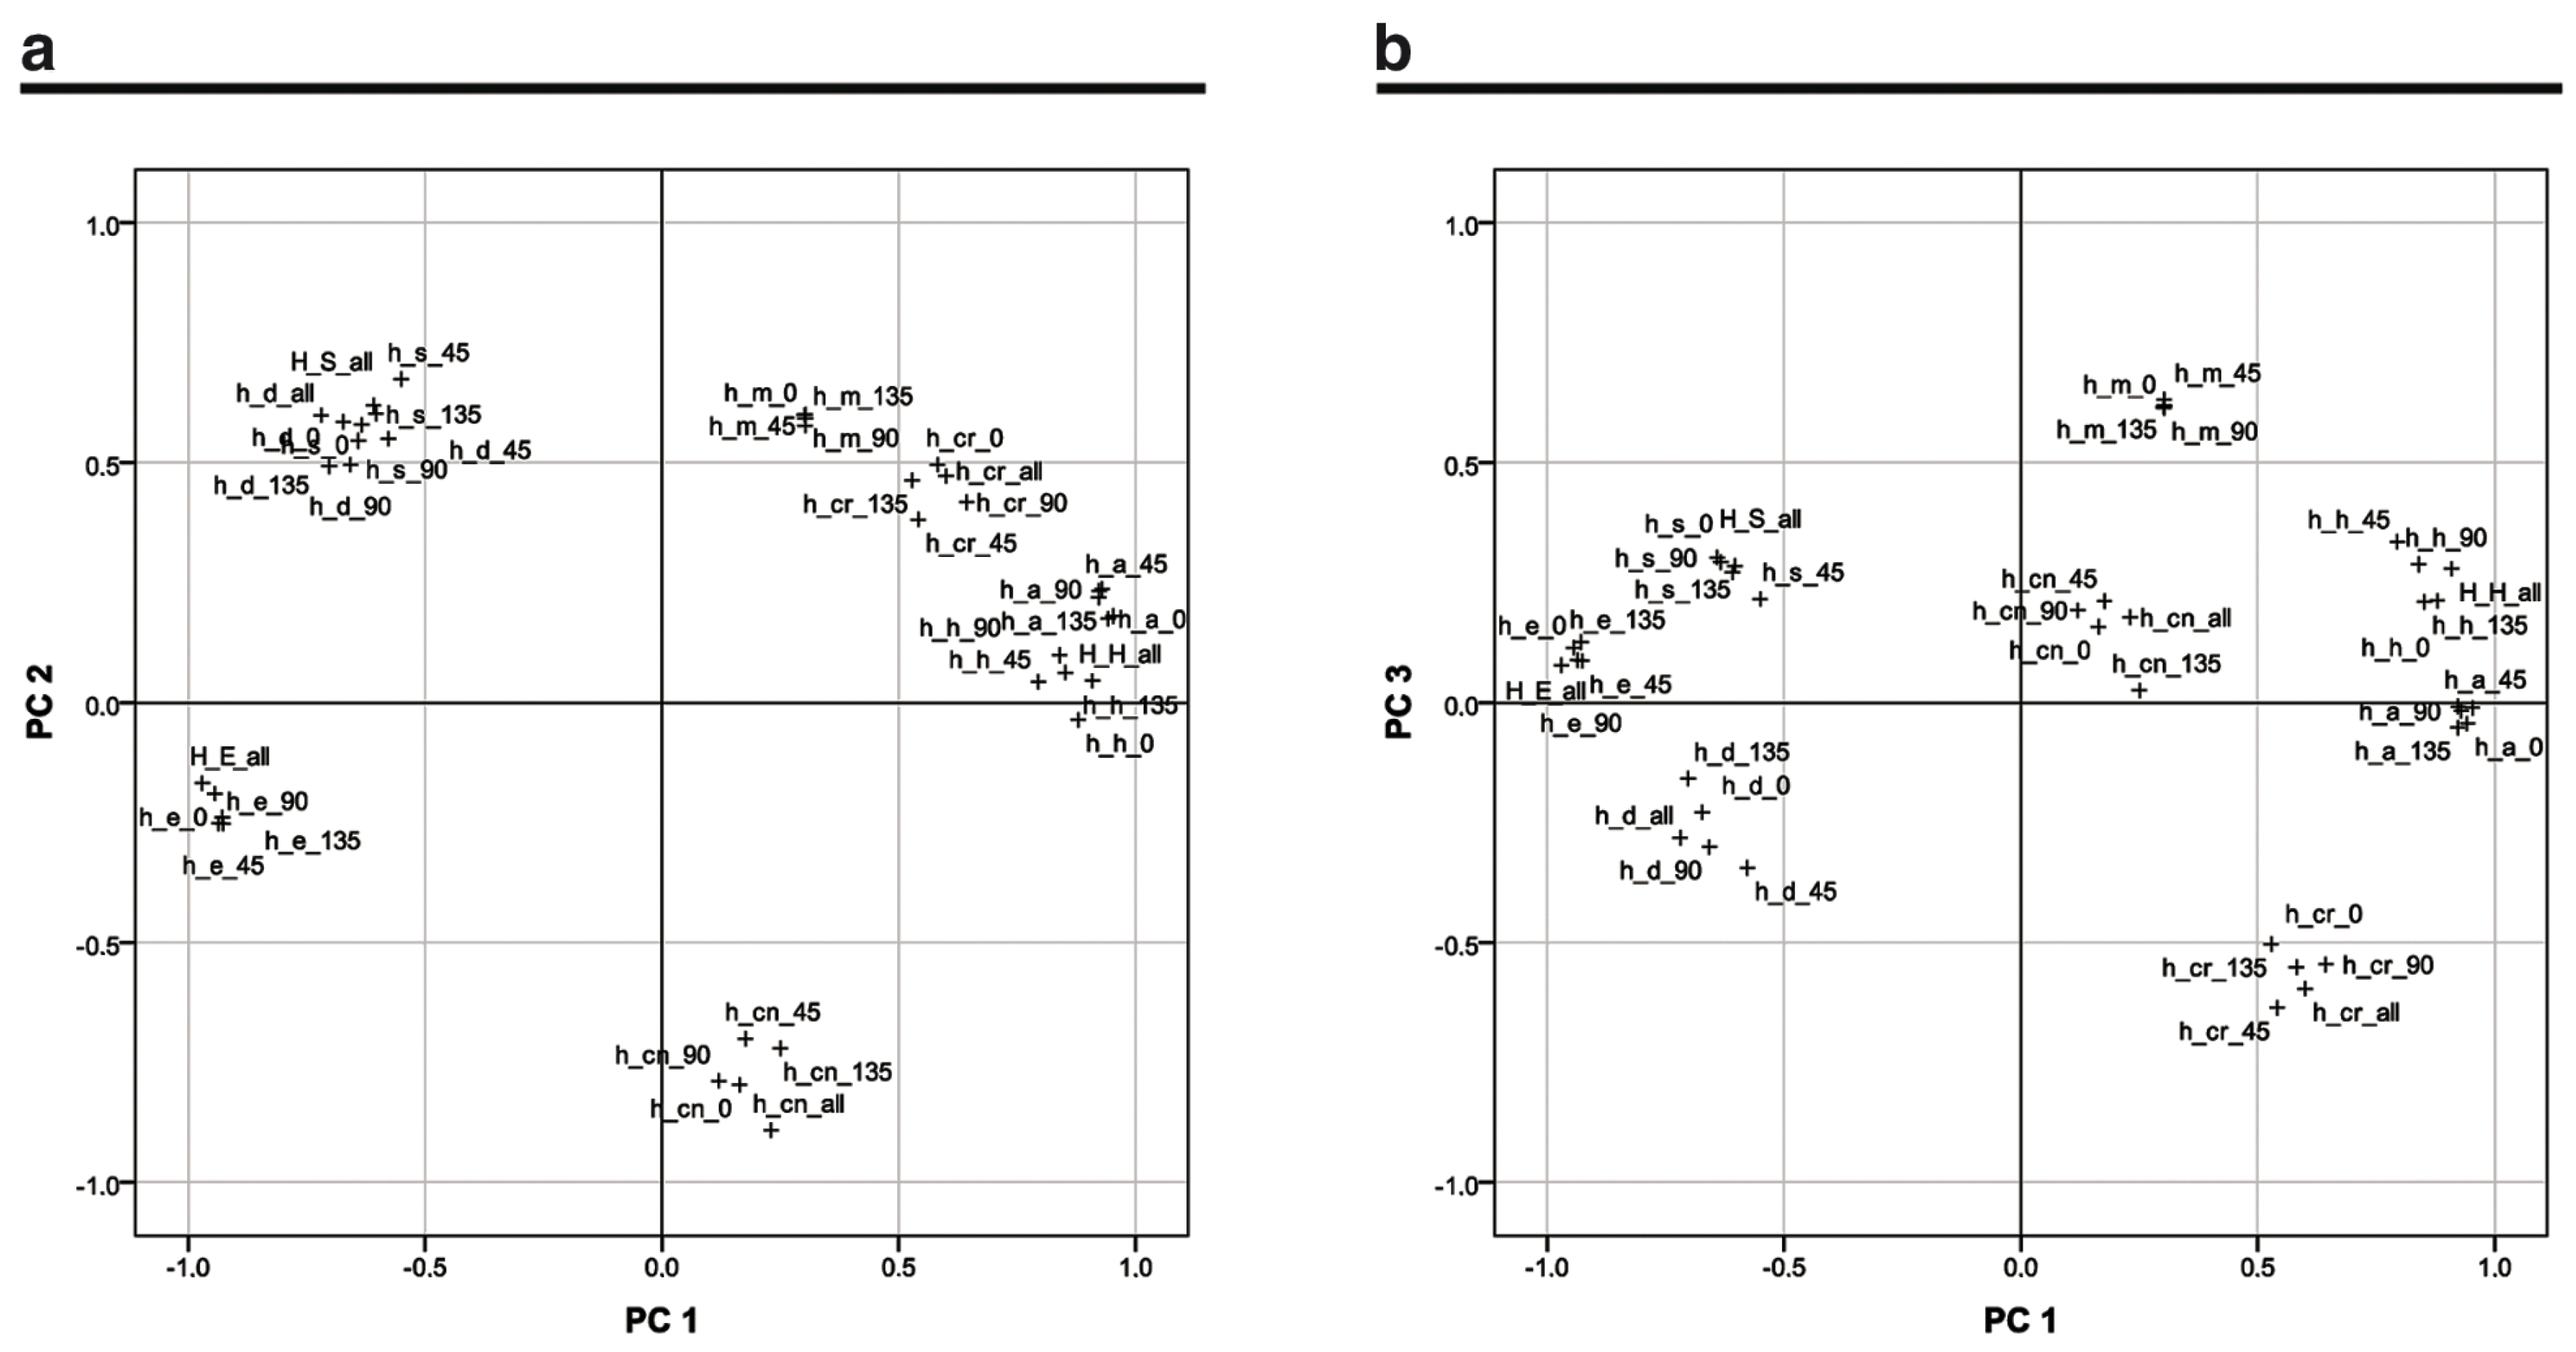
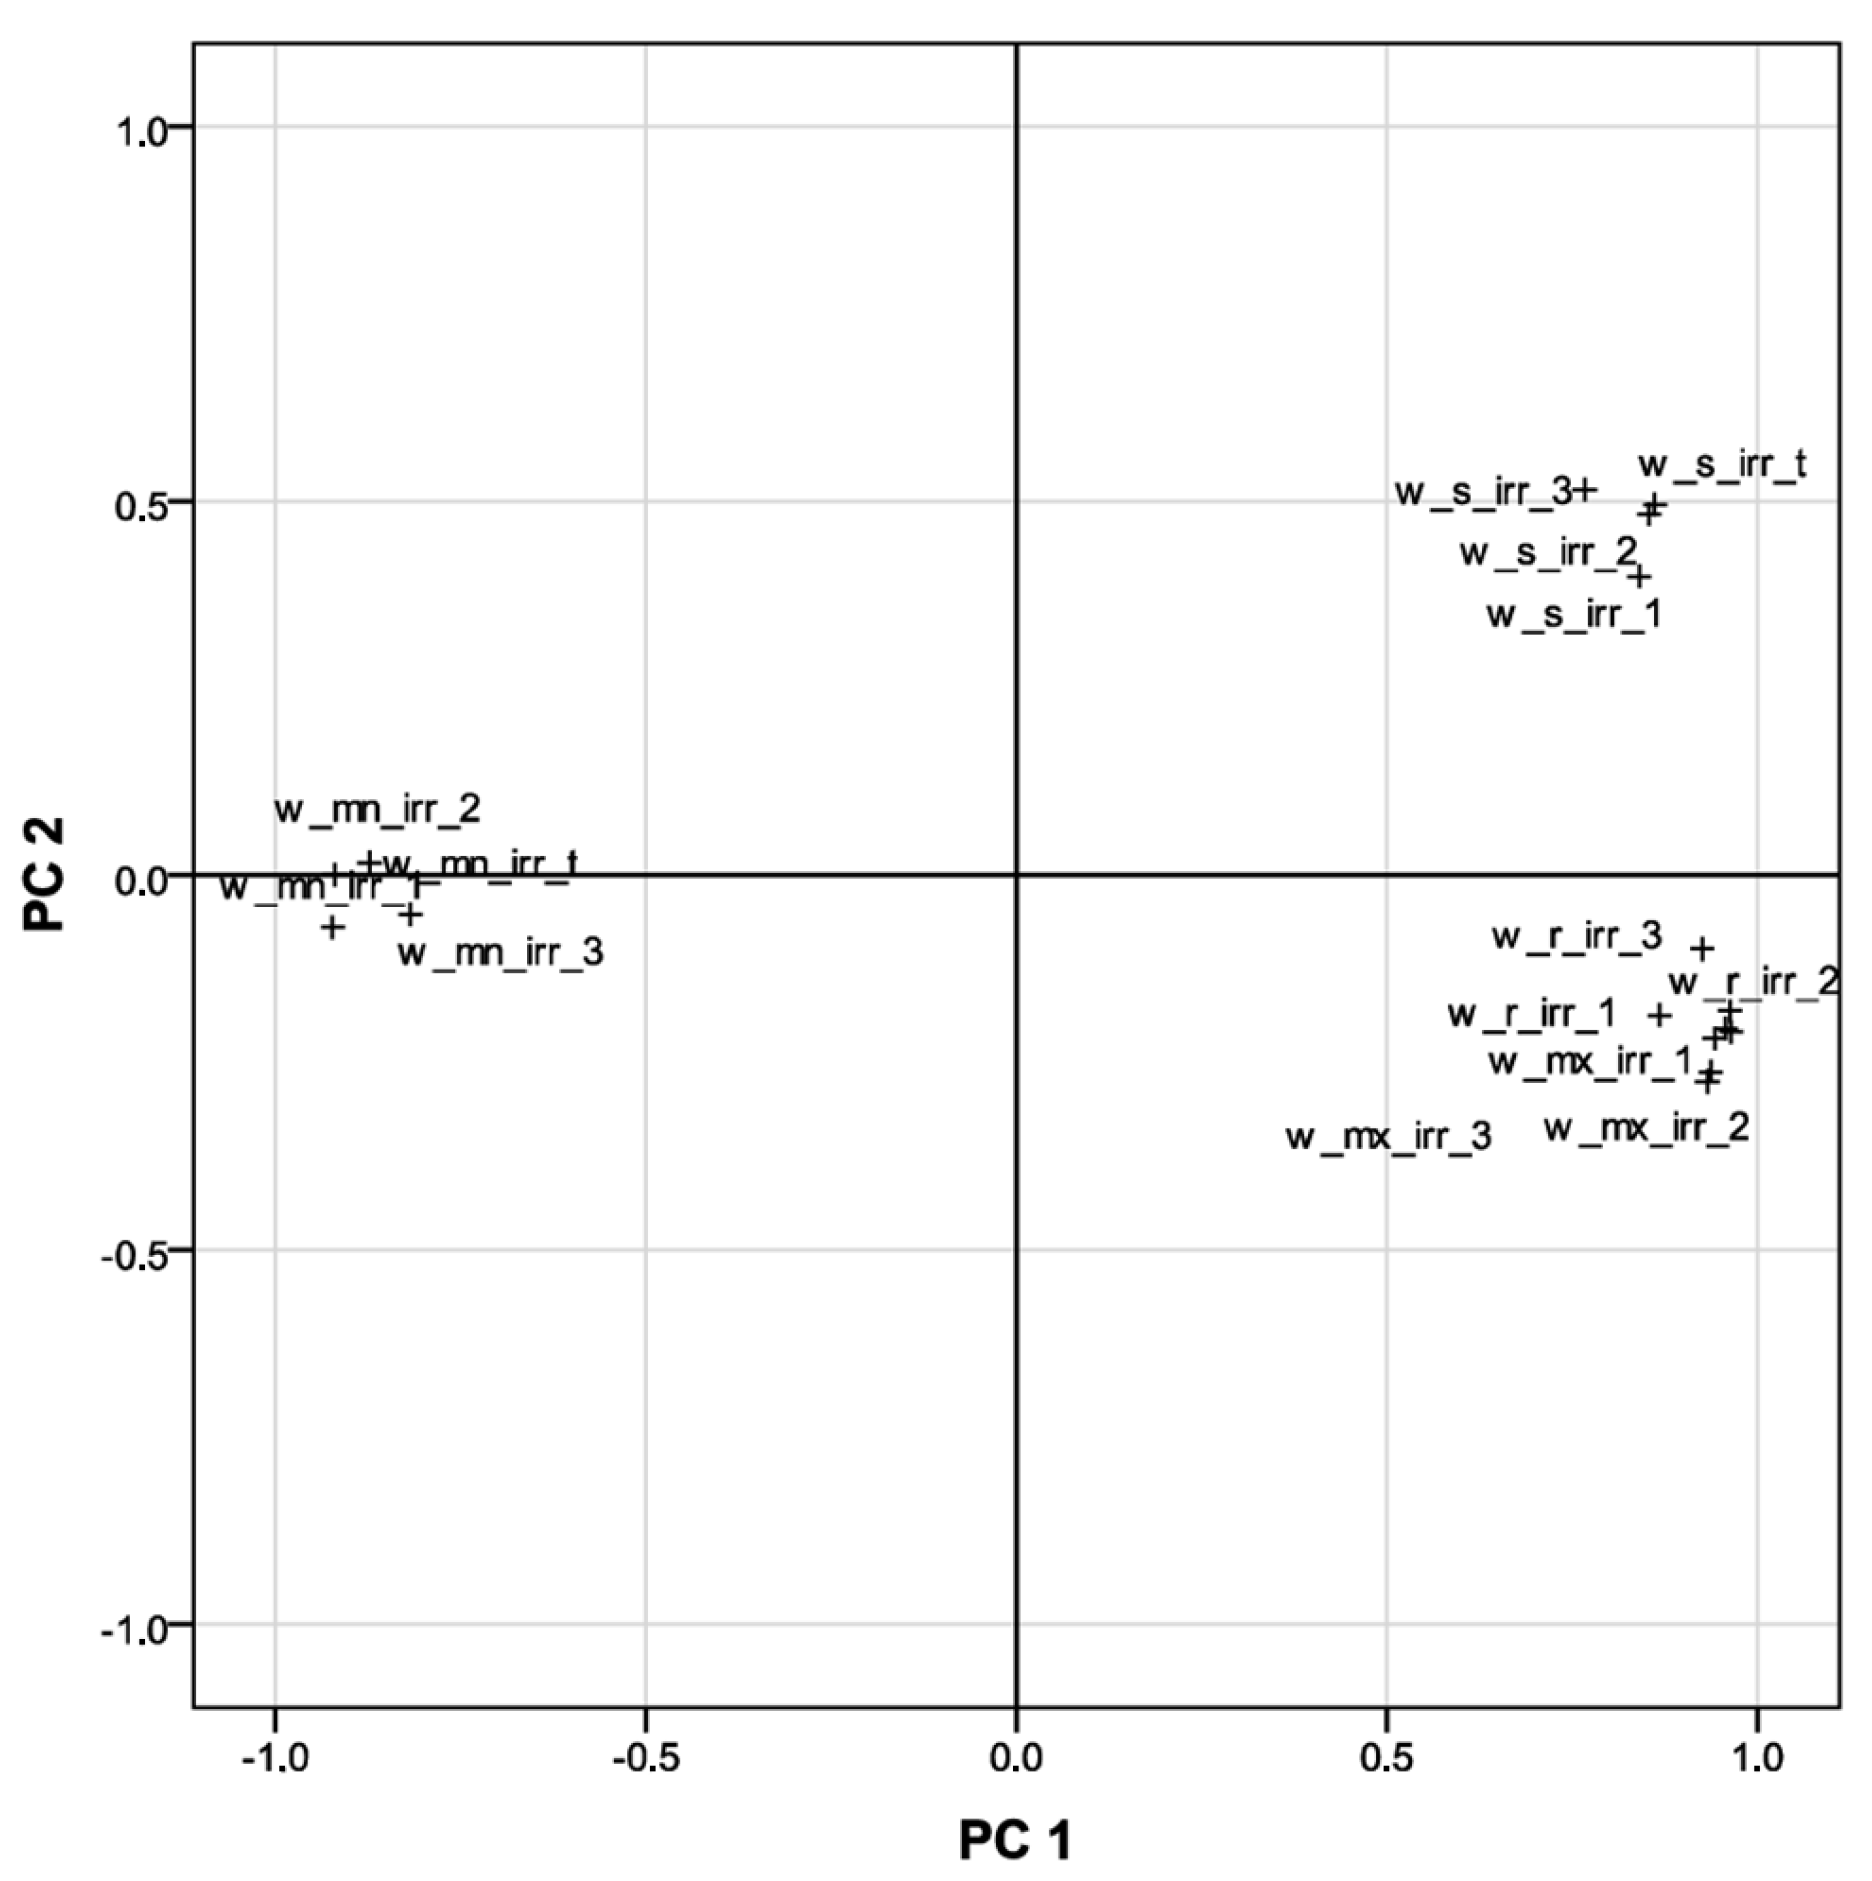
As previously stated T measures the statistical distance between classes for each feature but does not provide any information about the redundancy or correlation between the features. For this reason, a principal components analysis was performed to qualitatively explore the interrelationship between the features and thus complete the separability analysis. Loading plots are dispersion graphs that show the location of each feature in the space defined by the obtained principal components (PC), also called factors. The coordinates of each feature in each PC represent the correlation of said feature and each of the factors. In addition, the proximity between features indicates the degree of correlation between them; therefore, when the correlation equals one, the points coincide. Visual analysis of these graphs is useful for understanding how the features are grouped together. Once the groups of features that provide the same information were identified, the most relevant textural feature of each group was selected, i.e., the one providing the highest T. To carry out these feature selection analyses, 100 representative parcels for both Uprooted and Orchard classes were randomly selected from the study parcels.
2.6. Parcel-Level Classification
A Discriminant Analysis classification algorithm was applied to identify uprooted parcels using textural information. This classification algorithm involves creating a linear combination of textural features that maximizes the discrimination between the Uprooted class and Orchard class, called a discriminant function. The incorporation of the features in this function was performed with the method, which can add as many textural features as desired to the discriminant function. Several studies have successfully used this classification method in remote sensing [
66,
67].
The identification of uprooted parcels was carried out considering: (1) all calculated features; and (2) the selected features after performing the t-test analysis and PCA. These two types of classifications were performed using GLCM based textural features (H) and wavelet planes-based features (W), both independently and in combination (H+W).
2.7. Performance Evaluation for Uprooted Parcel Identification
The automatically detected uprooted parcels were compared, parcel by parcel, with the ground truth. Each parcel used in the study fell into one of the four categories shown in the confusion matrix presented in
Table 3. Quality indices for binary classification (see
Table 4) were computed considering the Uprooted class as positive class.
5. Conclusions
The usefulness of GLCM and wavelet based textural features calculated from orthophoto at parcel-level for automatically detecting uprooted parcels by means of discriminant analysis classification algorithm has been demonstrated. The obtained classification results, which achieved a true positive rate of over 80% and an accuracy of over 88%, justify the use of the orthophoto as an alternative information source to satellite imagery that can be used to differentiate between uprooted parcels and orchards. In Spain, where the PNOA provides annual orthophoto coverage for topographic mapping development, this is an interesting finding from both a technical and economic point of view. Many countries acquire orthophotos periodically for topographic and cadastral purposes. The use of orthophotos in automated RS applications, such as the one presented in this article, could extend the utility of these datasets, which are freely available in most cases, and thus reduce the need to purchase satellite imagery for this particular application.
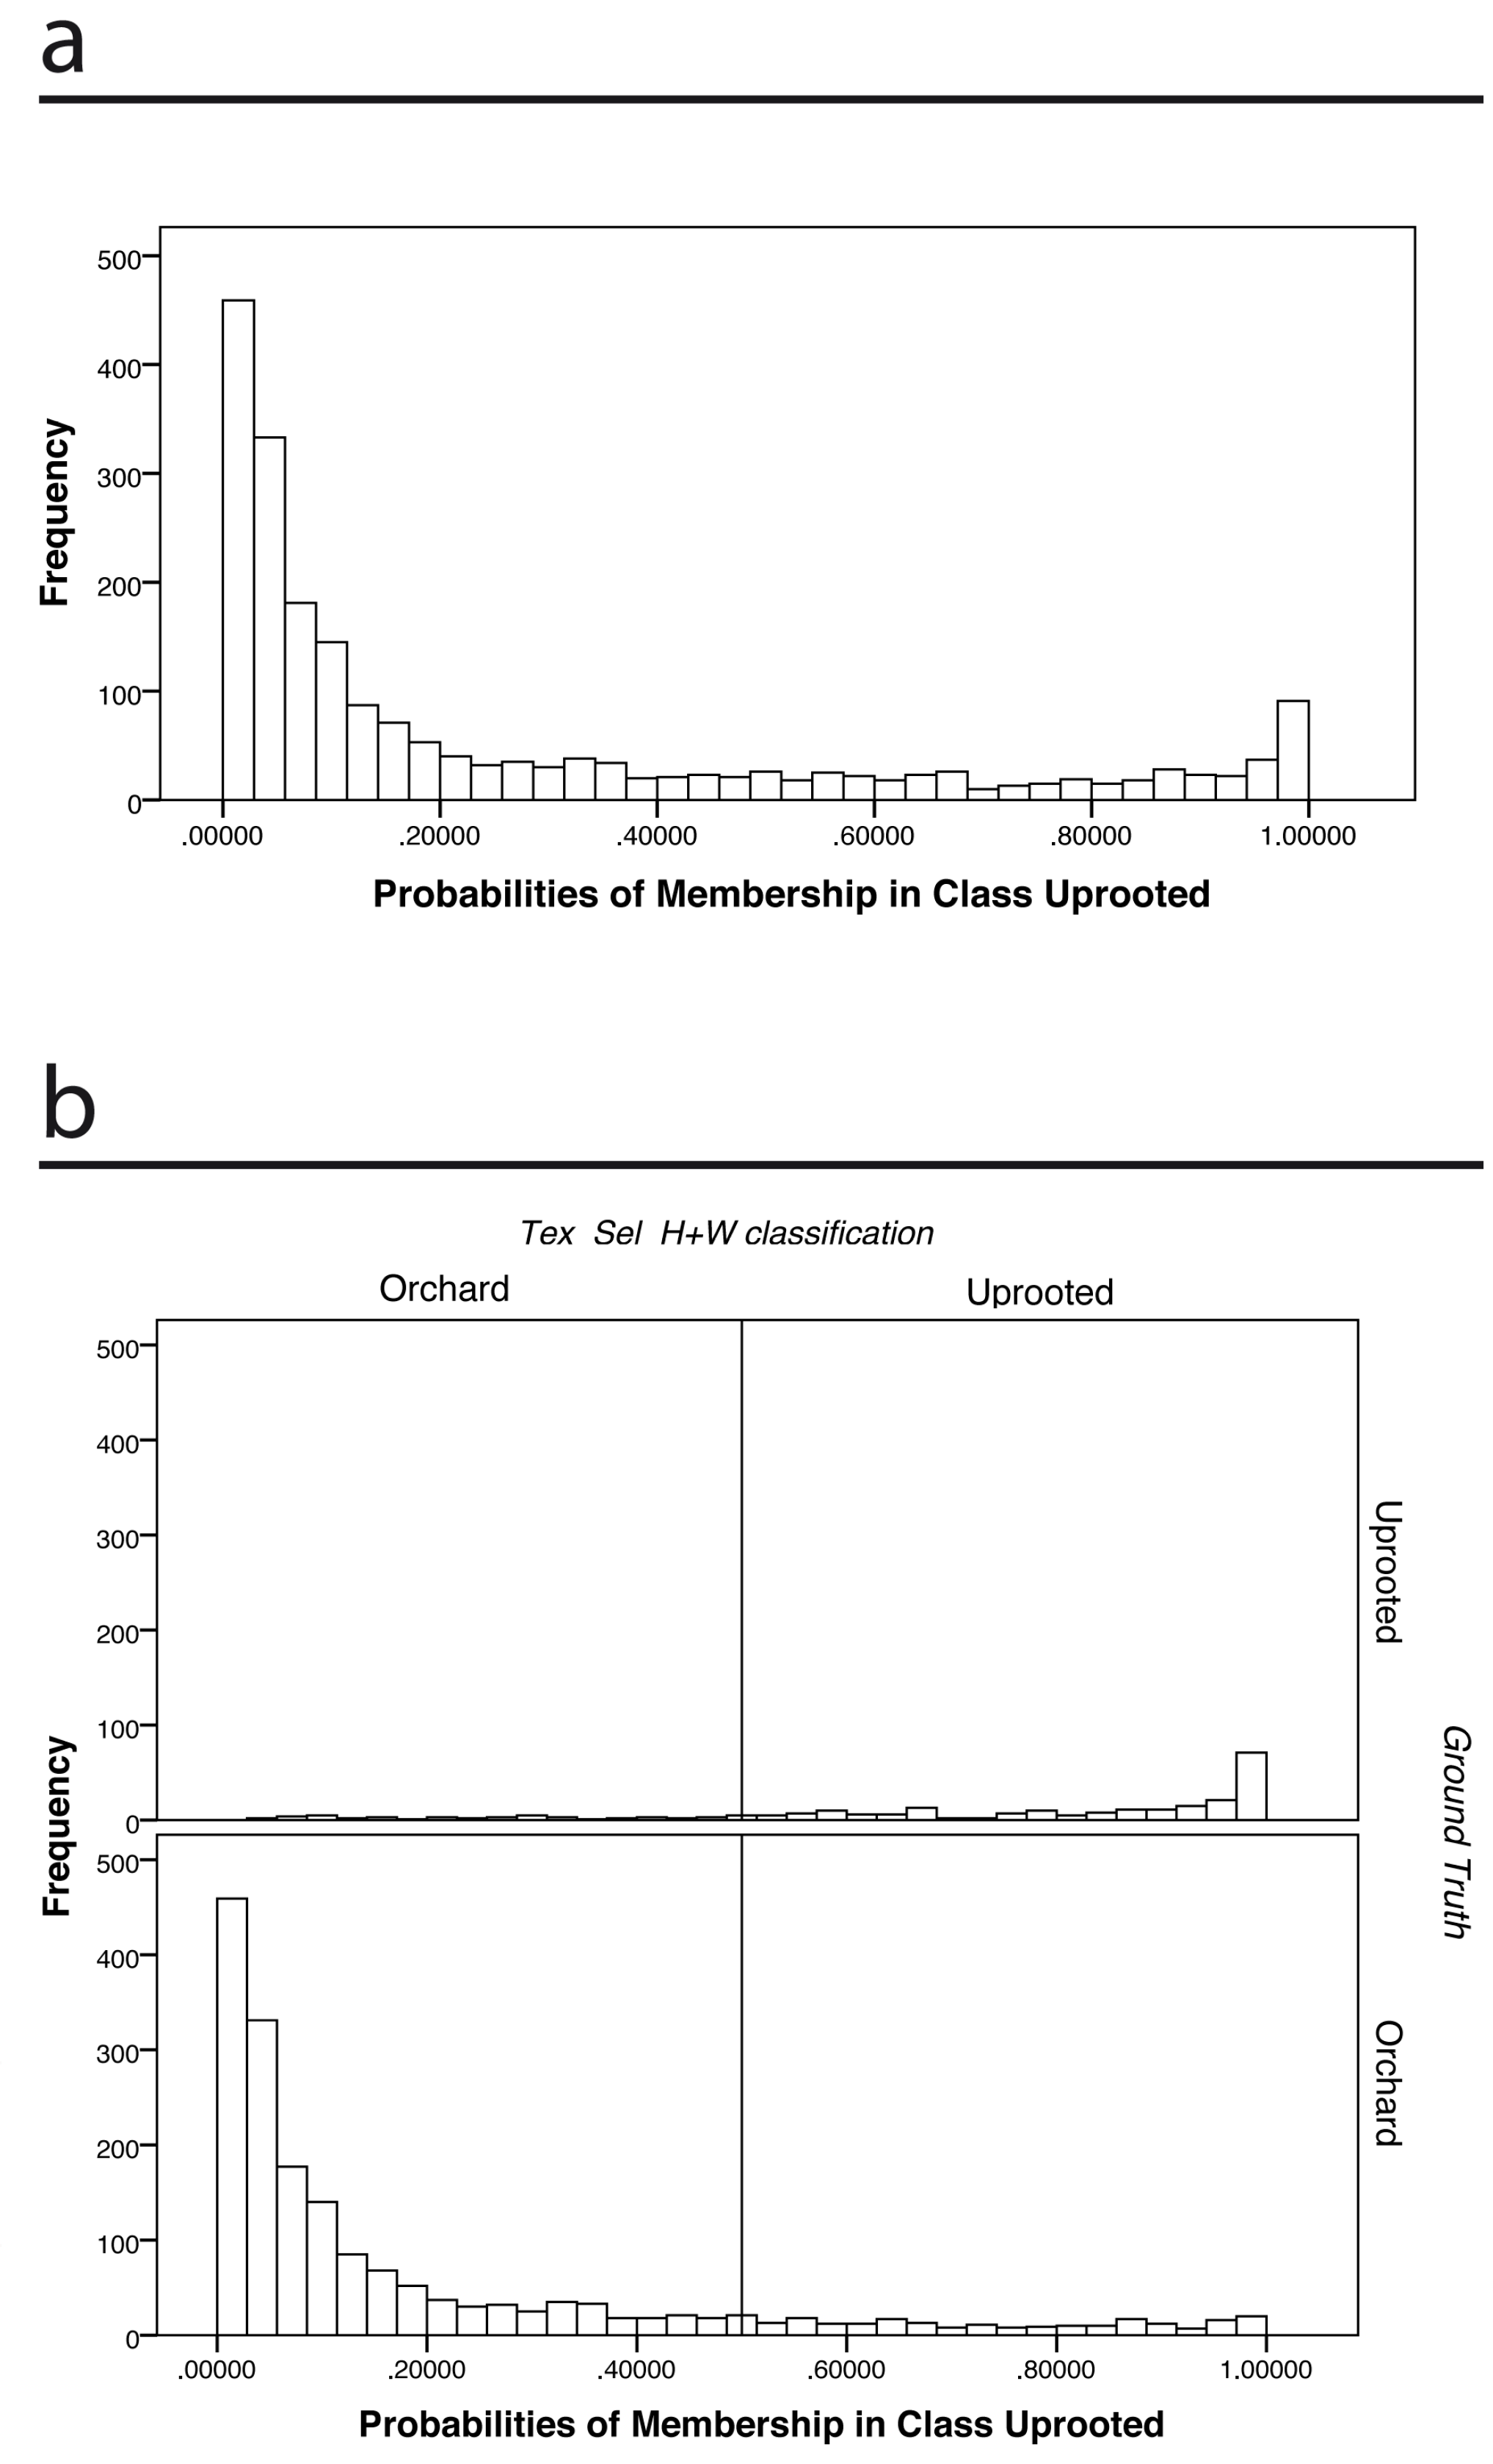
The proposed methodology could facilitate the updating procedure of the analyzed agricultural database by reducing the number of fields to photointerpret by 60–85%, depending on the membership threshold value selected, and could be easily adopted by different stakeholders and could increase significantly the efficiency of agricultural database updating tasks. The approach allows visualizing the results in a GIS environment, facilitating the location of the parcels to be photointerpreted.
While this study focuses on the identification of uprooted orchards, it can also be applied to locate other permanent crops because they often have a regular plantation pattern that can be represented by textural features. The identification of uprooted vineyards, citrus groves or olive groves helps with the maintenance of the Permanent Crops Inventory, which helps to meet the requirements of the European Common Policy for subsidy assignation.


 ,
, 


