1. Introduction
The world is undergoing unprecedented urbanization. The process of urbanization is often accompanied with urban area expansion, urban population growth, and energy consumption increase. The increasing human activities release more and more anthropogenic heat (AH) into the atmosphere. AH is involved in the energy exchange between the surface and atmosphere, hence the surface energy balance is impacted by AH directly. Much research in recent years has shown that AH is one of the key contributing factors to forming urban heat islands and has a significant influence on the regional environment and climate [
1,
2,
3,
4]. Therefore, refined AH parameterization is required for both regional climate change and urban heat island studies.
Anthropogenic heat flux (AHF) is a sophisticated measurement of the heat released into the environment by human activities, i.e., AH emissions generated per unit time and area [
5]. Currently, there are three main approaches to estimating AHF: the energy budget closure method, building energy modeling, and the energy-consumption inventory approach [
6]. AHF is considered as a parameter of the surface energy balance equation in the energy budget closure method [
7] (p. 435). Many researchers have used this method for AHF estimation at different spatial scales [
8,
9,
10,
11]. The building energy modelling approach explicitly calculates the energy consumption from different types of buildings and evaluates heat rejection based on the energy consumption model. AH from buildings is estimated accurately based on this method, but it ignores the heat emissions from transportation, industry, and so on [
12,
13,
14]. The energy-consumption inventory approach is a classical method for regional AHF estimation. It is generally classifies into either bottom-up or top-down approaches [
6]. The bottom-up approach relies on detailed statistics, such as traffic volume, building height, and occupied areas. The city-scale or larger spatial-scale AHF is scaled-up based on the AHF of single buildings [
3]. However, these detailed statistics are often difficult to obtain. Furthermore, the accuracy of AHF estimation is often subject to the level of detail and reliability of the statistics. However, the top-down method is usually used to estimate AHF based on socioeconomic data and energy consumption data over a large area. Compared to the detailed statistical data required for the bottom-up method, the statistics at city-scale or larger spatial-scales are more operable. Therefore, the AHF estimation over a large area is more easily implemented based on the top-down method [
10,
15,
16,
17].
The statistics used in the top-down method are based on administrative divisions. Administrative divisions are divided into different levels (e.g., provincial-level, prefecture-level, county-level, etc.). The lower level corresponds to the smaller spatial scale, and the corresponding statistics are more difficult to collect. Therefore, the spatial scale of AHF results depends on the scale of statistics in the top-down method. In order to obtain AHF estimations in different areas and different spatial scales, large amount of statistics need to be collected (e.g., socioeconomic data and energy consumption data) [
18,
19,
20]. An AHF estimation model needs to be established to realize large spatial-scale AHF parameterization. In addition, AHF estimation based on the top-down method is the mean AHF value within the administrative divisions. The real spatial distribution of AH cannot be reflected by the mean AHF value. Then, spatial proxy data can be used to assign the mean AHF to a finer spatial scale (e.g., a grid-scale with a spatial resolution from about 1 km to 9 km), such as population density (PD) [
15], gross domestic product (GDP) [
21], land use types [
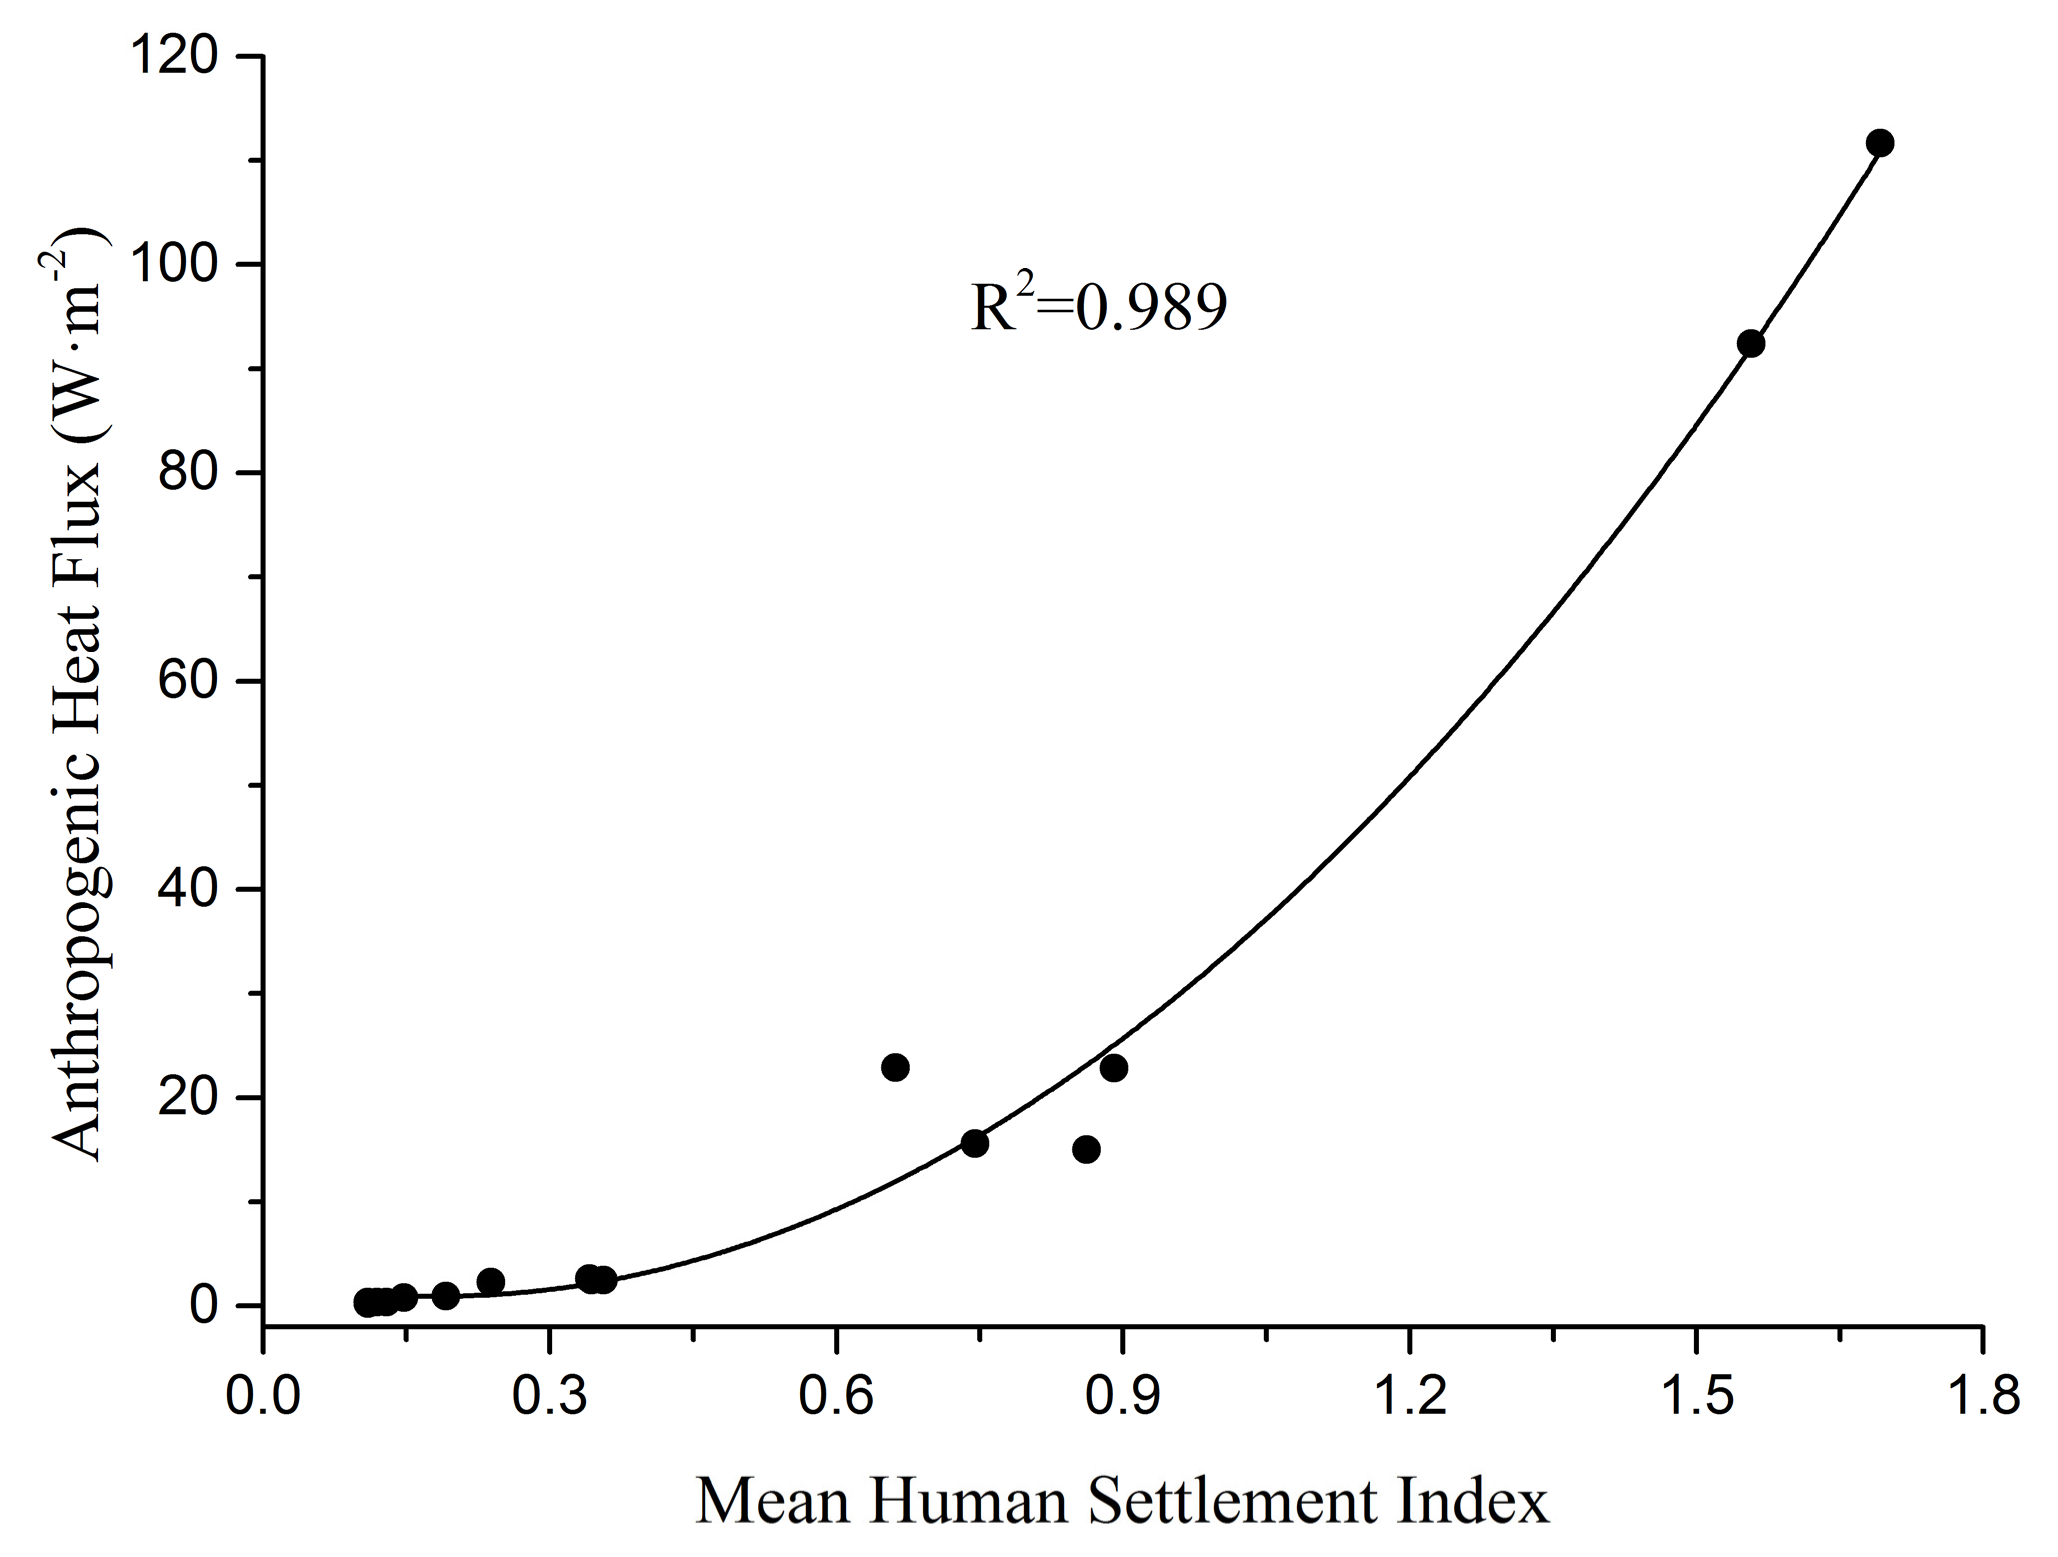
22], etc. In other words, the refined anthropogenic heat flux (RAHF) can be obtained by distributing AHF to every grid. RAHF is needed in regional climate change and urban climate studies. Therefore, finding appropriate spatial proxy data to obtain the RAHF is the focus of current scholars.
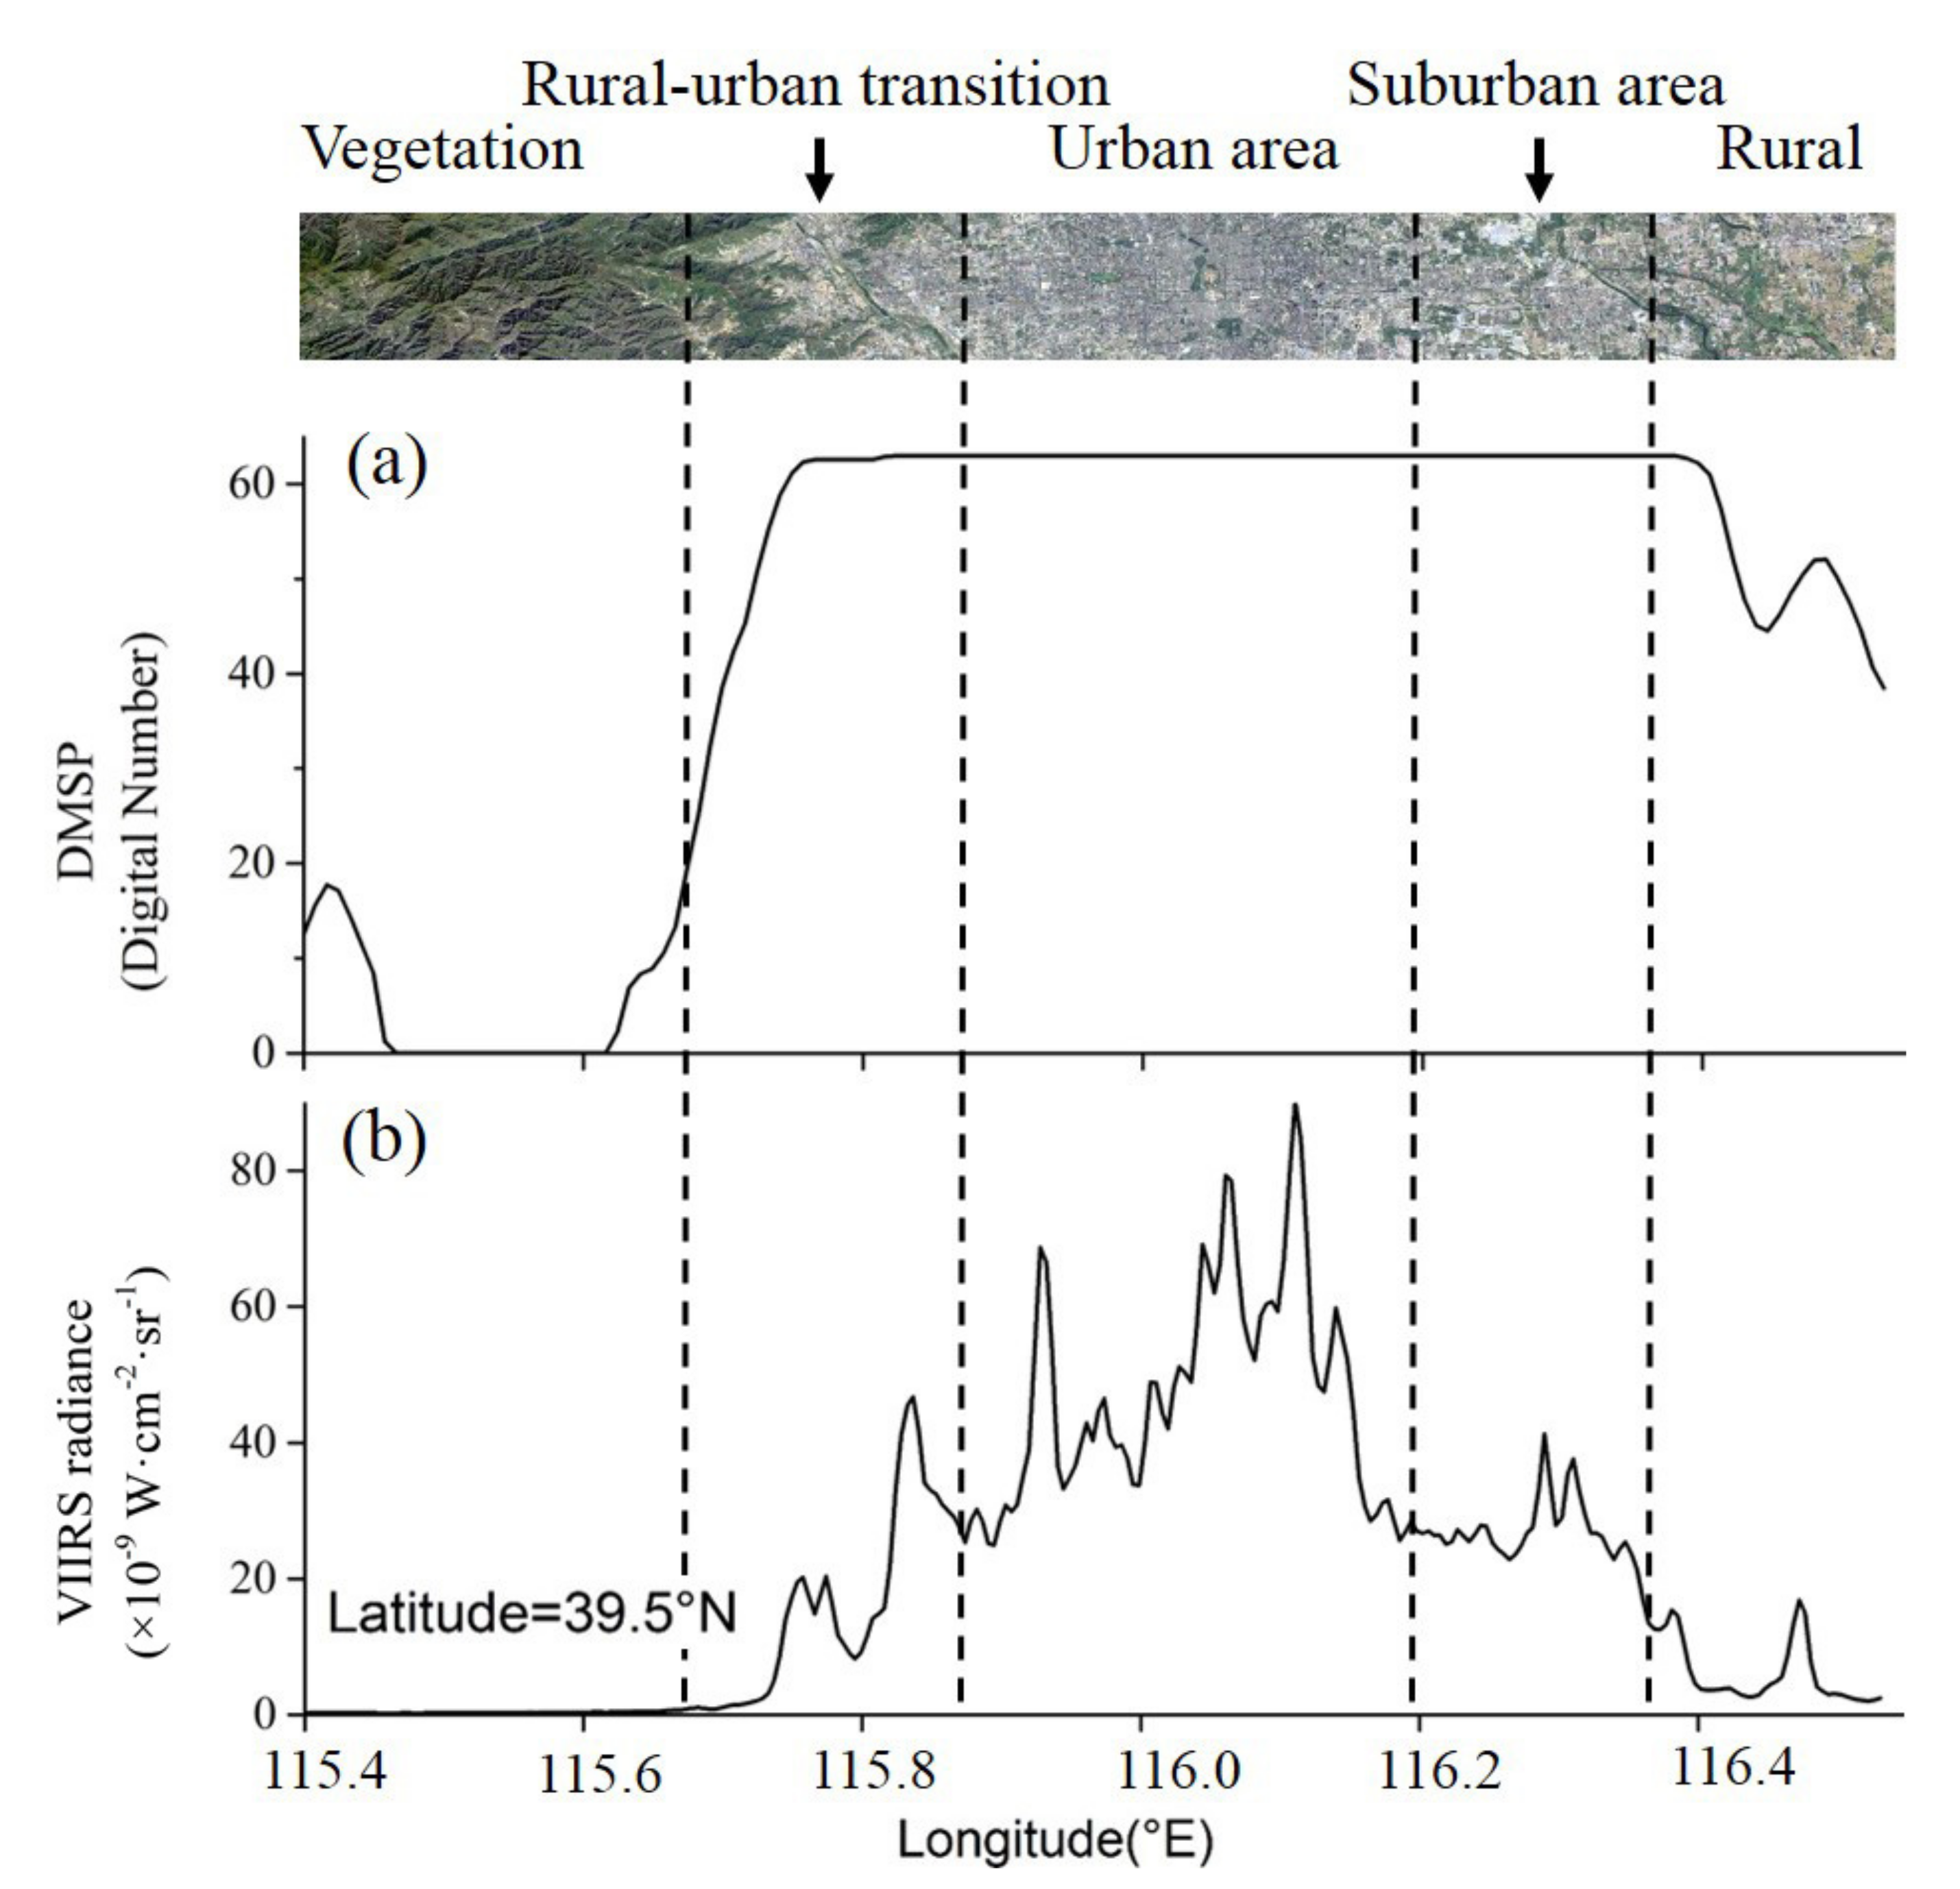
Nighttime light (NTL) data can detect low intensity light emitted by city residents. It has a unique superiority in the monitoring of human activities at night, and it is also one of the ideal spatial proxy data of socioeconomic statistics and energy consumption data [
23,
24,
25,
26]. Currently, DMSP/OLS (defense meteorological satellite program’s operational linescan system) NTL data is being used for AHF estimation. For example, Chen et al. [
27] estimated the global grid-scale AHF based on DMSP/OLS NTL data using the statistical regression relation between AHF and NTL data. Yang et al. [
28] further used DMSP/OLS NTL data to extract urban areas, and then the statistical regression relation between the urban areas and energy consumption was established to estimate long-term AHF. In more recent studies by Dong et al. [
15], DMSP/OLS NTL data was used to correct population density data, and then global grid-scale AHF was estimated based on the corrected population density data. However, due to the saturation of DMSP/OLS NTL data, the accuracy of AHF estimation in the saturated region needs to be improved. Hence, Ma et al. [
29] and Chen et al. [
30] calculated the human settlement index (HSI) based on DMSP/OLS NTL data corrected by vegetation index to alleviate the saturated problem to some extent, but there is still some need for further refinement on the spatial scale.
The National Aeronautics and Space Administration (NASA) launched the Suomi National Polar-orbiting Partnership (Suomi-NPP) satellite at the end of 2011. A new generation of global NTL data, hereinafter referred to as Suomi-NPP VIIRS NTL data, is obtained by a visible infrared imaging radiometer suite (VIIRS) equipped with the Suomi-NPP satellite. Compared with DMSP/OLS NTL data, Suomi-NPP VIIRS NTL data has a higher resolution and a greater range of radiance values. The low intensity light information can be captured by Suomi-NPP VIIRS NTL data to reflect more precisely the intensity and spatial distribution of human nighttime activities [
31,
32].
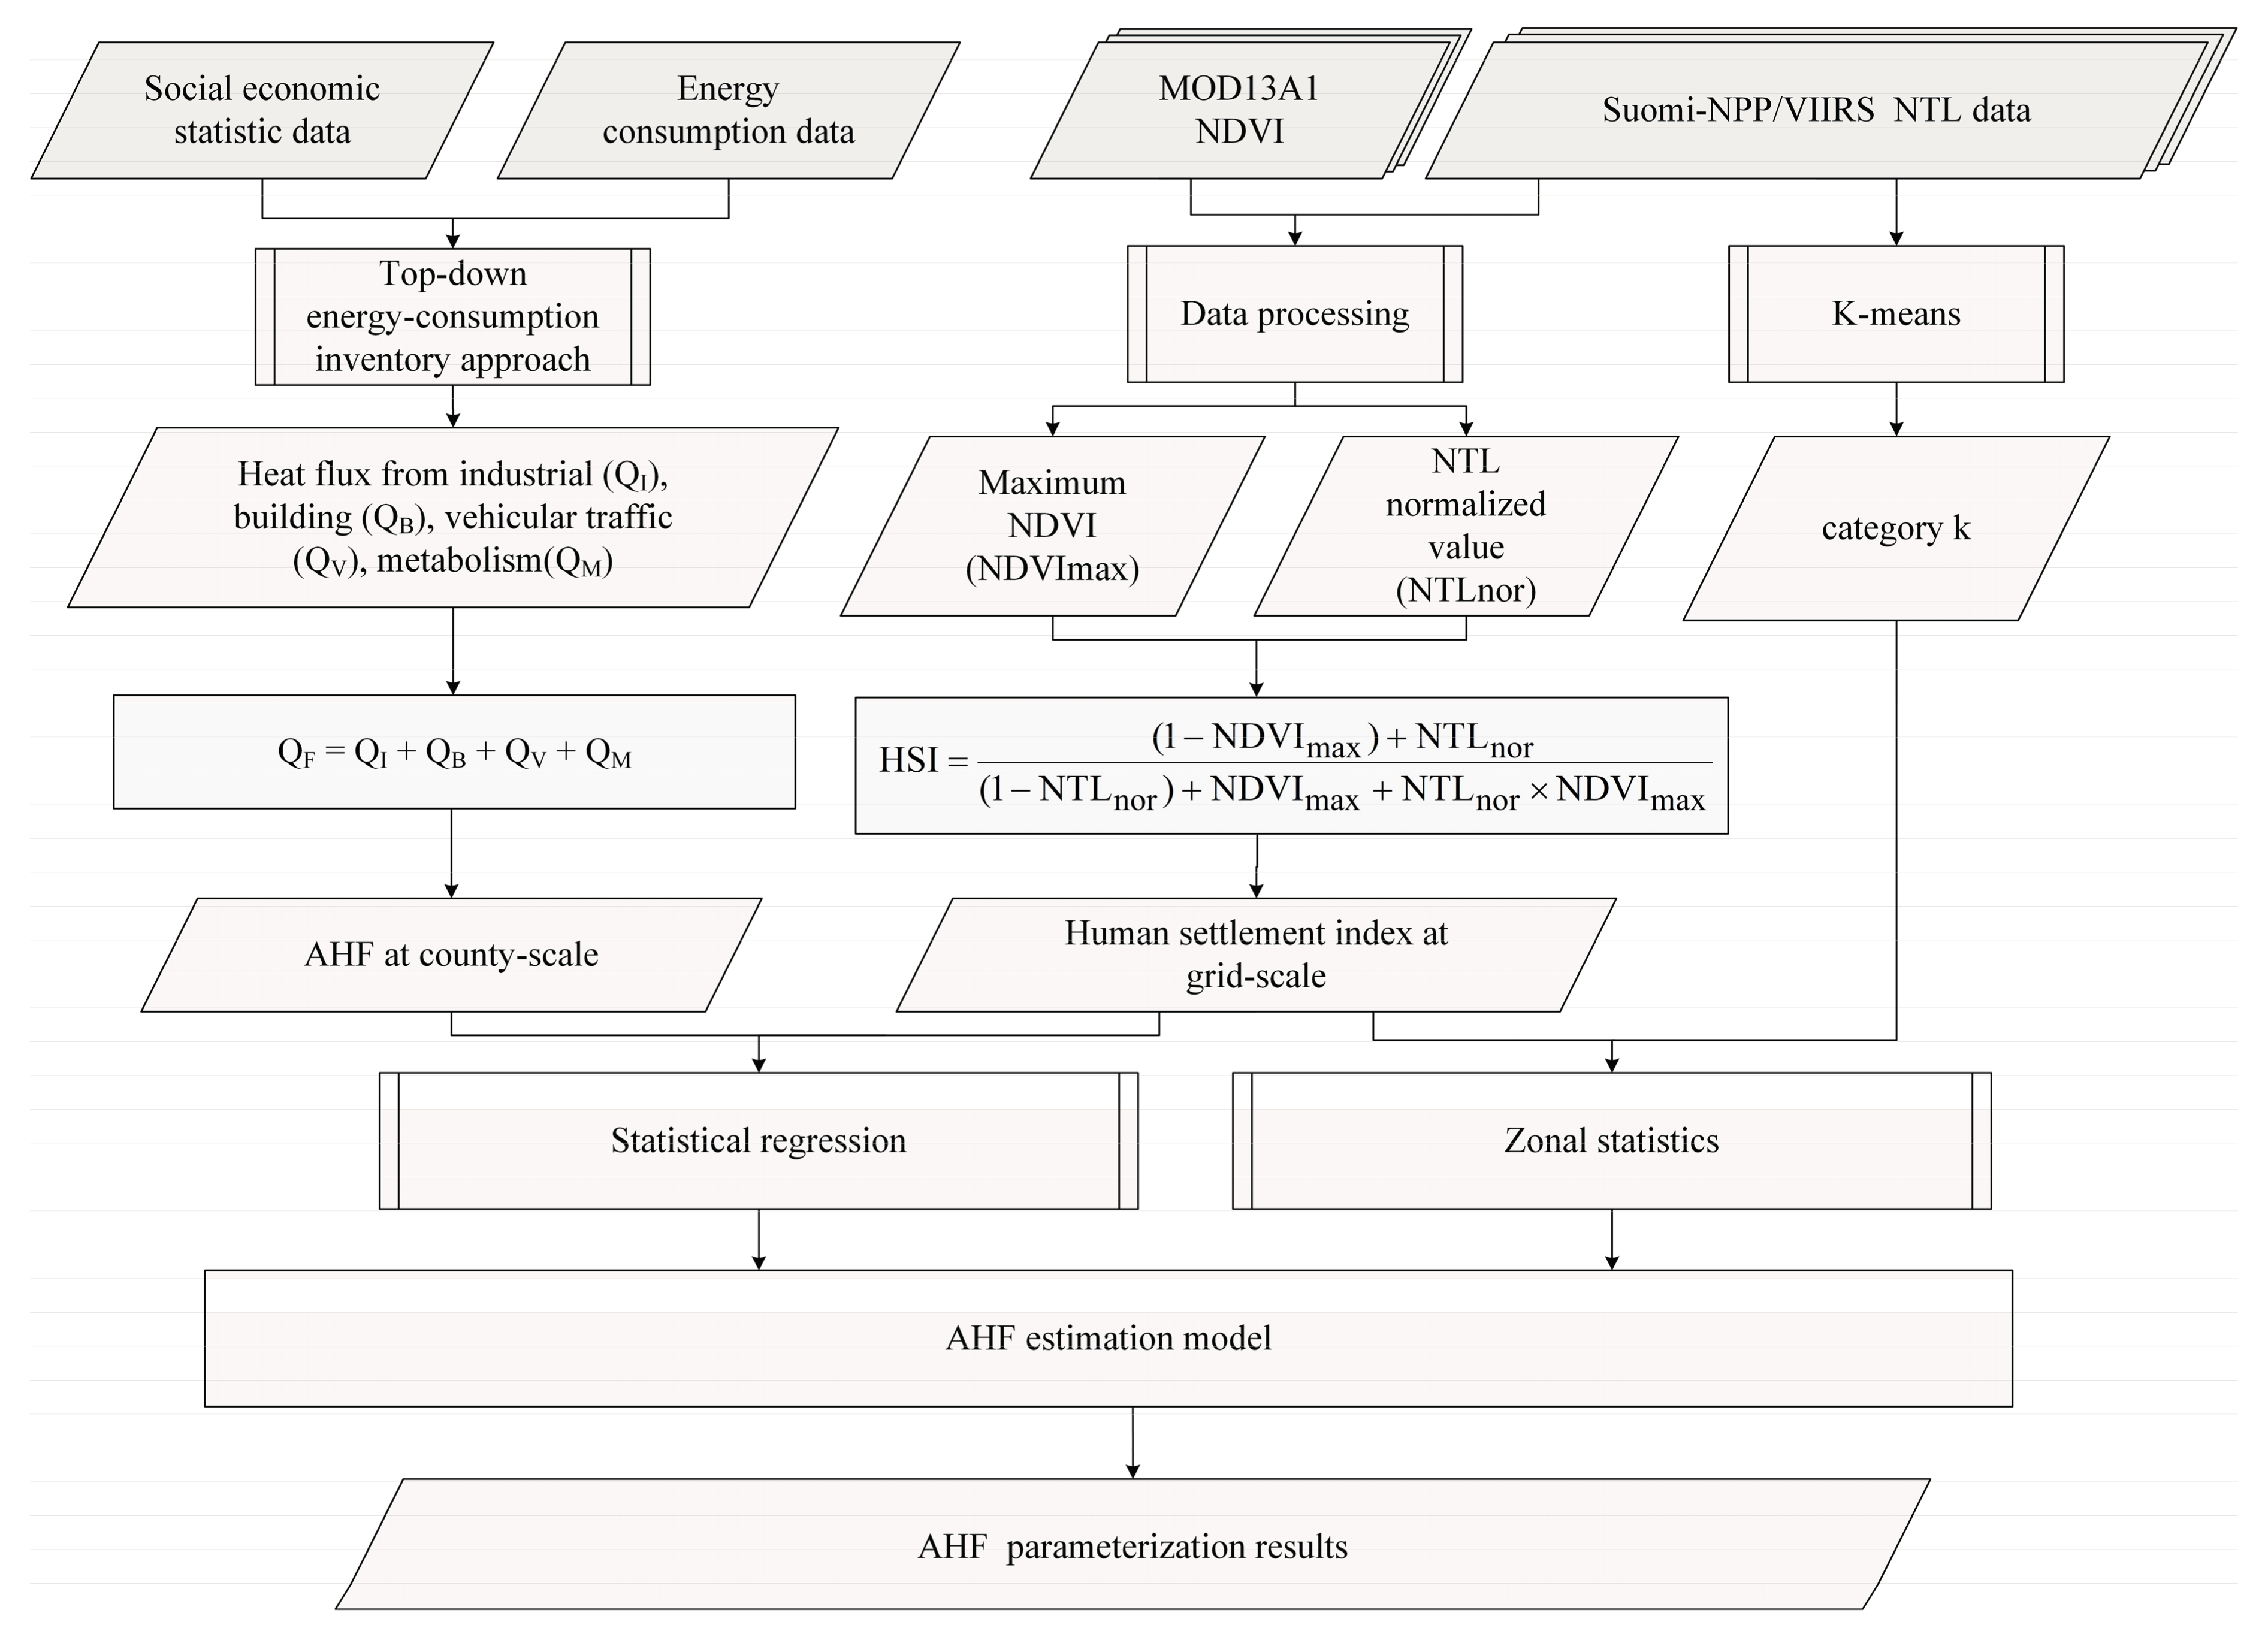
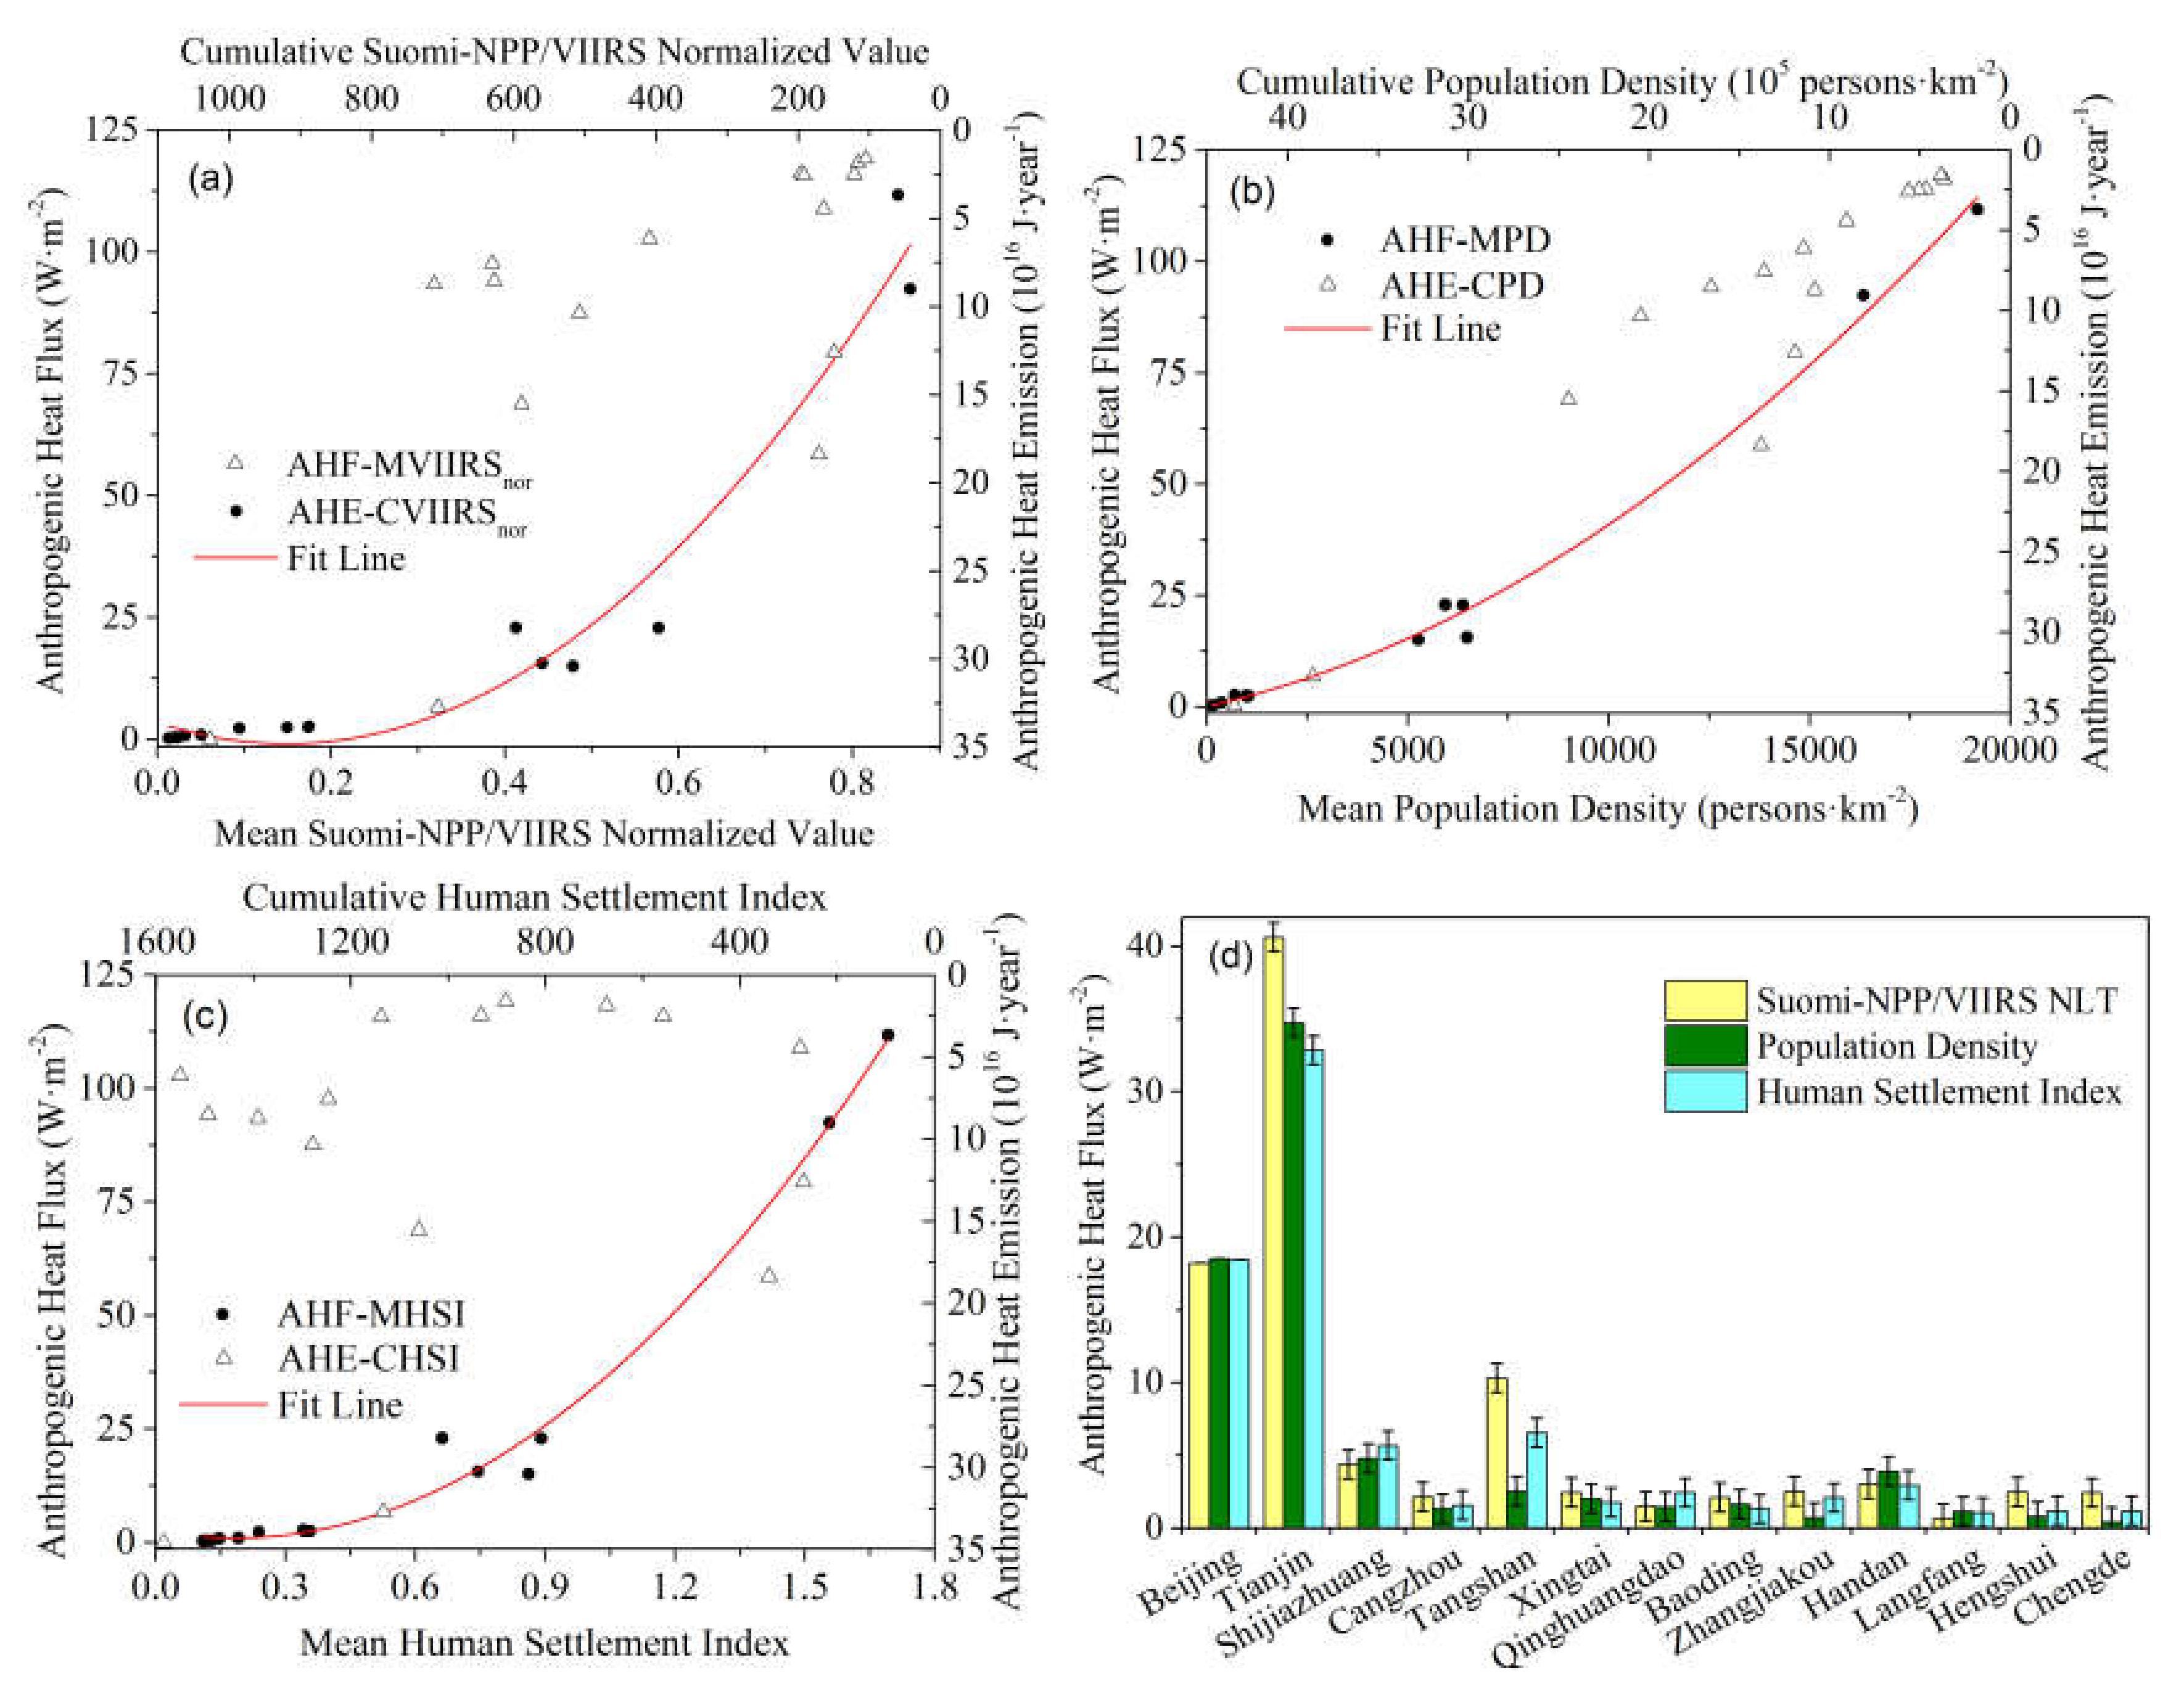
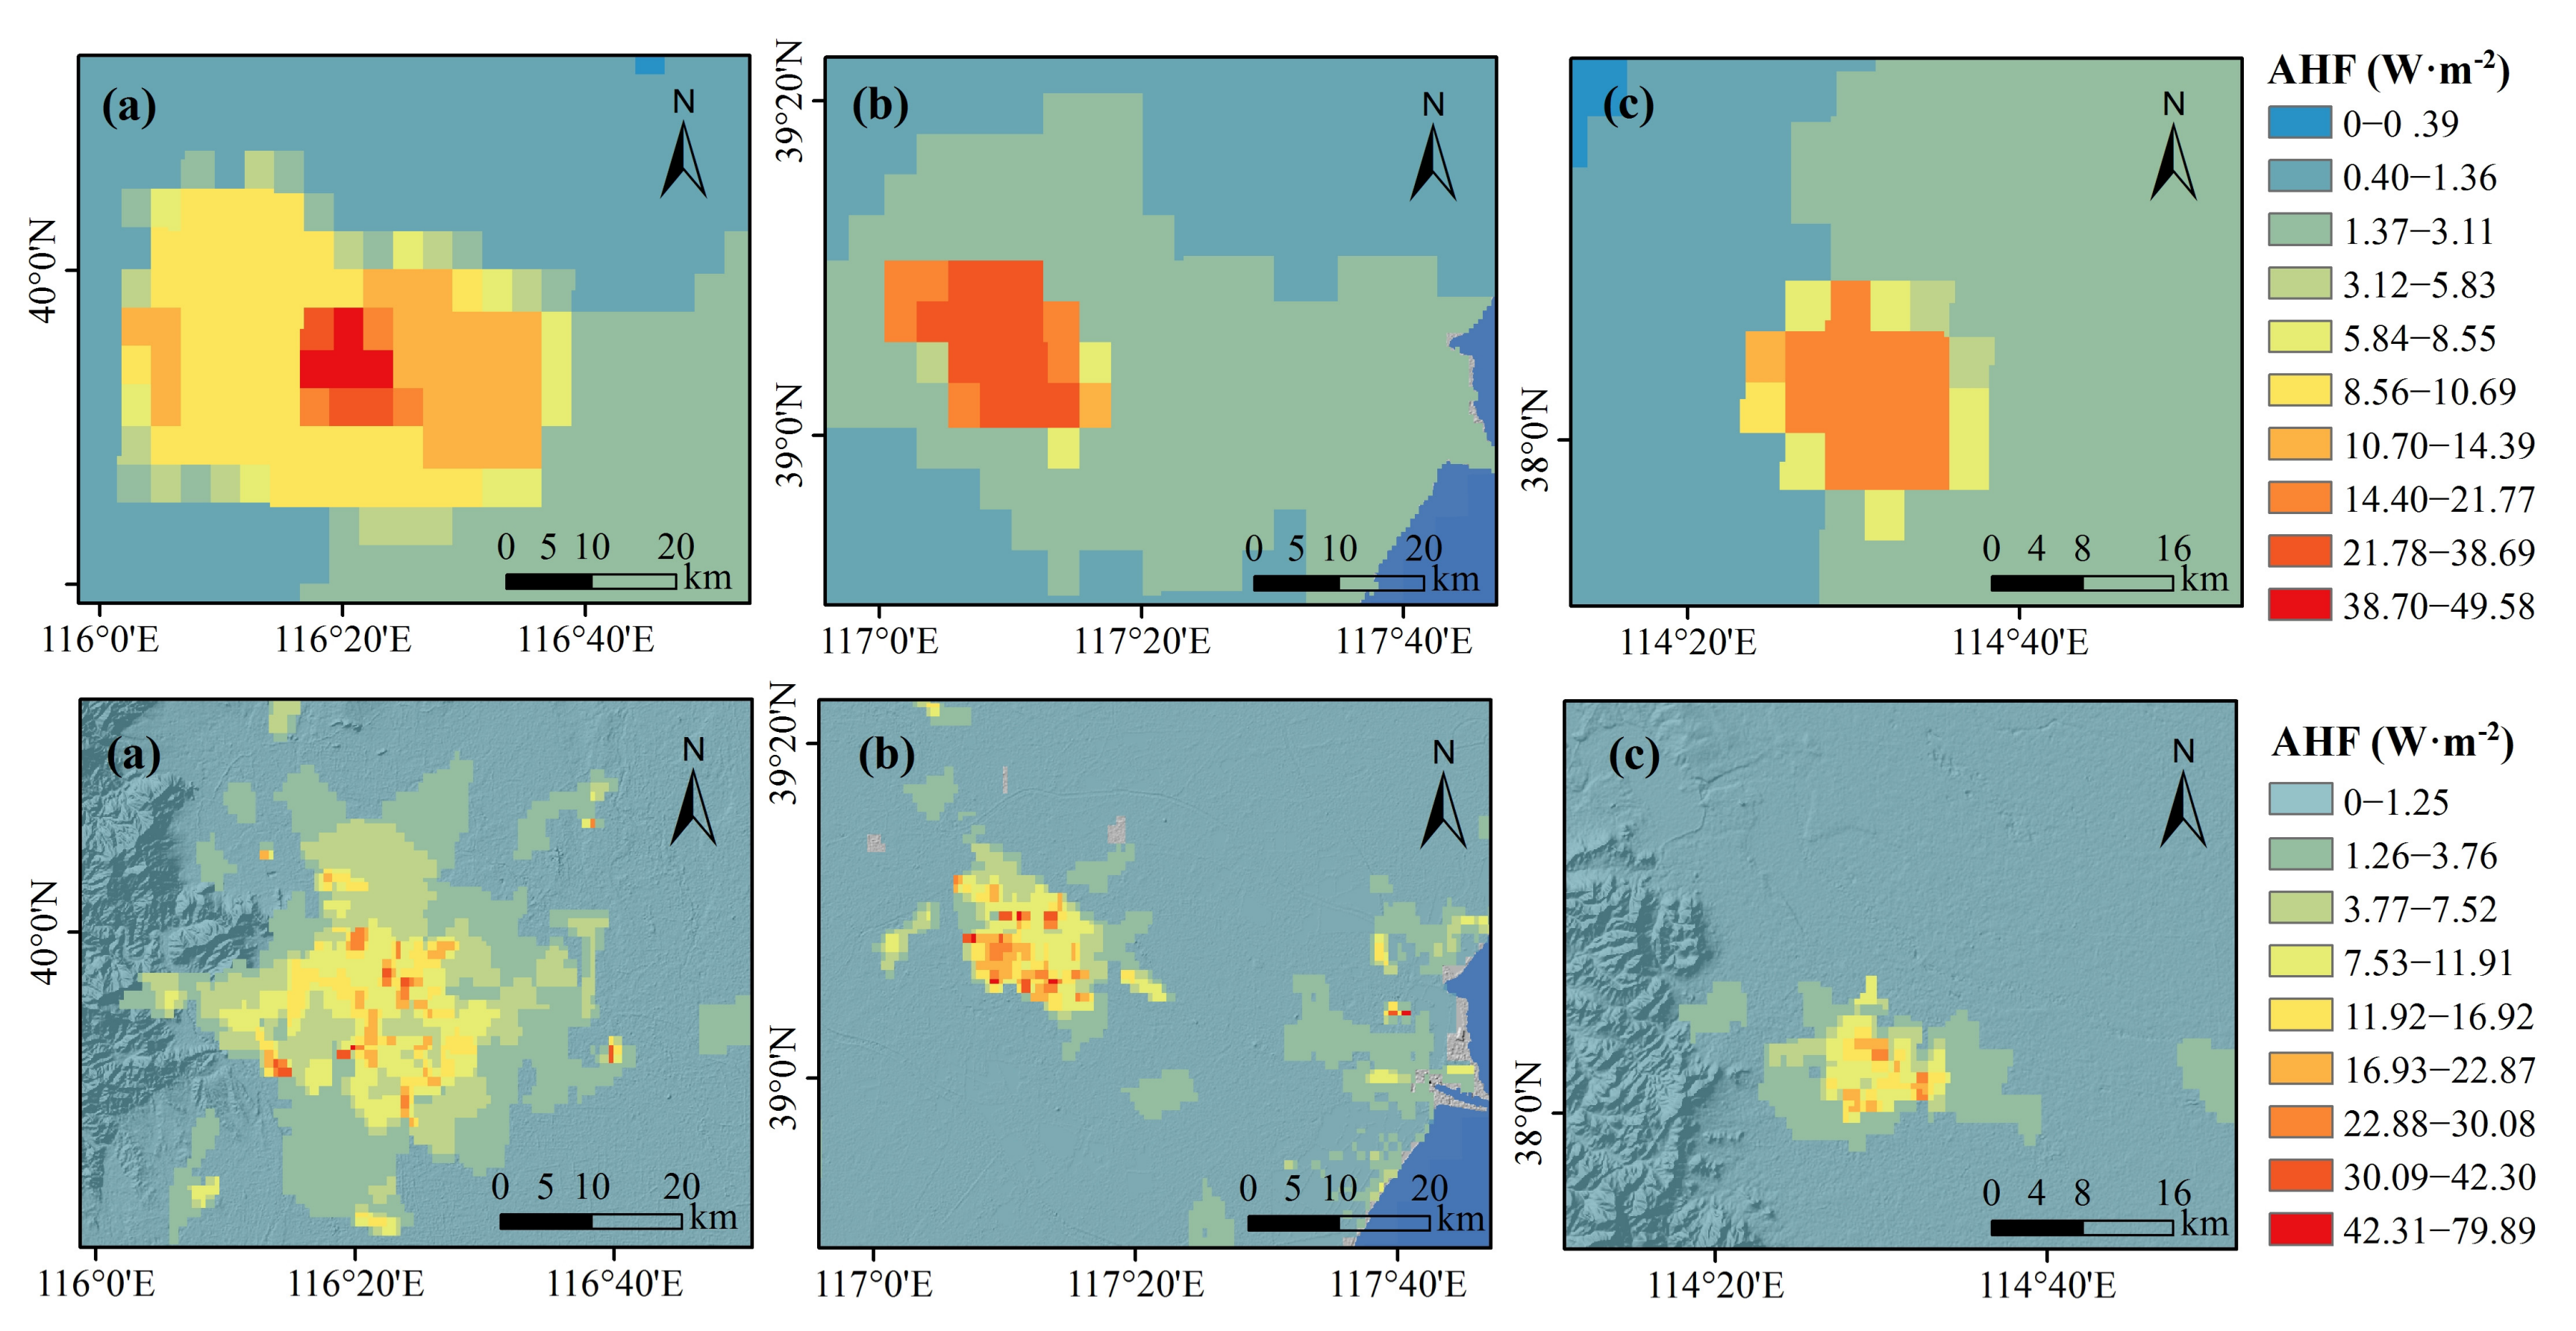
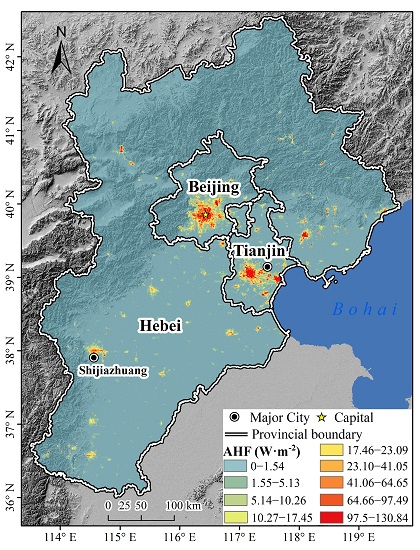
This research aims to establish the RAHF parameterization scheme over a large area and verify the availability of Suomi-NPP VIIRS NTL data in AHF parameterization. First, the annual total AH emissions and annual mean AHF of each district and county in Beijing municipality were calculated using the energy-consumption inventory approach. Then, a county-scale AHF estimation model was built based on the parameters characterizing human activities. In addition, multi-source remote sensing data, such as Suomi-NPP VIIRS NTL data and moderate resolution imaging spectroradiometer (MODIS) data were used to generate the spatial proxy data for grid-scale AHF parameterization within the administrative division. Finally, the grid-scale RAHF with 500-m resolution was parameterized to provide basic data support for regional climate change and urban climate studies.
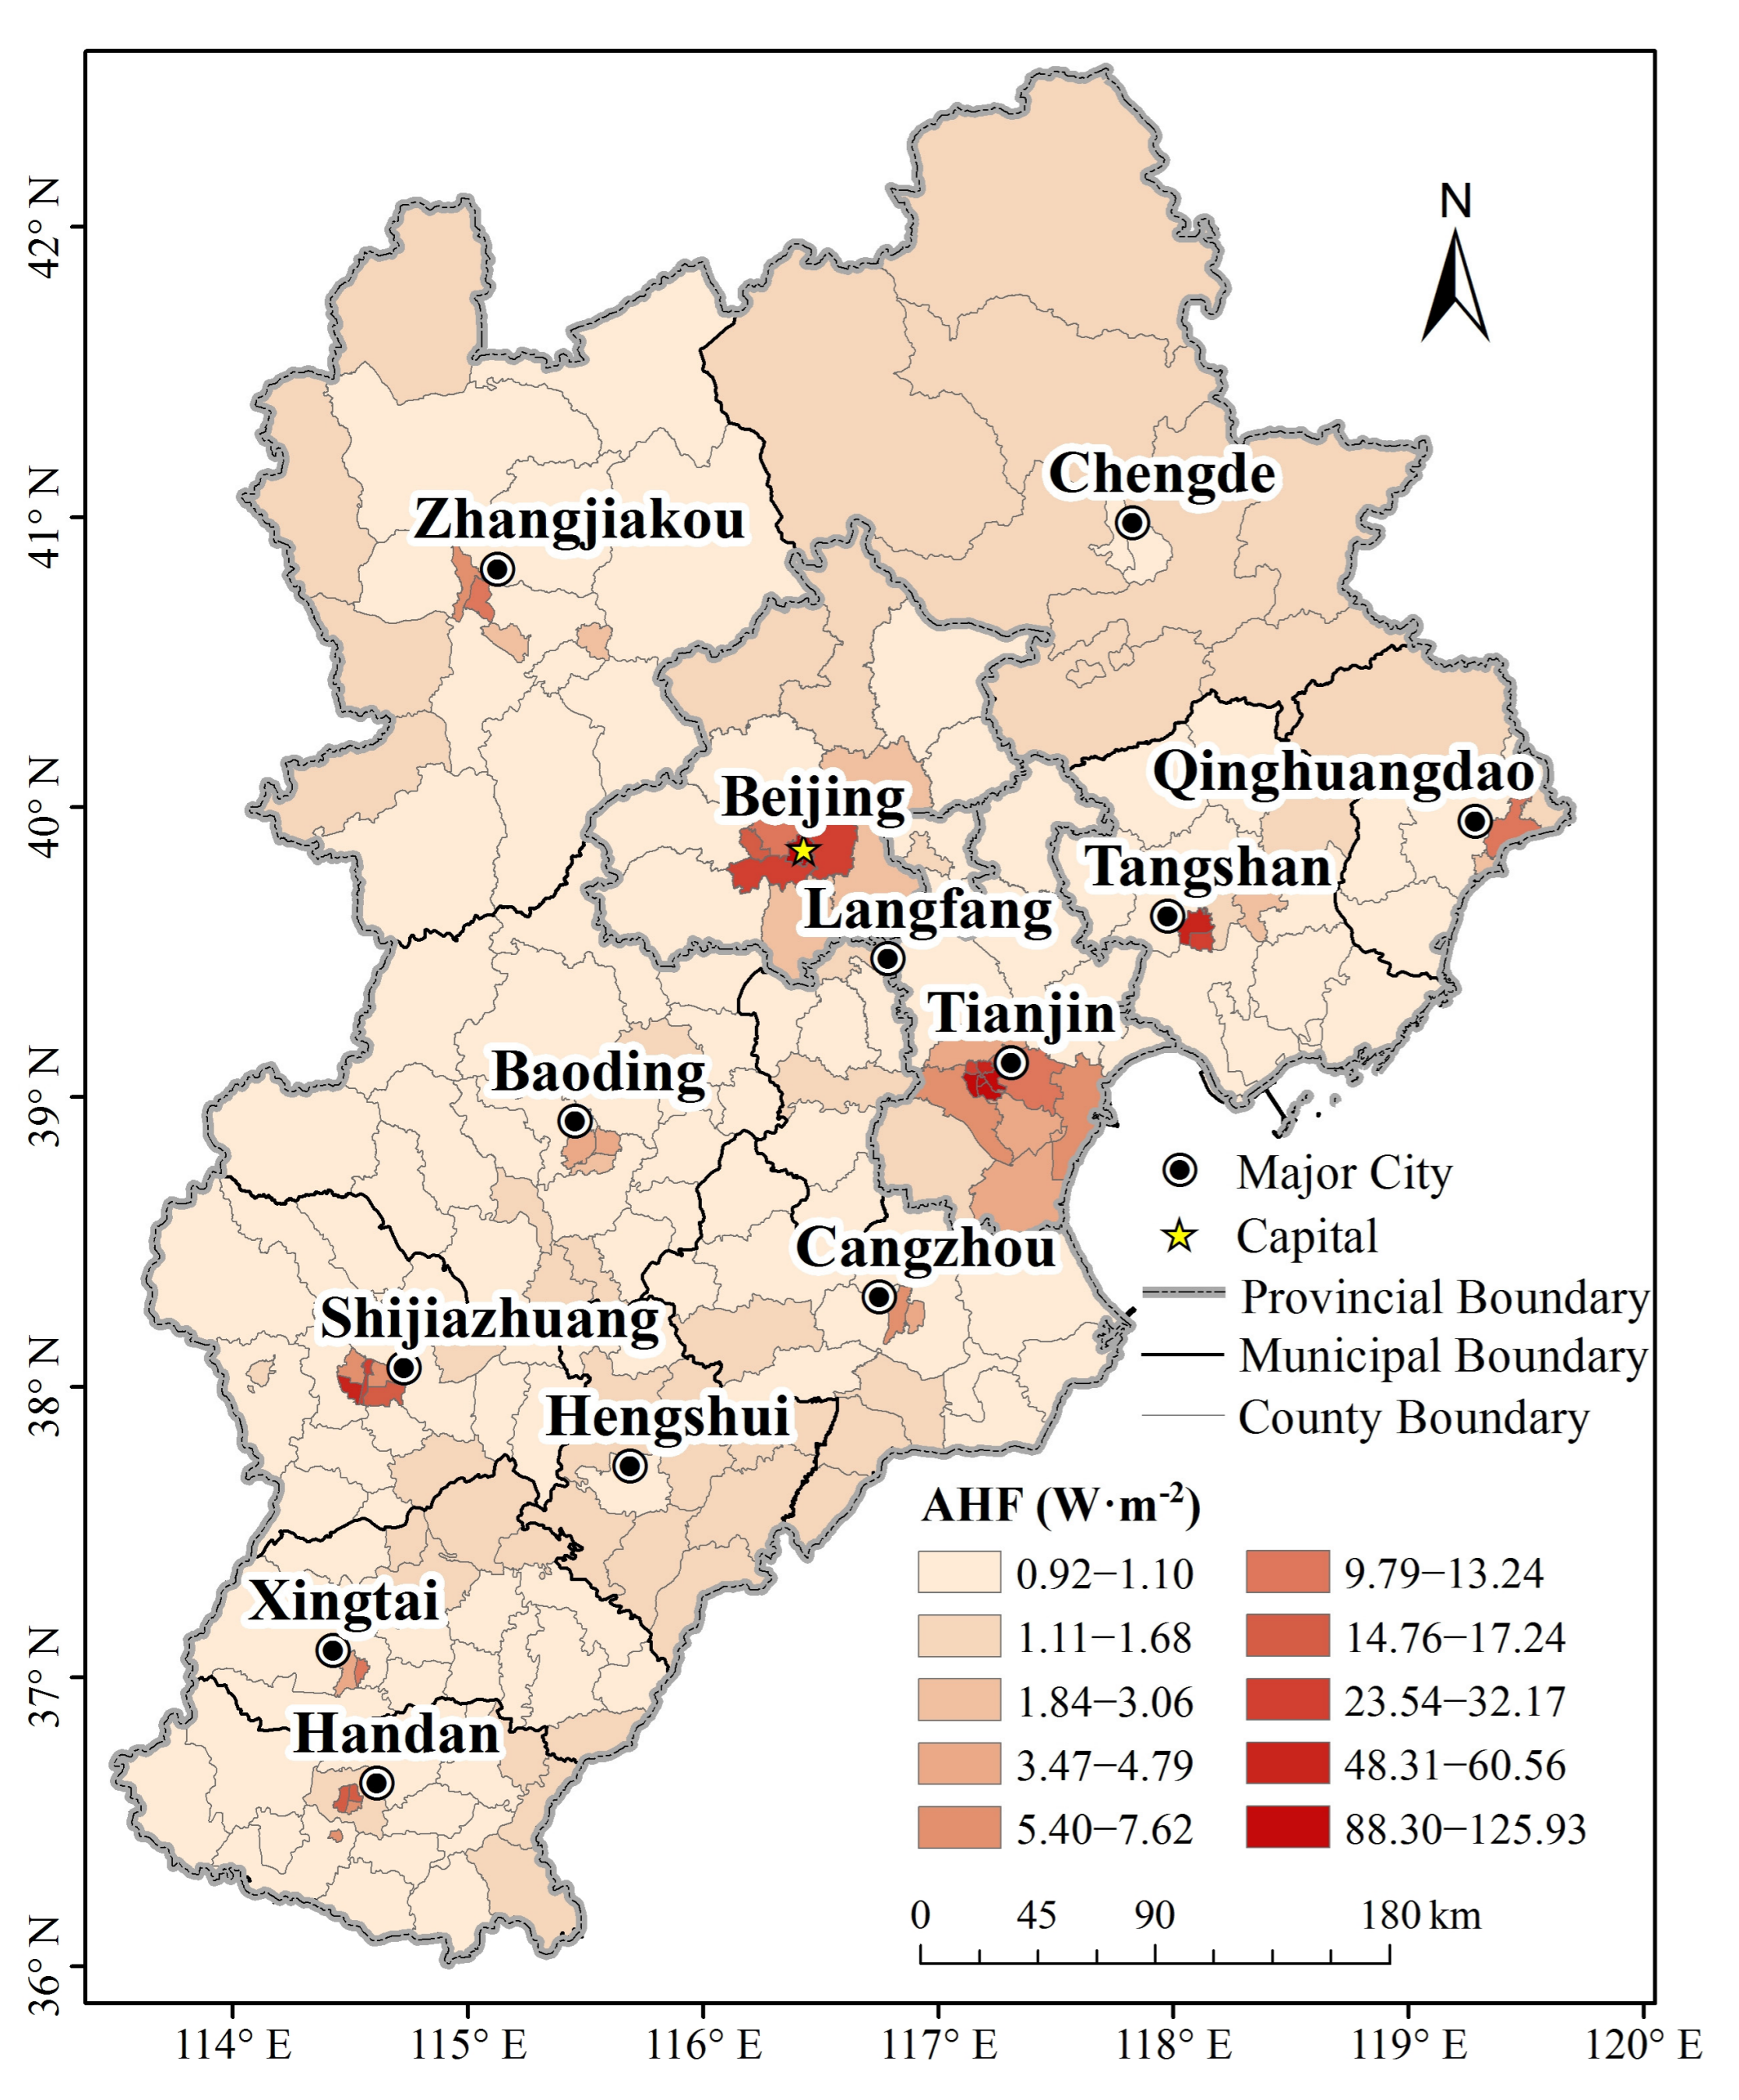
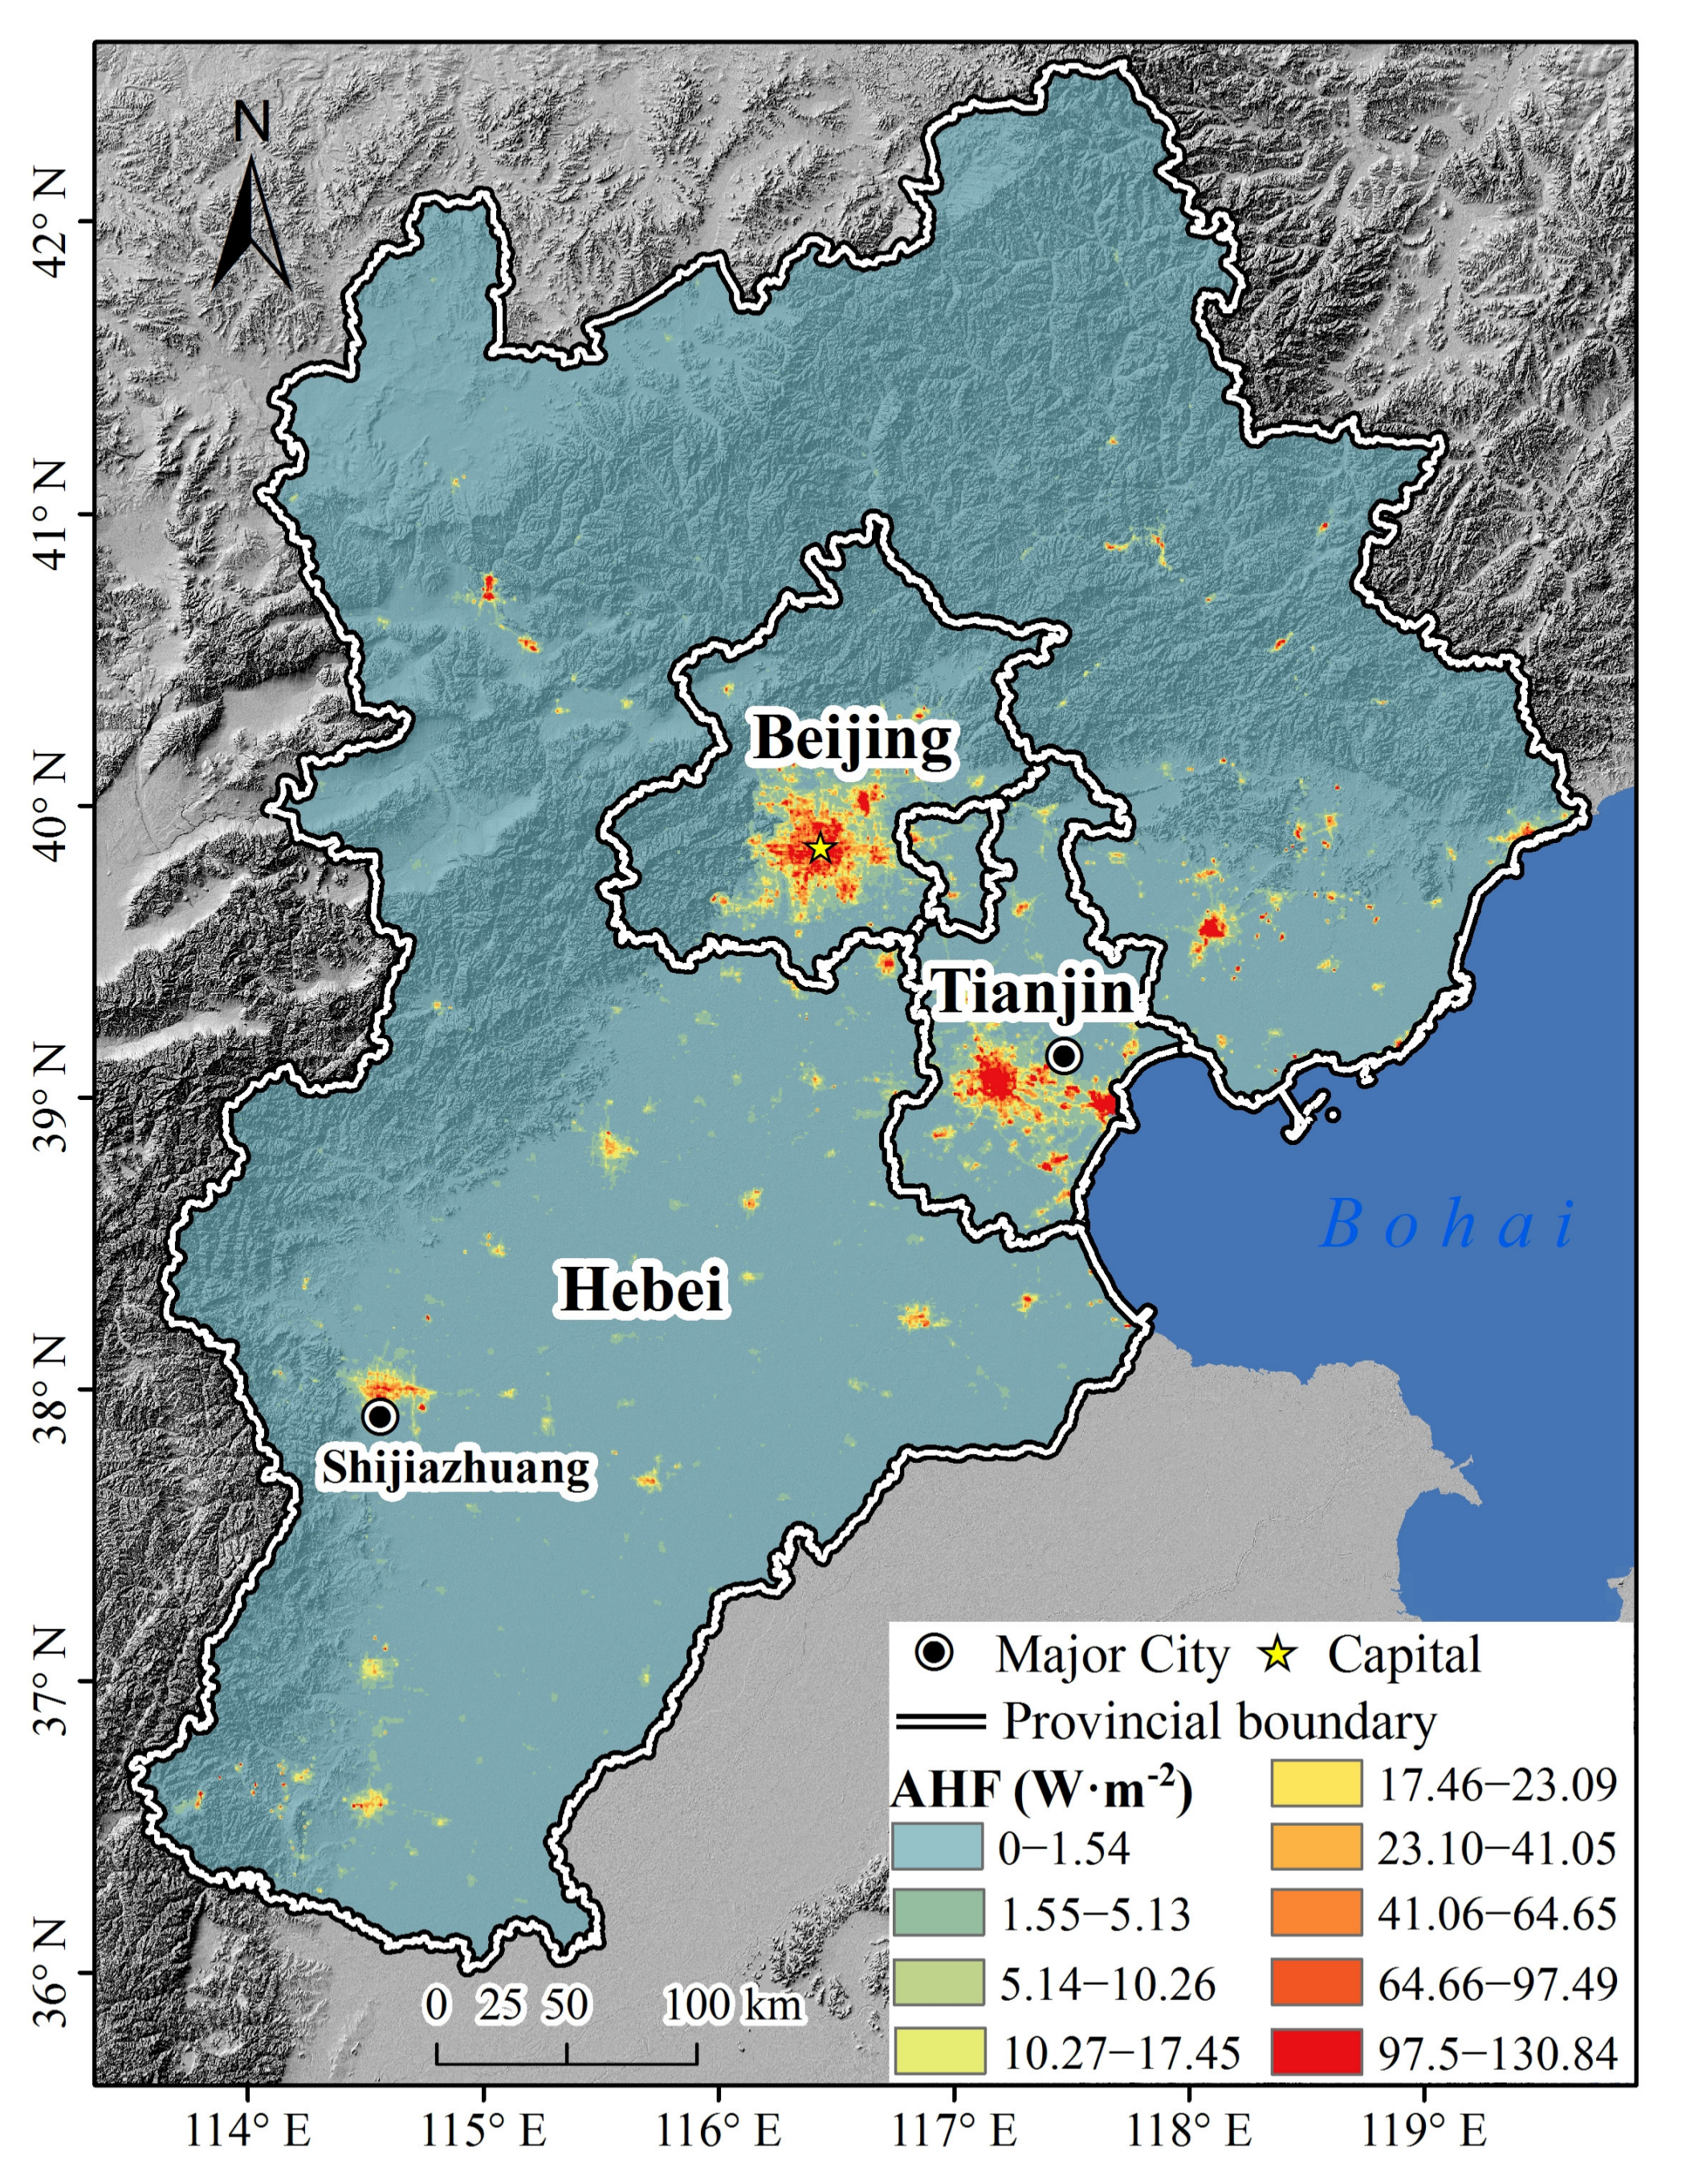
3. Study Area and Data
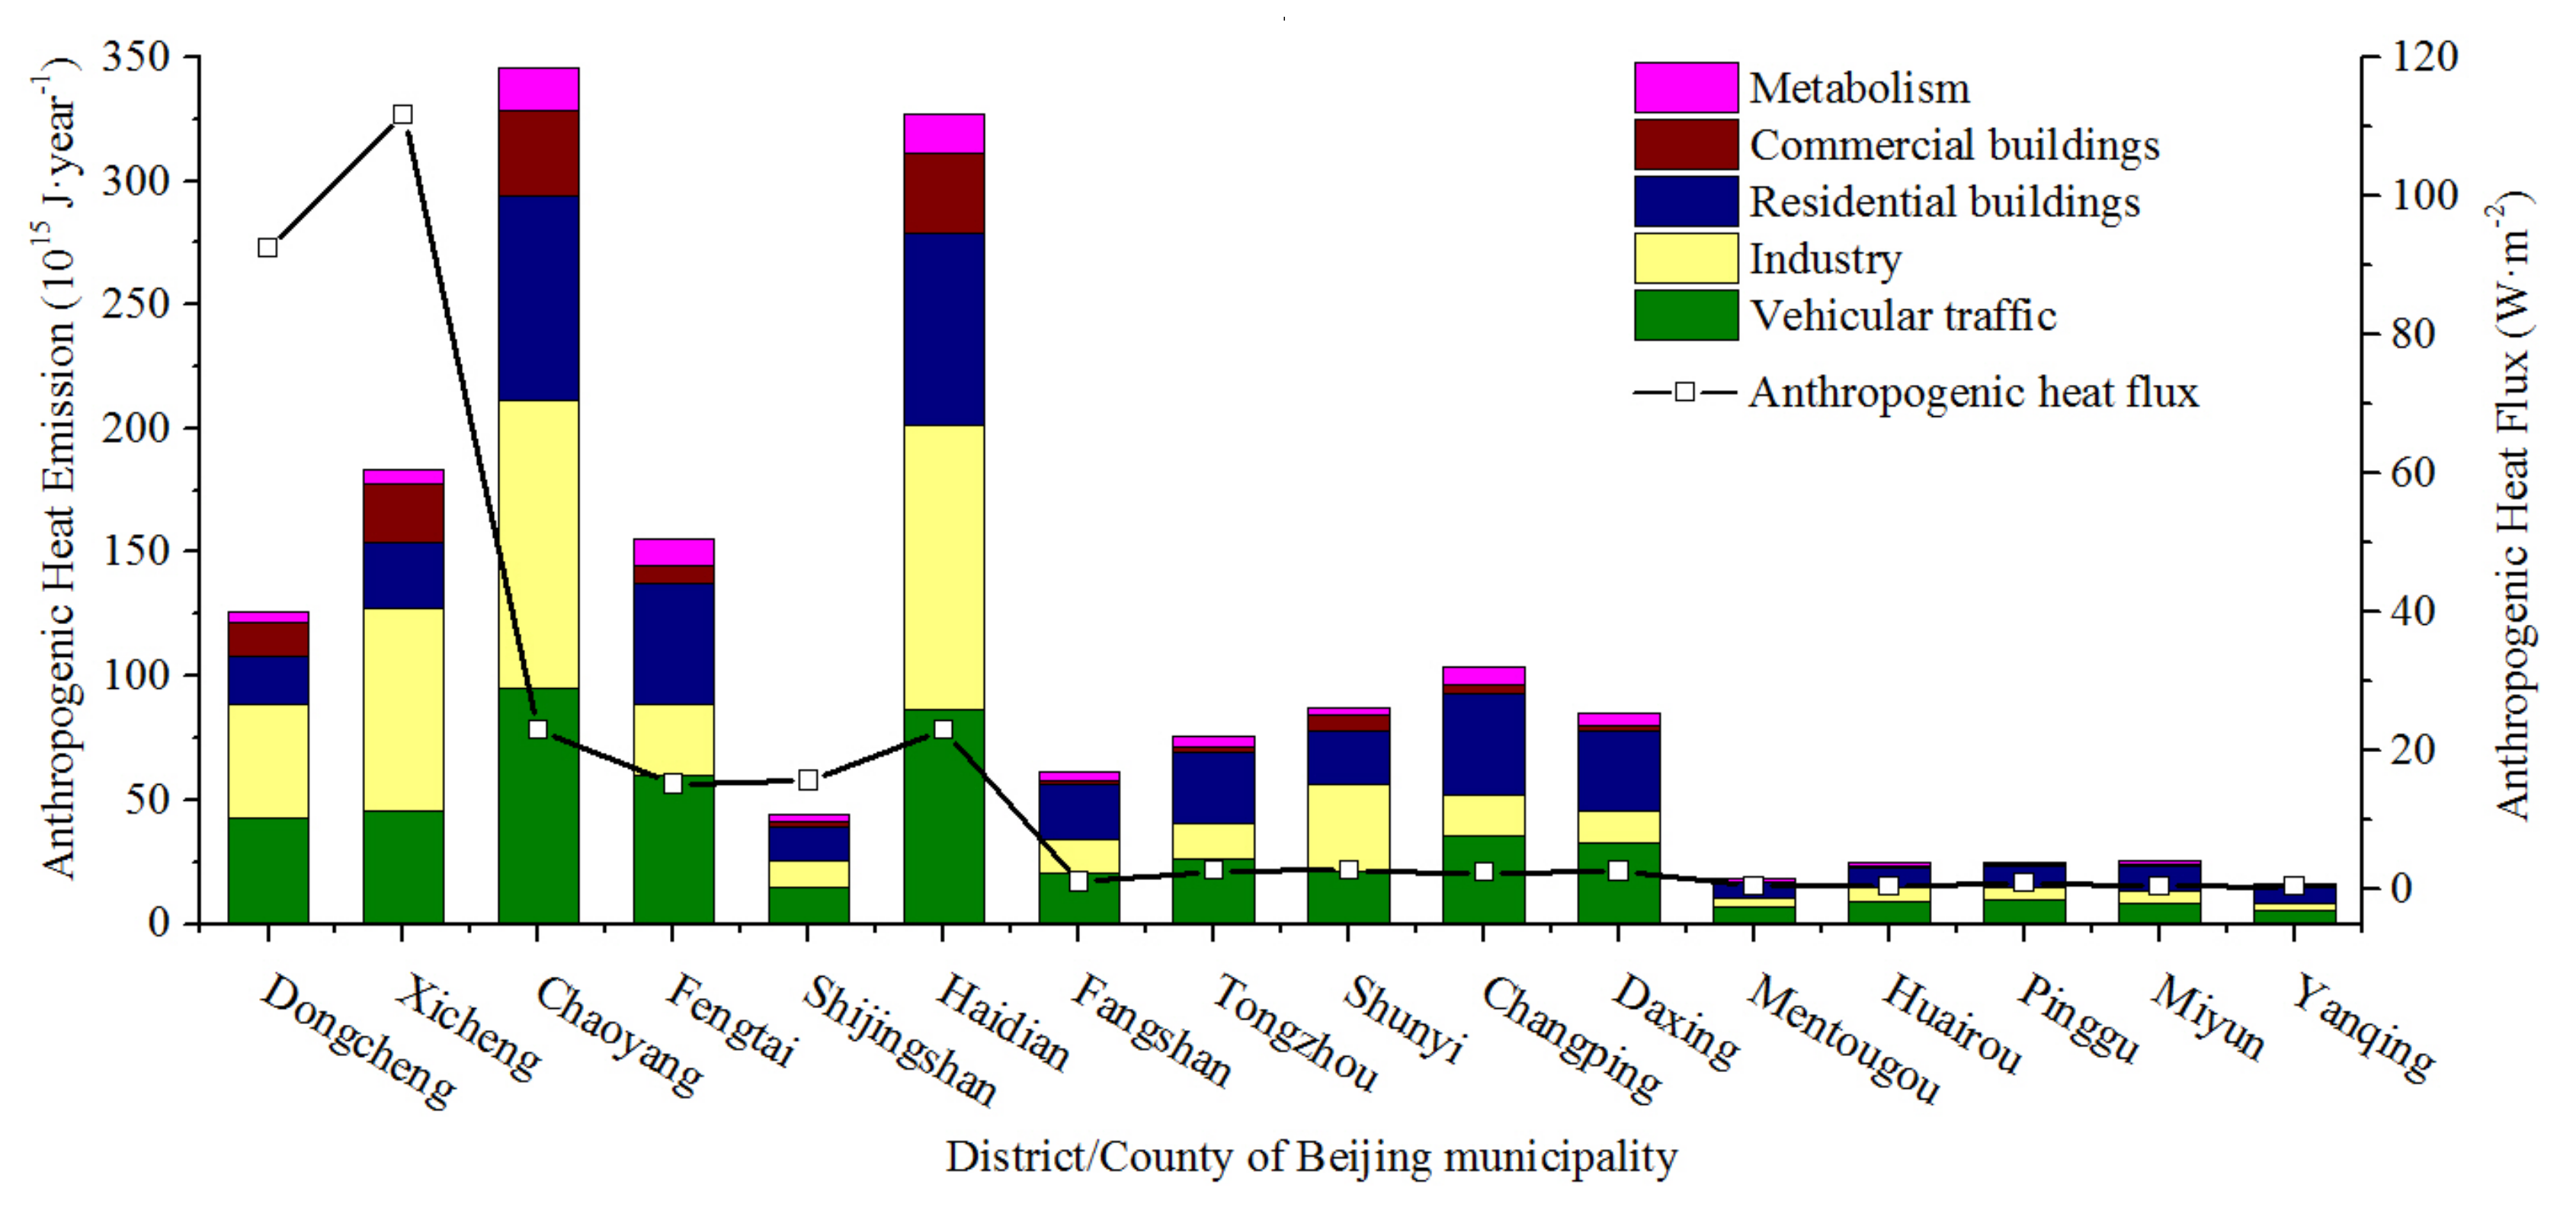
The Beijing–Tianjin–Hebei region, the economic development center in northern China, is located at 113°27′E–119°50′E, 36°05′N–42°40′N, and includes Beijing municipality, Tianjin municipality and 11 prefecture-level cities of Hebei province (including Shijiazhuang, Cangzhou, Tangshan, Xingtai, Qinghuangdao, Baoding, Zhangjiakou, Handan, Langfang, Hengshui, and Chengde city). In this region, the city size is large and the urban heat island effect is evident. In 2014, the resident population was about 110 million people, and the regional GDP was about 6.65 trillion yuan. The total energy consumption was about 353.4 million tons of standard coal. The AH is mainly from the waste heat of automobile exhaust emissions, the energy consumption of industrial production and the various energy consumptions of buildings (e.g., winter heating and summer air-conditioning/refrigeration) [
4].
The basic data for the energy-consumption inventory approach was derived from the statistical yearbook of social economy and energy consumption in Beijing municipality, Tianjin municipality and Hebei province in 2015, including China Energy Statistics Yearbook, China Population and Employment Statistics Yearbook, and the statistical yearbook of energy and environment in Beijing municipality, Tianjin municipality and Hebei province [
40,
41,
42,
43].
Multi-temporal Terra MODIS NDVI data (MOD13A1 product) and Suomi-NPP VIIRS NTL data were used in this research. All the selected data sets were acquired in 2015. Terra MODIS NDVI images (MOD13A1 product) with 500 m spatial resolution were downloaded from the United States Geographic Survey (USGS) [
44]. The product is a 16-day composite product [
45]. Multi-temporal NDVI mosaic images between April and October 2015 were collected to get high vegetation coverage data. MODIS NDVI mosaic images of h26v04, h26v05, h27v04, and h27v05 scenes were obtained to contain the full extent of the Beijing–Tianjin–Hebei region. The MODIS NDVI images with sinusoidal projection were reprojected to transverse mercator projection, and the quality control was performed based on the QC subset of the MOD13A1 product to obtain reliable NDVI images.
The monthly composites of Suomi-NPP VIIRS NTL data were downloaded from the National Oceanic and Atmospheric Administration/National Geophysical Data Center (NOAA/NGDC) [
46]. The monthly composite records the radiance value (in W∙cm
−2∙sr
−1) and excludes any data impacted by stray light [
47]. The NTL data with geographic (Lat/Lon) projection were reprojected to transverse mercator projection, and the nearest neighbor resampling algorithm was used during the reprojection procedure. The method of Ma et al. [
48] was used to remove the outliers of NTL data. The annual mean NTL data were calculated using a simple average value of the monthly mean NTL after the quality control.


