Article

Road Network Extraction from VHR Satellite Images Using Context Aware Object Feature Integration and Tensor Voting

1
School of Surveying and Geospatial Engineering, College of Engineering, University of Tehran, Tehran 1439957131, Iran
2
Faculty of Geomatics, Computer Science and Mathematics, University of Applied Sciences, Schellingstr. 24, Stuttgart 70174, Germany
*
Author to whom correspondence should be addressed.
Remote Sens. 2016, 8(8), 637; https://doi.org/10.3390/rs8080637
Submission received: 12 May 2016 / Revised: 16 July 2016 / Accepted: 26 July 2016 / Published: 4 August 2016

Abstract

:
Road networks are very important features in geospatial databases. Even though high-resolution optical satellite images have already been acquired for more than a decade, tools for automated extraction of road networks from these images are still rare. One consequence of this is the need for manual interaction which, in turn, is time and cost intensive. In this paper, a multi-stage approach is proposed which integrates structural, spectral, textural, as well as contextual information of objects to extract road networks from very high resolution satellite images. Highlights of the approach are a novel linearity index employed for the discrimination of elongated road segments from other objects and customized tensor voting which is utilized to fill missing parts of the network. Experiments are carried out with different datasets. Comparison of the achieved results with the results of seven state-of-the-art methods demonstrated the efficiency of the proposed approach.

Graphical Abstract

1. Introduction

Automated extraction of man-made objects from aerial and satellite imagery has been explored for decades. Starting points for further research arose over time and have been influenced by many factors, such as the availability of very high resolution (VHR) optical satellite imagery. Increasing demands for updating geospatial databases call for the development of more advanced tools to minimize the human interaction in urban feature extraction and identification [1,2]. Road networks not only have vast usage in many applications, such as urban design, navigation, change detection, image registration [3], transportation applications [4,5], personal navigation systems, or vehicle routing [6], but also incorporate a vital component in most GIS systems.
Due to the variety of methods in the literature, a strict categorization of all approaches dealing with road extraction methods is a difficult task [7]. For the sake of conciseness, we confine our literature review to the recent state-of-the-art approaches in road extraction from VHR images. For a detailed literature review on road extraction researches, which have been carried out before 2003, the reader is referred to Mena et al. [7]. In 2006, Mayer et al. [8] compiled a EuroSDR test and compared results of different approaches for automatic road extraction from VHR satellite and aerial images. Furthermore, comprehensive reviews of techniques for linear features extraction and road extraction are presented by Quackenbush [9] and Das et al. [10].
Das et al. [10] introduced a hierarchical multi stage approach that integrates edge and region information of road segments. The edge map is generated using a “dominant singular measure” and multi-scale 1D Canny edge detector. In addition, road segments are classified utilizing a probabilistic support vector machine (PSVM). Edges and regions of road segments are merged using a “Constraint Satisfaction Neural Network with Complimentary Information Integration”. To improve the quality of extracted road network, false segments are reduced during a refinement step. The authors provided most parts of their dataset and results via [11] which, afterwards, have been used in several studies [12,13,14,15,16] and serve as a basis for evaluation and comparison of related approaches.
Grote et al. [17] presented a region-based method for extraction of roads. In a normalized cut segmentation, they consider knowledge about the appearance of roads in the image via the weights of graph edges. In the next step, object grouping with color and edge criteria decreases oversegmentation of the image. Finally, road parts are extracted using shape and radiometric similarities. For the experiments, high-resolution color infrared images, as well as digital surface models (DSM), are used. The authors concluded that whereas the method can still produce reasonable results without a DSM, using the DSM improves the extraction considerably, as expected.
Nikfar et al. [18] designed an object-based framework for road detection from IKONOS imagery based on multi-resolution segmentation and a Type-2 fuzzy logic system. They used a genetic algorithm to tune the implemented fuzzy system. The presented method produced impressive results with different datasets. However, it seems that incorporating more proper shape features can improve the detection result. Moreover, as concluded by the authors, employing a gap detection algorithm could decrease the missing parts of the road network.
Chaudhuri et al. [14] proposed a semi-automated multistage framework which enhances the image based on a customized directional morphological filter. On this enhanced image they perform a directional segmentation which depends on the homogeneity of two road seed templates of different directions. A set of post-processing steps, including hole-filling, pruning, and segment linking, are then applied in order to improve the quality of results. The visual inspection of experimental results signifies the efficiency of the method, although a quantitative assessment of the results is missing and hinders further analysis.
Sun and Messinger [19] developed an automatic knowledge-based system for road network extraction from multispectral images. Important edges are enhanced by exploiting a trilateral filter. A spectral flood-filling technique based on the spectral angle mapper and the Euclidean distance criteria is used to generate a binary asphalt image. This image inevitably contains objects like parking lots and building roofs that are similar to the road surface. Next, template-matching, followed by pruning, reduces these false alarms. The system output contains the extracted road centerlines, as well as width and orientation of road segments.
During the past few years, members of the Department of Land Surveying and Geo-informatics of the Hong Kong Polytechnic University reported many research output on the topic of road extraction from VHR images. Miao et al. [13] integrated shape and spectral features to extract candidate road segments from a binary map obtained from edge filtering segmentation. For accurate centerline extraction from road segments multivariate adaptive regression splines (MARS) is utilized to avoid short spurs that keep the centerline smoothness. Shi et al. [3] presented a two-stage framework to extract main roads by integrating spectral-spatial classification and shape features. Miao et al. [20] presented a semi-automatic object-based method which improves the discrimination of linear features using object-based Frangi’s filter (OFF) and object-based shape filter (OSF) and detects road segments exploiting support vector machine (SVM) classification. In another study reported by Miao et al. [21], tensor voting, principal curves, and the geodesic method are integrated to extract road centerlines. In this research, first-order tensor voting is utilized in order to generate feature points, which are then projected onto principal curves using a subspace constrained mean shift. Then the geodesic method is used to create the central line by linking the projected feature points. In a recent study [22], an information fusion-based approach is proposed. This approach produces two binary road maps using an expectation maximization clustering and linearness filter. Next, centerlines of both road maps are extracted utilizing a modified RANdom SAmple Consensus (RANSAC) method. Then, a decision-level fusion (union of the results of both detection methods) and some regularization rules are exploited to generate the final road centerlines.
Yin et al. [23] extended an ant colony optimization (ACO) algorithm which integrates some geometrical features of segmented objects and geometrical characteristics of extracted edges. Considering the fact that usually most of objects in road contexts share the direction of a road which they are related to, the proposed system injects the information, which exhibits the direction of extracted features, into the decision rule of the ant colony algorithm. To the best of our knowledge Zarrinpanjeh et al. [24] is the first research work which exploited ACO for urban road map updating from high-resolution satellite imagery. The authors proposed a distributed framework which verifies the existing road map and extracts new roads through seed region growing segmentation and supervised classification and groups the results of these steps.
Wang et al. [15] proposed a semi-automatic neural-dynamic tracking framework which consists of two processing steps: the training step and the tracking step and is based on deep convolutional neural networks to recognize the pattern of input data and a finite state machine to translate the recognized patterns to states and control the behavior of the tracker.
Ameri and Valadan [25] motivated by research of Doucette et al. [26], introduced a road vectorization method based on dynamic clustering. This approach utilizes a swarm-based optimization technique that relies on a modified cost function. Afterwards, results are enhanced using some morphological filters. Finally, a minimum spanning tree is used to construct a road network.
Wegner et al. [6] presented a probabilistic representation of network structures to extract road networks from aerial images via a recover-and-select strategy. At the cost of many false positives, a large over-complete set of potential candidate paths is generated. Next, considering a feature vector, false positives are pruned from the detected paths by minimizing a global higher-order conditional random field energy.
Poullis et al. [27] presented a semi-automatic system to extract roads from VHR images or Light Detection and Ranging (LIDAR) data that benefits from capabilities of both perceptual organization and graph cut segmentation. During the encoding stage of a tensor voting process, a set of Gabor filter response images are tensorized. Next, in voting, the tensor field is organized. With a threshold-free classification, curves and junctions are extracted. By an orientation-based segmentation using graph-cuts parameters of a road model are used to discriminate road segments from other curves. Finally, road centerlines are extracted by using a set of Gaussian-based filters followed by a snake-based tracking procedure. Poullis ameliorated their system by introducing another framework called “Tensor Cuts” [12]. In this new framework, labels are encoded as tensors to eliminate the need for a pre-classification of curve pixels.
Roads and objects in medical imaging, such as blood vessels or axons and dendrites in neurons, have similar structure and properties. This resulted in applicability of many proposed approaches in both fields. One of the recent approaches proposed by Sironi et al. [28] considers the extraction of centerlines as a regression problem. The system computes the distance to the closest centerline exploiting a multistage regressors training process and then finds the centerlines and their scale by applying local maxima suppression on regressors. Impressive results are reported on gray-scale aerial images from sub-urban areas with just some false negatives at the end of roads and at small linear segments at the borders of the image.
In VHR images roads mainly appear as elongated homogeneous regions and linear characteristics of roads are not very salient [29]. With the increasing availability of VHR satellite images the general trend in recent years has been towards conducting object (region)-based methods as shown by the reviewed literature. Another trend is exploiting both spectral and spatial information of objects. However, in urban areas, spectral and spatial characteristics of non-road structures can be similar to roads. Therefore, some studies utilize textural and contextual information to achieve a more accurate road network. Moreover, many approaches perform a post-processing step, such as a pruning to increase the correctness. In cases where adjacent objects, like trees, occlude the road surface or cast shadows on it, road detection often fails, which results in gaps between detected road parts. Therefore, some methods fill these discontinuities in road networks in order to increase the completeness and overall quality of the extracted roads.
In road extraction from VHR images significant progress has been achieved by the remote sensing and photogrammetry community, e.g., [17,18,20,25,30], and by computer science researchers, e.g., [1,10,12,14,31]. Nevertheless, the ultimate goal of designing and implementing a reliable automatic road extraction system is still far-off [6,12,20,21,29].
This paper is organized as follows: after this literature review of recent state-of-the-art road extraction approaches, Section 2 introduces our novel multi stage object-based approach for road extraction. Moreover, fundamental details of methods of our approach will be described. Experimental results obtained from our approach on three different datasets, as well as results of altogether seven other methods are reported and compared in Section 3.

2. Proposed Approach and Methods

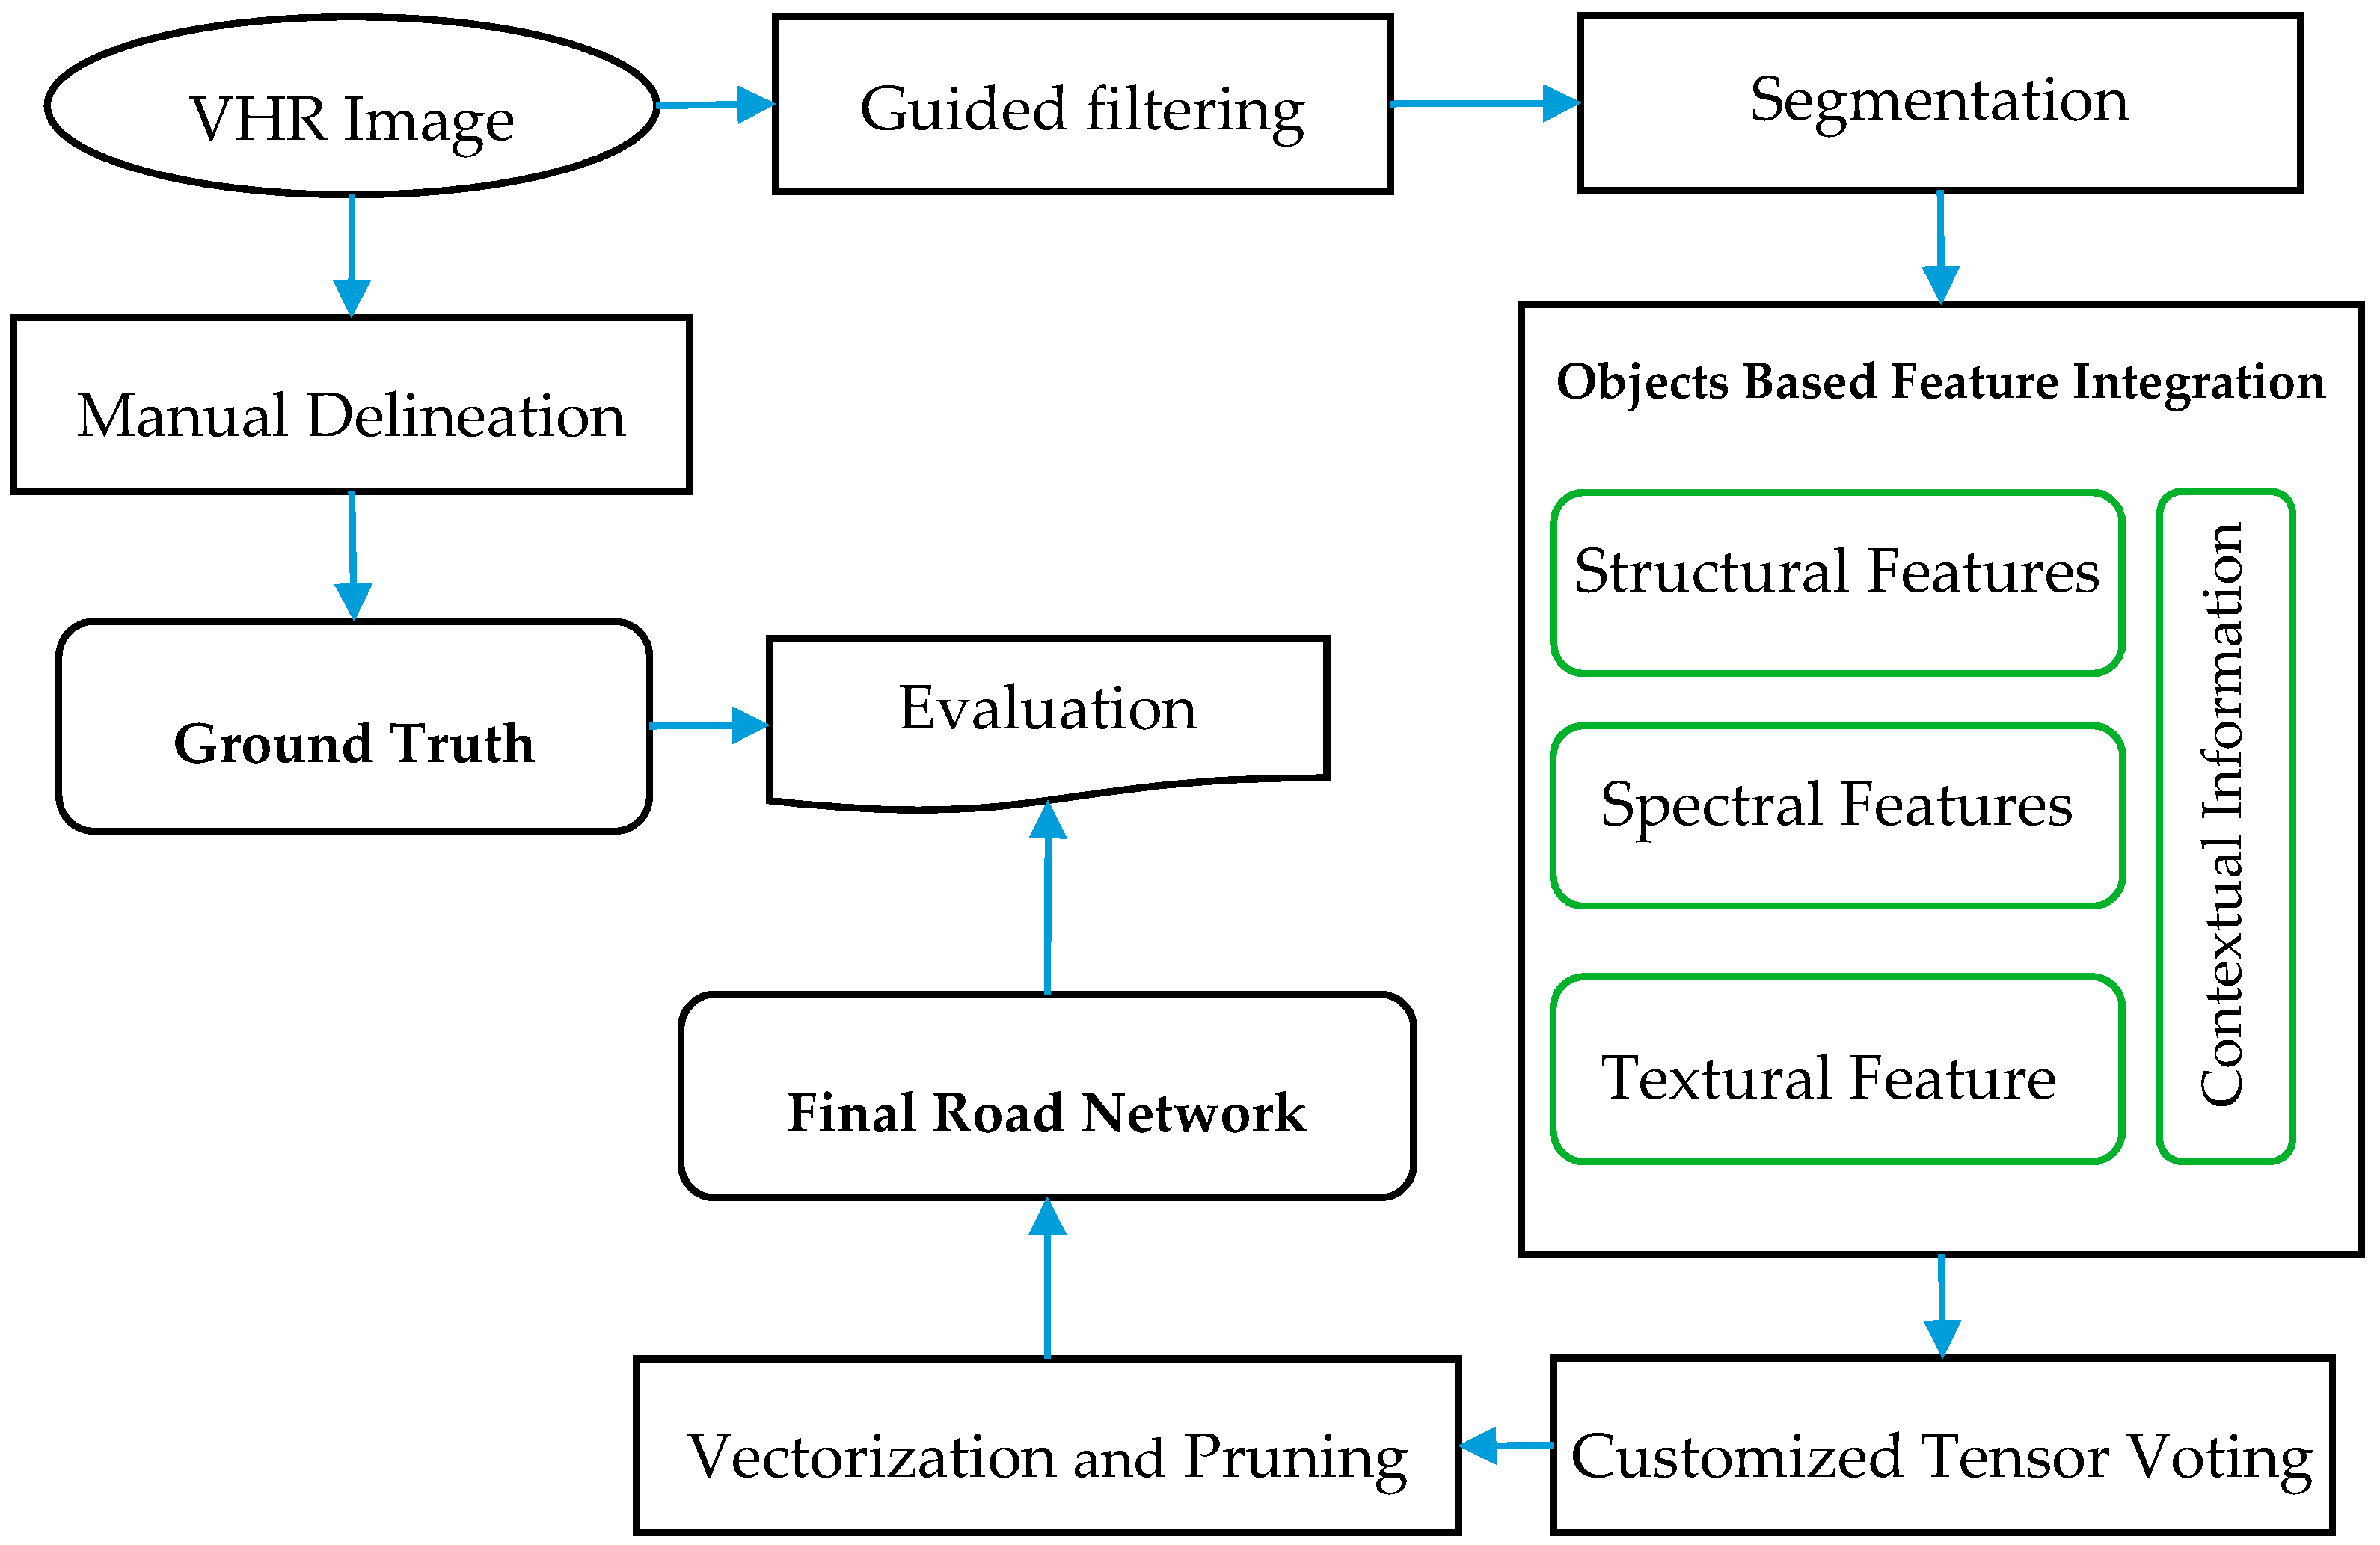
The proposed approach for road network extraction from VHR remotely sensed images based on context aware object based feature integration and customized tensor voting is depicted in Figure 1.
As it can be seen from Figure 1, first, VHR remotely sensed imagery is smoothed utilizing “guided filter” to reduce road surface heterogeneity. Next, the filtered image is segmented using multi-resolution segmentation in order to generate image objects. A novel object linearity index is introduced as a structural descriptor of the objects. Structural, spectral, textural as well as contextual information of objects are integrated to extract the road binary map. Afterwards, Customized Tensor Voting (CTV) fills missing parts of the network. Finally, after road map vectorization, small spurs are eliminated in vector space. To assess the quality of the extracted road network, the final road network is compared with ground truth data utilizing three evaluation criteria. In our approach, no ancillary data, such as DSM or vector data provided by road databases is employed in order to avoid malfunction of the process if this kind of information is not available.

2.1. Guided Filter

It is well known that the appearance of objects in remote sensing images is closely related to the resolution of the images. The higher the resolution, the more details are visible. By looking at roads in VHR images, say at 1 m ground resolution, cars, trees that occlude parts of a road, and beyond that noise and many other small details are visible, for example, pavement color changes that originate from road surface repairs. Therefore, a smoothing step is necessary to reduce the destructive effect of these small obstacles on segmentation and thereupon on road extraction quality. The guided filter method [32] offers the possibility to suppress details while, at the same time, preserving the edges by transferring the structures of the guidance image to the filtered output image.
According to [32] a general linear translation-invariant filter that utilizes additional information from a given guidance image ( I ) can be formulated as:
q i = j W i j ( I ) p j
where p and q are images before and after filtering, i and j are pixel indices, and the filter kernel W i j of the guided filter is defined as:
W i j ( I ) = 1 | ω | 2 k : ( i , j ) ω k ( 1 + ( I i μ k ) ( I j μ k ) σ k 2 + τ )
where ω k is a square window centered at the pixel k , | ω | is the number of pixels in ω k , μ k and σ k 2 are the mean and variance of I in ω k , and τ is a regularization parameter which controls the degree of smoothness. It should also be mentioned that we use the VHR image itself as the guidance image. The main assumption of the guided filter is that the filter response is a local linear transformation of I [32]:
q i = a k I i + b k , i ω k
where a k and b k are two coefficients computed as:
a k = 1 | ω | i ω k I i p i μ k p ¯ k σ k 2 + τ   and   b k = p ¯ k a k μ k
where p ¯ k is the average of p in ω k . Then, the filtering output at each pixel can be calculated as:
q i = a ¯ i I i + b ¯ i
The quality of this process can strongly affect the effectiveness of the segmentation and the whole road extraction process.

2.2. Segmentation

Image segmentation is defined as a procedure which completely partitions a scene into disjoint homogenous regions of pixels such that each region is homogenous according to some coherent features (color, shape, and texture), whereas the union of two adjacent regions is not homogenous [29,33,34,35]. Major categories of current state-of-the-art segmentation methods are: (1) pixel-based; (2) edge-based; (3) region-based; and (4) hybrid image segmentation [34,36,37,38].
In this paper, the multi-resolution segmentation approach introduced by Baatz and Schäpe [39] is utilized for image segmentation which considers objects as the smallest meaningful processing entities. This reduces the salt-and-pepper effects which are typical for pixel based classification methods [20,40] and exploits the full information, both of the physics of the sensor measurements and the context within the scene [41].
Multi-resolution segmentation is a bottom up region-merging technique starting with one-pixel objects. In each merging step, the algorithm tries to minimize the fusion factor of resulting objects, which is defined as:
f = W c o l o r d h c o l o r + W s h a p e d h s h a p e
where W c o l o r and W s h a p e are the weight of spectral (color) heterogeneity and weight of shape heterogeneity, respectively, and d h c o l o r and d h s h a p e are the difference in spectral heterogeneity and difference in shape heterogeneity, respectively. It should be noted that, there are some researches on optimizing the multi resolution segmentation parameters [42,43]. However, optimum segmentation is still an open research area. The interested reader can find the details of the algorithm in [39,41,42,43]. A successful implementation of this concept is the Trimble eCognition Developer software package, which catalyzed a boost of its exploitation in considerable research works [18,35,40,44,45].

2.3. Object-Based Feature Integration

After segmentation, each pixel is assigned to an object. In order to distinguish road segments from other segments their properties should be taken into account. The most dominant characteristics of roads in VHR images include: (1) roads are mostly elongated structures with bounded width [1,46,47]; (2) roads do not appear as a small segment or patch [10,13]; (3) usually the road surface is at least locally homogeneous [1,18,35]; and (4) roads have a limited and smoothly changing local curvature [48,49].
Integration of these characteristic of roads can seldom be found at other objects in VHR images. Therefore, these four characteristics define our basic model of a road object.
To address the first characteristic, we propose a novel linearity index called the skeleton-based object linearity index (SOLI) to discriminate elongated road-like objects from other objects.
The skeleton-based object linearity index is defined for each object as:
SOLI b = { L s 2 A b i f   D b W R 0 o t h e r w i s e
where b is an object, and L s is the length of the main line of the object’s skeleton. The main line of the object is the main skeleton of the object whose “legs” are refined at the end parts of skeleton (Figure 2c), A b is the area of the object, W R is the width range of all roads in the network that integrate external road-specific knowledge into the index. D b is the maximum object-based distance map value defined as:
D b = m a x ( D p )   ,   p b
where p is the pixel index and D p is the distance map value of each pixel of b .
Employing D b in Equation (7) guarantees that very narrow and long segments like some shadow casts and sidewalks are not further considered because of SOLI values of 0.
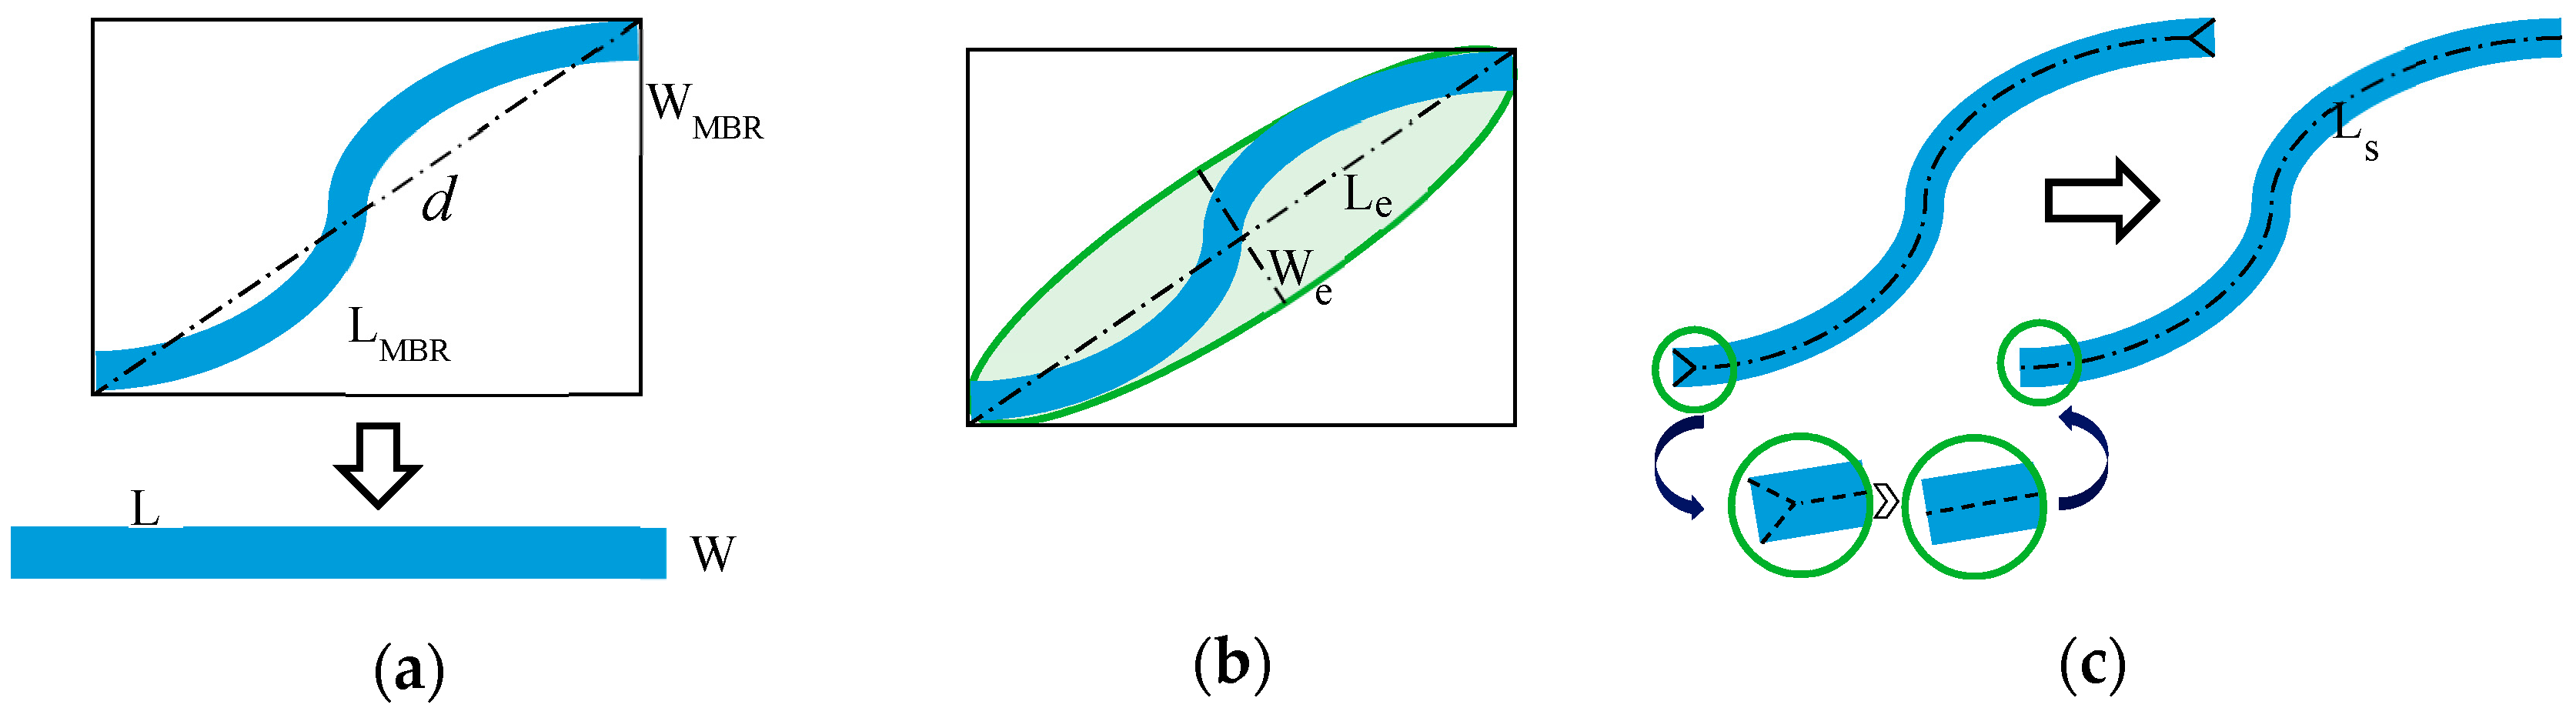
There are similar indices, like Linearity Feature Index (LFI) [13], which uses the diagonal d (Figure 2a) instead of L s and LFIe [50] which uses the length to width ratio L e / W e (illustrated in Figure 2b of an approximating ellipse) for the linearity. The measurement of the length of the object via the skeleton improves the approximation of the real length of the object. Furthermore, SOLI takes advantage of explicit a priori knowledge like that of W R .
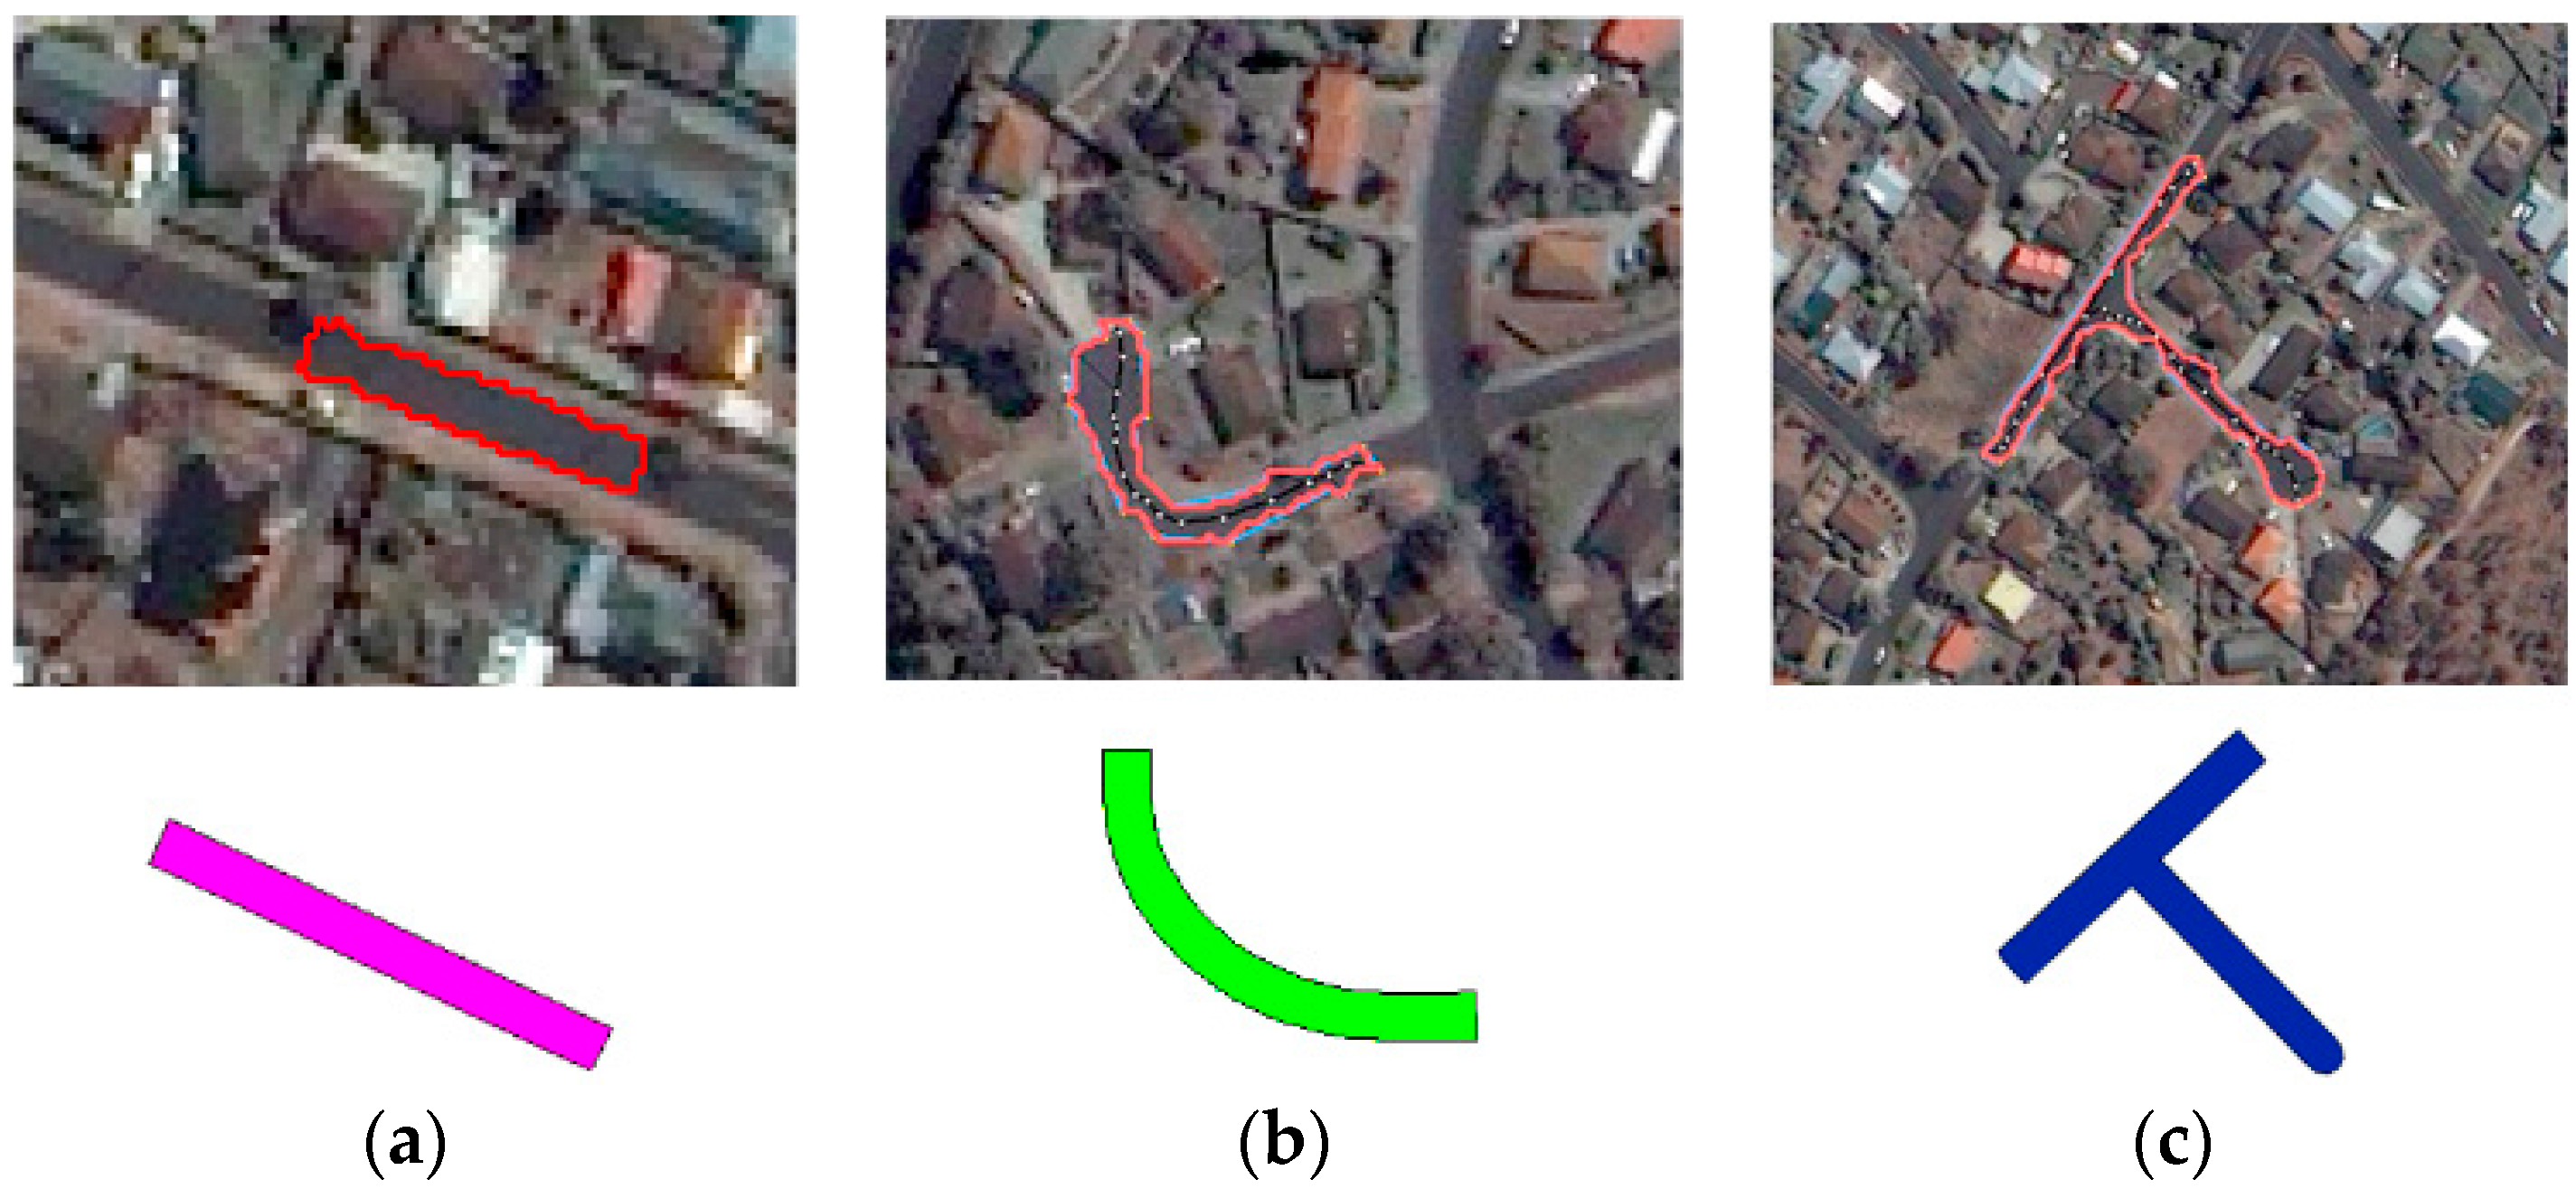
Our experimental results confirm that the proposed index outperforms the LFI and LFIe especially for curved or branched regions. In Figure 3 some examples are depicted which illustrates that, for different objects, the length to width approximation by the SOLI is close to reality.
Considering the definition of different linearity indices (Figure 2), it is obvious that all indices can measure the linearity of the rectangular object in Figure 3a. However, LFI underestimates the linearity of the objects in Figure 3b,c. That is because the diagonal of the minimum bounding box is not a good approximation for the lengths of these objects. Moreover, this underestimation leads to overestimating the width of the object (to keep the area constant) which magnifies the overall inaccuracy in calculating the object’s linearity. LFIe, which uses the axes of the ellipse, is also not a suitable index for curved and branched objects. In most cases, the major axis of the ellipse is smaller than the real length of the curved and branched objects and the minor axis is larger than the real width of these objects. SOLI, which estimates the length of the object by the length of its main skeleton, can efficiently quantify the linearity of these curved and branched objects.
To consider the second characteristic, i.e., a small region, is not likely to be a road segment, area-based filtering [14,25] is employed. Moreover, we add contextual information to avoid the elimination of small road segments which are connected to at least two road segments (detected by SOLI). Those small segments are remaining as potential road objects.
The standard deviation of all pixel values of an object can be used as a measure of homogeneity to take into account the third property in the road model [1,10,51]. We use an adaptive threshold for this measure to take the size of the objects into account. Due to our application i.e., road detection, elongated objects are of more interest, a length-based adaptive threshold is used as:
S T D b ( T · L s )
where S T D b stands for standard deviation of pixel values of the object, T is a constant threshold and L s is same as in Equation (7). Moving the length of the object to the left side of the equation yields standard deviation value weighted by length of each object:
W S T D b = S T D b L s
where W S T D b is the weighted standard deviation of object b in each band and can be used as an efficient measure of homogeneity for objects with different size.
Another feature that is used to measure the homogeneity of the object surface is entropy based on gray level co-occurrence matrix (GLCM). The power of the gray level co-occurrence approach is that it characterizes the spatial interrelationships of the gray levels in an image. The lack of consideration of the shape aspects of the objects is the most important shortcoming of GLCM based processing [52]. However, in our approach road shape properties are modeled with structural features like SOLI. The entropy value for each object ( b ) can be defined as [52]:
E b = i , j P i j l o g P i j
where i and j are the row and column indices, and P is the normalized value in the cell i , j .
The fourth property of the road model demands for small values of both curvature and standard deviation of curvature of the main line of road segments. The curvature of each segment can be evaluated by the directional change of neighboring mainlines of segment [49]. For a non-rectangular shape, the “main line” is actually a polyline. Therefore, the standard deviation of the curvature is evaluated by the standard deviation of the absolute values of the directional changes of the main line parts and it can be expressed as:
S C b = i = 1 k ( a i i = 1 k a i k ) 2 k 1
where a i represents the absolute value of the i th deflection angle of the object’s main line. Considering n as number of line segments of the main line, then k = n 1 .

2.4. Tensor Voting

Medioni et al. [53,54] proposed tensor voting (TV) which generally relies on data communication between image features called tokens and provides an efficient framework for the inference of perceptually salient information. Raw local features which are directly extracted from data (e.g., satellite images) are often noisy and incomplete due to several reasons, such as a change in environmental condition like lighting in imaging, sensor imperfectness, as well as scene complexities, like an abundance of shadows cast and other types of occlusions in real world remotely-sensed images. TV is a non-iterative algorithm for the robust inference of features from noisy and sparse data. According to TV framework, each token can be encoded as a symmetric tensor in a quadratic form and is defined as:
T = [ e 1 e 2 e 3 ] [ λ 1 0 0 0 λ 2 0 0 0 λ 3 ] [ e 1 T e 2 T e 3 T ]
where λ i are the eigenvalues of tensor in descending order and e i 
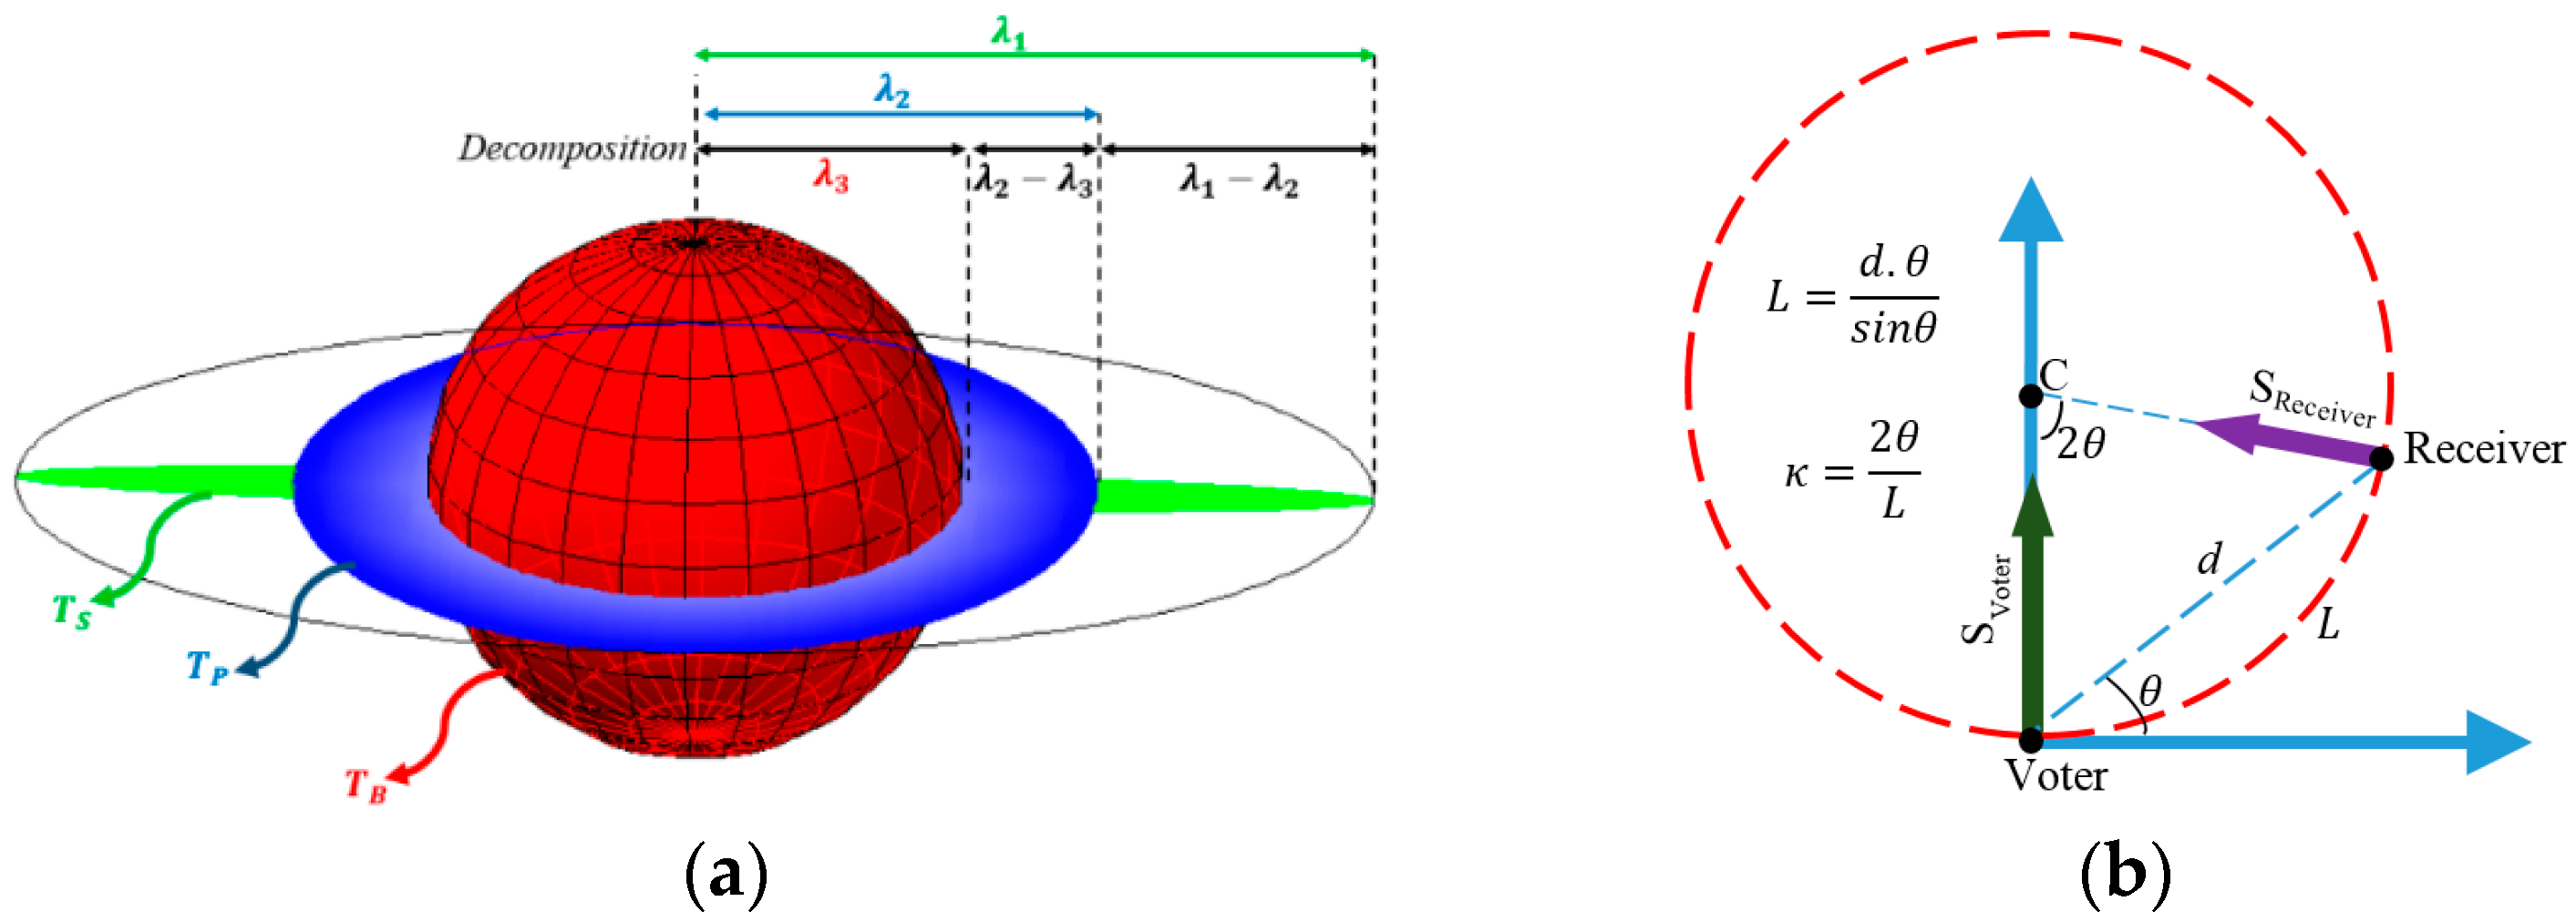
are their corresponding eigenvectors. Such a tensor can be graphically depicted as an ellipse in 2-D, and an ellipsoid in 3-D. Figure 4a illustrates representation of tensors of second order in 3-D and provides additional interpretations of the eigen-decomposition. Here, the shape of the tensor defines the type of the captured information and the associated size represents the saliency [53].
By applying spectrum theorem which states that any tensor can be expressed as a linear combination of ball, plate and stick tensors, T can be decomposed [53]:
T = T S + T P + T B = ( λ 1 λ 2 ) e 1 e 1 T + ( λ 2 λ 3 ) ( e 1 e 1 T + e 2 e 2 T ) + λ 3 ( e 1 e 1 T + e 2 e 2 T + e 3 e 3 T )
Medioni et al. [53] expressed the 2-D stick tensor as the fundamental voting field and represented that all other voting fields can be derived from the 2-D stick tensor. Tokens represented in tensor space obtained from encoding process (voters) will propagate their information and communicate with other tokens during a voting process which is illustrated in Figure 4b. The strength of the vote at receiver site is expressed by a so-called decay function:
D F ( L , k ) = e ( L 2 + c k 2 ) σ 2
where L is the path length, k is the curvature of the path, σ is the scale of voting which is the only free and data-dependent parameter of the algorithm and determines the range within which tokens can influence each other and c is a parameter which is a function of σ and controls the relative weight of path length and curvature [57], and is defined as:
c = 16 ( σ 1 ) log ( 0.1 ) π 2
After the pixels have been encoded with tensors, the information they contain is subsequently propagated to their neighbors. Dense tensor maps, which are generated after voting stage, would be used as the input to an extremal feature extraction algorithm in order to extract the connected road map.
Tensor voting as a very efficient and multi-purpose framework, formulates a number of computer vision problems as a perceptual organization approach in a unified way, with minor problem-specific adaptations [57]. Nevertheless, some issues, such as its high execution time due to considerable stages of numerical integration, limited its applicability in many fields [55]. Different modifications have been proposed to tackle the time complexity of TV. Generally, most of these propositions try to find a closed solution for the problem [58], which was proven incorrect in [59], or optimizing the calculations of the plate and ball voting fields as the most time consuming parts of TV [56]. Therefore, applying TV to road gap filling requires further purpose-dependent customization.
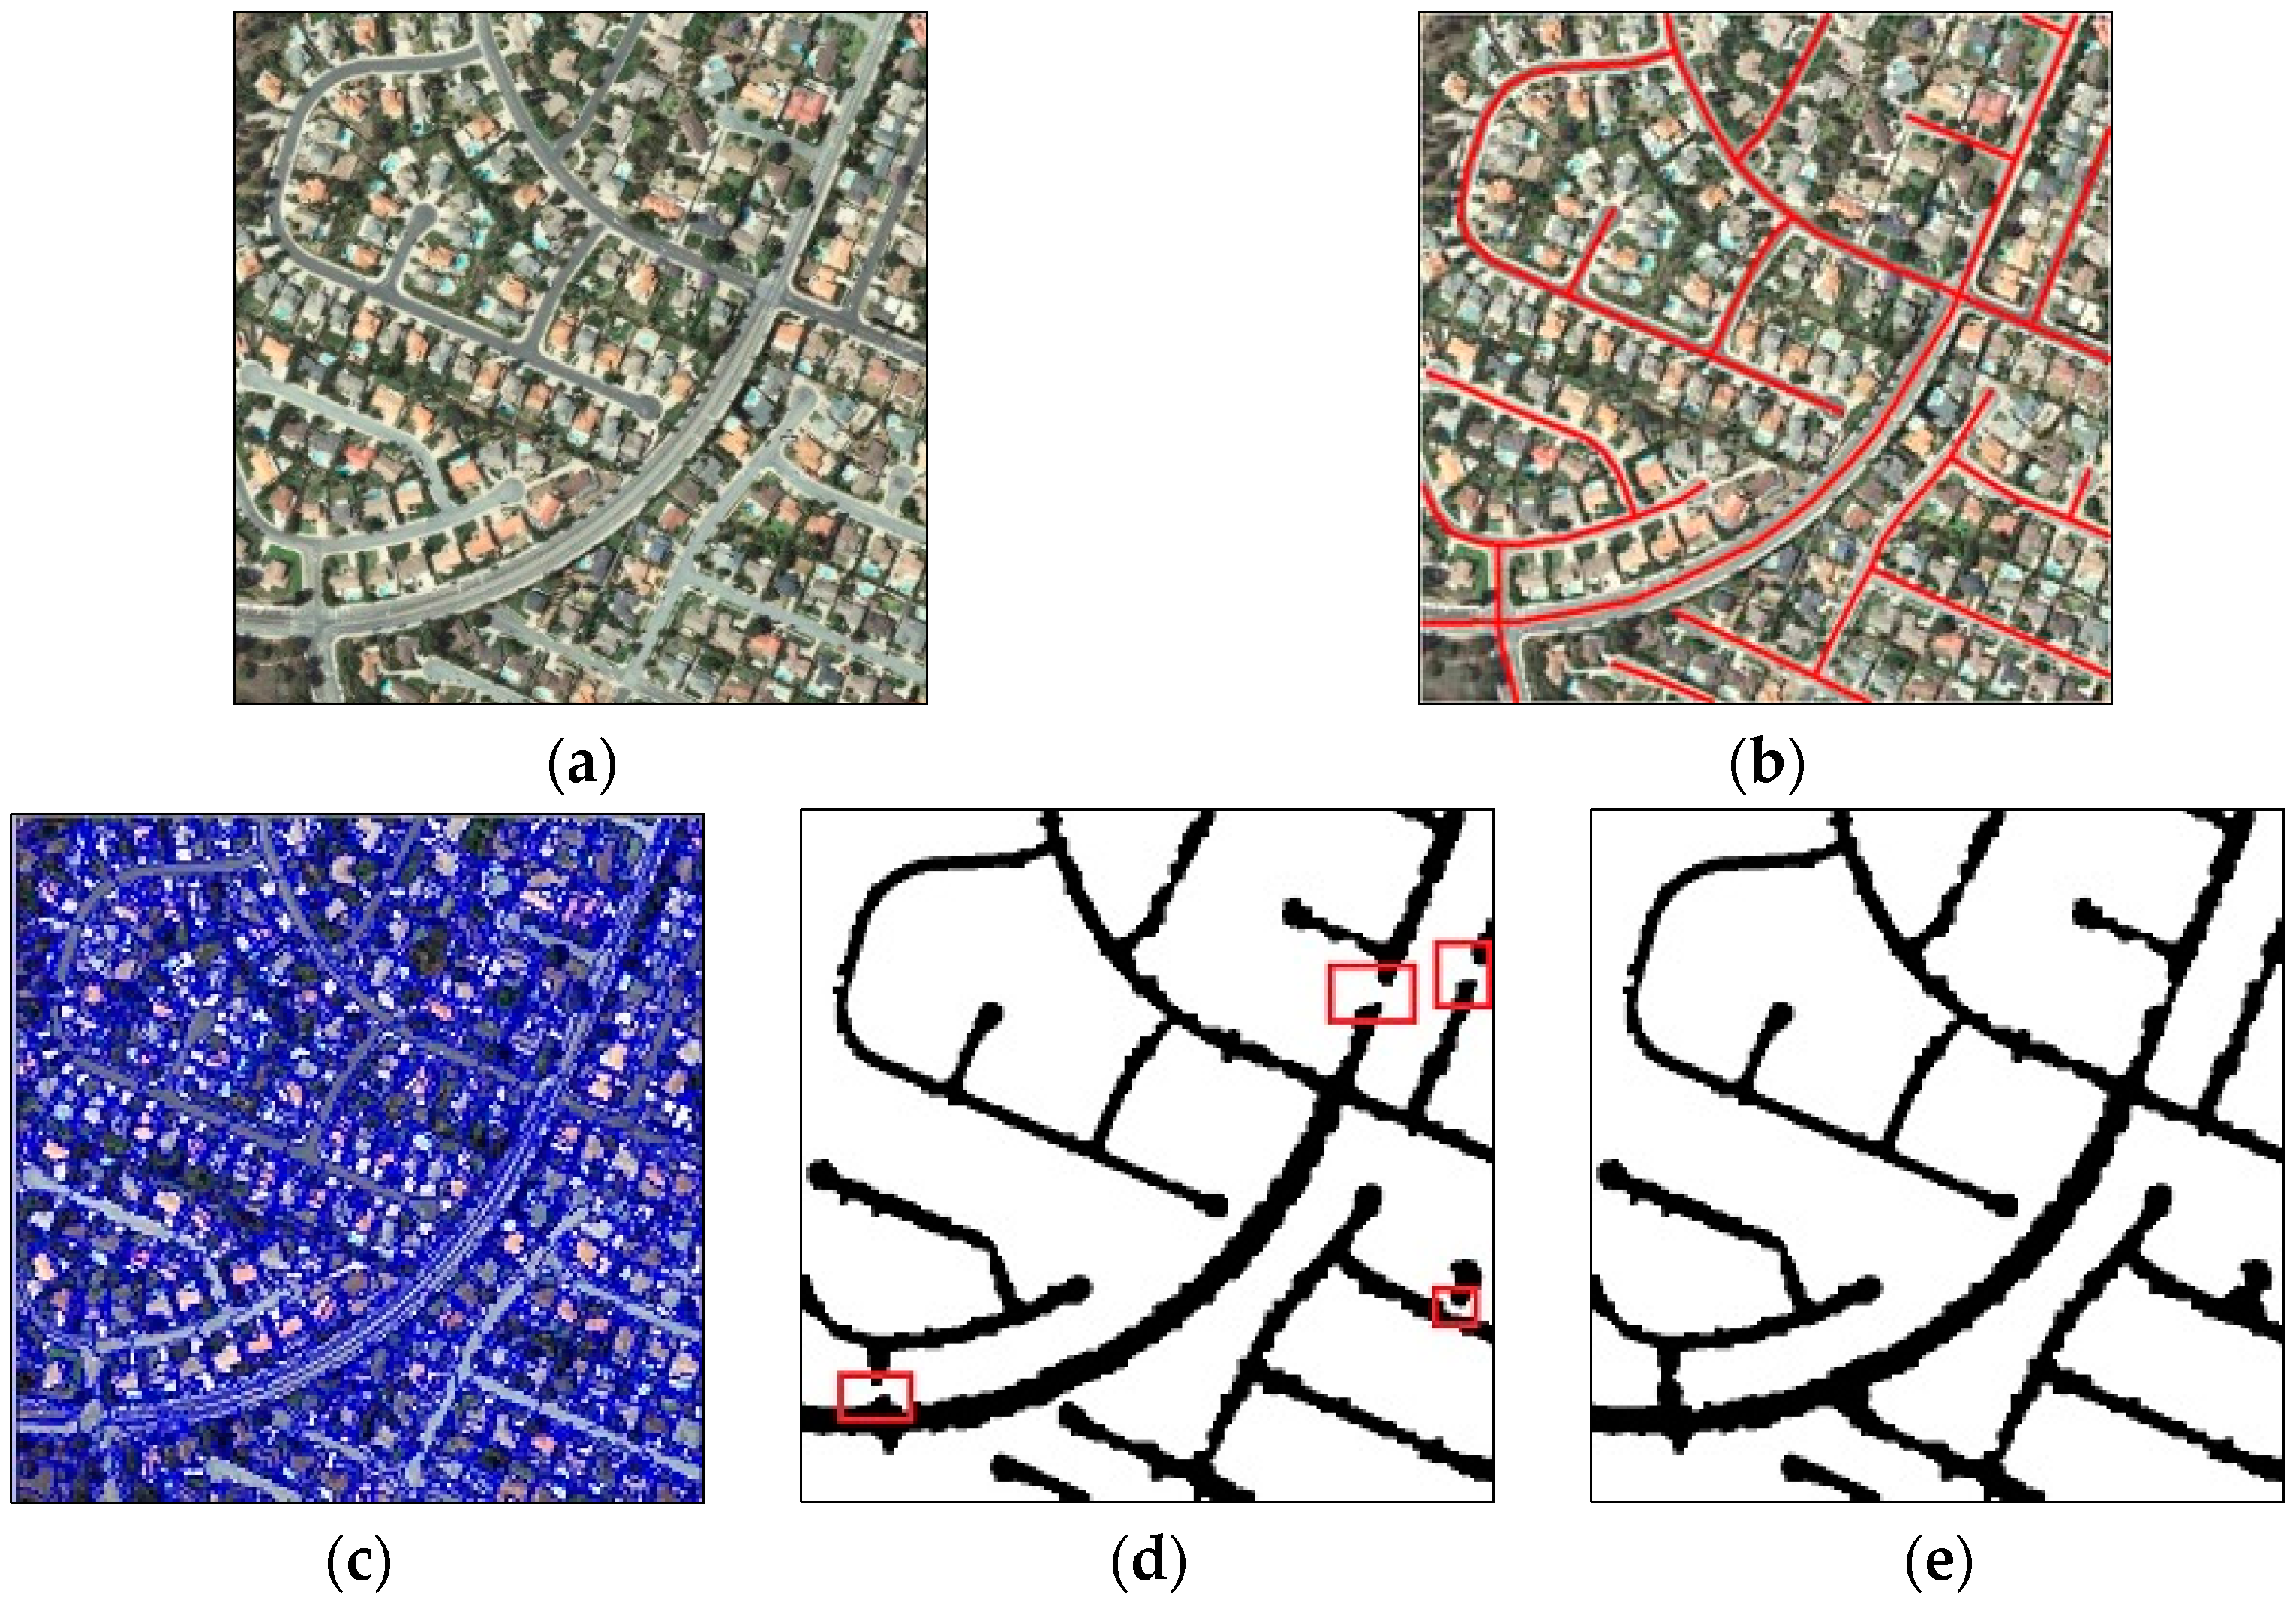
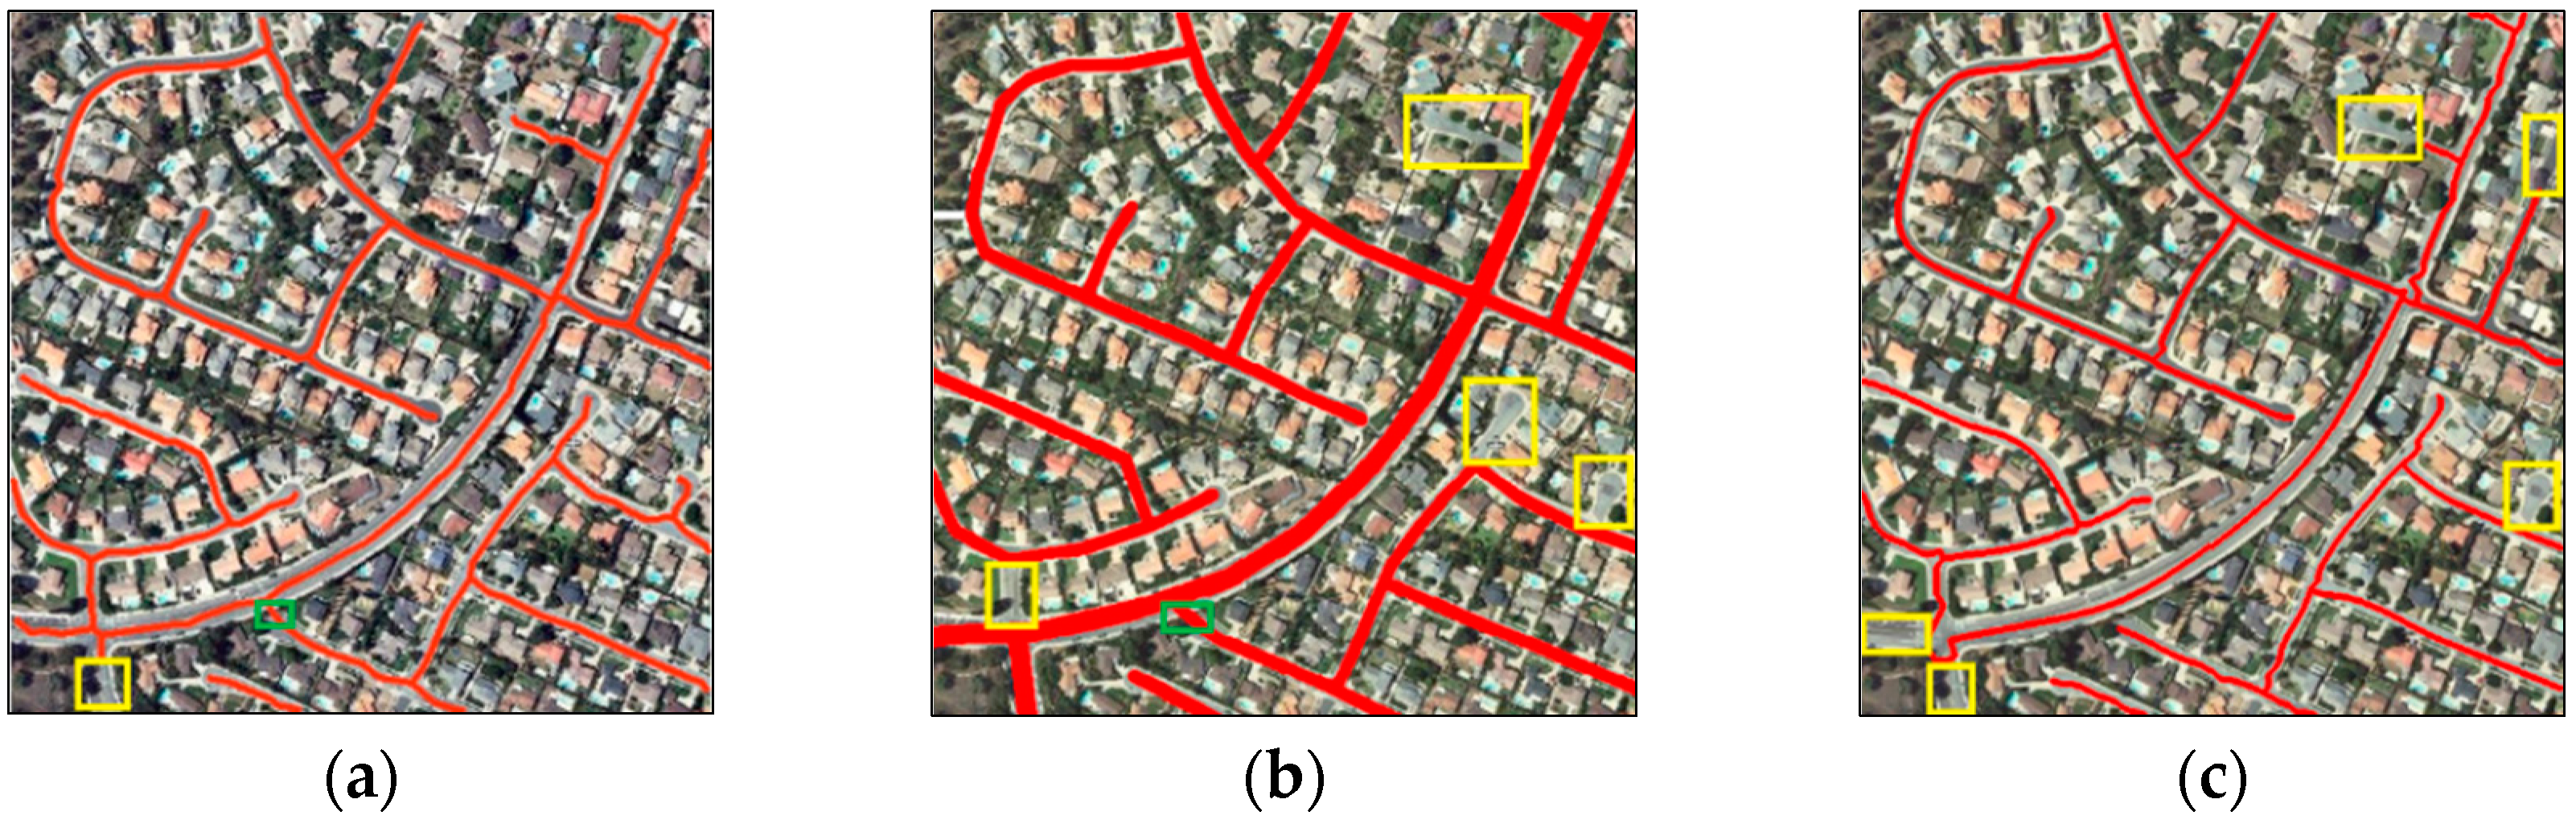
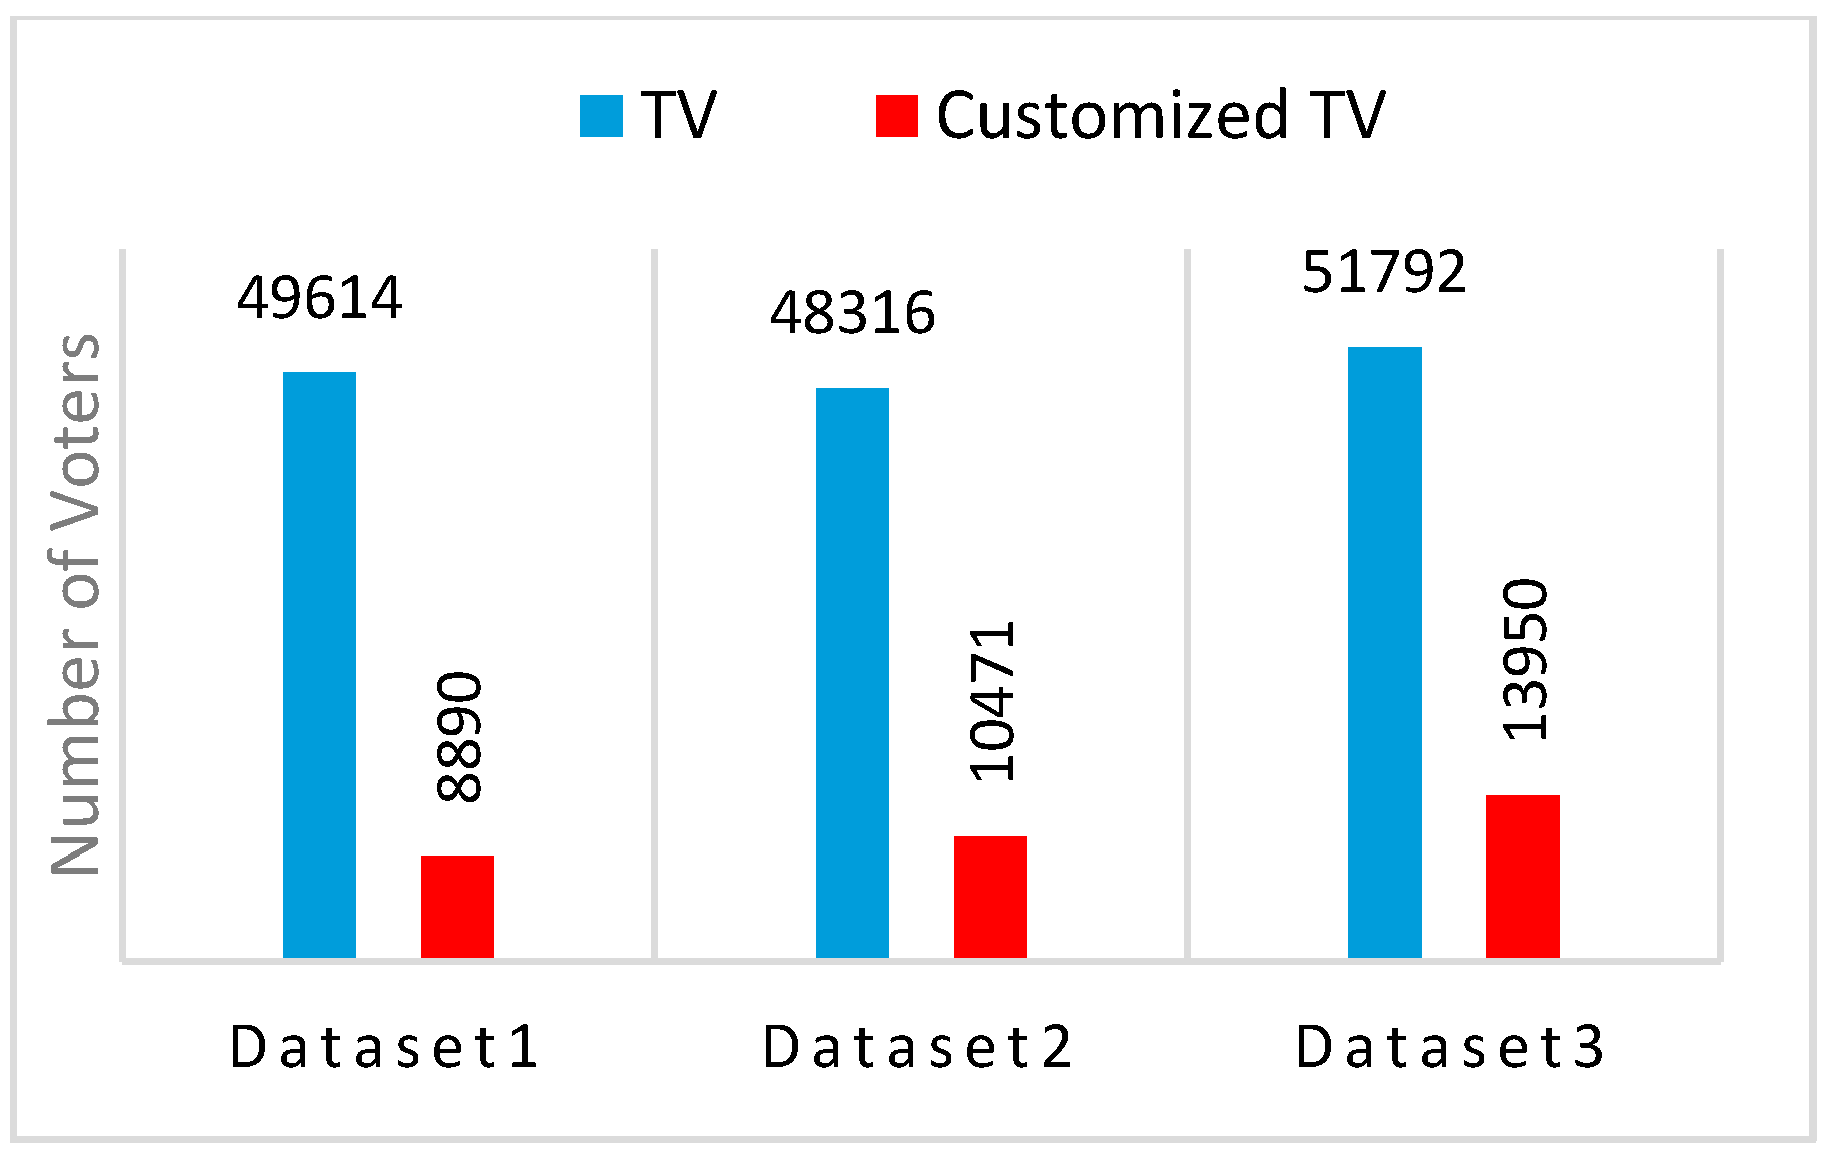
In this paper, we customized TV in order to suit our goal i.e., connected components-based road gap filling. This customization consists of: (1) eliminating voters which are inside the road region and using just those voters which are located on the boundary of the binary road map in the voting process; (2) changing the propagation angular limit from π/4 to π/8. The former step in our customization not only reduces the computation time dramatically, but also has no destructive effect on results. The later customization will avoid undesired shape artifacts in filled areas. It is worth mentioning that restricting the angular vote propagation has no effect on the ball voting field and just makes the stick voting cone narrower, which has no considerable disturbing effect on road gap filling due to local linearity and curvature limitation of the roads.

2.5. Vectorization and Pruning

For centerline extraction from enhanced road binary map, a skeletonization approach can be employed which is based on a thinning algorithm. For most applications, a road map skeleton has far more points than necessary to represent roads network [35]. Furthermore, thinning may result in some spurs. Shi [60] conducted a survey of the literature on line simplification algorithms and their evaluation. After comparing shape and displacement measures for the most popular simplification methods, it was concluded that the Douglas-Peucker algorithm is the most accurate one. The Douglas-Peucker algorithm not only decreases the number of nodes but also retains the similarity of the simplified road shape as close as possible to the original one and it ensures that the simplified road curve is no worse than a specified tolerance. After vectorization, further processing, such as efficient pruning in vector space is possible [35].
To remove spurs of the centerlines caused, for example, by segmentation leakage or existence of attached spectrally-similar objects to the road network like driveways, we employed a pruning step on vector road data. Boundary fluctuations may result in some extraneous skeleton branches. We consider as an extraneous branch a skeleton segment for which only one of its endpoints is connected to another segment and has a length smaller than the average width of the roads. A contextual constraint is also employed to avoid removing short lines which are part of the main line of the network. Those small branches whose direction slightly differs from the direction of the last part of the connected road centerline segments are not removed.

2.6. Evaluation Metrics

In this research, three popular evaluation metrics defined by Wiedemann et al. [61,62] will be adopted. These metrics include completeness, correctness, and quality. In order to calculate the completeness, a buffer with a specified width is built around each segment of the extracted road centerline. All reference lines inside the buffer zone are called “matched reference”. The completeness is the percentage of the reference network that lies within the buffer zone around the extracted data and is defined as follows:
C o m p l e t e n e s s =   lenght of matched reference   length of reference × 100
In order to calculate the correctness, a buffer is constructed around each segment of the reference data. All extracted road centerlines that are inside the buffer zone are called “matched extraction”. The correctness is the percentage of the extracted data which lie within the buffer around the reference network, and is defined as follows:
C o r r e c t n e s s =   lenght of matched extraction   lenght of extraction × 100
The Quality can be calculated as:
Q u a l i t y =   lenght of matched extraction   lenght of extraction + length of unmatched reference × 100
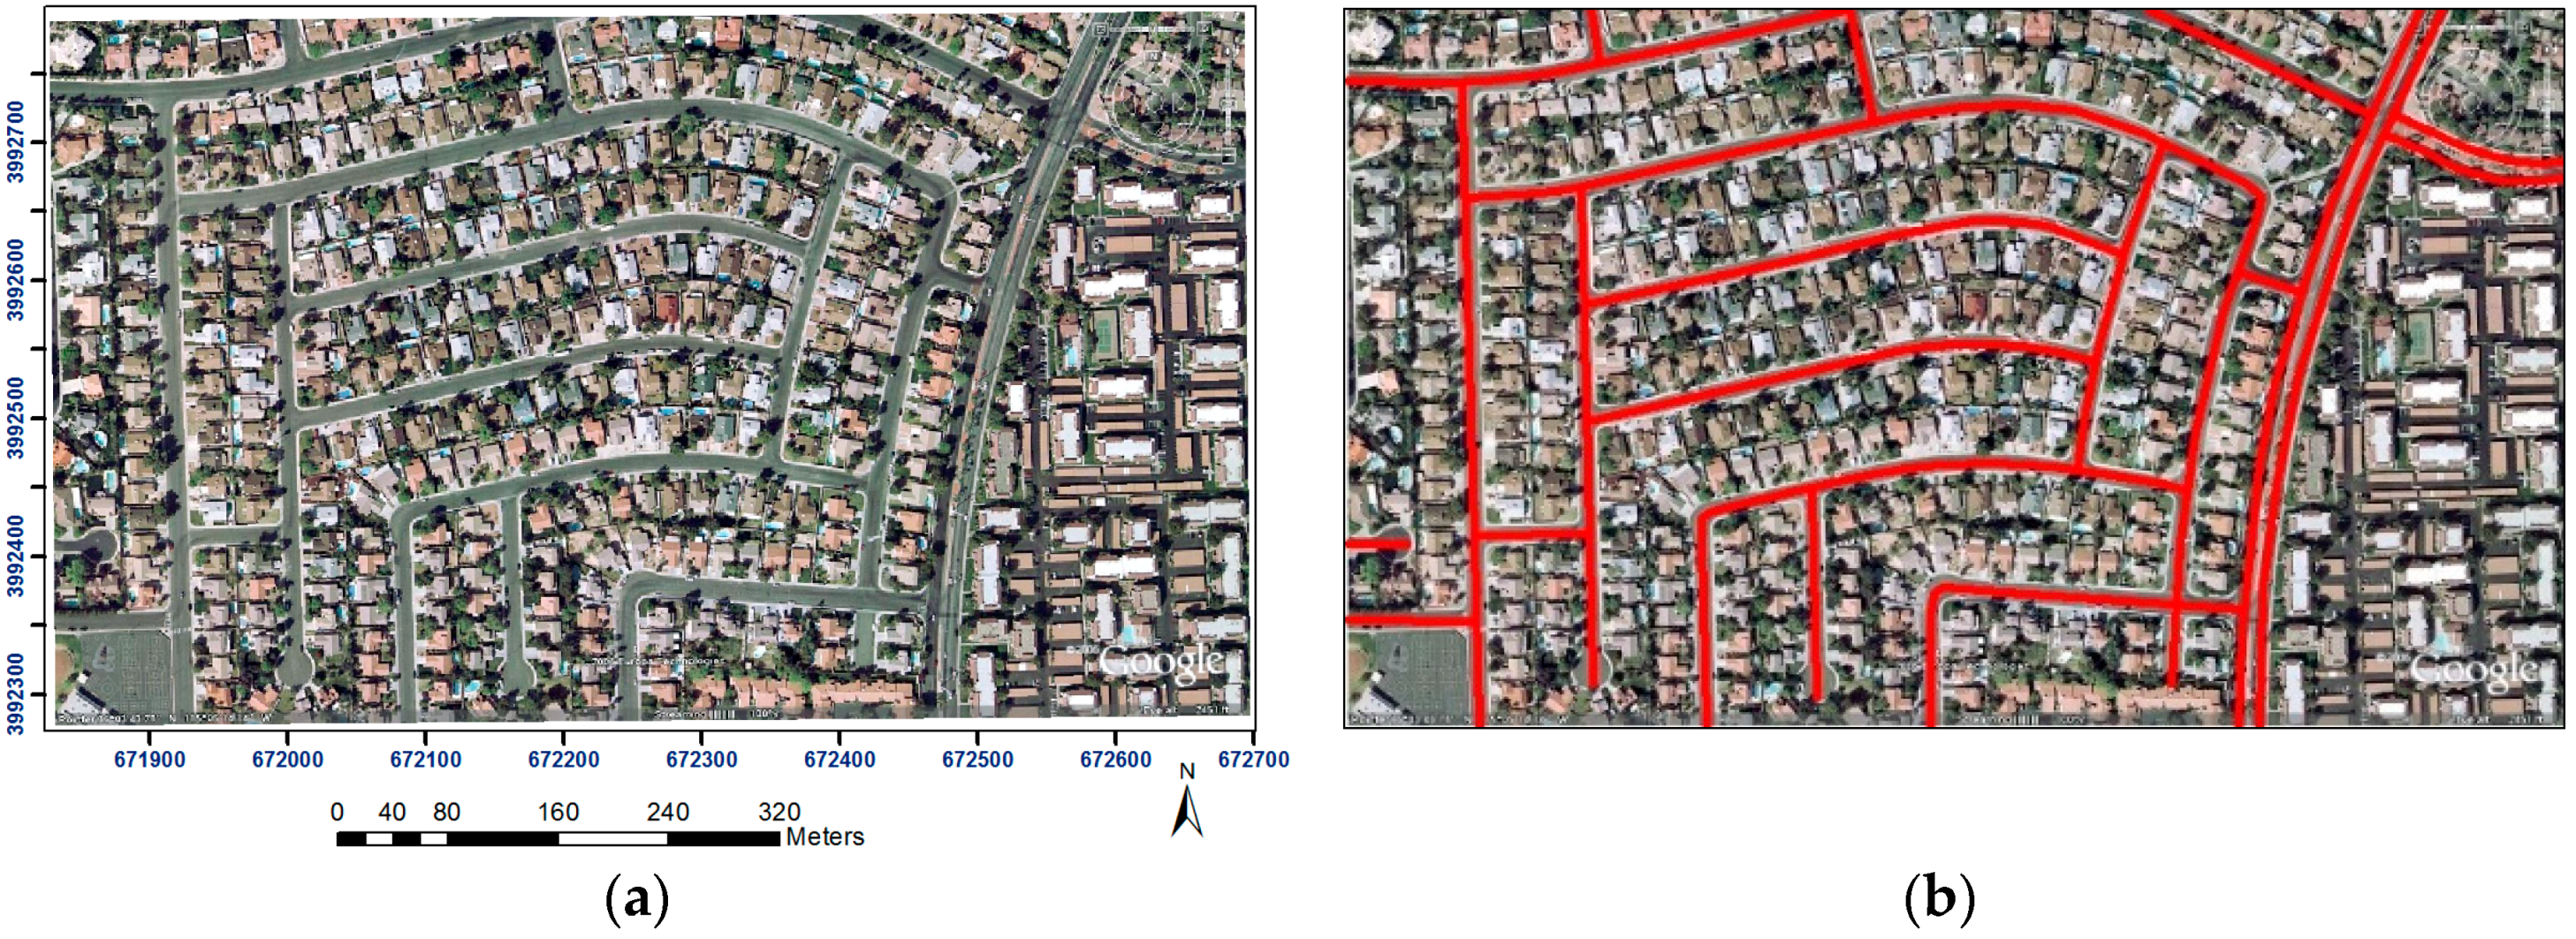
In our study, no geographical database for the road network was available. Thus, reference road networks are delineated manually from the images.

3. Experimental Results and Discussion

In order to assess the performance of our approach for extracting the road centerline, we mainly conduct three experiments with three different data sets. Furthermore, we compare our results with the published results of altogether seven state-of-the-art methods.

3.1. First Experiment

For the first experiment, a high-resolution image was downloaded from [11]. This is one of the images of a road dataset which Das, et al. [10] made publicly available. It is a part of an urban area from the developed countries category of this dataset. The selected part of the scene has 512 × 512 pixels, with a “nominal” spatial resolution of 1 m and three spectral bands. With “nominal”, we emphasize that this data originates from screen capturing of a Wikimapia image [10,13,15] and the original resolution of the recorded image might have been different. The image of the first dataset and its ground truth is depicted in Figure 5a,b, respectively. Frequent existence of dead ends, cul-de-sacs and many branches, irregular shape of the roads, as well as varying width and material change of the road surface, are some of the apparent properties of this road network.
In this experiment, the guided filter method is applied to each band of the image, which removes noise and outputs a smoothed image. By multi-resolution segmentation (Section 2.2), image objects as the smallest processing entities are achieved. Figure 5c shows the results of image segmentation, which are obtained by setting the parameters to 30, 0.5, and 0.5 for the maximum fusion factor, shape, and compactness weight, respectively. The extracted elongated objects represent homogeneous scene components according to the goal of object-based image segmentation in our application. The edge-preserving guided filter applied in the preceding step contributes significantly to a high quality of the segmentation result. After segmentation, objects’ features are used to distinguish road segments from non-road segments as discussed in Section 2.4. Figure 5d depicts the binary road map obtained from feature integration. The widths of the roads in this dataset are about 10–20 m, but we set the lower value for W R in Equation (7) more cautiously to 7.5 m to deal with the over-segmentation problem. Moreover, the upper limit for W R is set to 20 2 to take into account the extended regions at junctions and slightly undersegmented objects due to segmentation leakages.
As marked with red rectangles in Figure 5d, there are some discontinuities in this binary road map caused by the inference of trees, lane markings (e.g., zebra crossing) and shadow casts. CTV is employed to tackle this problem. Results of applying CTV on the binary road map with σ = 13 (cf. Section 2.4) is illustrated in Figure 5e. As mentioned earlier, σ is the only free parameter of the TV algorithm. An investigation on selecting the optimum value for σ follows at the end of this section.
After filling gaps, vectorization and pruning are performed in order to evaluate the results as polylines. The resulting polylines are shown in Figure 6c.
To assess the performance of our approach, the three metrics noted in Section 2.6 are calculated. Furthermore, the results are quantitatively and qualitatively compared with the methods proposed by Poullis et al. [12] and by Miao et al. [13], hereafter referred to as “Poullis 2014” and “Miao 2013”, respectively. For visual comparison the results of Poullis 2014 and Miao 2013, as well as the result of our method, are depicted in Figure 6.
It can be seen from Figure 6 that all three approaches extracted most parts of the road network quite well. Non-extracted road segments (false negatives) are marked by yellow boxes and erroneous extracted road segments (false positives) are marked by green boxes. Obviously, the number of false negatives in Poullis 2014 and Miao 2013 is significantly higher than in our approach. How this shows up in the quantitative metrics is summarized in Table 1.
Table 1 indicates that the roads extracted by the proposed method have the highest completeness and quality values. Miao 2013 achieved the highest correctness. However, the lowest completeness of Miao 2013 also led to the lowest quality of extraction. According to [8] a “practically useful method” for road extraction should fulfill the lowest limits for completeness and correctness of 0.6 and 0.75, respectively. In this regard, all three approaches yield great performance on this dataset.

3.2. Second Experiment

For the second experiment, we apply the proposed method on a satellite image of an urban area in Las Vegas, NV, USA [27], which was taken in 2004. Figure 7a,b demonstrate this dataset and its corresponding hand-drawn ground truth, respectively. The nominal spatial resolution of this image is 1.2 m and contains three spectral bands. At a first glance, this dataset looks simple. However, trees and their shadow cast on the road surface and the color change of the road pavement make it challenging. The long, rectangular buildings on the right side of the image lead to shape properties that are similar to those of the road segments. Furthermore, the playground in the lower left part of the image provides challenges to the extraction, as it has line marks and it is attached to two adjacent road segments. The segmentation parameters are set to 40, 0.5, and 0.4 for the maximum fusion factor, shape, and compactness weight, respectively.
Focusing on the main roads, the result of our extraction approach is compared with the results of Poullis 2014 as well as two other methods proposed by Wang et al. [15] and Poullis et al. [27], which henceforth we cite them as “Wang 2015” and “Poullis 2010”. In Table 2, completeness, correctness, and quality are listed for the results of all four methods. The evaluation results verify the efficiency of our method in terms of all three metrics and clearly show that it outperforms the other methods in this dataset.
With respect to the lowest correctness limit of 75% considered in [8], Poullis 2014 and Wang 2015 did not fulfill the correctness criteria. The apparent differences of our results to the other ones of more than 10%, with respect to all three evaluation metrics, indicates that our multi-stage approach copes well with the most challenging parts of this dataset.
For visual comparison, the results reported in Poullis 2010 and Poullis 2014 are depicted in Figure 8 together with the result of our approach.
As can be seen from Figure 8c, in spite of many local occlusions, our method could extract most parts of the road network. In areas with a presence of high occlusion, none of the approaches could extract the road network correctly. Remarkable is the significant difference between the approaches related to the playground, in which only our approach is successful.

3.3. Third Experiment

The residential area shown in Figure 9a is a portion of an urban area in Hobart, Australia. Ground truth of this dataset (Figure 9b) is again acquired through on-screen delineation. The scene contains wide and narrow roads, including different types of junctions and many dead ends. Trees occlude some parts of the roads and shadow areas lead to an oversegmentation of road segments. Furthermore, there are many parking lots and building roofs which are spectrally similar to the roads. This IKONOS dataset, which is publicly available by the International Society for Photogrammetry and Remote Sensing (ISPRS), has four spectral bands i.e., red, green, blue, and near infra-red with 4 m resolution, as well as one panchromatic band with 1 m resolution.
In this experiment, Gram-Schmidt pan-sharpening [63] is used to achieve a pan-sharpened multispectral image with 1 m ground resolution. For this dataset, the segmentation parameters are set to the same values as second experiment. SOLI separated very effectively the elongated segments from all others. However, our method lost two parts of the road network on the right side of the image (cf. Figure 9c). In these parts, adjacent trees partially occluded the road and the shadow of the trees divided the remaining parts of the road into very small regions.
The dataset used in this experiment is a part of a scene that is recently used in the research works of Ameri et al. [25], Miao et al. [20] and Nikfar et al. [18]. In Table 3, our result is compared with the results of Ameri 2015, Miao 2015, and Nikfar 2015.
All methods fulfilled the lowest limits for completeness and correctness recommended in [8]. Moreover, Miao 2015 and our approach also achieved a good balance between completeness and correctness. The high correctness of our method stems from fewer false positives and results in the highest quality index among all four approaches, close to 90%.

3.4. Discussion on Tensor Voting

In the discussion of customizing the TV algorithm (cf. Section 2.4) we mentioned that we limited the voters to pixels that lie on the boundary of the extracted road segments to improve the computational efficiency of TV. Figure 10 illustrates the achieved improvement with respect to all three datasets.
It can be seen from Figure 10 that the customization of TV for road gap filling boosted the computational performance of TV, in our experiments by a factor of 4–5.
The only free parameter in the TV algorithm is the scale of voting σ that essentially controls the range within which tokens can influence other tokens [57]. Some research works [20,50,64] analyzed the effect of σ on the overall efficiency of road extraction results. We test this parameter in our approach as well and select an optimum for it.
The investigations with all three data sets show a similar trend. The most obvious of this is in the first data set in which CTV has to deal with many gaps. Figure 11 depicts the scale dependency of all three evaluation criteria for different σ values.
It can be seen from Figure 11 that with increasing σ the correctness will decline gradually. But for large values of σ, the input tokens start to “cross talk” too much with the consequence that correctness will decrease suddenly. This observation is in line with the concept of TV [53] and with the results of [50]. As σ increases, more gaps will be filled. As expected and can be seen in Figure 11, completeness increases up to a certain value. Despite our initial expectation, for large values of σ, completeness decreases. The reason is that for large σ values, the cross talk of voters attaches some neighboring areas to the road map and deviates the extracted centerlines, especially near junctions, from their previous correct position.
For selecting the optimum value for σ two issues are important. With respect to completeness the minimum value for σ should be large enough to allow for filling the gaps. With respect to correctness, the maximum σ value should be small enough to avoid cross talk of separate but neighboring road segments. Examples for which the high σ values can be critical are parallel roads in the network and dead ends of roads which are close to adjacent roads. In this regard, one may consider the optimum value as a compromise between correctness and completeness that maximizes the quality index, as Figure 11 illustrates. Our experiment indicates that a σ range of [w, 2w] leads to the highest quality values in which w is the most frequent road width in the dataset.

4. Conclusions

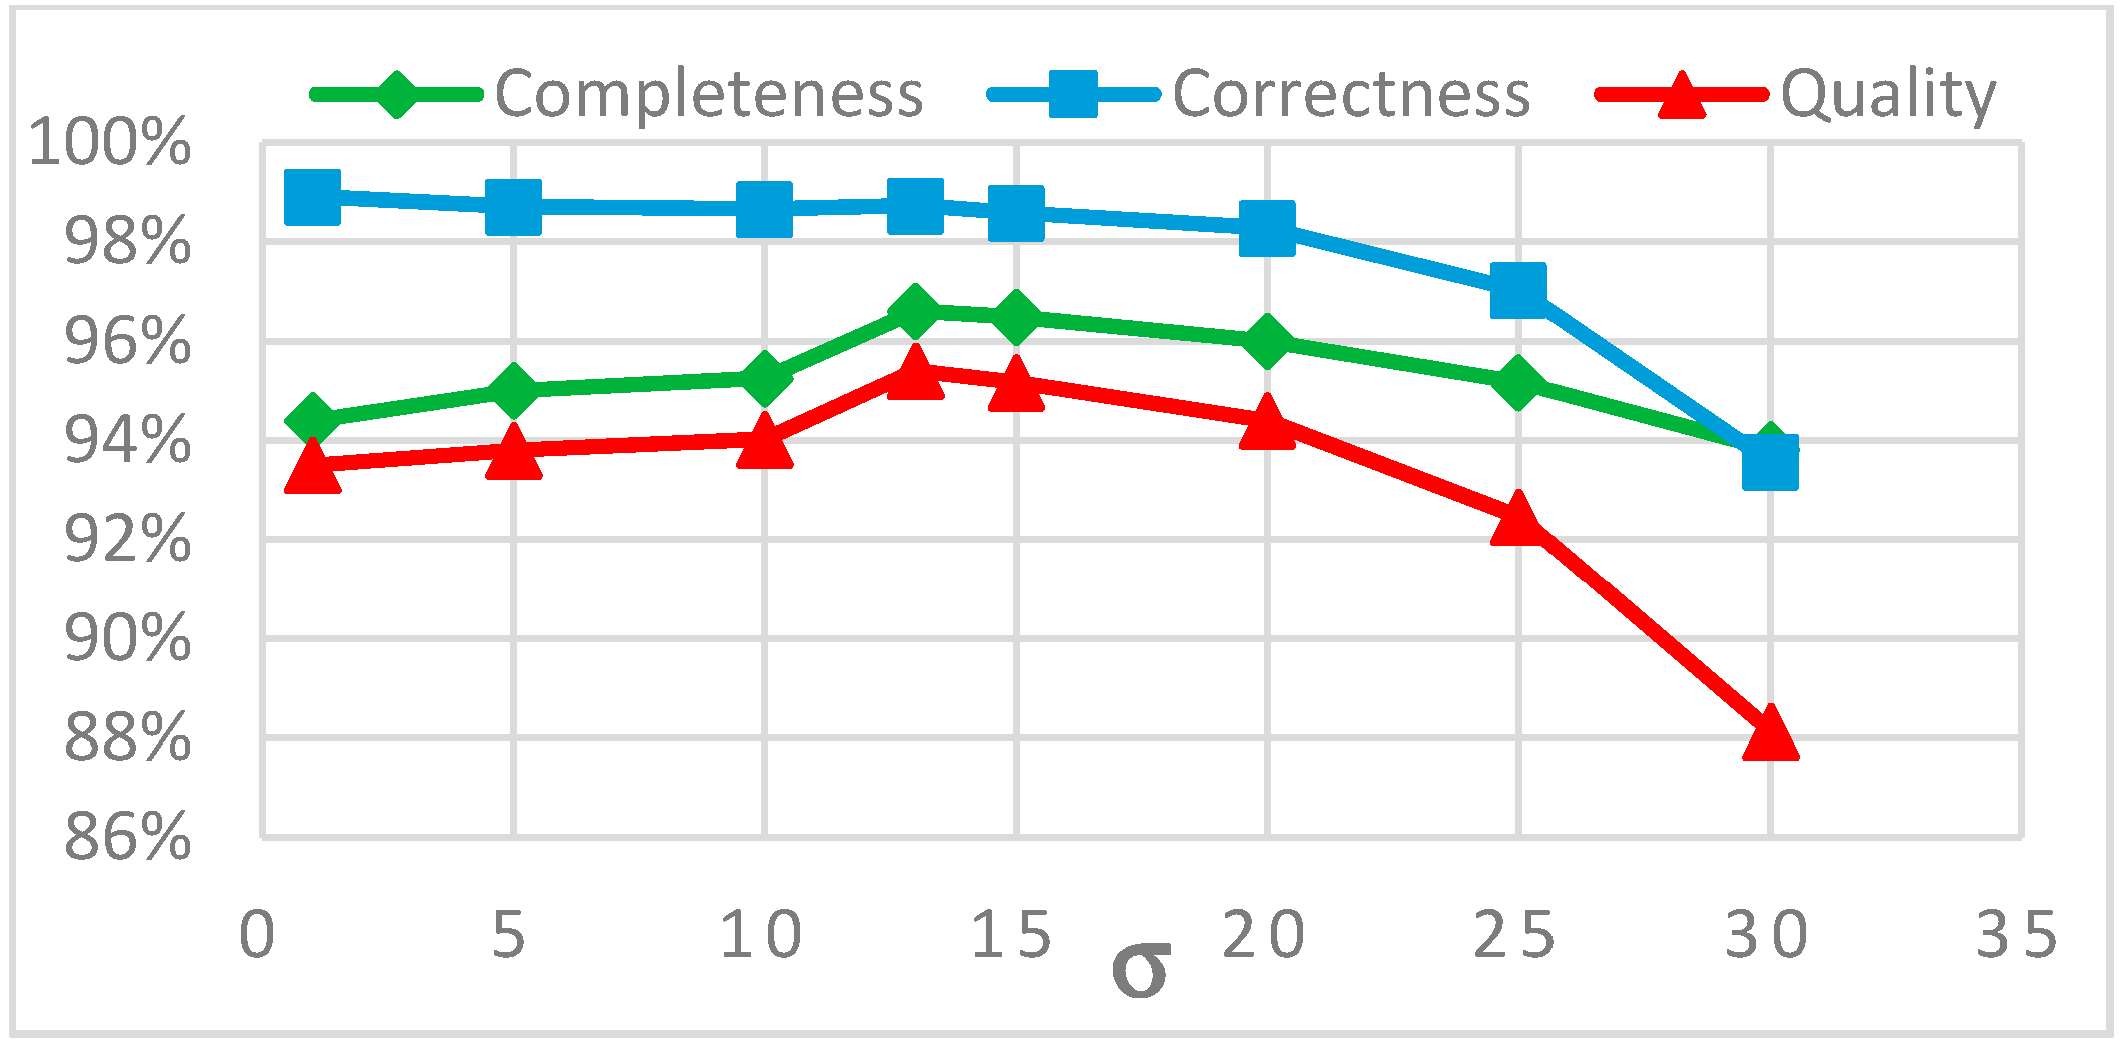
In this paper, a novel multi-stage object-based approach for road extraction from VHR satellite images is proposed. Edge-preserving guided filtering improves the segmentation quality significantly. A novel skeleton based linearity index called SOLI is proposed which approximates linearity of objects very well even if they are curved or include branches. Context aware feature integration based on SOLI, as well as spectral and textural features, leads to an efficient detection of road segments. For road-filling network gaps, the TV algorithm is customized to improve its computational efficiency. By limiting the voters to pixels that lie on the boundary of the extracted road segments, a considerable improvement of the computational efficiency of TV is achieved. The analysis of the impact of the scale parameter of TV on the quality of the result indicates that a σ range of [w, 2w] leads to the highest quality values.
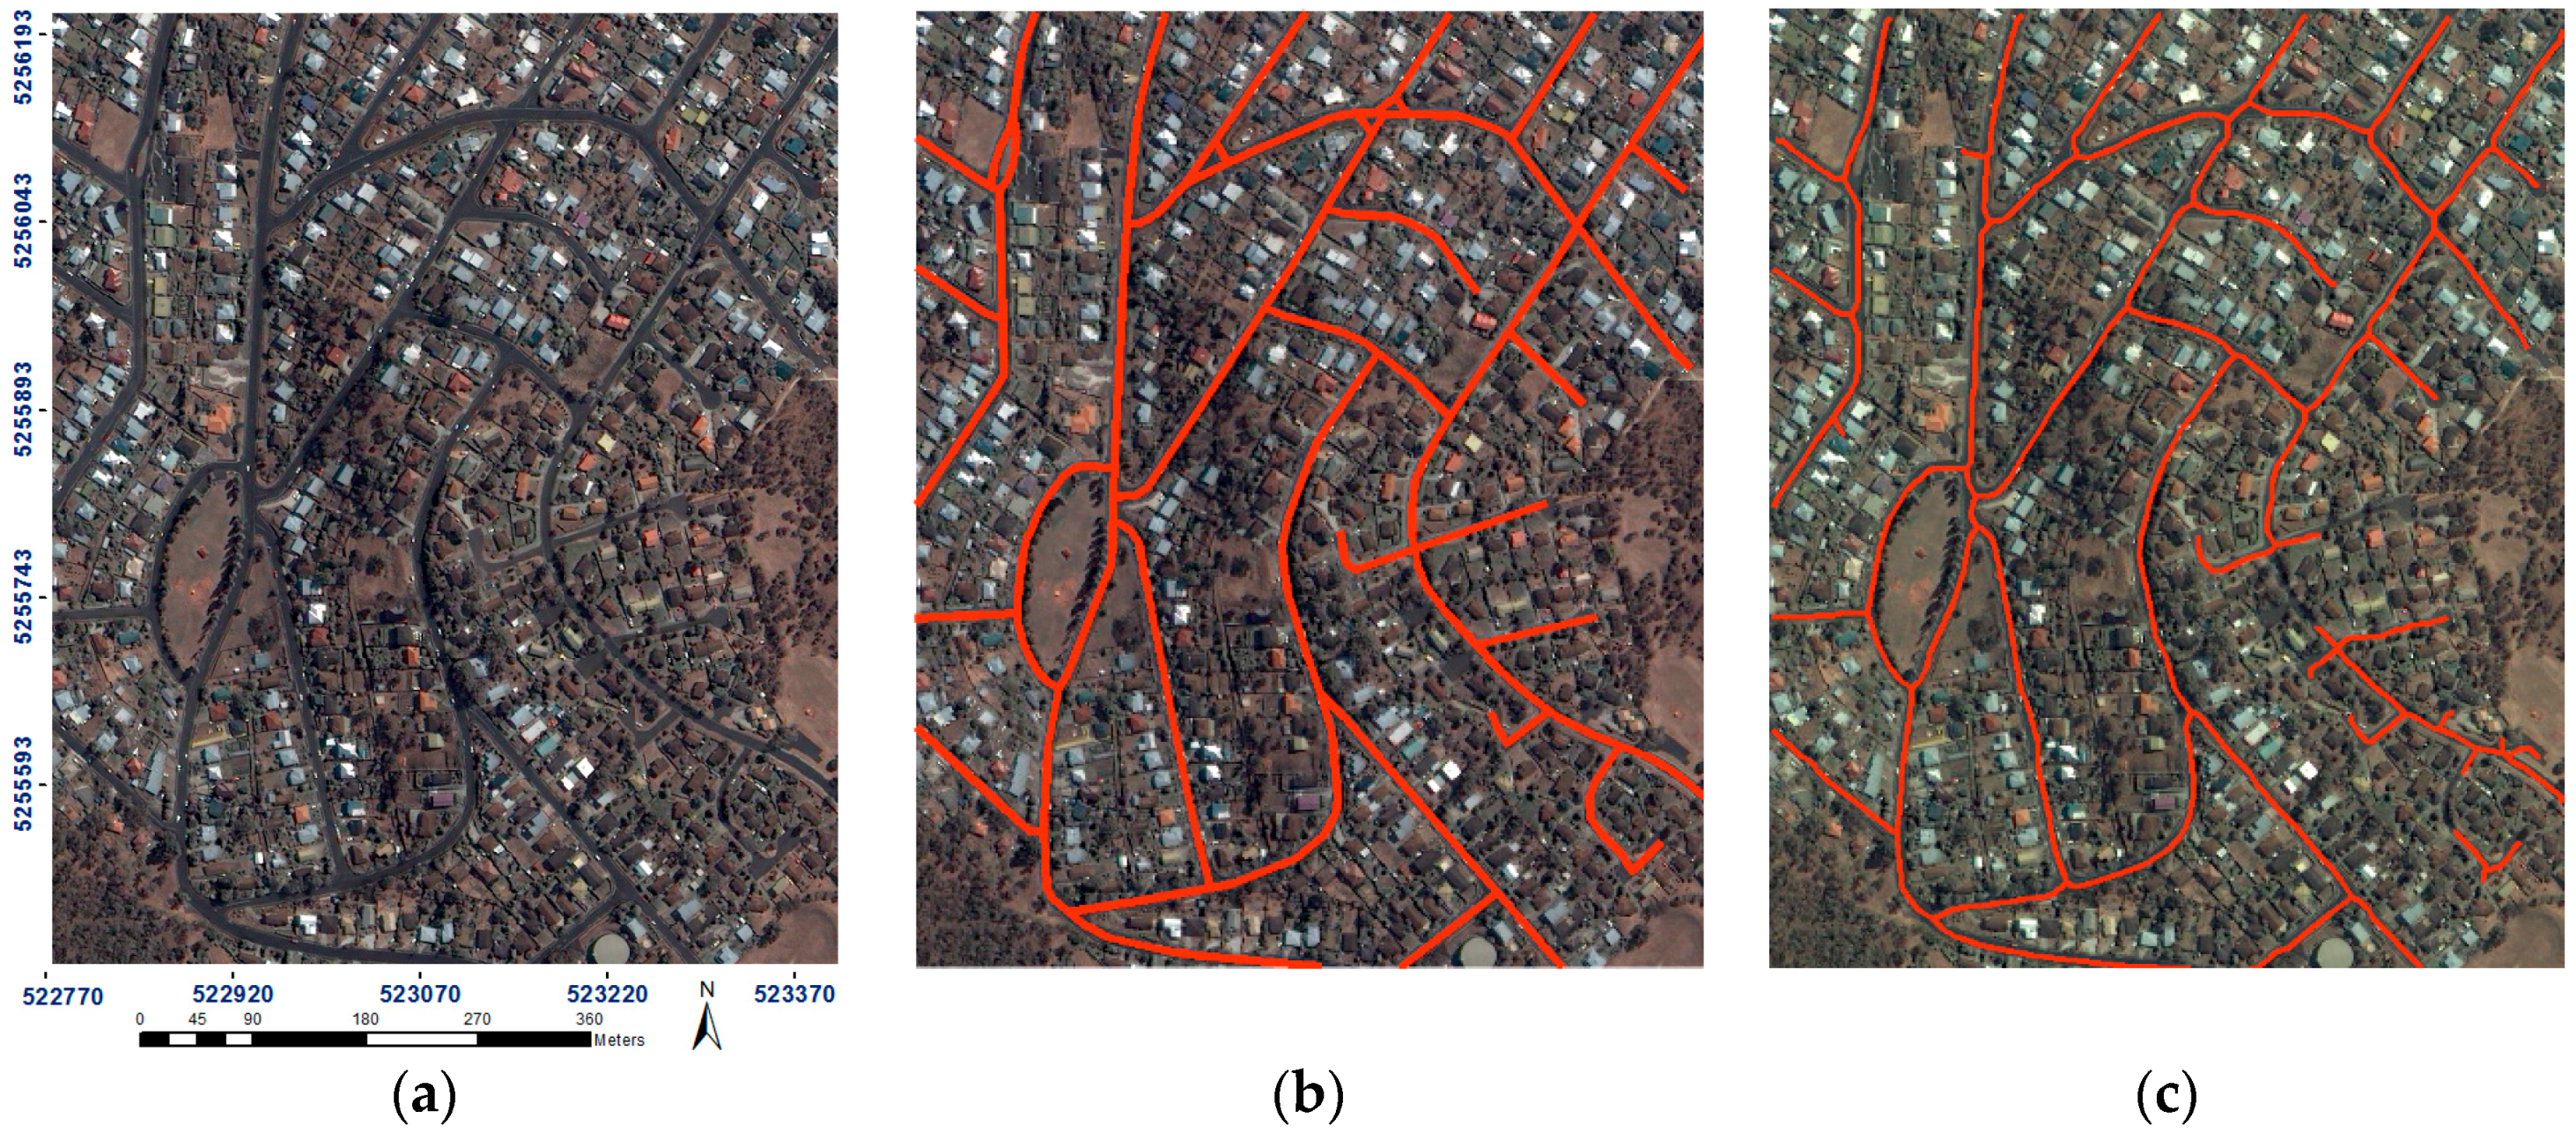
The experimental investigations are carried out with three publically available datasets which have been used by other researchers. In the investigations of the evaluation criteria, we have achieved quality measures of more than 84% for all datasets which demonstrates that the proposed approach fulfills the applicability criteria recommended in the EuroSDR test report [8].
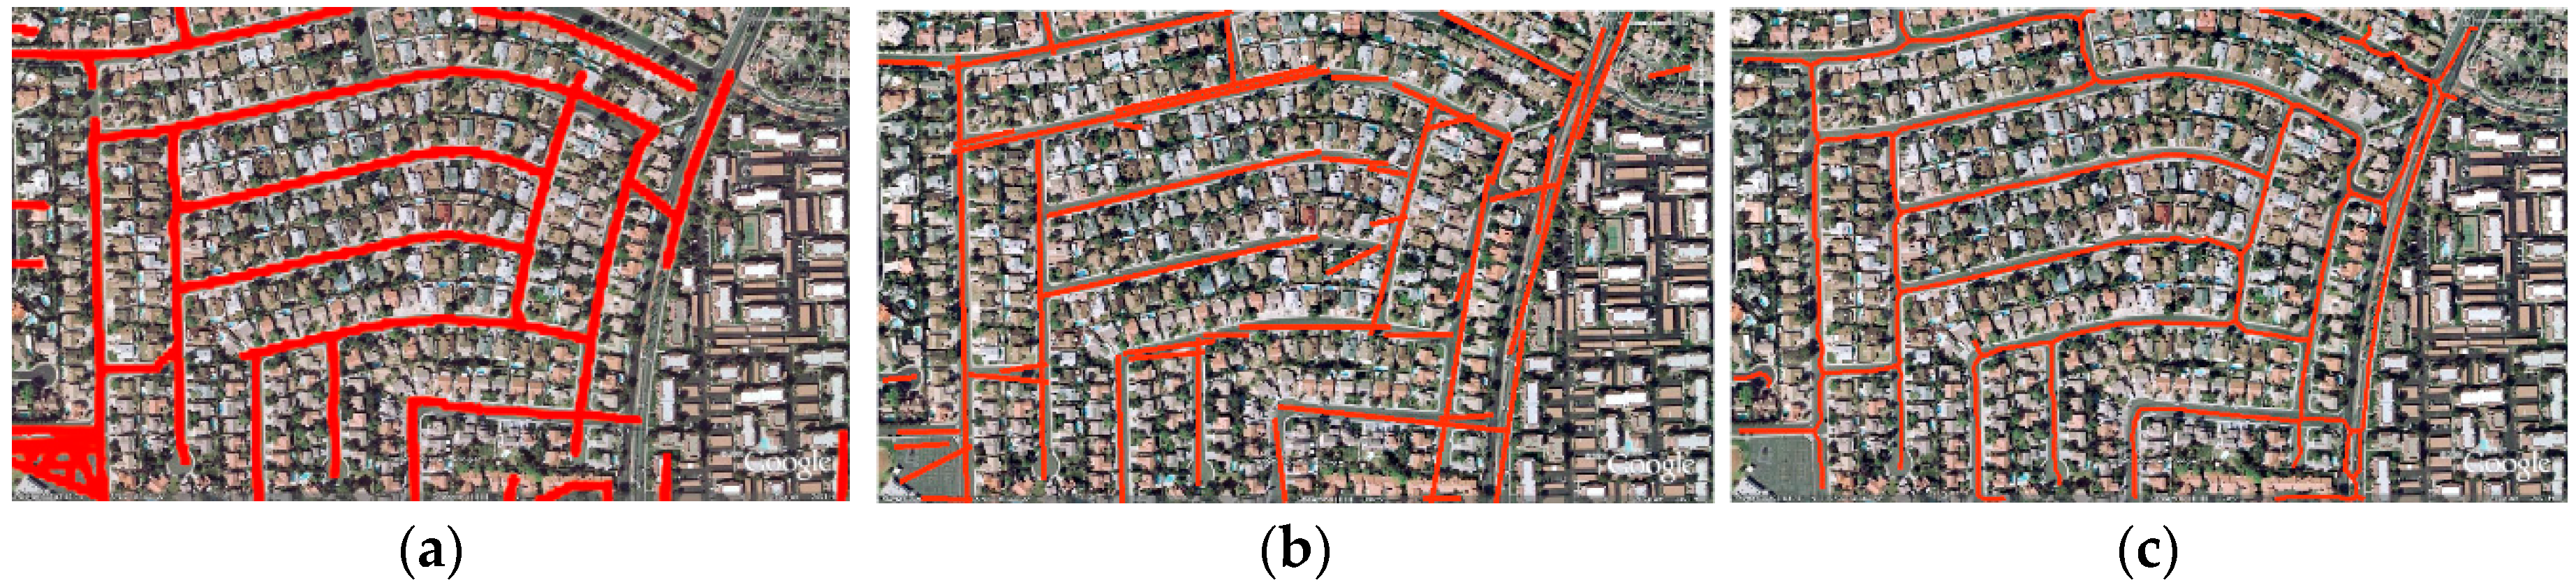
By comparing our results with published results of altogether seven state-of-the-art methods, we found that, with respect to all three evaluation criteria (completeness, correctness, and quality), our results are always among the two best in all different datasets. The rationale for this lies mainly in the combination of guided filtering with segmentation, the context-aware integration of SOLI with other object related features, and the gap filling with CTV. Nevertheless, there are ample opportunities to improve the road extraction approach. Our future research will focus on three complementary issues: (1) incorporating edge information of the images to achieve more accurate roadsides; (2) reinforcing the proposed approach by a graph data structure to improve the quality of the extracted road network, especially in the case of highly occluded roads and more complex scenes; and (3) analyzing the topology of the road network to suit the extracted road network for applications which topological consistency is essential for them.

Acknowledgments

The authors would like to thank Hossein Arefi from the University of Tehran whose insightful suggestions improved this research. The authors would also like to thank Rodrigo Moreno from KTH Royal Institute of Technology and Johannes Engels for their constructive discussion on tensor voting. The authors are also grateful to the ISPRS and the Space Imaging LLC for providing IKONOS data.

Author Contributions

Mehdi Maboudi and Jalal Amini framed the concept of the research. Mehdi Maboudi implemented the algorithms and performed the experiments. All authors discussed the detail of the algorithms in all stages and shared their idea. Mehdi Maboudi and Mehdi Saati evaluated the results. Mehdi Maboudi wrote the manuscript and Jalal Amini and Michael Hahn carefully revised it.

Conflicts of Interest

The authors declare no conflict of interest.

Abbreviations

The following abbreviations are used in this manuscript:
DSMDigital Surface Model
CTVCustomized Tensor Voting
GLCMGray Level Co-occurrence Matrix
GSDGround Sampling Distance
SOLISkeleton-based Object Linearity Index
TVTensor Voting
VHRVery High Resolution

References

  1. Hu, J.; Razdan, A.; Femiani, J.C.; Cui, M.; Wonka, P. Road network extraction and intersection detection from aerial images by tracking road footprints. IEEE Trans. Geosci. Remote Sens. 2007, 45, 4144–4157. [Google Scholar] [CrossRef]
  2. Shao, Y.; Guo, B.; Hu, X.; Di, L. Application of a fast linear feature detector to road extraction from remotely sensed imagery. IEEE J. Sel. Top. Appl. Earth Obs. Remote Sens. 2011, 4, 626–631. [Google Scholar] [CrossRef]
  3. Shi, W.; Miao, Z.; Wang, Q.; Zhang, H. Spectral-spatial classification and shape features for urban road centerline extraction. IEEE Geosci. Remote Sens. Lett. 2014, 11, 788–792. [Google Scholar]
  4. Saati, M.; Amini, J.; Maboudi, M. A method for automatic road extraction of high resolution sar imagery. J. Indian Soc. Remote Sens. 2015, 43, 697–707. [Google Scholar] [CrossRef]
  5. Song, M.; Civco, D. Road extraction using svm and image segmentation. Photog. Eng. Remote Sens. 2004, 70, 1365–1371. [Google Scholar] [CrossRef]
  6. Wegner, J.D.; Montoya-Zegarra, J.A.; Schindler, K. Road networks as collections of minimum cost paths. ISPRS J. Photogramm. Remote Sens. 2015, 108, 128–137. [Google Scholar] [CrossRef]
  7. Mena, J.B. State of the art on automatic road extraction for gis update: A novel classification. Pattern Recognit. Lett. 2003, 24, 3037–3058. [Google Scholar] [CrossRef]
  8. Mayer, H.; Hinz, S.; Bacher, U.; Baltsavias, E. A test of automatic road extraction approaches. In Proceedings of the Symposium of ISPRS Commission III: Photogrammetric Computer Vision (PCV’ 06), Bonn, Germany, 20–22 September 2006; pp. 209–214.
  9. Quackenbush, L.J. A review of techniques for extracting linear features from imagery. Photogramm. Eng. Remote Sens. 2004, 70, 1383–1392. [Google Scholar] [CrossRef]
  10. Das, S.; Mirnalinee, T.T.; Varghese, K. Use of salient features for the design of a multistage framework to extract roads from high-resolution multispectral satellite images. IEEE Trans. Geosci. Remote Sens. 2011, 49, 3906–3931. [Google Scholar] [CrossRef]
  11. VPLab, Downloads. Available online: http://www.cse.iitm.ac.in/~vplab/road_detection.html (accessed on 10 February 2015).
  12. Poullis, C. Tensor-Cuts: A simultaneous multi-type feature extractor and classifier and its application to road extraction from satellite images. ISPRS J. Photogramm. Remote Sens. 2014, 95, 93–108. [Google Scholar] [CrossRef]
  13. Miao, Z.; Shi, W.; Zhang, H.; Wang, X. Road centerline extraction from high-resolution imagery based on shape features and multivariate adaptive regression splines. IEEE Geosci. Remote Sens. Lett. 2013, 10, 583–587. [Google Scholar] [CrossRef]
  14. Chaudhuri, D.; Kushwaha, N.K.; Samal, A. Semi-automated road detection from high resolution satellite images by directional morphological enhancement and segmentation techniques. IEEE J. Sel. Top. Appl. Earth Obs. Remote Sens. 2012, 5, 1538–1544. [Google Scholar] [CrossRef]
  15. Wang, J.; Song, J.; Chen, M.; Yang, Z. Road network extraction: A neural-dynamic framework based on deep learning and a finite state machine. Int. J. Remote Sen. 2015, 36, 3144–3169. [Google Scholar] [CrossRef]
  16. Shanmugam, L.; Kaliaperumal, V. Water flow based geometric active deformable model for road network. ISPRS J. Photogramm. Remote Sens. 2015, 102, 140–147. [Google Scholar]
  17. Grote, A.; Heipke, C.; Rottensteiner, F. Road network extraction in suburban areas. Photogramm. Rec. 2012, 27, 8–28. [Google Scholar] [CrossRef]
  18. Nikfar, M.; Valadan Zoej, M.J.; Mokhtarzade, M.; Aliyari Shoorehdeli, M. Designing a new framework using type-2 FLS and cooperative-competitive genetic algorithms for road detection from IKONOS satellite imagery. Remote Sens. 2015, 7, 8271–8299. [Google Scholar] [CrossRef]
  19. Sun, W.; Messinger, D.W. Knowledge-based automated road network extraction system using multispectral images. Opt. Eng. 2013, 52, 047203. [Google Scholar] [CrossRef]
  20. Miao, Z.; Shi, W.; Gamba, P.; Li, Z. An object-based method for road network extraction in VHR satellite images. IEEE J. Sel. Top. Appl. Earth Obs. Remote Sens. 2015, 8, 4853–4862. [Google Scholar] [CrossRef]
  21. Miao, Z.; Wang, B.; Shi, W.; Zhang, H. A semi-automatic method for road centerline extraction from VHR images. IEEE Geosci. Remote Sens. Lett. 2014, 11, 1856–1860. [Google Scholar] [CrossRef]
  22. Miao, Z.; Shi, W.; Samat, A.; Lisini, G.; Gamba, P. Information fusion for urban road extraction from VHR optical satellite images. IEEE J. Sel. Top. Appl. Earth Obs. Remote Sens. 2016, 9, 1817–1829. [Google Scholar] [CrossRef]
  23. Yin, D.; Du, S.; Wang, S.; Guo, Z. A direction-guided ant colony optimization method for extraction of urban road information from very-high-resolution images. IEEE J. Sel. Top. Appl. Earth Obs. Remote Sens. 2015, 8, 4785–4794. [Google Scholar] [CrossRef]
  24. Zarrinpanjeh, N.; Samadzadegan, F.; Schenk, T. A new ant based distributed framework for urban road map updating from high resolution satellite imagery. Comput. Geosci. 2013, 54, 337–350. [Google Scholar] [CrossRef]
  25. Ameri, F.; Valadan Zoej, M.J. Road vectorization from high-resolution imagery based on dynamic clustering using particle swarm optimization. Photogramm. Rec. 2015, 30, 363–386. [Google Scholar] [CrossRef]
  26. Doucette, P.; Agouris, P.; Stefanidis, A. Automated road extraction from high resolution multispectral imagery. Photogramm. Eng. Remote Sens. 2004, 70, 1405–1416. [Google Scholar] [CrossRef]
  27. Poullis, C.; You, S. Delineation and geometric modeling of road networks. ISPRS J. Photogramm. Remote Sens. 2010, 65, 165–181. [Google Scholar] [CrossRef]
  28. Sironi, A.; Türetken, E.; Lepetit, V.; Fua, P. Multiscale centerline detection. IEEE Trans. Pattern Anal. Mach. Intell. 2016, 38, 1327–1341. [Google Scholar] [CrossRef] [PubMed]
  29. Grote, A. Automatic Road Network Extraction in Suburban Areas from Aerial Images. Ph.D. Thesis, Leibniz University, Hannover, Germany, 2011. [Google Scholar]
  30. Amini, J.; Lucas, C.; Saradjian, M.R.; Azizi, A.; Sadeghian, S. Fuzzy logic system for road identification using IKONOS images. Photogramm. Rec. 2002, 17, 493–503. [Google Scholar] [CrossRef]
  31. Movaghati, S.; Moghaddamjoo, A.; Tavakoli, A. Road extraction from satellite images using particle filtering and extended kalman filtering. IEEE Trans. Geosci. Remote Sens. 2010, 48, 2807–2817. [Google Scholar] [CrossRef]
  32. He, K.; Sun, J.; Tang, X. Guided image filtering. IEEE Trans. Pattern Anal. Mach. Intell. 2013, 35, 1397–1409. [Google Scholar] [CrossRef] [PubMed]
  33. Pal, N.R.; Pal, S.K. A review on image segmentation techniques. Pattern Recognit. 1993, 26, 1277–1294. [Google Scholar] [CrossRef]
  34. Blaschke, T.; Burnett, C.; Pekkarinen, A. Image segmentation methods for object-based analysis and classification. In Remote Sensing Image Analysis: Including the Spatial Domain; de Jong, S.M., van der Meer, F., Eds.; Springer: Dordrecht, The Netherlands, 2004; Volume 5, pp. 211–236. [Google Scholar]
  35. Maboudi, M.; Amini, J. Object based segmentation effect on road network extraction from satellite images. In Proceedings of the 36th Asian Conference on Remote Sensing, Manila, Philippines, 19–23 October 2015.
  36. Luo, J.; Guo, C. Perceptual grouping of segmented regions in color images. Pattern Recognit. 2003, 36, 2781–2792. [Google Scholar] [CrossRef]
  37. Wang, M.; Li, R. Segmentation of high spatial resolution remote sensing imagery based on hard-boundary constraint and two-stage merging. IEEE Trans. Geosci. Remote Sens. 2014, 52, 5712–5725. [Google Scholar] [CrossRef]
  38. Blaschke, T.; Hay, G.J.; Kelly, M.; Lang, S.; Hofmann, P.; Addink, E.; Feitosa, R.Q.; van der Meer, F.; van der Werff, H.; van Coillie, F.; et al. Geographic object-based image analysis—Towards a new paradigm. ISPRS J. Photogramm. Remote Sens. 2014, 87, 180–191. [Google Scholar] [CrossRef] [PubMed]
  39. Baatz, M.; Schäpe, A. Multiresolution Segmentation: An optimization approach for high quality multi-scale image segmentation. In Proceedings of the Applied Geographical Information Processing XII (Contributions to AGIT Symposium), Salzburg, Austria, 5–7 July 2000; Volume 58, pp. 12–23.
  40. Chen, J.; Li, J.; Pan, D.; Zhu, Q.; Mao, Z. Edge-guided multiscale segmentation of satellite multispectral imagery. IEEE Trans. Geosci. Remote Sens. 2012, 50, 4513–4520. [Google Scholar] [CrossRef]
  41. Benz, U.C.; Hofmann, P.; Willhauck, G.; Lingenfelder, I.; Heynen, M. Multi-resolution, object-oriented fuzzy analysis of remote sensing data for GIS-ready information. ISPRS J. Photogramm. Remote Sens. 2004, 58, 239–258. [Google Scholar] [CrossRef]
  42. Nikfar, M.; ValadanZoej, M.J.; Mohammadzadeh, A.; Mokhtarzade, M.; Navabi, A. Optimization of multiresolution segmentation by using a genetic algorithm. J. Appl. Remote Sens. 2012, 6. [Google Scholar] [CrossRef]
  43. Saba, F.; ValadanZoej, M.J.; Mokhtarzade, M. Optimization of multiresolution segmentation for object-oriented road detection from high-resolution images. Can. J. Remote Sens. 2016, 42, 75–84. [Google Scholar] [CrossRef]
  44. Wang, M.; Sun, Y.; Chen, G. Refining high spatial resolution remote sensing image segmentation for man-made objects through aCollinear and Ipsilateral neighborhood model. Photogramm. Eng. Remote Sens. 2015, 81, 397–406. [Google Scholar] [CrossRef]
  45. Tabib Mahmoudi, F.; Samadzadegan, F.; Reinartz, P. Object oriented image analysis based on multi-agent recognition system. Comput. Geosci. 2013, 54, 219–230. [Google Scholar] [CrossRef]
  46. Yang, J.; Wang, R.S. Classified road detection from satellite images based on perceptual organization. Int. J. Remote Sen. 2007, 28, 4653–4669. [Google Scholar] [CrossRef]
  47. Dal Poz, A.P.; Zanin, R.B.; do Vale, G.M. Automated extraction of road network from medium and high-resolution images. Pattern Recognit. Image Anal. 2006, 16, 239–248. [Google Scholar] [CrossRef]
  48. Vosselman, G.; Knecht, J. Road tracking by profile matching and Kalman filtering. In Automatic Extraction of Man-Made Objects from Aerial and Space Image; Gruen, A., Kuebler, O., Agouris, P., Eds.; Birkhäuser: Basel, Switzerland, 1995; pp. 365–274. [Google Scholar]
  49. Hu, X.; Tao, C.V. A reliable and fast ribbon road detector using profile analysis and model-based verification. Int. J. Remote Sen. 2005, 26, 887–902. [Google Scholar] [CrossRef]
  50. Cheng, G.; Zhu, F.; Xiang, S.; Wang, Y.; Pan, C. Accurate urban road centerline extraction from VHR Imagery via multiscale segmentation and tensor voting. Neurocomputing 2016, 205, 407–420. [Google Scholar] [CrossRef]
  51. Rahimi, S.; Arefi, H.; Bahmanyar, R. Automatic road extraction based on integration of high resolution lidar and aerial imagery. In Proceedings of the ISPRS International Conference on Sensors & Models in Remote Sensing & Photogrammetry, Kish, Iran, 23–25 November 2015; pp. 583–587.
  52. Haralick, R.M.; Shapiro, L.G. Computer and Robot Vision, 1st ed.; Addison-Wesley Longman Publishing Co.: Boston, MA, USA, 1992. [Google Scholar]
  53. Medioni, G.; Lee, M.S.; Tang, C.K. A Computational Framework for Segmentation and Grouping, 1st ed.; Elsevier Science: Amsterdam, The Netherlands, 2000. [Google Scholar]
  54. Guy, G.; Medioni, G. Inference of surfaces, 3D curves, and junctions from sparse, noisy, 3D data. IEEE Trans. Pattern Anal. Mach. Intell. 1997, 19, 1265–1277. [Google Scholar] [CrossRef]
  55. Jörgens, D.; Moreno, R. Tensor voting: Current state, challenges and new trends in the context of medical image analysis. In Visualization and Processing of Higher Order Descriptors for Multi-Valued Data; Hotz, I., Schultz, T., Eds.; Springer International Publishing: Berlin, Germany, 2015; pp. 163–187. [Google Scholar]
  56. Moreno, R.; Garcia, M.A.; Puig, D.; Pizarro, L.; Burgeth, B.; Weickert, J. On improving the efficiency of tensor voting. IEEE Trans. Pattern Anal. Mach. Intell. 2011, 33, 2215–2228. [Google Scholar] [CrossRef] [PubMed]
  57. Medioni, G.; Mordohai, P. The tensor voting framework. In Emerging Topics in Computer Vision; Medioni, G., Kang, S.B., Eds.; Prentice Hall PTR: Upper Saddle River, NJ, USA, 2005; pp. 191–250. [Google Scholar]
  58. Wu, T.P.; Yeung, S.K.; Jia, J.; Tang, C.K.; Medioni, G. A closed-form solution to tensor voting: Theory and applications. IEEE Trans. Pattern Anal. Mach. Intell. 2012, 34, 1482–1495. [Google Scholar] [PubMed]
  59. Maggiori, E.; Lotito, P.; Manterola, H.L.; Fresno, M. Comments on “A closed-form solution to tensor voting: Theory and applications”. IEEE Trans. Pattern Anal. Mach. Intell. 2014, 36, 2567–2568. [Google Scholar] [CrossRef] [PubMed]
  60. Shi, W.; Cheung, C. Performance evaluation of line simplification algorithms for vector generalization. Cartogr. J. 2006, 43, 27–44. [Google Scholar] [CrossRef]
  61. Wiedemann, C.; Heipke, C.; Mayer, H.; Jamet, O. Empirical evaluation of automatically extracted road axes. In Empirical Evaluation Techniques in Computer Vision; Bowyer, K., Phillips, P.J., Eds.; IEEE Computer Society Press: Los Alamitos, CA, USA, 1998; pp. 172–187. [Google Scholar]
  62. Wiedemann, C.; Ebner, H. Automatic completion and evaluation of road networks. Int. Arch. Photogramm. Remote Sens. 2000, 33, 979–986. [Google Scholar]
  63. Laben, C.A.; Brower, B.V. Process for Enhancing the Spatial Resolution of Multispectral Imagery Using Pan-Sharpening. U.S. Patent 6,011,875 A, 4 January 2000. [Google Scholar]
  64. Shi, W.; Miao, Z.; Debayle, J. An integrated method for urban main-road centerline extraction from optical remotely sensed imagery. IEEE Trans. Geosci. Remote Sens. 2014, 52, 3359–3372. [Google Scholar] [CrossRef]
Figure 1. Workflow of the proposed approach.
Remotesensing 08 00637 g001
Figure 2. Comparison of the proposed skeleton-based object linearity index (SOLI) with LFI and LFIe. (a) LFI (figure is adapted from [13]); (b) LFIe (figure is adapted from [50]); (c) SOLI.
Remotesensing 08 00637 g002
Figure 3. Three types of linear objects with different levels of complexity, which demonstrate the superiority of SOLI: (a) rectangular object; (b) curved object; (c) branched object.
Remotesensing 08 00637 g003
Figure 4. Tensor voting representation: (a) graphical representation of a second order tensor as its components (adapted from [55]); (b) stick voting from “Voter” token to “Receiver” token (adapted from [56]).
Remotesensing 08 00637 g004
Figure 5. First study area: (a) input image; (b) ground truth data obtained via manual digitization; (c) segmentation result; (d) road binary map; (e) filling gaps using CTV.
Remotesensing 08 00637 g005
Figure 6. Extraction results of the first study area: (a) result of the proposed method; (b) result of Poullis 2014 (adapted from [12]); (c) result of Miao 2013 (adapted from [13]).
Remotesensing 08 00637 g006
Figure 7. Second study area: (a) input image; (b) overlaid ground truth data.
Remotesensing 08 00637 g007
Figure 8. Road extraction results of the second study area: (a) result of Poullis 2014 (adapted from [12]); (b) result of Poullis 2010 (adapted from [12]); (c) result of proposed method.
Remotesensing 08 00637 g008
Figure 9. Third study area: (a) Input image; (b) Ground truth data; (c) Result of proposed method.
Remotesensing 08 00637 g009
Figure 10. Comparison of computation efficiency of TV and Customized TV.
Remotesensing 08 00637 g010
Figure 11. Analysis of impact of tensor voting scale (σ) on efficiency of the road extraction.
Remotesensing 08 00637 g011
Table 1. Quantitative comparison of the proposed method with two state-of-the-art approaches in the first study area. The highest values with respect to the evaluation criteria are highlighted.
Evaluation CriteriaMiao 2013Poullis 2014Proposed
Completeness (%)94.1796.297.14
Correctness (%)99.2098.398.85
Quality (%)93.4694.696.06
Table 2. Quantitative comparison of the proposed method with three other methods in the second study area.
Evaluation CriteriaPoullis 2010Poullis 2014Wang 2015Proposed
Completeness (%)71.468.17589.9
Correctness (%)8064.37093.4
Quality (%)60.661.97484.8
Table 3. Quantitative comparison of the proposed method with three other methods in the third study area.
Evaluation CriteriaAmeri 2015Miao 2015Nikfar 2015Proposed
Completeness (%)899489.393.4
Correctness (%)949284.695.9
Quality (%)848776.889.8

