Article

A GIS-Based Assessment of Vulnerability to Aeolian Desertification in the Source Areas of the Yangtze and Yellow Rivers

1
Key Laboratory of Desert and Desertification, Northwest Institute of Eco-Environment and Resources, Chinese Academy of Sciences, No. 320 Donggang West Road, 730000 Lanzhou, Gansu, China
2
University of Chinese Academy of Sciences, 100049 Beijing, China
3
Department of Geography, Shaanxi Normal University, No. 620 West Chang’an Avenue, Chang’an District, 710119 Xi’an, Shaanxi, China
4
College of Resources Science and Technology, Beijing Normal University, 100875 Beijing, China
5
State Key Laboratory of Earth Surface Processes and Resource Ecology, MOE Engineering Research Center of Desertification and Blown-Sand Control, Beijing Normal University, 100875 Beijing, China
*
Author to whom correspondence should be addressed.
Remote Sens. 2016, 8(8), 626; https://doi.org/10.3390/rs8080626
Submission received: 24 March 2016 / Revised: 19 July 2016 / Accepted: 22 July 2016 / Published: 29 July 2016
(This article belongs to the Special Issue Remote Sensing in Tibet and Siberia)

Abstract

:
Aeolian desertification is a kind of land degradation that is characterized by aeolian activity, resulting from the responses of land ecosystems to climate change and anthropogenic disturbances. The source areas of the Yangtze and Yellow Rivers are typical regions of China’s Tibetan Plateau affected by aeolian desertification. We assessed the vulnerability of these areas to aeolian desertification by combining remote sensing with geographical information system technologies. We developed an assessment model with eight indicators, whose weights were determined by the analytical hierarchy process. Employing this model, we analyzed the spatial distribution of vulnerability to aeolian desertification and its changes from 2000 to 2010, and discuss the implications. Overall, low-vulnerability land was the most widespread, accounting for 64%, 62%, and 71% of the total study area in 2000, 2005, and 2010, respectively. The degree of vulnerability showed regional differences. In the source areas of the Yangtze River, land with high or very high vulnerability accounted for 17.4% of this sub-region in 2010, versus 2.6% in the source areas of the Yellow River. In the Zoige Basin, almost all of the land had very low to low vulnerability. To understand the change in vulnerability to aeolian desertification, we calculated an integrated vulnerability index (IVI). This analysis indicated that the vulnerability to aeolian desertification increased from 2000 to 2005 (IVI increased from 2.1709 to 2.2463), and decreased from 2005 to 2010 (IVI decreased from 2.2463 to 2.0057). Increasing regional temperatures appear to be primarily responsible for the change in vulnerability to aeolian desertification throughout the region. The effects of other factors (climatic variation and human activities) differed among the various sub-regions. The implementation of the ecological restoration project has achieved a noticeable effect since 2005. Our results provide empirical support for effort to protect the ecology of this ecologically fragile region.

Graphical Abstract

1. Introduction

Land degradation, defined as desertification in this paper, is a global environmental problem, and it is causing political and socio-economic impacts in the world’s arid, semi-arid and dry sub-humid regions [1]. Aeolian desertification is a major type of desertification characterized by the action of blowing sand, and results from a combination of climate change with intensive or unsustainable human activities in areas with a fragile ecological environment [2]. It is typically indicated by the development of various aeolian landforms such as sand sheets and dune areas [3]. In China, aeolian desertification is mainly distributed extensively in the arid and semi-arid regions, but is also found in some dry sub-humid zones; annual precipitation in these areas is usually less than 500 mm [4].
The Tibetan Plateau, which mostly lies at altitudes greater than 3000 m, has a cold climate. In recent decades, ecological problems on the Tibetan Plateau have attracted increasing attention due to the combined impacts of global warming and intensifying regional socioeconomic development [5,6]. The Yangtze and Yellow Rivers both originate from the Tibetan Plateau, where the complex topography produced by a long history of tectonic uplift has led to strong fluvial incision [7]. The source areas of the Yangtze and Yellow Rivers are of key importance to China’s ecological security, but also strongly affect the world’s ecological environment. Because of this importance, aeolian desertification in the source areas is a serious concern. The rapid development of aeolian desertification, accompanied by the expansion of soil erosion, land degradation, damage to the soil structure, and loss of soil nutrients, has also had negative consequences for the regional water conservation and supply functions [8]. To combat this aeolian desertification, it is necessary to improve our knowledge of its causes and consequences and to identify efficient monitoring tools.
Aeolian desertification is exacerbated by a range of predisposing factors, including loose and dry surface sediments, as well as strong winds, and is frequently aggravated by periodic drought and intensive human activities. Consideration of these factors requires careful selection of the variables and indicators that can best be used to assess the current condition and the aeolian desertification processes leading to changes in that condition, as well as associated effects. Therefore, it is of primary importance to identify areas that are vulnerable to aeolian desertification and define suitable prevention and mitigation measures.
In particular, it is necessary to detect sensitive areas by classifying their vulnerability before they undergo desertification and prioritizing these areas for protection or restoration. The large area and remote location of the Tibetan Plateau make it impractical to do this based solely on field surveys. Instead, remote sensing can provide the necessary wide-area data at adequate temporal and spatial resolutions, and geographic information system (GIS) technology can be used to analyze the data. This approach has been shown to be cost-effective, time-efficient, and valuable for mapping the risks of land degradation, and allows an assessment of land degradation, including aeolian desertification, at local, regional, and even national scales [9,10,11,12]. Multi-temporal remote sensing data allow monitoring of long-term trends and the spatial distribution of land degradation [13]. Especially in conjunction with GIS, remote sensing can rapidly and accurately identify areas of land degradation and link them to the physiographic setting [14].
In the present study, our goal was to develop a regional assessment model of the vulnerability to aeolian desertification of land in the source areas of the Yangtze and Yellow Rivers, which represent typical alpine environments on the Tibetan Plateau. To do so, we developed a composite index that integrates natural and anthropogenic factors. We defined the desertification vulnerability index (DVI) based on eight indicators that represent the impact of key meteorological factors and human pressures on the ecological environment. We selected these indicators based on internationally recognized principles for the development of vulnerability indices. The model was implemented with GIS tools to solve such a multi-criterion problem.
The specific goals of this research are to: (a) develop an evaluation model supported by remote sensing data and GIS tools; (b) use the analytic hierarchy process (AHP) method to develop appropriate factor weights to support our model of DVI; (c) identify the areas of highest vulnerability to aeolian desertification in the source areas of the Yangtze and Yellow Rivers; and (d) analyze the spatial distribution of vulnerability to aeolian desertification and its changes between 2000 and 2010 to estimate the trends and identify the driving forces responsible for these trends.

2. Study Area

2.1. Physiographic Settings

The source areas of the Yangtze and Yellow Rivers provide 25% [15] of the Yangtze River’s water and 49% [16] of the Yellow River’s water. However, the cold climate in these regions includes them among the most ecologically vulnerable regions of China. The main economic activity in the whole region is animal husbandry. Most residents are ethnic Tibetans, and population densities range from 0.5 to 2 persons per km2. The whole study area is underlain by extensive areas of high-altitude frozen ground, as shown in the supplementary materials.
The source areas of the Yangtze River lie between 32°31′N and 35°46′N latitude and between 90°33′E and 97°44′E longitude (Figure 1a). The highest altitude is 6519 m, the lowest altitude is 3350 m, and the mean altitude is 4754 m. This region covers an area of 1.42 × 10⁵ km2 and includes five counties (Qumalai, Zhiduo, Chengduo, Zaduo, and Yushu of Qinghai Province) as well as Tanggula township of Golmud City. The region is bounded by the Kunlun Mountains to the north, and by the Tanggula Mountains to the south. Many rivers originate in this region, including the Chumaer, Beilu, Tuotuo and Dangqu Rivers, among which the Tuotuo River is the origin of the Yangtze River; its name changes to the Tongtian River after it merges with the Dangqu River. This region has a cold continental climate without strong seasonal variations or an absolute frost-free season. Precipitation and temperature both gradually decrease moving from east to west. The mean annual precipitation is 364 mm, and the mean annual temperature is −1 °C. The precipitation differs strongly between the dry and wet seasons, and more than 90% of the total annual precipitation falls from June through September. The mean annual potential evaporation is 1426 mm. The mean annual hours of sunshine range from 2200 to 2900 h. The vegetation mainly includes high-altitude cold meadow and steppe species. Deep, loose deposits of soil, combined with the cold and windy climate, provide favorable conditions for the development of alpine meadow and steppe soil, which are vulnerable to desertification.
The source areas of the Yellow River are located between 32°09’N and 36°34’N latitude and between 95°54’E and 103°24’E longitude, and cover approximately 131,000 km2 and include 19 counties (Chengduo, Dari, Dulan, Gonghe, Xinghai, Guinan, Tongde, Zeku, Maduo, Henan, Maqin, Gande, and Jiuzhi of Qinghai Province; Zoige, Aba and Hongyuan of Sichuan Province; and Maqu, Luqu and Xiahe of Gansu Province). The altitude ranges from 2533 to 6236 m, and the mean altitude is 4065 m. This region is surrounded by the Bayan Har Mountains to the west, the Minshan Mountains to the east, and the Longyangxia Reservoir to the north. The mean annual temperature is 5 °C and the mean annual precipitation ranges from 320 to 750 mm. The precipitation is unevenly distributed during the year, with much less precipitation in winter and spring, and more than 80% of the total annual precipitation falls from June through September. The mean annual potential evaporation ranges from 1200 to 2000 mm. The seasonal temperatures vary only slightly, but there is a short warm season and a long cold season. The mean annual hours of sunshine range from 2400 to 2800 h. The vegetation is dominated by alpine cold meadow and steppe vegetation. The Zoige Basin is located in the southeastern part of the Yellow River region, where China’s Sichuan, Gansu, and Qinghai Provinces meet, and covers an area of 19,400 km2. Since the Zoige Basin is recognized as a “natural reservoir” for the Yellow River with nearly 30% of the Yellow River’s total flow originates from the basin’s wetland [17], it is of significance that we regard Zoige Basin as an independent geographical unit to study.
The meteorological data used in this work are from China’s national meteorological data sharing network (http://data.cma.cn).

2.2. Distribution of Aeolian Desertified Land
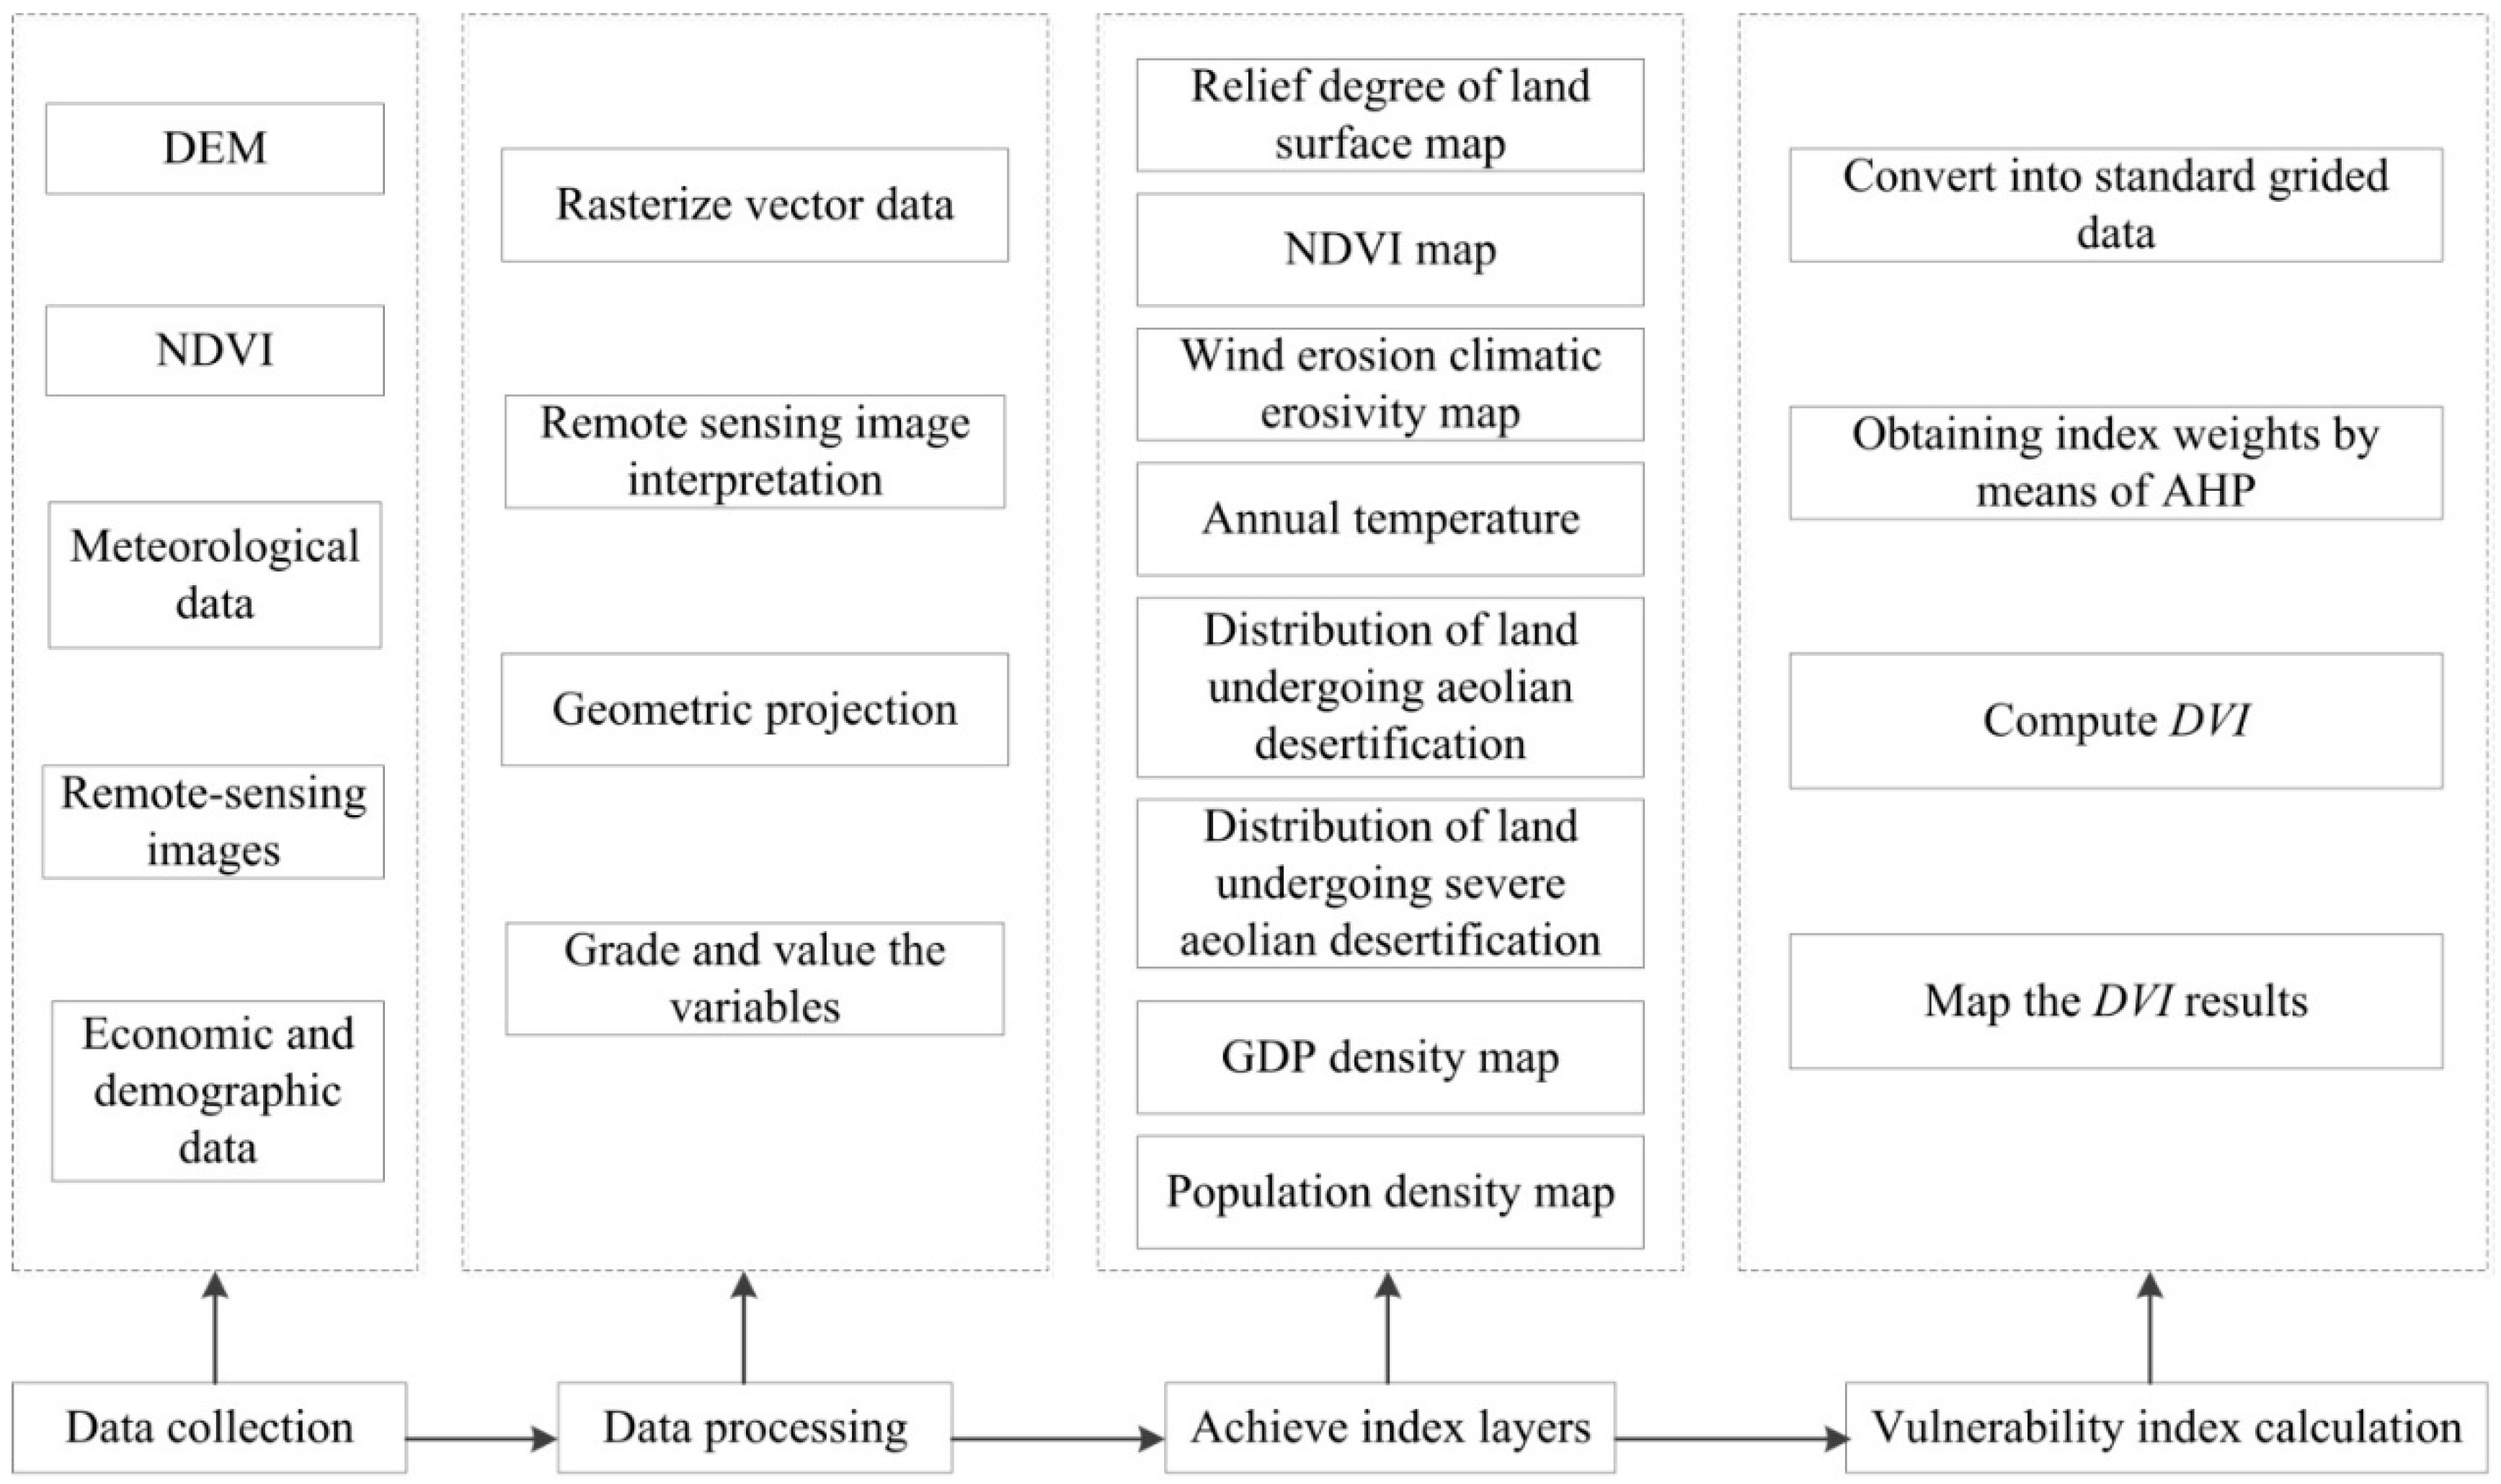
Figure 1b shows the spatial distribution of aeolian desertification in 2005 in the area. The aeolian desertified land covered 50,402.9 km2, accounting for 18% of the total area [17]. The area of slight desertification amounted to 14,286.8 km2 (9912.2 km2 of fixed dunes or sandy land, 4220.7 km2 of semi-exposed gravel, and 153.9 km2 of wind-eroded cropland), versus 29,256.4 km2 of moderate desertification (22,643.3 km2 of semi-fixed dunes or sandy land and 6613.1 km2 of bare gravel), and 6859.7 km2 of severe desertification (shifting dunes or sandy land). Thus, 29.4%, 58.0%, and 13.6% of the total area of aeolian desertified land represented slight, moderate, and severe desertification, respectively [18].
In the source areas of the Yangtze River, aeolian desertification was mainly distributed in the valleys of the Chumaer River and the Beilu River, where the Dangqu River merges with the Tuotuo River, and in the flat land around lakes. It was mainly characterized by wind erosion of degraded grasslands and areas where deposition of wind-blown sand has occurred. In the source areas of the Yellow River, aeolian desertification was distributed primarily in the northwest, southeast, and northeast (Figure 1b). In the northwest, aeolian desertified lands were located mainly in the wide valleys of the Yellow River and in the flat areas near lakes, such as Gyaring Lake and Ngoring Lake. In the southeast, aeolian desertification occurred along the Yellow River and in surrounding areas of degraded marshlands. In the northeast, aeolian desertification was clustered around the Longyangxia Reservoir. Among the counties in the source areas of the Yellow River, Maduo, Zoige, Guinan, and Gonghe Counties were the most severely affected, with desertified land accounting for 35%, 12%, 12%, and 8% of the total land in these counties, respectively [16].

3. Methods

3.1. Indicator System

The establishment of an indicator system supports an evaluation of the processes that lead to aeolian desertification. However, lack of agreement on the choice and application of indicators has been a major handicap in attempts to assess the status and trends of aeolian desertification because it has led to inconsistent interpretations. The problem is that aeolian desertification is a complex process, and researchers have identified a range of physical, biological, human, and socio-economic characteristics of this process that can be used as indicators [19]. Thus, the selection of appropriate evaluation criteria is an important part of aeolian desertification assessment. In principle, the indicators should reflect (i.e., be symptoms of) the underlying driving forces that are responsible for aeolian desertification, and should be reliable, regularly updatable, available at low cost, and readable to cover large areas at high spatial resolution [20]. Many studies have focused on measuring the vulnerability by integrating information from the natural and social sciences [21,22]. Based on the abovementioned principles, attributes of aeolian desertification, and data availability for our study area, we developed an indicator system to assess the vulnerability of land in the source areas of the two rivers to aeolian desertification. The system comprised eight key indicators that describe three dimensions of the underlying processes: exposure, sensitivity, and adaptive capacity (Table 1).
We defined exposure as the natural factors that lead directly to the occurrence of aeolian desertification, which, on the one hand, depend on the level of climate change, and on the other hand, depend on the environmental characteristics of the region [26,27]. Abundant sandy material is one of the preconditions for the evolution of aeolian desertification [15]. In geological history, a different topography unit created by lithosphere tectonics determined the geographical distribution patterns of aeolian desertification to a certain extent. In the source areas of the Yangtze and Yellow Rivers, continuous neotectonic processes enhanced the river’s head-ward erosion and down-cutting erosion, and then lowered the groundwater level, accelerating the development of aeolian desertification [15]. Relief of land surface was used to present the geographical distribution patterns of the study area today. The impacts of climate factors on aeolian desertification are not only influenced by the wind, but also by the combined effects of wind speed, precipitation and temperature [24]. Thus, the wind erosion climate erosivity indicator was used to represent comprehensive effects of climatic factors on aeolian desertification. For nearly one thousand years, aeolian desertification, which is distributed extensively in the arid and semi-arid regions of China, was the obvious response to climate change characterized by temperature variation [28]. In addition, the whole study area is underlain by extensive areas of high-altitude frozen ground and some of aeolian desertified lands are distributed in the region of frozen ground, which is sensitive to temperature. Therefore, it was necessary to select mean annual temperature.
Sensitivity refers to the factors that respond to various climate scenarios for the region [26,27]. As the main part of the terrestrial ecosystem, vegetation plays the role of an “indicator” in the research into global change, because it is not only as the bearer of climate change, but also as a generator of feedback effect on climate change [29]. Especially in the areas prone to the development of desertification, vegetation coverage generally varied according to the degree of aeolian desertification, which can be used to monitor desertification. In a large area, vegetation coverage can be directly estimated by the normalized-difference vegetation index (NDVI). Moreover, the dynamic change of aeolian desertified land results from natural and anthropogenic disturbances, while the process of mutual transformation between different types of aeolian desertified land (such as fixed dunes turned into semi-fixed dunes) reacts on the evolution of natural and social environments as well; e.g., an aggravation of aeolian desertification may accelerate surface vegetation destruction and increase the intensity of sandstorms once wind speed surpasses a certain threshold.
Adaptive capacity reflects the potential human responses to adapt to climate variability and extreme weather events, to mitigate potential losses, to take advantage of opportunities, or to cope with climate change, while avoiding disadvantageous behavior, and to allow restoration of a site to its original state [26,27]. We selected population density and GDP density, since other potentially relevant data were not available or could not be reliably converted into a raster layer in the GIS. Human disturbances have contributed to aeolian desertification, including over-grazing and land reclamation for agriculture. In the source areas of the Yangtze and Yellow Rivers, where economic activity is given priority over husbandry, the output value of husbandry accounted for more than half of total GDP value. In addition, with the increase in population and accompanying economic demand, land resources were utilized excessively and unreasonably, which also can accelerate the development of aeolian desertification. Hence, GDP and population density were selected to represent the influence of human activities on vulnerability to aeolian desertification in the study area.

3.2. Assessment Model

We developed a system for indirect estimation of vulnerability to aeolian desertification in the source areas of the Yangtze and Yellow Rivers using the indicators in Table 1, which describe the impact of various factors on the vulnerability to aeolian desertification. Figure 2 illustrates the components of the system and the relationships among them. Initially, the indicators were developed as separate layers (GIS themes) and they were subsequently assembled in thematic quality layers, with one layer for each of the eight indicators. Variables were then transformed (normalized) into values ranging from 0 to 1 (Equation (1) or Equation (2)):
p i = ( x i x min ) / ( x max x min )
p i = ( x max x i ) / ( x max x min )
where pi represents the standard value of the indicator for cell i of the grid, xi represents the actual value for the cell i, and xmax and xmin represent the maximum and minimum values for the indicator throughout the grid, respectively. We applied Equation (1) to variables that had a positive relationship with vulnerability to aeolian desertification (Table 1), and applied Equation (2) to variables that had a negative relationship with vulnerability to aeolian desertification (Table 1). Whether a relationship between indicators and vulnerability was positive or negative was based on the conclusions in the research literature [4,8]. The score of each indicator ranges from 0 (the lowest contribution to the vulnerability) to 1 (the highest contribution).
There are several possible ways to calculate indicator weights. These include the Delphi [30], the analytic hierarchy process (AHP) [31], entropy [32], and fuzzy clustering [33]. Of these, AHP is a multi-criterion decision-making approach, in which experts perform a series of pair-wise comparisons between factors to produce a ranking of the indicators. AHP is sufficiently flexible to combine quantitative and qualitative factors, handle different groups of actors or stakeholders, combine the opinions of multiple experts, and to guide stakeholder analysis; thus, it is widely used in environmental evaluation and sustainable management planning [34,35]. In this paper, we obtained the weight of each indicator by asking 48 experts (desertification researchers) to score the eight indicators. We tested whether the results were reasonable using the consistency ratio (CR). In general, CR ≤ 0.1 is considered acceptable [31,36]. In the current study, CR = 0.0915, so the AHP result had sufficient internal consistency to be considered acceptable.
We then calculated a desertification vulnerability index (DVI) as the sum of exposure, sensitivity and adaptive capacity, the weight of each indicator are from Table 1.
E = j = 1 n ( e j w j )
where E is the exposure for a given cell in the grid, ej represents the standardized value of indicator j in that cell, and wj is the corresponding weight of the indicator.
S = k = 1 n ( s k w k )
where S is the sensitivity for a cell in the grid, sk represents the standardized value of indicator k in that cell, and wk is the corresponding weight of the indicator.
A C = m = 1 n ( a m w m )
where AC is the adaptive capacity for a cell in the grid, am represent the standardized value of indicator m in that cell, and wm is the corresponding weight of the indicator.
D V I = E + S + A C
where DVI is the vulnerability for a given cell in the grid, and E, S and AC represent exposure, sensitivity and adaptive capacity, respectively. The higher the DVI value, the greater the vulnerability to aeolian desertification.

3.3. Vulnerability Index

The result calculated from our DVI model is a continuous value between 0 and 1, and can be classified into several degrees that represent different levels of vulnerability to aeolian desertification. To make the categories more objective and logical, we classified the data from 2000 into five categories using the Jenks natural-break classification method provided by ArcGIS. Natural breaks were selected as the display method because this method seeks to reduce the variance within classes and maximize the variance between classes [37]. Based on previous descriptions in the literature [4,38], we defined the categories as very low, low, moderate, high and very high (Table 2).

3.4. Data

All GIS analysis in this study was performed using version 10.0 of the ArcGIS software (www.esri.com).
The data required in this study was collected from several statistical databases and from published information on specific regional projects:
(1) The remote sensing data comprised Landsat Enhanced Thematic Mapper images from 2000 and Landsat Thematic Mapper images from 2005 and 2010, both with a 30-m resolution. We used the remote sensing images, which had been processed to eliminate data with excessive cloud cover or with sensor errors. The development of sand sheets and dunes can be clearly recognized at this scale in remote-sensing images and indicates the presence of aeolian desertification [39]. We selected images recorded between June and October, when vegetation grew well, because aeolian desertified lands are more easily recognized during this period. We derived the distribution of aeolian desertified land in each year by georeferencing the images, mapping the satellite data, data processing (a visually interactive interpretation method), as well as field validation [8,15,16]. Thematic maps, including land maps and geomorphologic maps, were used as supplementary data sources. The vector data was converted into raster layer by means of Conversion Tools in ArcGIS, with output raster 1 km × 1 km.
(2) We used a digital elevation model (DEM) provided by the CGIAR Consortium for Spatial Information (http://srtm.csi.cgiar.org/), which was 90 m standard map that used the Krasovsky-1940-Albers projection. The relief degree of the land surface is a comprehensive representation of the topography, and is calculated as follows [23]:
R D L S = A L T / 1000 + { [ M a x ( H ) M i n ( H ) ] × [ 1 P ( A ) / A ] } / 500
where RDLS represents the relief degree of the land surface; ALT represents the mean elevation at the center of a given cell in the grid (m), Max(H) and Min(H) represent the highest and the lowest elevations in the cell (m), respectively; P(A) represents the area of flat land in the cell (km2), which we defined as land with a slope less than 5°; and A represents the total area of the cell. The first three parameters can be obtained directly by means of neighborhood analysis in the GIS software using the DEM data. Because we used a 1 km × 1 km grid in our study, A = 1 km2.
(3) We chose NDVI to represent vegetation cover because it is one of the best-known and most effective indices [25], and is widely recognized as a suitable proxy for vegetation cover [40,41,42]. To evaluate the state of vegetation cover and its variations, we used NDVI values at a relatively coarse spatial resolution (1km) from 2000 and 2010 obtained from the Moderate Resolution Imaging Spectroradiometer (MODIS) sensor. The data set was provided by the Geospatial Data Cloud site, Computer Network Information Center, Chinese Academy of Sciences (http://www.gscloud.cn).
(4) We obtained mean annual temperatures, mean monthly wind speed, and precipitation from 34 meteorological stations in the study area and surrounding regions from China’s national meteorological data sharing network (http://data.cma.cn). Using the temperature distribution in 2000, 2005, and 2010, we produced the temperature grid layer by means of Kriging interpolation using ArcGIS. To quantify the magnitude of wind erosion, we used the model of Dong and Kang (1994), based on the following equation [24]:
C = 1 100 q = 1 12 u ¯ 3 [ ( E T P q P q ) / E T P q ] d
where C represents the intensity of wind erosion; u ¯ represents the mean monthly wind speed at 2 m above the ground; E T P q represents potential evaporation in month q; P q represents total precipitation in month q; and d represents the number of days in month q. The results of this calculation were also converted into a GIS layer.
(5) Population and GDP density data products were obtained from Data Center for Resources and Environmental Sciences, Chinese Academy of Sciences (http://www.resdc.cn), which created GIS layers for these parameters by means of spatial interpolation based on county-level GDP and population statistics, with a resolution of 1 km × 1 km.
To georeference all data to the same grid, we transformed the abovementioned data to use the Albers Equal Conical Area system (Krasovsky ellipsoid) with a central meridian at 105°E, latitude of the origin at 0°, double-standard parallel at 25°N and 47°N, and the Krasovsky-1940 geodetic datum.

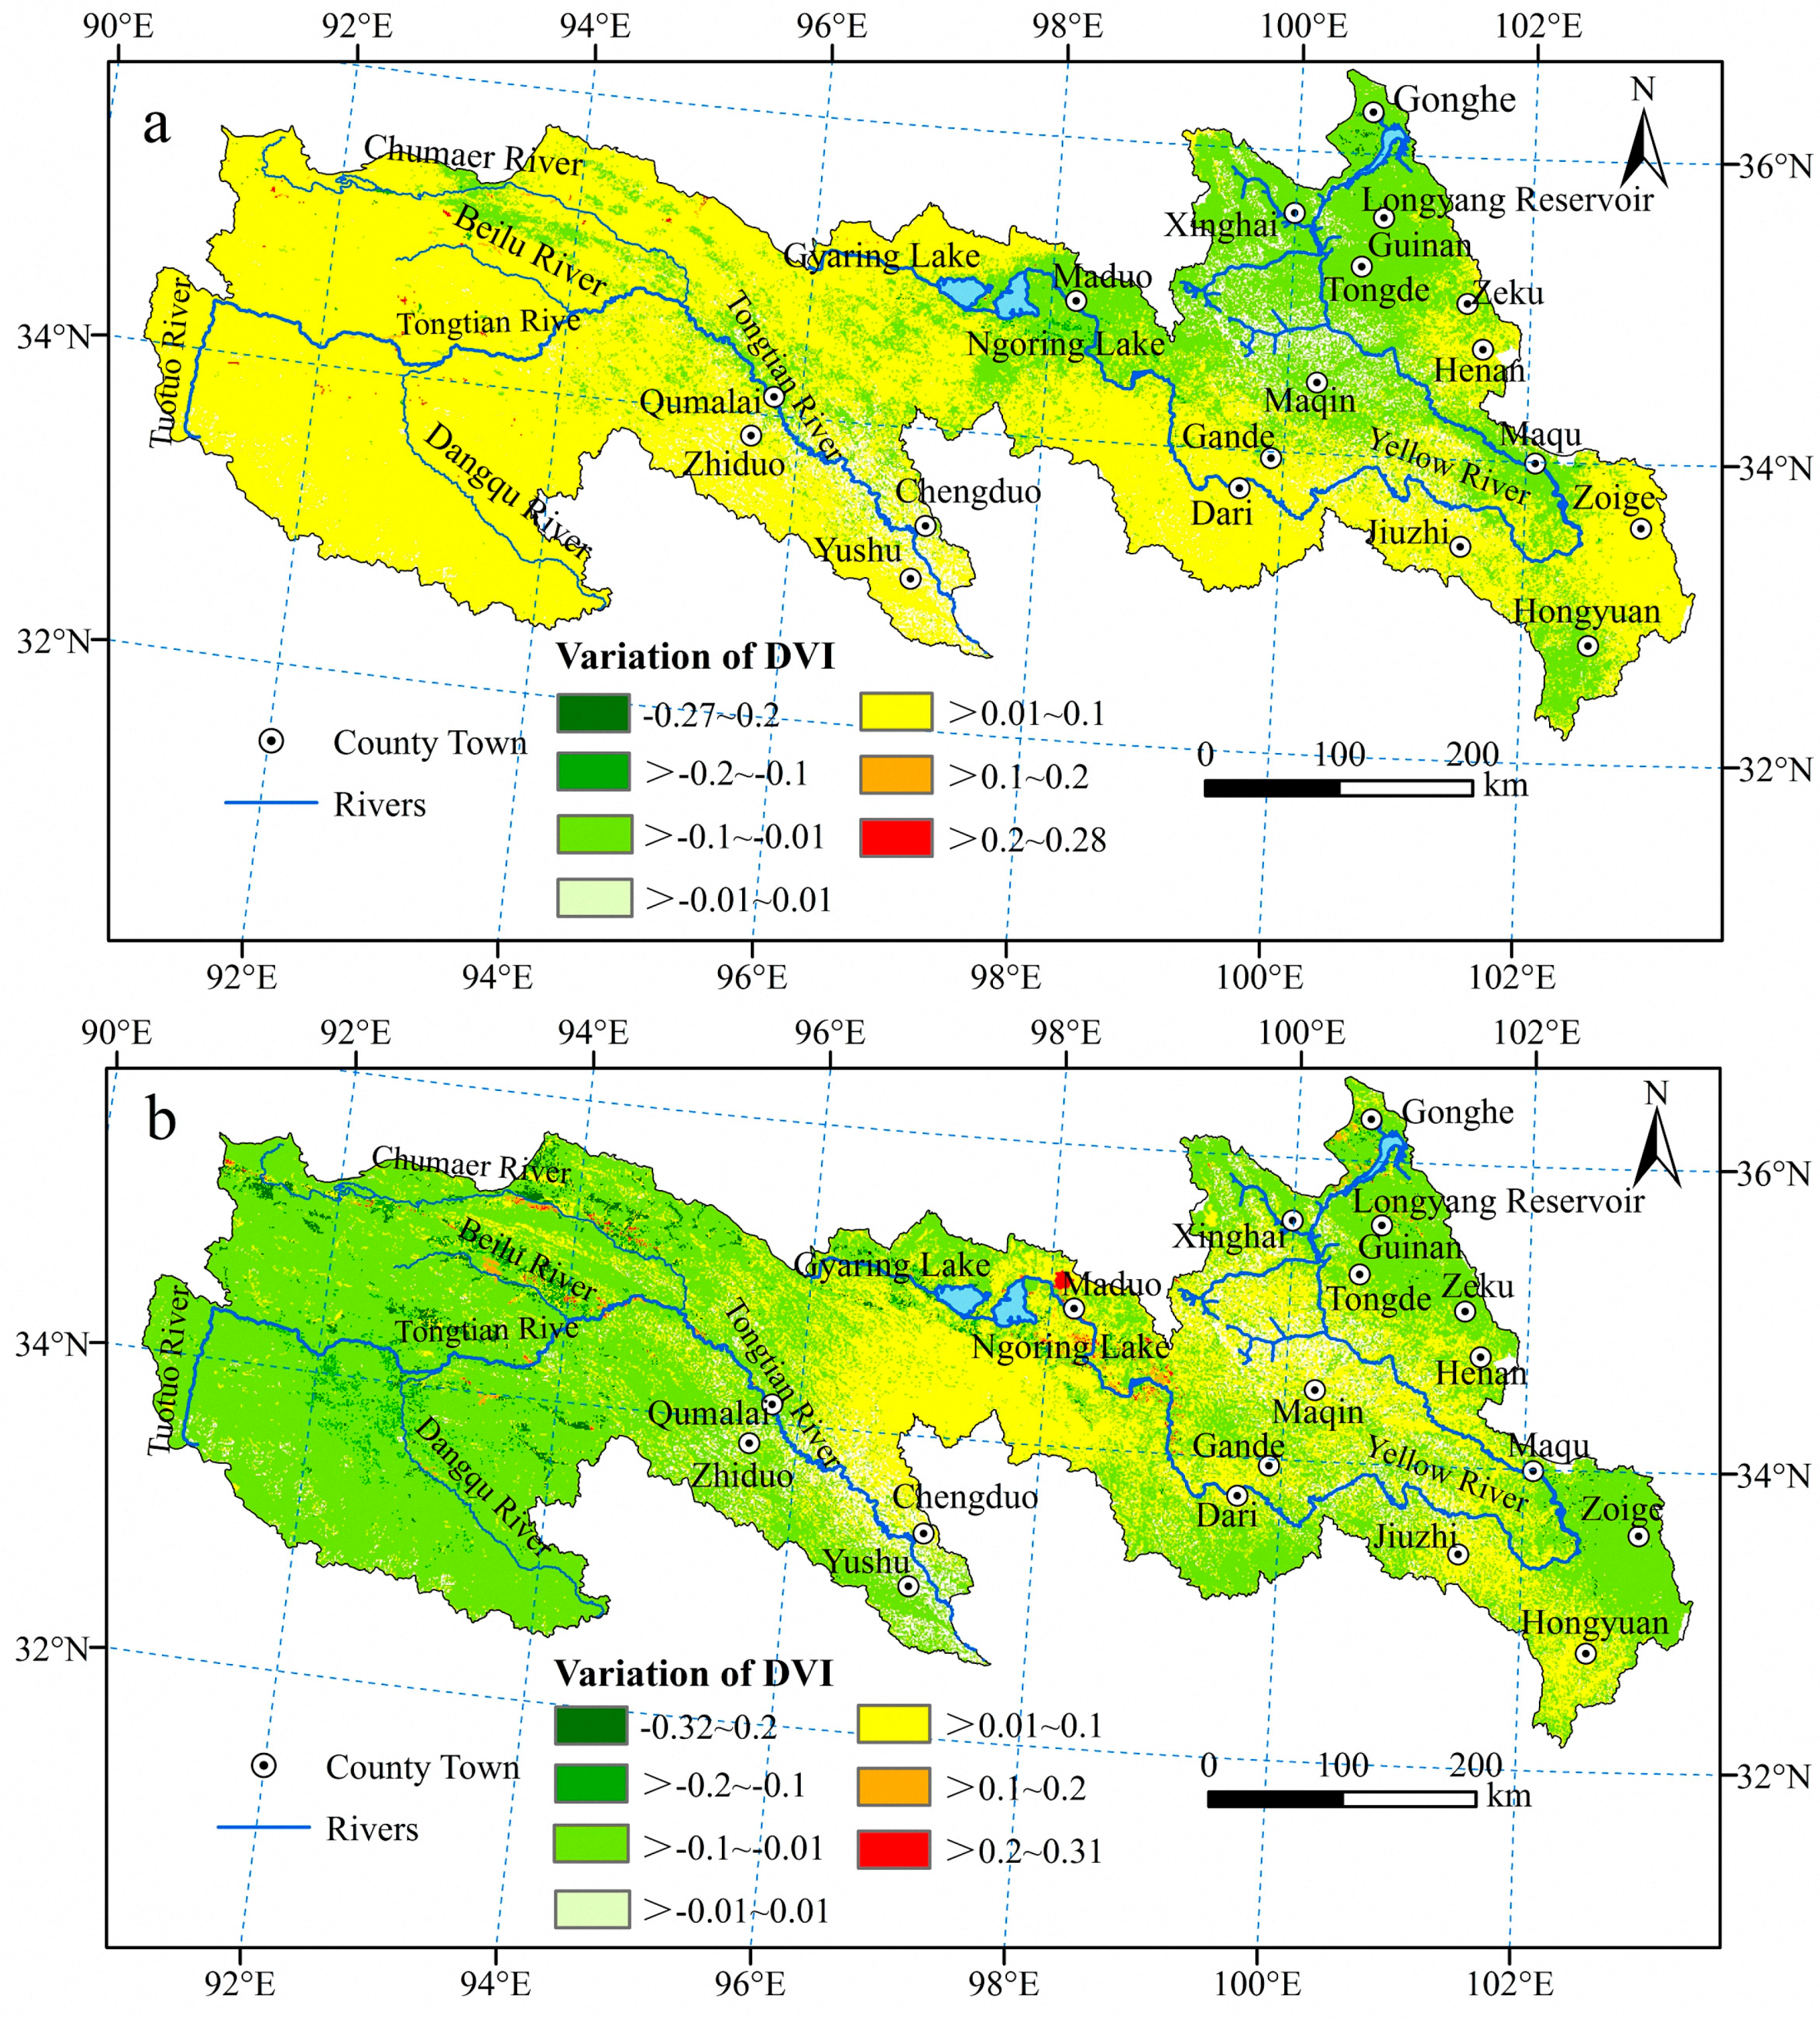
3.5. Analysis of Change Trends

To quantify the comprehensive change trends, we developed an integrated vulnerability index (IVI). IVI is calculated as follows [43]:
I V I = r = 1 5 P r × ( A r / S )
where r represents the five grades shown in Table 2; IVI is the integrated vulnerability index; Ar is the area in study area occupied by desertification grade r; S is the area of study area; and Pr is the grade value of grade r (i.e., very low vulnerability is 1, low vulnerability is 2, moderate vulnerability is 3, high vulnerability is 4, and very high vulnerability is 5).

4. Results and Discussion
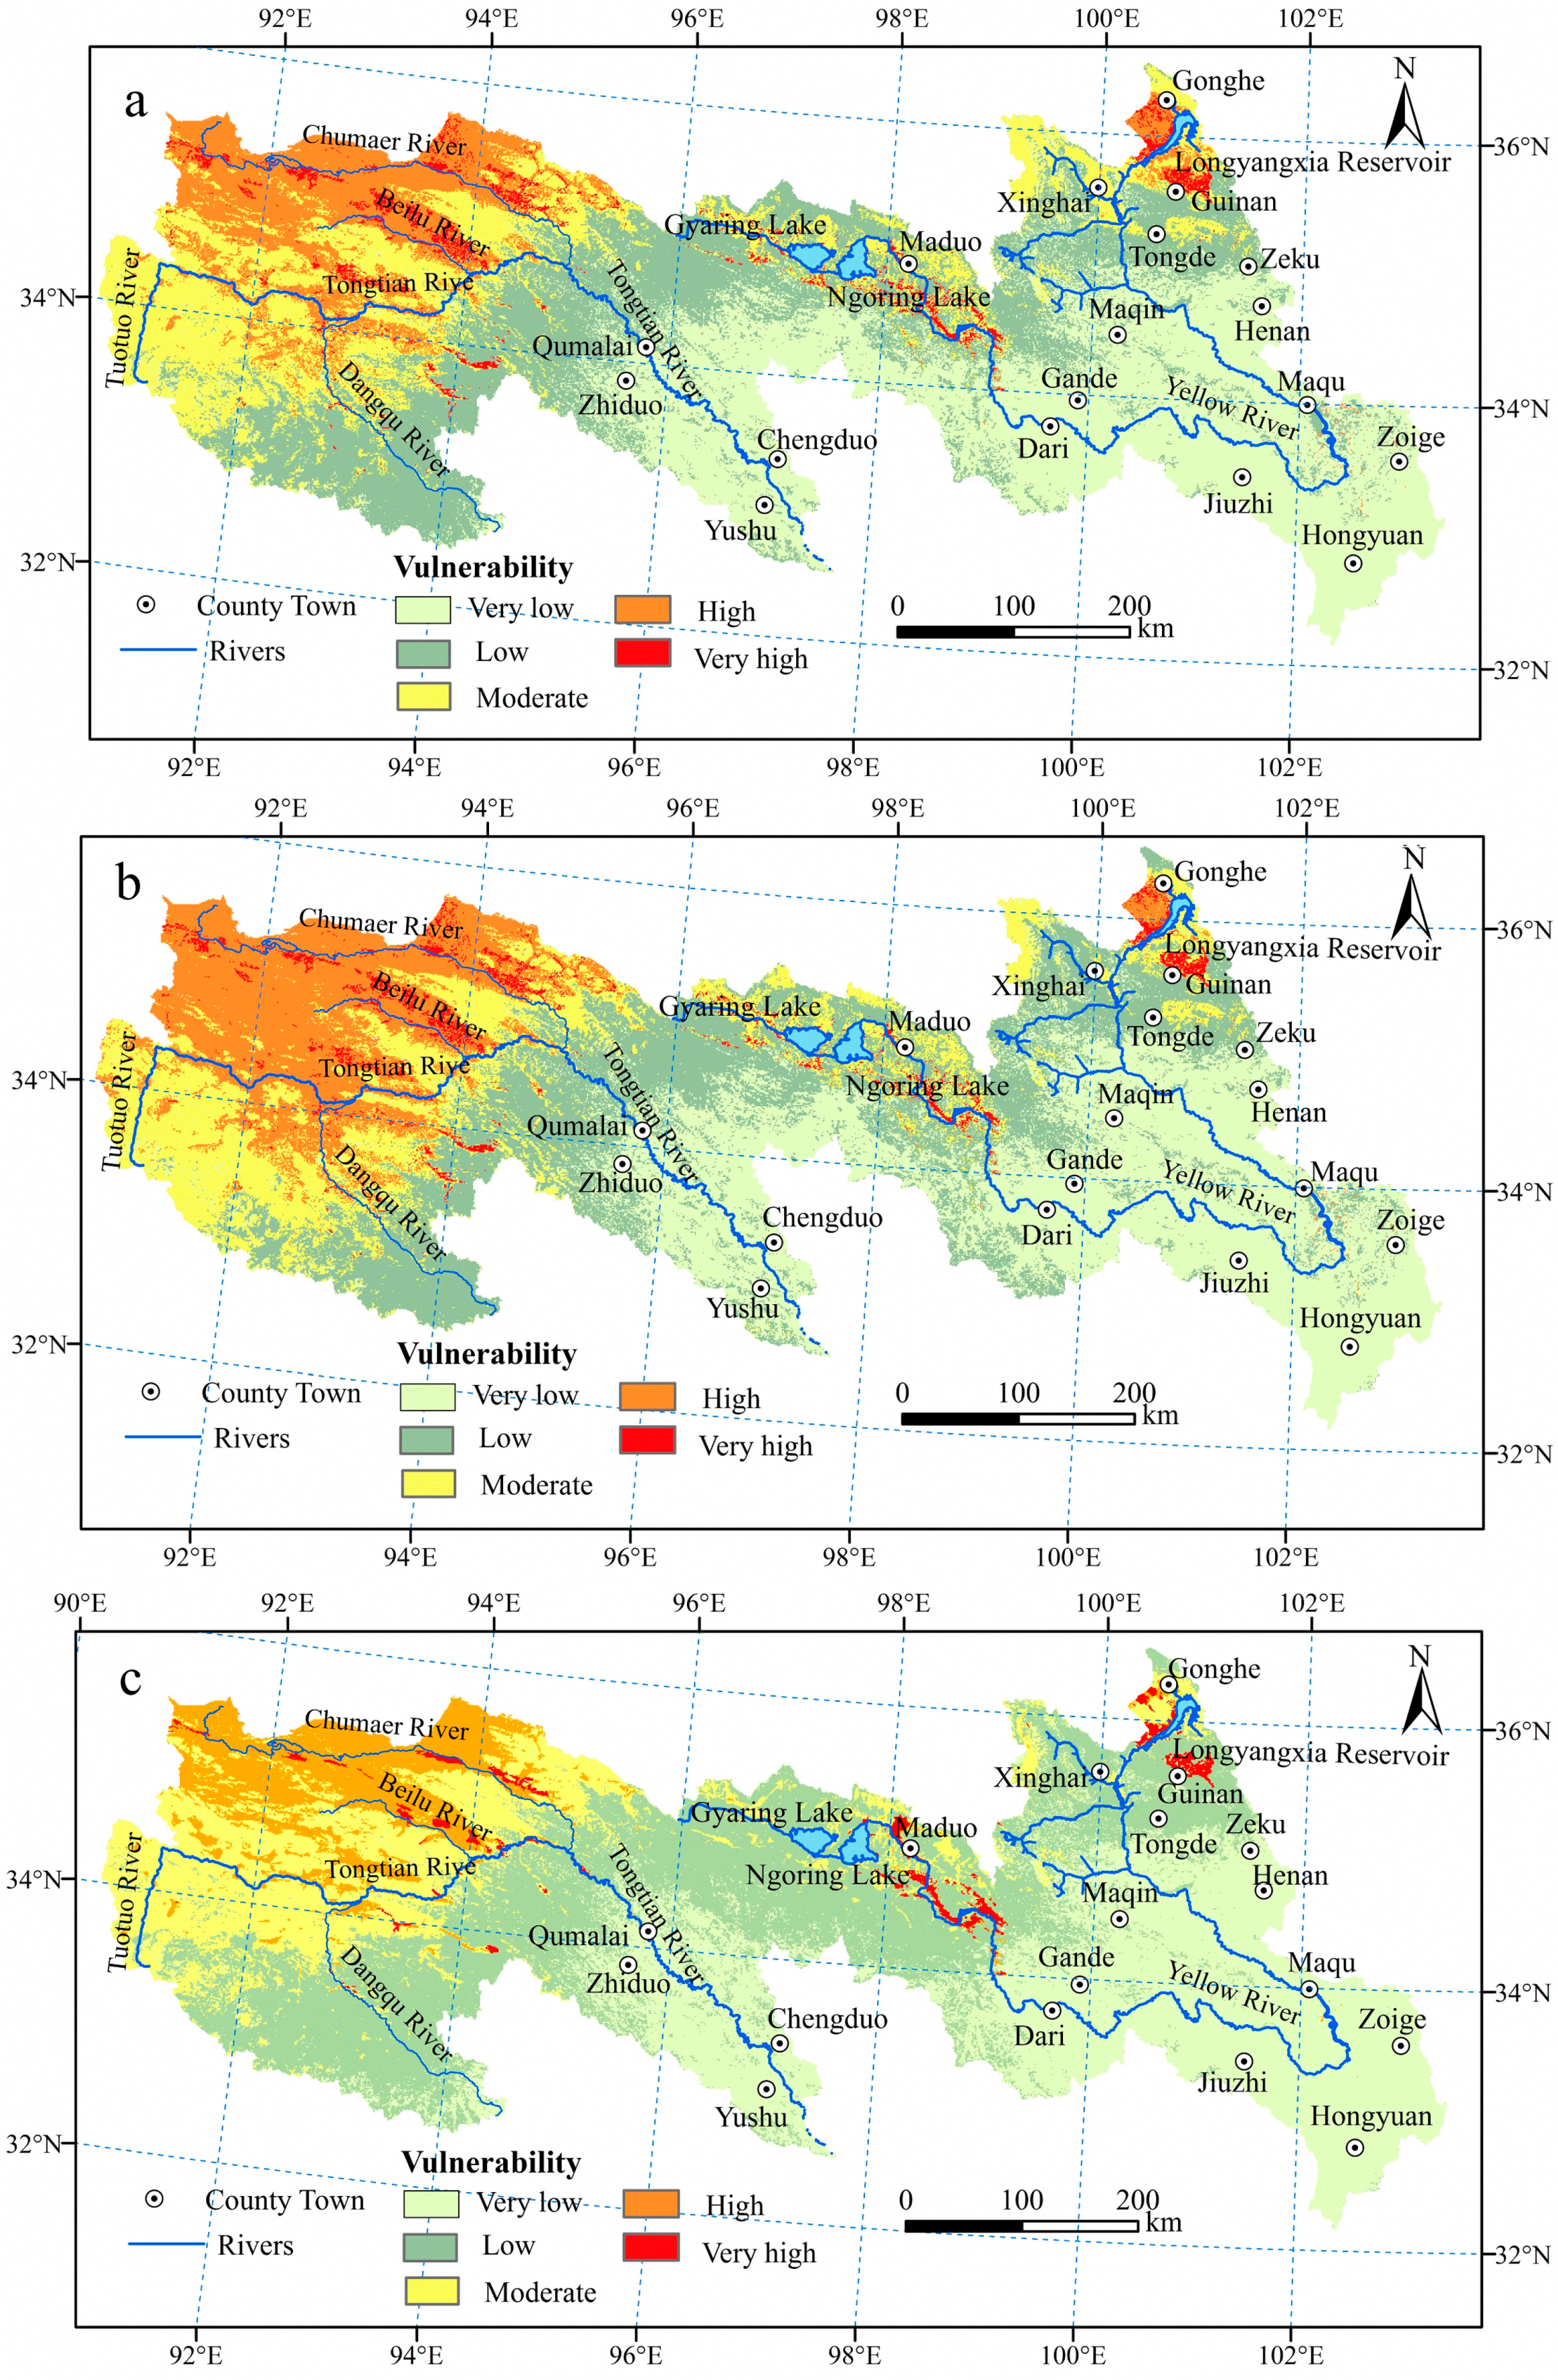
4.1. Vulnerability

Figure 3 shows the results in 2000, 2005, and 2010. In the source areas of the Yangtze and Yellow Rivers, land with very low or low vulnerability to aeolian desertification was the primary category in the three periods. Vulnerability was highest in the northwestern source areas of the Yangtze River and in the northwestern and northeastern source areas of the Yellow River, and these areas were surrounded by scattered areas of moderate to high vulnerability. In the source areas of the Yangtze River, the most vulnerable land was mainly distributed along the Chumaer River, Beilu River and the area where the Dangqu River joins the Tuotuo River, as well as in the flat land around lakes, where the meandering rivers create rich deposits of loose sandy sediments. In the source areas of the Yellow River, the most vulnerable land was distributed primarily in the wide valleys of the Yellow River, in the flat land around lakes such as Gyaring Lake and Ngoring Lake, and around the Longyangxia Reservoir. In the Zoige Basin, the most vulnerable land was distributed in the northern part of the basin, mainly in Maqu County and Zoige County.
We also calculate the detailed area and percentage of each vulnerability category over the whole study area and three sub-regions (Table 3). In the source areas of the Yangtze and Yellow Rivers, land with very low or low vulnerability to aeolian desertification was widely distributed, accounting for 64%, 62%, and 71% of the total area in 2000, 2005, and 2010, respectively. Moreover, in the source area of the Yangtze River, land with low and moderate vulnerability accounted for most of the area, with 59.6%, 52.7%, and 64.4% of this sub-region in 2000, 2005, and 2010, respectively. In the source area of the Yellow River, land with very low and low vulnerability was widely distributed, accounting for 81.8%, 83.7%, and 89.1% in 2000, 2005, and 2010, respectively. In the Zoige Basin, significant areas of vulnerability to aeolian desertification were found only in the very low, low, moderate, and high categories in the three periods.

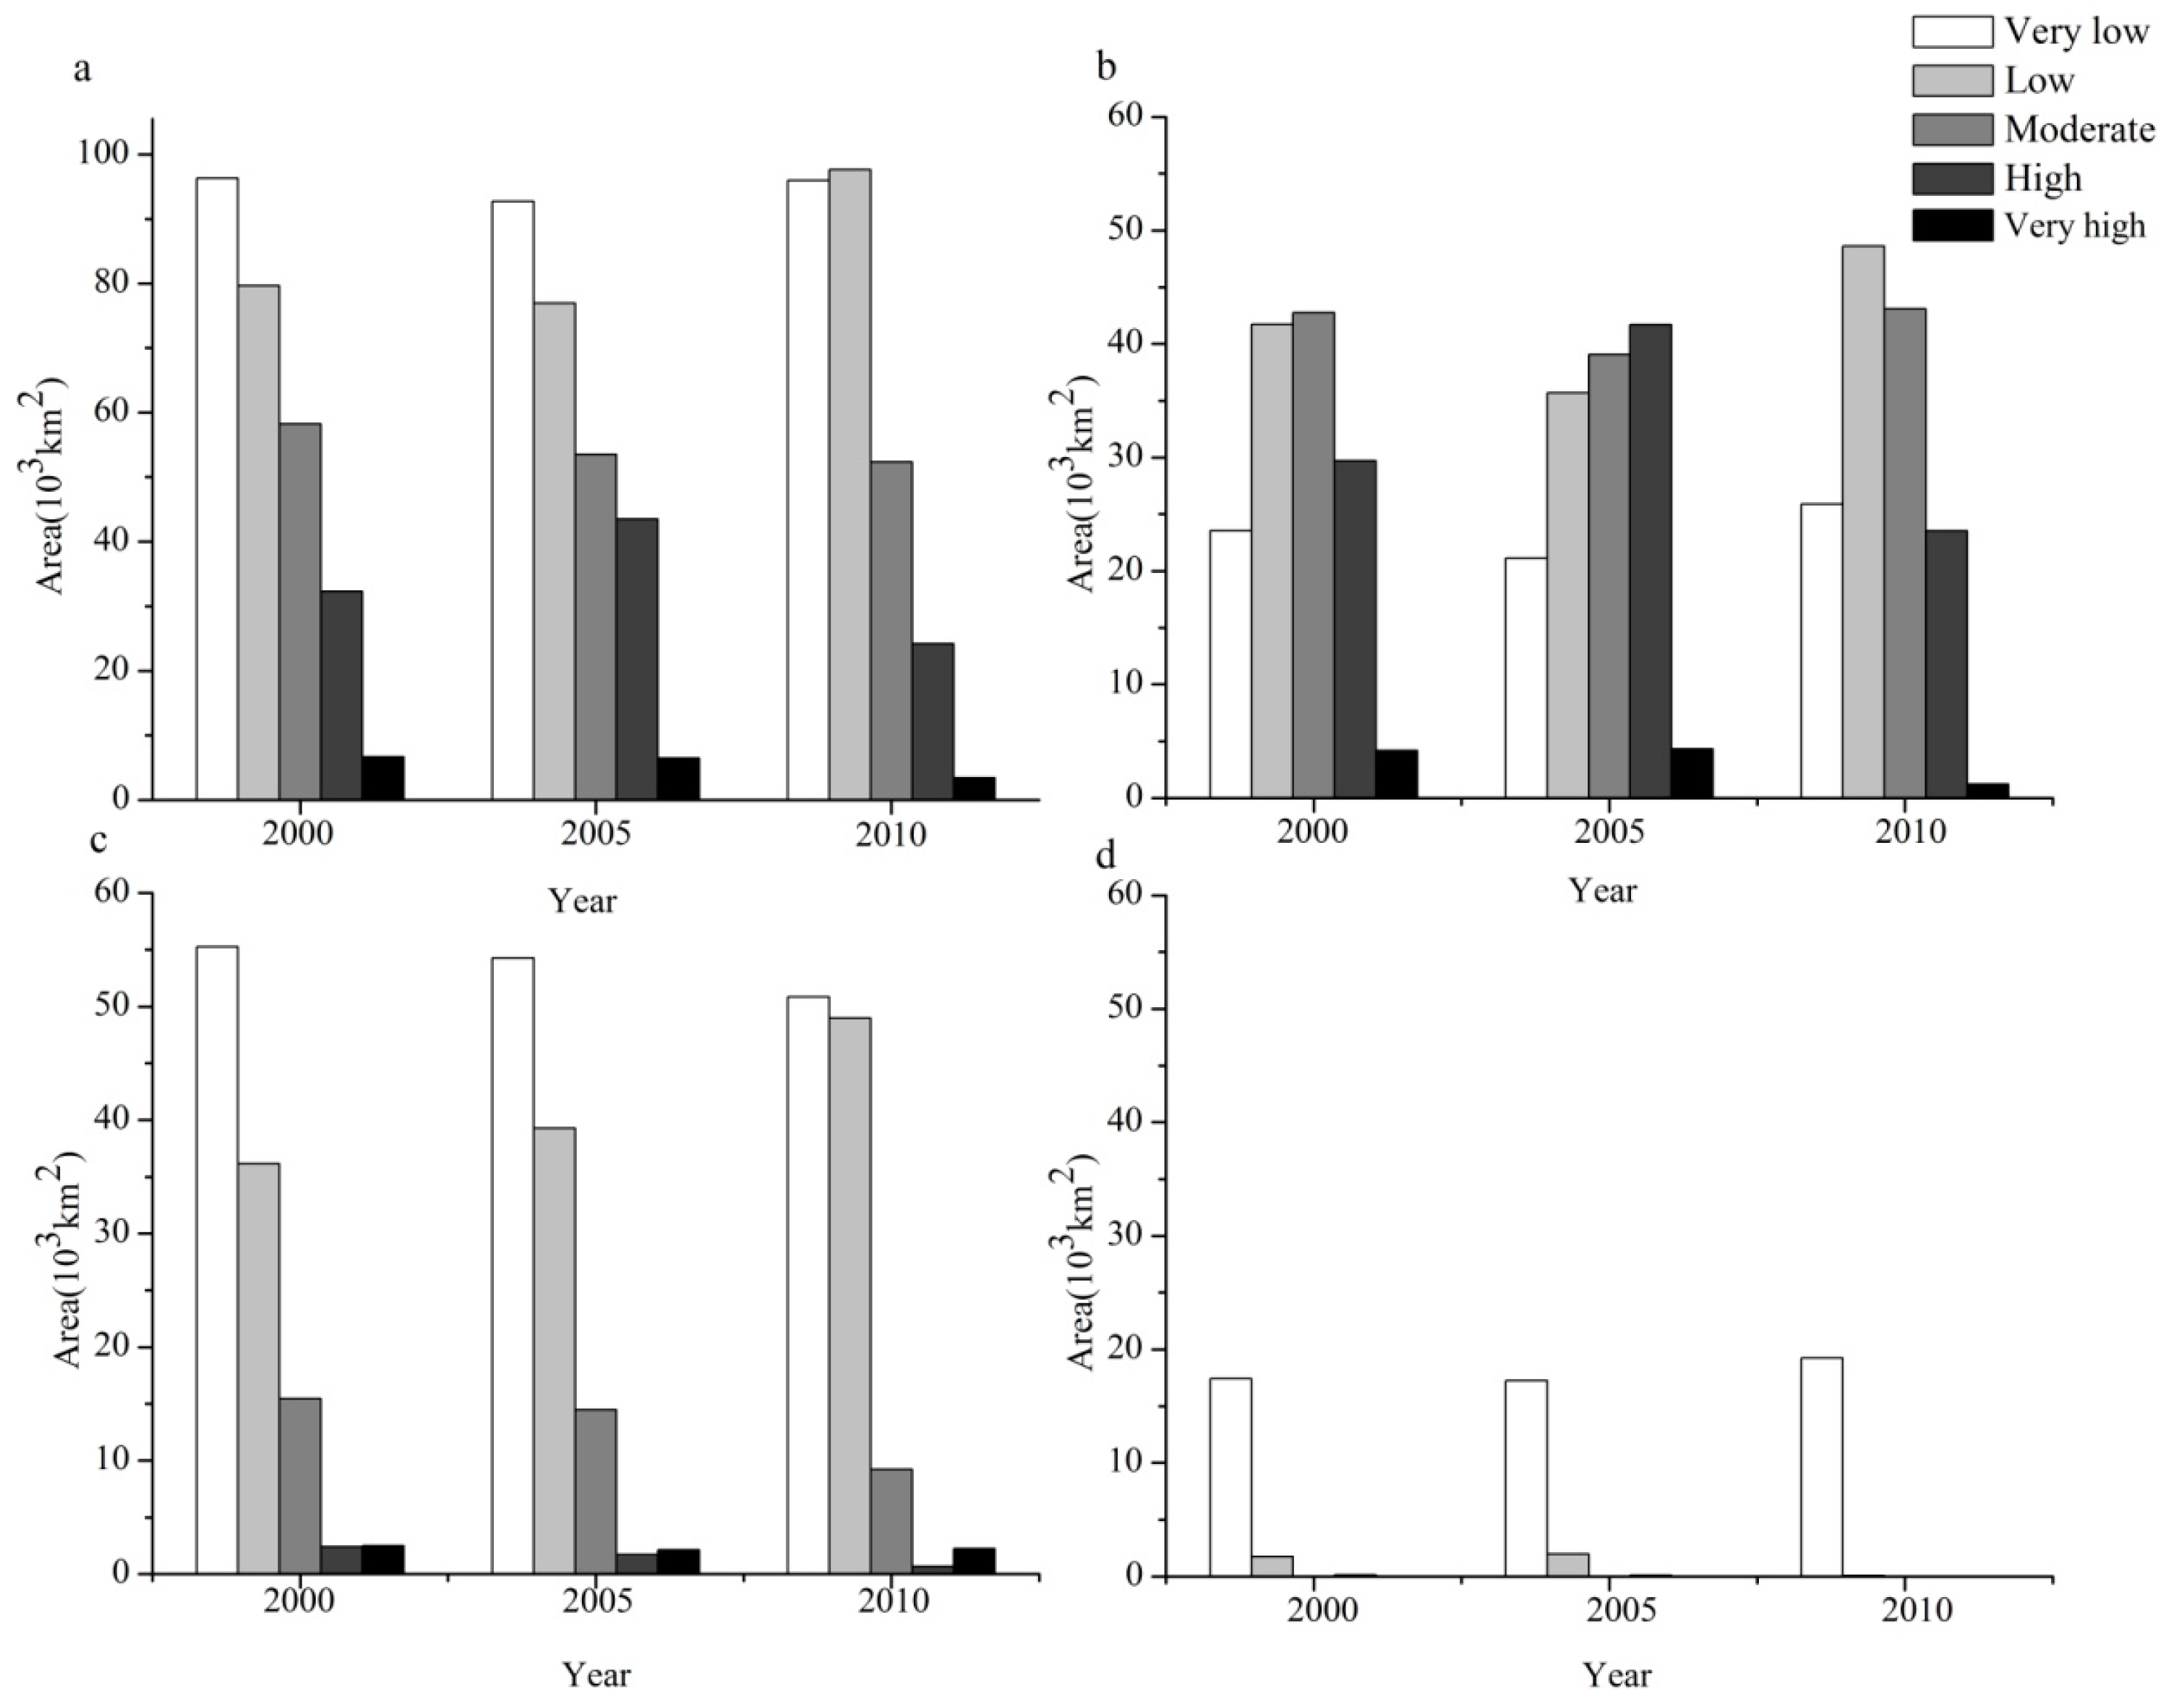
4.2. Changes in Vulnerability

Table 4 summarizes the IVI values for the whole study area and its three sub-regions. Overall, the situation in 2005 was worse than that in 2000; that is, overall vulnerability to aeolian desertification increased. From 2000 to 2005, vulnerability also increased in the source areas of the Yangtze River and the Zoige Basin, but decreased in the source areas of the Yellow River. From 2005 to 2010, vulnerability to aeolian desertification decreased over the whole study area and three sub-regions. However, all changes were relatively small, suggesting little overall change in vulnerability.
The areas in each vulnerability category showed different trends from 2000 to 2010 in the whole study area and three sub-regions (Figure 4). For the study area as a whole from 2000 to 2005, the areas of very low, low, and moderate vulnerability decreased by 1.4%, 1.0%, 1.7%, respectively, whereas the area of high vulnerability increased by 4.1% (Table 3). The small increase in vulnerability shown in Table 4 results from a near balance between the decreases in the areas with very low, low, and moderate vulnerability and the increase in the area with high vulnerability. From 2005 to 2010, the areas of very low and low vulnerability increased by 1.2% and 7.5%, while the areas of moderate, high, and very high vulnerability decreased by 0.5%, 7.1%, 1.1%, respectively (Table 3). The noticeably large decrease in the area with high vulnerability may lead to overall decreases in vulnerability, as shown in Table 4.
In the source areas of the Yangtze River, the areas with very low, low, and moderate vulnerability decreased by 1.7%, 4.2%, and 2.7%, respectively (Table 3). At the same time, the areas with high and very high vulnerability increased by 8.5% and 0.1%, respectively. This suggests that areas of desertified land with very low, low, and moderate vulnerability are likely to gradually convert into land with high or very high vulnerability, leading to overall increasing vulnerability of this sub-region. From 2005 to 2010, the areas with very low, low and moderate vulnerability increased by 3.3%, 8.9%, and 2.8%, respectively, and the areas with high and very high vulnerability decreased by 12.9% and 2.1%, respectively (Table 3). We believe that the decrease in the area with high vulnerability largely contributed to the overall decreasing vulnerability of the source areas of the Yangtze River between 2005 and 2010, as shown in Table 4.
In the source areas of the Yellow River, the areas of very low, moderate, high, and very high vulnerability decreased by 0.9%, 0.9%, 0.7% and 0.3%, respectively, whereas the area with low vulnerability increased by 2.8% between 2000 and 2005 (Table 3). In contrast with the trend for the source areas of the Yangtze River, the area of land with the most serious vulnerability decreased slightly during this period in the source areas of the Yellow River. This suggests a certain decrease in the vulnerability to aeolian desertification in the source areas of the Yellow River between 2000 and 2005. Between 2005 and 2010, the areas with moderate and high vulnerability showed a small decrease, by 4.6% and 0.9%, respectively, and the areas with very low, low and very high vulnerability increased, by 3.2%, 8.6%, and 0.1%, respectively (Table 3), leading to continuous decrease in vulnerability of this sub-region.
On the other hand, in the Zoige Basin, between 2000 and 2005, the area of land with very low and high vulnerability decreased slightly, by 0.9% and 0.2%, respectively, and the area with low vulnerability increased slightly, by 1.1% (Table 3). Thus the vulnerability to aeolian desertification remained relatively stable between 2000 and 2005. The reason may be that fixed dunes (sands) and semi-fixed dunes (sands) are the main desertification features in the landscape of the Zoige Basin, and the area of aeolian desertification decreased slightly from 2000 to 2005 [17]. Between 2005 and 2010, the areas with low, moderate, and high vulnerability decreased by 9.7%, 0.1%, and 0.5%, respectively, and the area with very low vulnerability increased substantially, by 10.3% (Table 3), contributing to the decrease in vulnerability of the Zoige Basin during this period. The reason may be that the area of aeolian desertification decreased sharply between 2005 and 2010 [17].
The change in vulnerability can be analyzed by subtracting DVI in 2000 from DVI in 2005, and 2005 from 2010; positive and negative values indicate increased and decreased vulnerability, respectively. We mapped the spatial distribution of DVI trends during the study period. Figure 5 shows the spatial distribution of the changes in vulnerability (DVI) to aeolian desertification between 2000 and 2005 (Figure 5a), and between 2005 and 2010 (Figure 5b). From 2000 to 2005, the changes in vulnerability (DVI) to aeolian desertification in most of the study area were positive. In the source areas of the Yangtze River, a slight increase in vulnerability occurred in most of the region, and vulnerability values decreased slightly in the river valleys, especially along the Chumaer and Tuotuo Rivers. In the source areas of the Yellow River, areas with a slight decrease in vulnerability were distributed in the northwestern and northeastern parts of this sub-region, primarily in Gonghe, Xinghai, Guinan, and Tongde Counties, and parts of Maduo County. In the Zoige Basin, the northern and southern parts of the region show a slight decrease in vulnerability to aeolian desertification. In contrast, from 2005 to 2010, the changes in vulnerability (DVI) to aeolian desertification in most of the study area were negative. In the source areas of the Yangtze River, a slight decrease in vulnerability occurred in most of the region, while a slight increase in vulnerability was distributed mainly in the eastern part of this sub-region. At the same time, a few areas showed a moderate increase in vulnerability, especially along the Beilu, Chumaer, and Tongtian Rivers. In the source area of the Yellow River, a slight increase in vulnerability was distributed across the western and middle part of the region. Among these, increasing vulnerability shows moderate and high in a few areas of Maduo County. In the Zoige Basin, the northern part of the region shows a slight decrease in vulnerability to aeolian desertification.

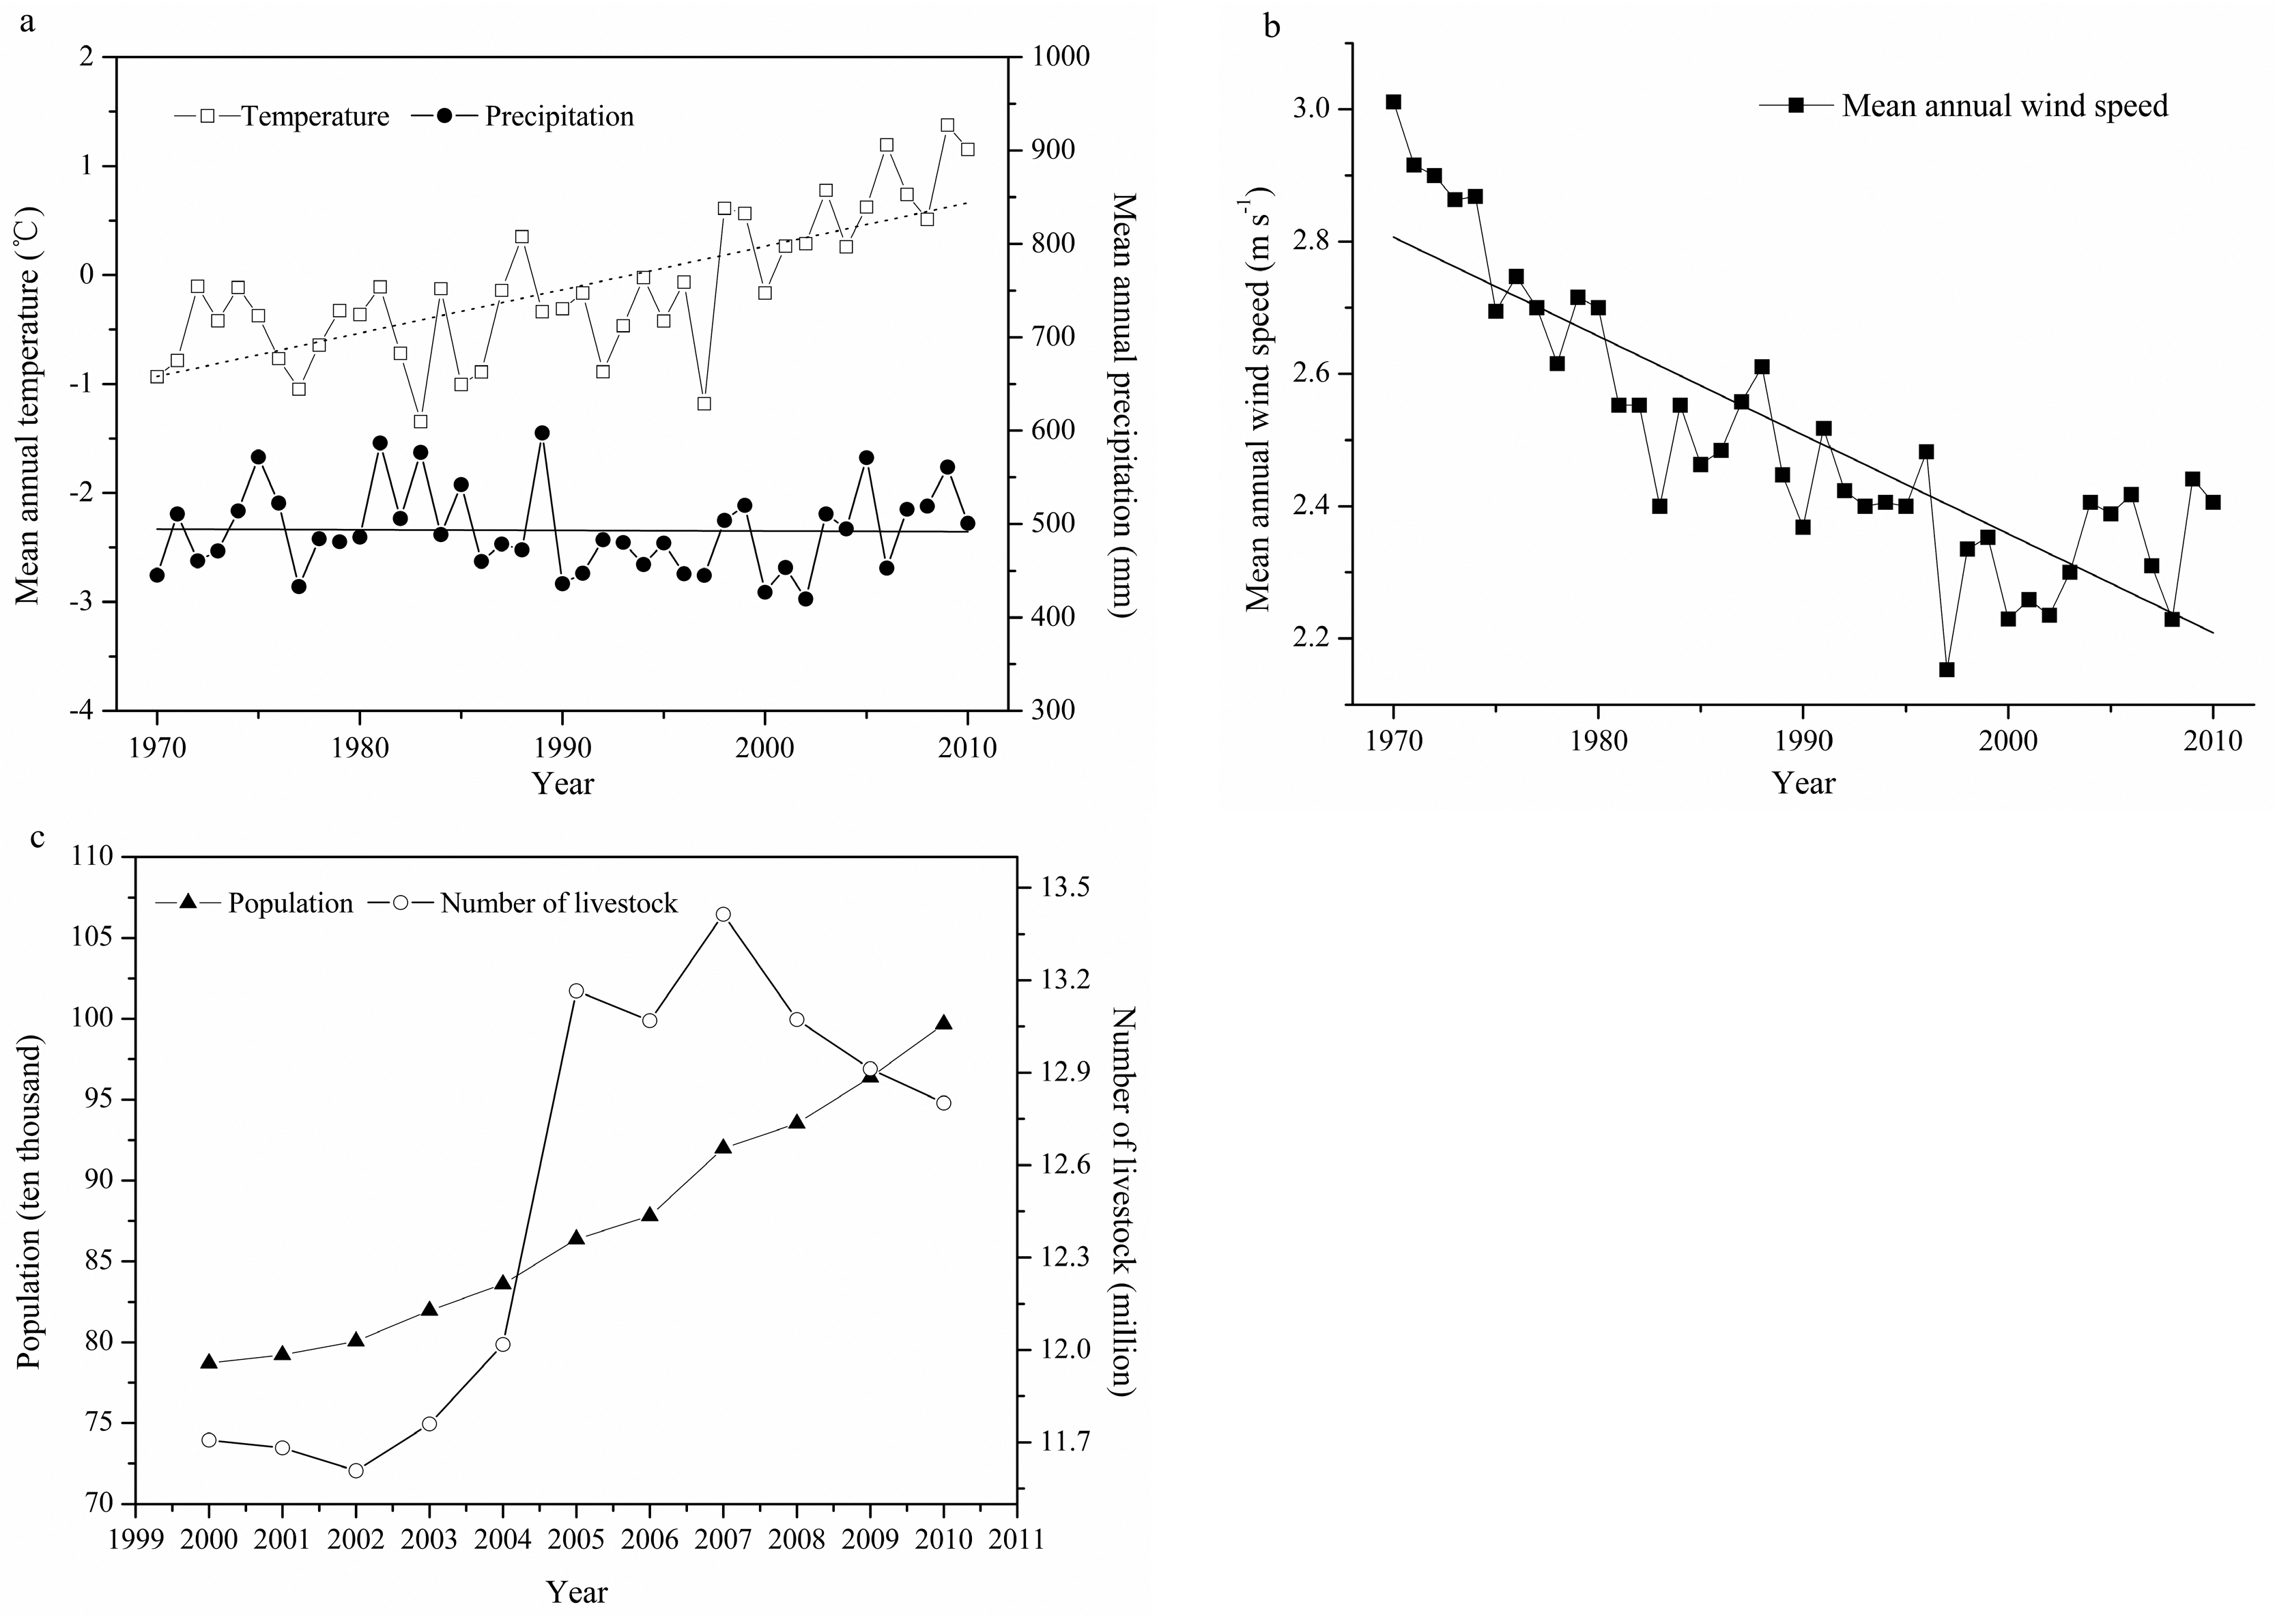
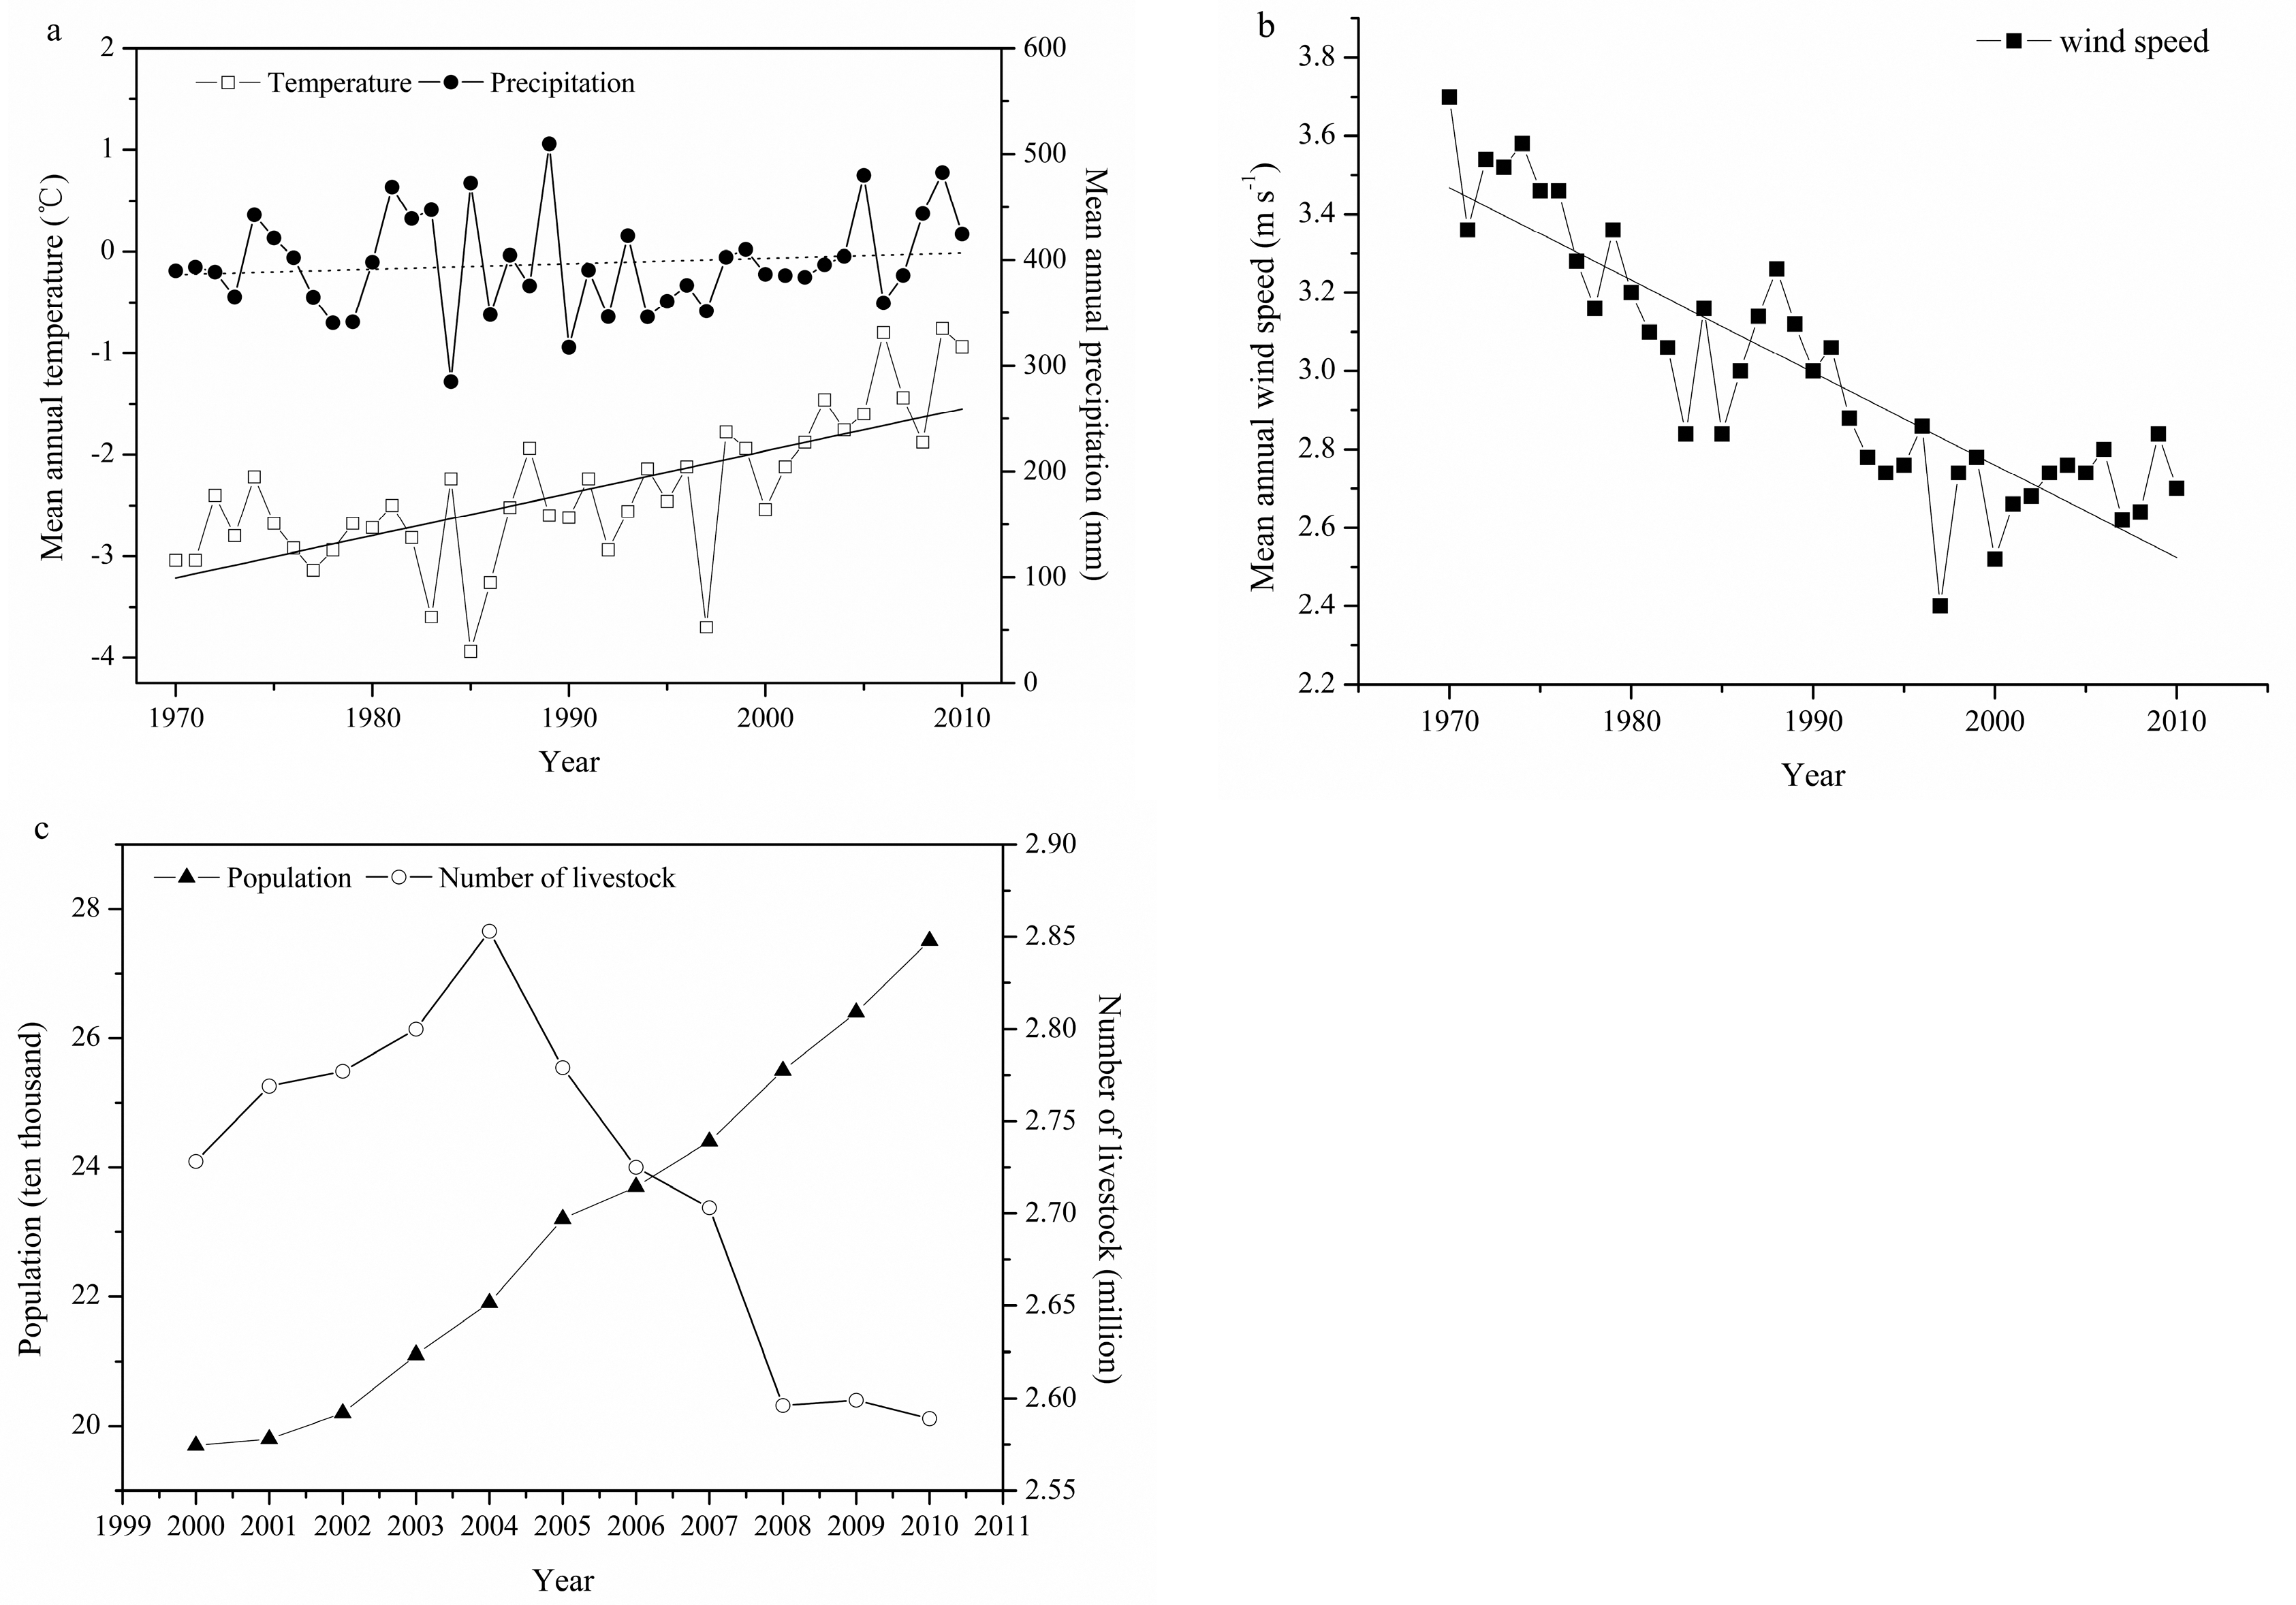
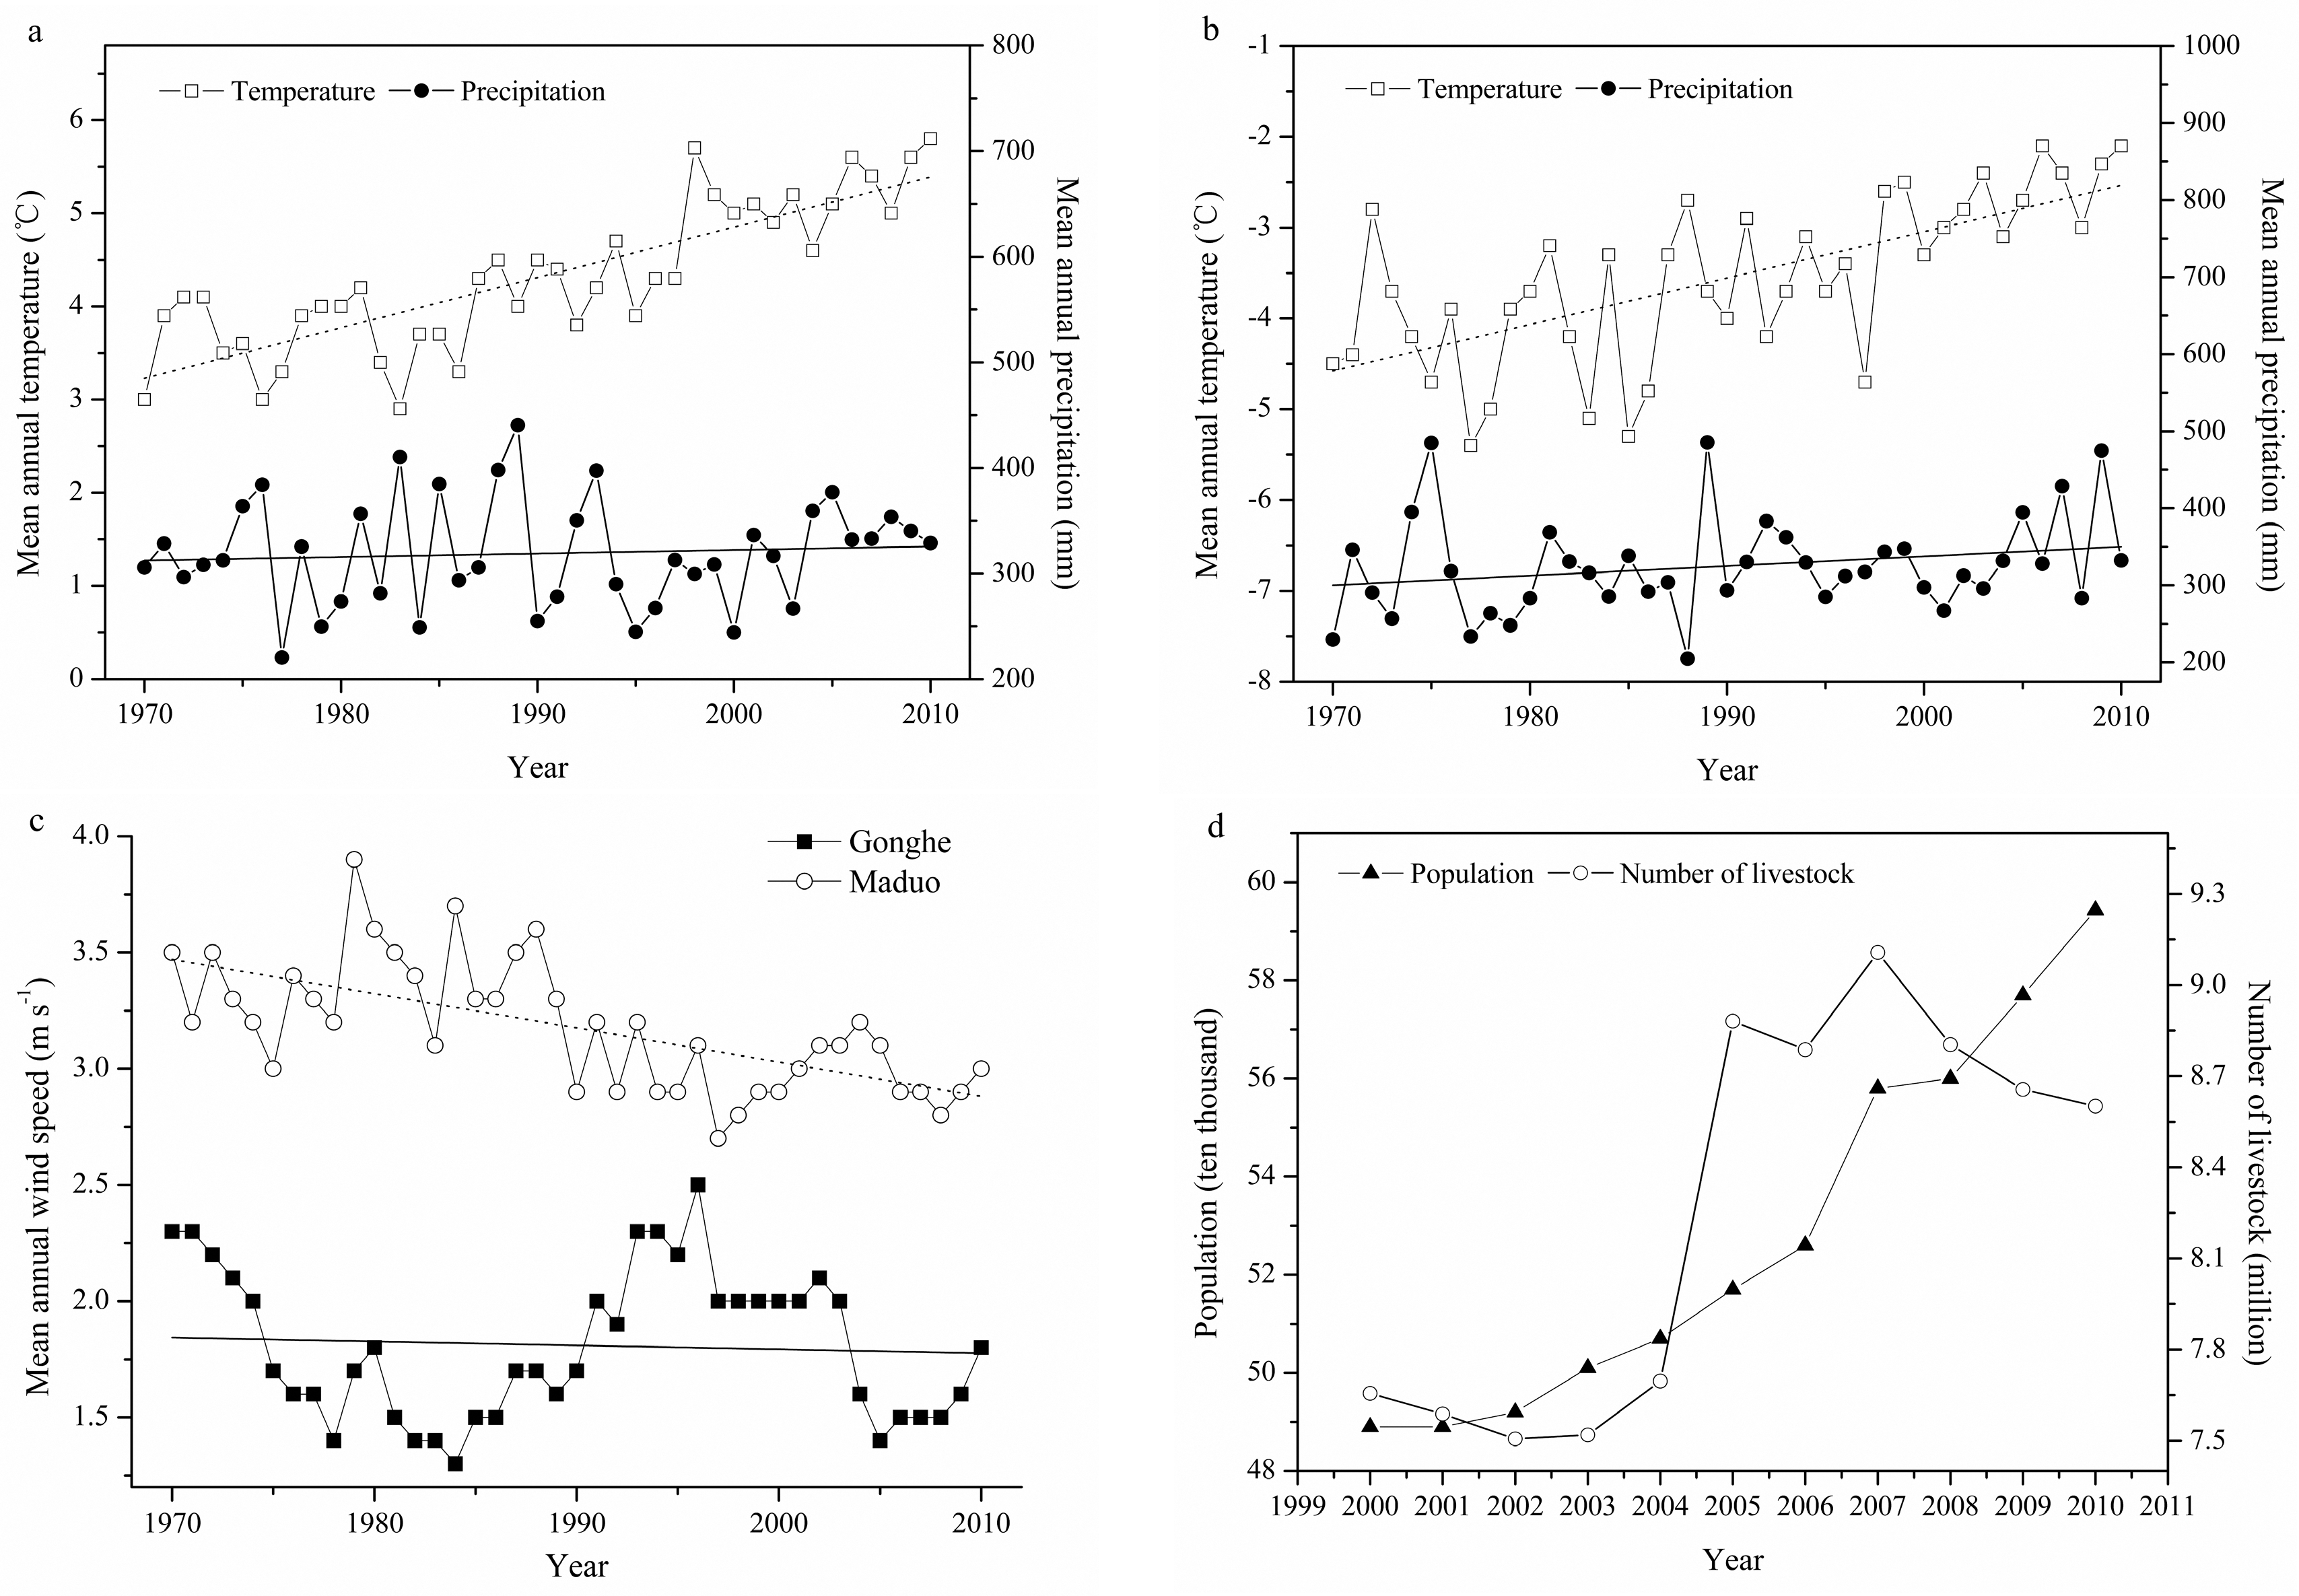
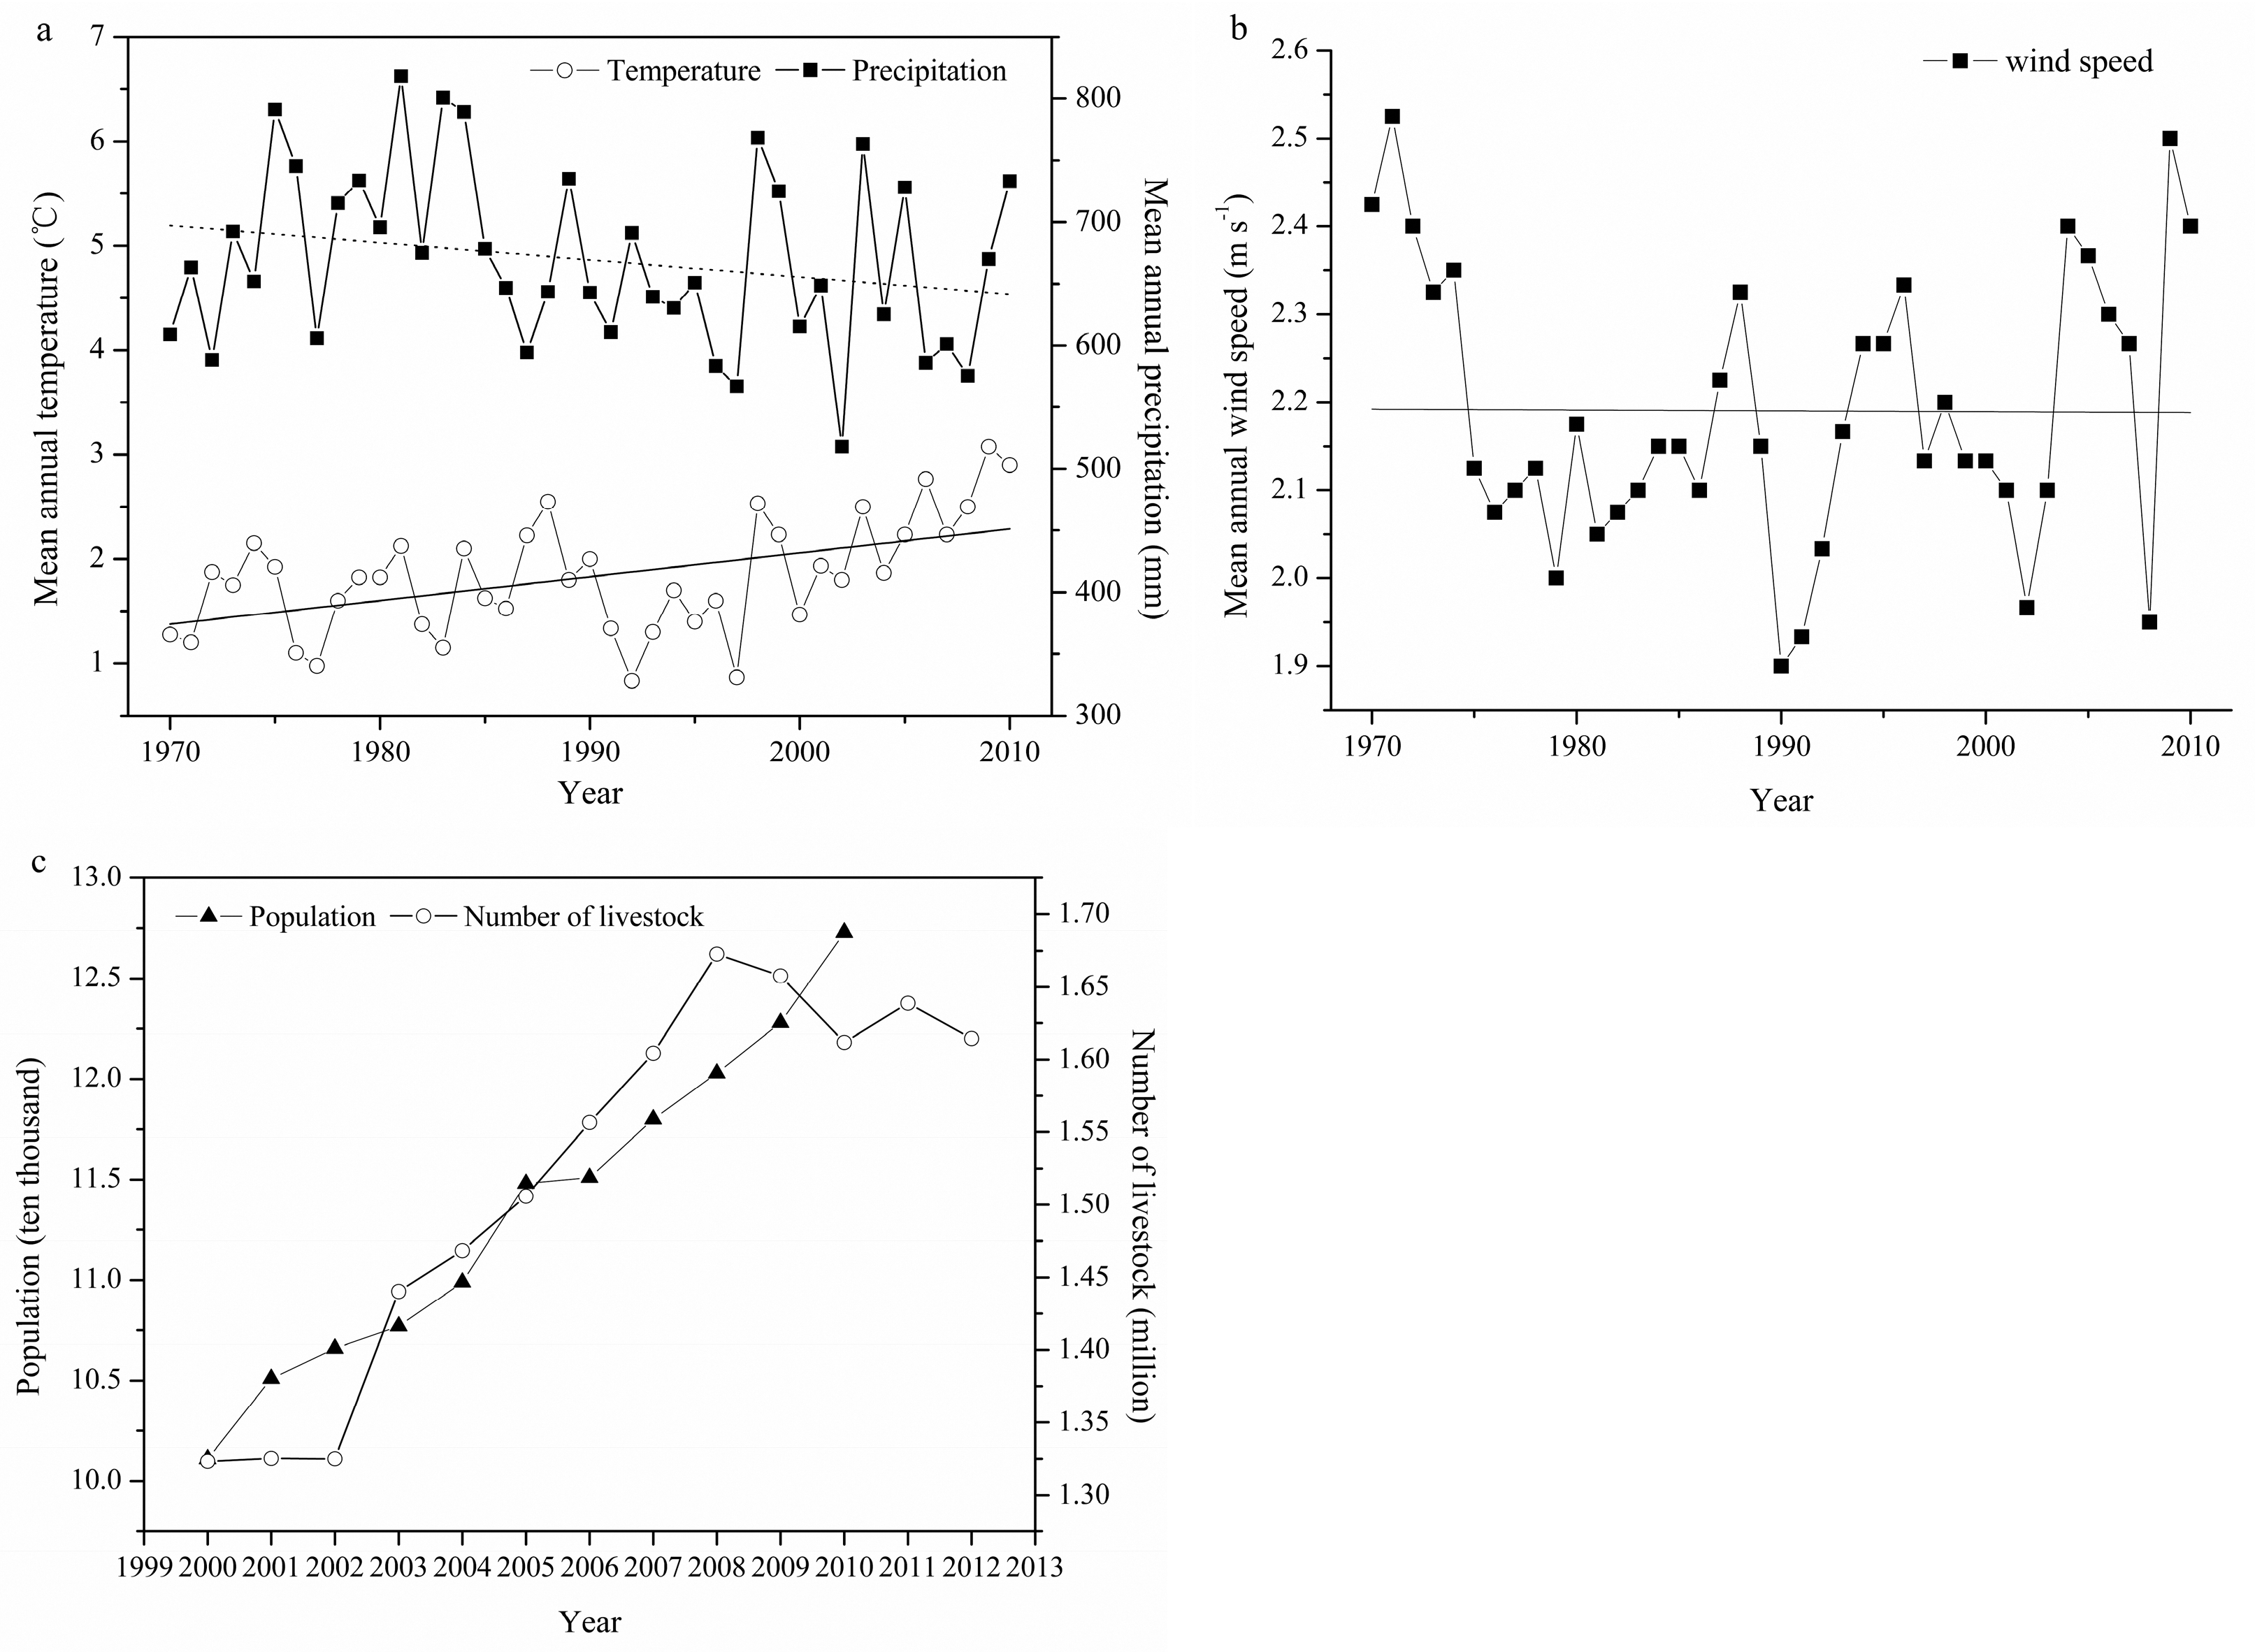
4.3. Driving Forces Responsible for Changes in the Vulnerability to Aeolian Desertification

Loose, dry surface sediments and strong winds are primary factors responsible for aeolian desertification, which is exacerbated by periodic drought (often caused by high temperatures) and by intensive human activities. The vulnerability of the study area to aeolian desertification originates from its cold and dry climate, which result from its high altitude, since this climate greatly reduces vegetation growth, thus, when vegetation is damaged or removed, it recovers slowly or not at all. This may be exacerbated by climate change.
Increases in temperature, which can accelerate melting of frozen soil, can also promote the expansion of aeolian desertification. Increasing temperature accelerates the degradation of permafrost, leading to increased drainage and drying of the soils, and eventually to aeolian desertification [44]. In the source areas of the Yangtze and Yellow Rivers, obvious increases (0.40 °C per decade) in annual mean temperature have been evident between 1970 and 2010 (Figure 6a), and coincide with the overall warming trend (an increase of 0.34 °C per decade in maximum temperature and 0.37 °C per decade in minimum temperature in winter; 0.29 °C per decade in maximum temperature and 0.36 °C per decade in minimum temperature in summer; and 0.13 °C per decade in maximum temperature and 0.28 °C per decade in minimum temperature in spring [45]) for the Tibetan Plateau over the same period. Particularly, the temperature increase between 2000 and 2010 was higher, with an average rate of 1.14 °C per decade.
Decreased wind speed is conducive to a reversal of aeolian desertification because it reduces the erosive force on the soil. The annual mean wind speed in the study area has shown an overall decreasing trend between 1970 and 2010 (Figure 6b), at a rate of 0.15 m·s−1 per decade. Moreover, the annual mean wind speed increased with average rate of 0.15 m·s−1 per decade between 2000 and 2010.
The increase in precipitation would benefit vegetation growth and soil moisture retention, thereby reducing the occurrence of aeolian desertification. Previous studies documented that the response of aeolian desertification to precipitation has a time lag [46], which was mainly reflected in the response of vegetation coverage to precipitation [29]. In the whole study area, the mean annual precipitation has shown a generally feeble decrease between 1970 and 2010 (Figure 6a), with an average rate of 0.69 mm per decade. However, between 2000 and 2010, the mean annual precipitation increased perceptibly, with an average rate of 96.76 mm per decade.
Although natural factors, such as climate variations, provide the background for the development of aeolian desertification, human disturbance appears to be an important factor responsible for changes of vulnerability to aeolian desertification in the source areas of the Yangtze and Yellow Rivers. The statistical data indicate that the total population in the whole areas increased from 7.87 × 10⁵ to 9.97 × 10⁵ from 2000 to 2010 (26.7% of the 2000 population) (Figure 6c). At the same time, the number of livestock in the source region increased correspondingly from 11.71 million in 2000 to 12.8 million in 2010, including a considerable increase before 2008 and then a slight decrease after 2008 (Figure 6c).
To further understand the causes of variation in the vulnerability to aeolian desertification, it is necessary to discuss the dominant factors that affected this vulnerability in the three sub-regions of the study area. In the source areas of the Yangtze River, vulnerability to aeolian desertification showed an increasing trend between 2000 and 2005, and showed a decreasing trend between 2005 and 2010. Climatic factors (and especially temperature increases) have played a major role in the increased vulnerability to aeolian desertification, and human activities were only a minor contribution. Regional meteorological data show that the mean annual wind speed decreased at a mean rate of 0.24 m·s−1 per decade from 1970 to 2010 (Figure 7b), mean annual precipitation increased at an average rate of 5.14 mm per decade (Figure 7a), and the mean annual temperature increased at an average rate of 0.42 °C per decade (Figure 7a). Particularly, it was observed that the mean annual temperature increased more rapidly between 2000 and 2010 with an average rate of 1.31 °C per decade, which is much greater than the mean global rate of increase with an average rate of 0.03 to 0.06 °C per decade at the same time [47]. Although the decreasing wind speed and increasing precipitation should decrease the vulnerability of this region, the rapid temperature increases have led to rapid degradation of frozen soil in the 129,946 km2 of discontinuous permafrost in this sub-region, accounting for 91.3% of total land area, and nearly all of the desertified lands are found in areas with discontinuous permafrost.
In addition, the population in the source area of the Yangtze River increased from 1.97 × 10⁵ to 2.75 × 10⁵ from 2000 to 2010 (Figure 7c). Although the population increased, the average population density in this region is still at a low level, and little human activity occurred in places where aeolian desertification vulnerability increased during the study period. Meanwhile, the number of livestock in this sub-region increased before 2004, and then decreased rapidly from 2.85 million in 2004 to 2.6 million (Figure 7c). Hence, temperature increases were the dominant factor responsible for increased vulnerability to aeolian desertification in the source areas of the Yangtze River.
In the source areas of the Yellow River, overall vulnerability to aeolian desertification decreased from 2000 to 2010. However, in some parts of the area, the change trend was complicated. Natural factors, such as climate variations, may have resulted in a risk of aeolian desertification; however, human disturbances have also contributed to the desertification in this sub-region. From 1970 to 2010, the mean annual temperature increased at an average rate of 0.54 °C per decade, the mean annual precipitation increased at an average of 3.3 mm per decade (Figure 8a), and the annual wind speed decreased at an average rate of 0.02 m·s−1 per decade (Figure 8c) in Gonghe County (in the east). During the same time, the annual mean temperature increased at an average rate of 0.51 °C per decade (Figure 8b), the annual wind speed decreased at an average of 0.15 m·s−1 per decade (Figure 8c), and the mean annual precipitation increased at an average of 12.44 mm per decade (Figure 8b) in Maduo County (in the west). In particular, the increase in annual mean temperature and the mean annual precipitation between 2000 and 2010 in Gonghe were more obvious, with an average rate of 0.7 °C per decade and 59.56 mm per decade, respectively. The mean annual precipitation between 2000 and 2010 in Maduo also increased significantly, with an average rate of 107 mm per decade. The changes in these climatic factors provided favorable conditions to decrease the vulnerability to aeolian desertification in Gonghe and in Maduo. In contrast, vulnerability to aoelian desertification in some areas of Maduo increased from 2000 to 2010. We believe that overgrazing may have aggravated the vulnerability to aeolian desertification. Livestock numbers have increased rapidly since the 1970s due to an increasing demand for economic growth, and the total number greatly exceeds the theoretical carrying capacity of the grassland. In Maduo County, livestock numbered 120,000, 147,000, and 670,000 animals in the 1950s, the 1960s, and the 1970s, respectively. Although these numbers decreased to 286,000 in 1999, the grassland was still overgrazed by as much as 60% in 1999 [48]. This appears to be the most important human activity responsible for increasing the vulnerability to aeolian desertification. In contrast with the source area of the Yangtze River, human activities made more contributions to changes in the vulnerability to aeolian desertification in this sub-region. Both the total number of livestock and population increased between 2000 and 2010 (Figure 8d). Hence, although the overall vulnerability to aeolian desertification in this sub-region decreased between 2000 and 2010, land with high vulnerability to aeolian desertification existed in some areas.
In the Zoige Basin, the area of land with low vulnerability increased slightly between 2000 and 2005, and decreased between 2005 and 2010. Most of the land had either very low or low vulnerability. Here, the mean annual precipitation is greater than 600 mm, so precipitation is unlikely to be a key factor, and aeolian desertification appears to be more sensitive to temperature [8]. Since 1970, temperature has increased (at an average rate of 0.23 °C per decade) and precipitation has decreased (at an average rate of 13.88 mm per decade) (Figure 9a), causing the Zoige Basin to become warmer and drier. The annual mean wind speed showed an apparent fluctuation (Figure 9b). From 2000 to 2010, the mean annual temperature and precipitation increased perceptibly, at an average rate of 1.29 °C per decade and 44.13 mm per decade, respectively. The annual mean wind speed increased by an average rate of 0.28 m·s−1 per decade. However, these changes do not appear to have been sufficient to increase the vulnerability to aeolian desertification. This suggests that human activities are the most important factors. Specifically, overgrazing and drainage of wetlands appear to be the key factors responsible for an expansion of aeolian desertification in this sub-region [17]. In this sub-region, the statistical data indicate that both the population and number of livestock increased between 2000 and 2010 (Figure 9c). Hu et al. [17] calculated that from 1978 to 2010, the number of livestock in the basin increased correspondingly from 1.53 million in 1978 to 2.15 million in 2010 as well, giving a net increase of 0.62 million (40.5% of the 1978 livestock number). On this basis, the grassland of Maqu County was over-grazed by 101% and 69% of its carrying capacity in 2000 and 2005, respectively [8]. Similarly, Zoige County was overgrazed by 51% and 63% in 2001 and 2003, respectively [49]. In addition, there are about 4902 km2 of marshes in the Zoige Basin, accounting for 4.1% of China’s total marsh area [50]. The implementation of drainage in 2000 km2 (accounting for 41% of the total marshes and peatlands in the basin [8]) of this area slowed the development of marsh and peat soils, causing them to evolve into meadow soils or aeolian sandy soils. The drained soils are more vulnerable to further degradation through overgrazing, which in turn increases the risk of soil erosion and aeolian desertification.
We have known that between 2000 and 2005, the vulnerability in three sub-regions showed different variation trends. However, the vulnerability over the whole study area decreased between 2005 and 2010. We believe the influence resulting from climate factors has existed since 2000, while over the recent decade, anthropogenic activities exerted an important effect on restoration. The implementation of ecological restoration has gradually achieved a significant effect since 2005, which plays a significant role in decreasing the vulnerability to aeolian desertification. The source areas of the Yangtze and Yellow Rivers were determined to be national nature reserve areas in 2003, and preparation for ecology restoration and construction in the study area was completed at the same time. In 2005, protection measures, including returning grazing land to grassland, were formally carried out. Through the ecological migration and measures to reduce livestock, the number of livestock in three sub-regions decreased perceptibly since 2007 (Figure 6c), which reduced the pressure of grassland animal husbandry [51]. Moreover, in the Zoige Basin, a number of political measures were initiated in the 1990s to slow desertification, but the countermeasures of grazing prohibition, enclosures, and paving straw checkerboard barriers were not implemented until around 2005. These measures resulted in a dramatic recovery of aeolian desertification land between 2005 and 2010 [17].
We speculate that vulnerability to aeolian desertification would continuously decrease over the whole study area in the future, which is mainly attributed to the warm-wet climate change and the continuously intensive implementation of ecological protection projects.

5. Conclusions

In this case study, we assessed the vulnerability to aeolian desertification in the source areas of the Yangtze and Yellow Rivers, using a system of indicators that accounted for both natural and anthropogenic factors. We then examined the changes in this vulnerability from 2000 and 2010 for the area as a whole as well as for the sub-regions.
We found that in this fragile, vulnerable environment, a large part of the area is highly vulnerable to aeolian desertification, although land with only very low or low vulnerability was the dominant vulnerability category. Land with the highest vulnerability is concentrated in the northwestern part of the source areas of the Yangtze River and the northwestern and northeastern parts of the source areas of the Yellow River, so decision-makers must prioritize these areas for protection and ecological restoration. Although the overall trend from 2000 to 2005 shows an increase in vulnerability, the increase was relatively small, suggesting that vulnerability remained largely stable for the overall study area. However, only the source areas of the Yellow River showed a decrease in vulnerability, and the trends in specific areas (e.g., river valleys and the flat areas around lakes) reveal important vulnerabilities that are not visible based only on the overall values for each sub-region. Moreover, the overall trend from 2005 to 2010 shows a decrease in vulnerability, and the same trend in the three sub-regions, while land with high vulnerability to aeolian desertification existed in some areas during this period.
The driving forces responsible for the observed changes in vulnerability differed among the sub-regions. In some areas, climatic factors (primarily a trend of rising temperatures) were the dominant factor; in others, human activities (primarily overgrazing and drainage of marshes) were the dominant factors, or a combination of climatic and human factors caused the trend. Because of the large areas of permanently or seasonally frozen ground in the study area, rising temperatures that increase thawing are a particular concern, both because they cannot be prevented and because their effects will be exacerbated by the effects of human activities. Thus, human activities must be managed particularly carefully in these areas. Since 2005, the implementation of the ecological restoration projects in the source areas of the Yangtze and Yellow Rivers has achieved a noticeable effect, which is reflected by the decreasing number of livestock and vulnerability over the whole study area.
In conclusion, it is necessary to take measures continuously to decrease the vulnerability of this ecologically fragile region to aeolian desertification, since it will take much longer than in less fragile areas to reverse aeolian desertification once it occurs. In future research, we will examine changes in desertification in 2015 and later to determine how well the vulnerability values calculated in the present study predicted subsequent changes in desertification severity.

Supplementary Materials

The following are available online at www.mdpi.com/2072-4292/8/8/626/s1; Figure S1: Distribution of permafrost in the study area.

Acknowledgments

We are grateful for the financial support provided by the Ministry of Science and Technology of the People’s Republic of China (2013CB956000), and the National Natural Science Foundation of China (Grant No. 41201002). We appreciate the anonymous reviewers for their constructive comments and suggestions.

Author Contributions

Xiaobin Ren and Zhibao Dong designed the research; Xiaobin Ren performed the research; Zhibao Dong supervised the research; Xiaobin Ren, Guangyin Hu, Donghai Zhang, and Qing Li analyzed the data; and Xiaobin Ren and Zhibao Dong wrote the paper.

Conflicts of Interest

The authors declare no conflict of interest.

References

  1. United Nations Conference on Desertification (UNCOD). Desertification: Its Causes and Consequences; Pergamon Press: Oxford, UK, 1977. [Google Scholar]
  2. Zhu, Z.D. Fragile ecological zones and land desertification in China. J. Desert Res. 1991, 11, 11–22. (In Chinese) [Google Scholar]
  3. Zhu, Z.D.; Liu, S. The concept of deertification and the differentiation of its development. J. Desert Res. 1984, 4, 2–8. (In Chinese) [Google Scholar]
  4. Wang, T. Study on sandy desertification in China 3: Key regions for studying and combating sandy desertification. J. Desert Res. 2004, 1, 1–9. (In Chinese) [Google Scholar]
  5. Du, M.Y.; Kawashima, S.; Yonemura, S.; Zhang, X.Z.; Chen, S.B. Mutual influence between human activities and climate change in the Tibetan Plateau during recent years. Glob. Planet. Chang. 2004, 41, 241–249. [Google Scholar] [CrossRef]
  6. Wang, X.M.; Ma, W.Y.; Lang, L.L.; Hua, T. Controls on desertification during the early twenty-first century in the Water Tower region of China. Reg. Environ. Chang. 2014, 15, 735–746. [Google Scholar] [CrossRef]
  7. Yu, G.A.; Brierley, G.; Huang, H.Q.; Wang, Z.Y.; Blue, B.; Ma, Y.X. An environmental gradient of vegetative controls upon channel planform in the head areas of the Yangtze and Yellow Rivers. CATENA 2014, 119, 143–153. [Google Scholar] [CrossRef]
  8. Dong, Z.B.; Hu, G.Y.; Yan, C.Z.; Wang, W.L.; Lu, J.F. Aeolian desertification and its causes in the Zoige Plateau of China’s Qinghai-Tibetan Plateau. Environ. Earth Sci. 2010, 59, 1731–1740. [Google Scholar] [CrossRef]
  9. Bakr, N.; Weindorf, D.C.; Bahnassy, M.H.; El-Badawi, M.M. Multi-temporal assessment of land sensitivity to desertification in a fragile agro-ecosystem: Environmental indicators. Ecol. Indic. 2012, 15, 271–280. [Google Scholar] [CrossRef]
  10. Lam, D.K.; Remmel, T.K.; Drezner, T.D. Tracking desertification in California using remote sensing: A sand dune encroachment approach. Remote Sens. 2011, 3, 1–13. [Google Scholar] [CrossRef]
  11. Vicente-Serrano, S.M.; Cabello, D.; Tomás-Burguera, M.; Martín-Hernández, N.; Beguería, S.; Azorin-Molina, C.; Kenawy, A.E. Drought variability and land degradation in semiarid regions: Assessment using remote sensing data and drought indices (1982–2011). Remote Sens. 2015, 7, 4391–4423. [Google Scholar] [CrossRef]
  12. Ladisa, G.; Todorovic, M.; Liuzzi, G.T. A GIS-based approach for desertification risk assessment in Apulia region, SE Italy. Phys. Chem. Earth 2012, 49, 103–113. [Google Scholar] [CrossRef]
  13. Salvati, L.; Bajocco, S. Land sensitivity to desertification across Italy: Past, present, and future. Appl. Geogr. 2011, 31, 223–231. [Google Scholar] [CrossRef]
  14. Van Lynden, G.W.J.; Mantel, S. The role of GIS and remote sensing in land degradation assessment and conservation mapping some user experiences and expectations. Int. J. Appl. Earth. Obs. Geoinf. 2001, 3, 61–68. [Google Scholar] [CrossRef]
  15. Hu, G.Y.; Dong, Z.B.; Lu, J.F.; Yan, C.Z. Driving forces responsible for aeolian desertification in the head areas of the Yangtze River from 1975 to 2005. Environ. Earth Sci. 2012, 66, 257–263. [Google Scholar] [CrossRef]
  16. Hu, G.Y.; Dong, Z.B.; Lu, J.F.; Yan, C.Z. Driving forces of aeolian desertification in the head areas of the Yellow River: 1975–2005. Environ. Earth Sci. 2013, 70, 3245–3254. [Google Scholar] [CrossRef]
  17. Hu, G.Y.; Dong, Z.B.; Lu, J.F.; Yan, C.Z. The developmental trend and influencing factors of aeolian desertification in the Zoige Basin, eastern Qinghai-Tibet Plateau. Aeolian Res. 2015, 19, 275–281. [Google Scholar] [CrossRef]
  18. Dong, Z.B.; Hu, G.Y.; Yan, C.Z.; Lu, J.F.; Wei, Z.H. Aeolian Desertification in the Source Regions of Yangtze River and Yellow River; Science Press: Beijing, China, 2012. (In Chinese) [Google Scholar]
  19. Mabbutt, J.A. Desertification Indicators. Clim. Chang. 1986, 9, 113–122. [Google Scholar] [CrossRef]
  20. Ferrara, A.; Salvati, L.; Sateriano, A.; Nolè, A. Performance evaluation and cost assessment of a key indicator system to monitor desertification vulnerability. Ecol. Indic. 2012, 23, 123–129. [Google Scholar] [CrossRef]
  21. Chuvieco, E.; Martínez, S.; Román, M.V.; Hantson, S.; Pettinari, M.L. Integration of ecological and socio-economic factors to assess global vulnerability to wildfire. Glob. Ecol. Biogeogr. 2014, 23, 245–258. [Google Scholar] [CrossRef]
  22. Antwi-Agyei, P.; Fraser, E.D.G.; Dougill, A.J.; Stringer, L.C.; Simelton, E. Mapping the vulnerability of crop production to drought in Ghana using reinfall, yield and socioeconomic data. Appl. Geogr. 2012, 32, 324–334. [Google Scholar] [CrossRef]
  23. Feng, Z.M.; Tang, Y.; Yang, Y.Z.; Zhang, D. Establishment and application of human settlements environment index model (HEI) based on GIS. Acta Geogr. Sin. 2008, 63, 1321–1336. (In Chinese) [Google Scholar]
  24. Dong, Y.X.; Kang, G.D. Study on the wind erosion climate erosivity in arid and semi-arid areas in China. J. Soil Water Conserv. 1994, 8, 1–7. (In Chinese) [Google Scholar]
  25. Imbrenda, V.; D’Emilio, M.; Lanfredi, M.; Simoniello, T.; Ragosta, M.; Macchiato, M. Integrated indicators for the estimation of vulnerability to land degradation. In Soil Processes and Current Trends in Quality Assessment; Intech Open Access Publisher: Rijeka, Croatia, 2013. [Google Scholar] [CrossRef]
  26. Ren, X.B.; Hu, G.Y.; Dong, Z.B. The concept and assessment of desertification vulnerability. J. Desert Res. 2015, 35, 40–50. (In Chinese) [Google Scholar]
  27. Intergovernmental Panel on Climate Change (IPCC). Climate Change 2007: Impacts, Adaptation and Vulnerability. Working Group II Contribution to the Fourth Assessment Report of the IPCC; Cambridge University Press: Cambridge, UK, 2007. [Google Scholar]
  28. Hua, T.; Wang, X.M.; Cizhen; Zhang, C.X.; Lang, L.L. Responses of desertification to climate change in arid and semiarid regions of china over the past millennium. J. Desert Res. 2012, 3, 618–624. (In Chinese) [Google Scholar]
  29. Liu, X.F.; Ren, Z.Y.; Lin, Z.H.; Liu, Y.X.; Zhang, D.H. The spatial-temporal changes of vegetation coverage in the Three-River headwater region in recent 12 years. Acta Geogr. Sin. 2013, 68, 897–908. (In Chinese) [Google Scholar]
  30. Linstone, H.A.; Turoff, M. The Delphi Method: Techniques and Applications; Addison-Wesley: London, UK, 1975. [Google Scholar]
  31. Saaty, T.L. A scaling method for priorities in hierarchical structures. J. Math. Psychol. 1977, 15, 234–281. [Google Scholar] [CrossRef]
  32. Ye, J. Multicriteria fuzzy decision-making method using entropy weights-based correlation coefficients of interval-valued intuitionistic fuzzy sets. Appl. Math. Model. 2010, 34, 3864–3870. [Google Scholar] [CrossRef]
  33. Pham, D.L. Spatial models for fuzzy clustering. Comput. Vis. Image Underst. 2001, 84, 285–297. [Google Scholar] [CrossRef]
  34. Carver, S.J. Integrating multi-criteria evaluation with geographical information systems. Int. J. Geogr. Inf. Syest. 1991, 5, 321–339. [Google Scholar] [CrossRef]
  35. Bantayan, N.C.; Bishop, I.D. Linking objective and subjective modelling for landuse decision-making. Landsc. Urban Plan. 1998, 43, 35–48. [Google Scholar] [CrossRef]
  36. Ramanathan, R. A note on the use of the analytic hierarchy process for environmental impact assessment. J. Environ. Manag. 2001, 63, 27–35. [Google Scholar] [CrossRef] [PubMed]
  37. Stefanidis, S.; Stathis, D. Assessment of flood hazard based on natural and anthropogenic factors using analytic hierarchy process (AHP). Nat. Hazards 2013, 2, 569–585. [Google Scholar] [CrossRef]
  38. Li, S.; Yang, P.; Gao, S.Y.; Chen, H.S. Dynamic changes and development trends of the land desertification in Tibetan Plateau over the past 10 years. Adv. Earth Sci. 2004, 19, 63–70. (In Chinese) [Google Scholar]
  39. Liu, J.Y.; Xu, X.L.; Shao, Q.Q. The spatial and temporal characteristics of grassland degradation in the three-river headwaters region in Qinghai province. Acta Geogr. Sin. 2008, 63, 365–376. (In Chinese) [Google Scholar]
  40. Li, S.S.; Yang, S.N.; Liu, X.F.; Liu, Y.X.; Shi, M.M. NDVI-Based analysis on the influence of climate change and human activities on vegetation restoration in the Shaanxi-Gansu-Ningxia region, central China. Remote Sens. 2015, 7, 11163–11182. [Google Scholar] [CrossRef]
  41. Liu, X.F.; Zhu, X.F.; Li, S.S.; Liu, Y.X.; Pan, Y.Z. Change in growing season vegetation and their associated driving forces in China during 2001–2012. Remote Sens. 2015, 7, 15517–15535. [Google Scholar] [CrossRef]
  42. Liu, Y.X.; Liu, X.F.; Hu, Y.N.; Li, S.S.; Peng, J.; Wang, Y.L. Analyzing nonlinear variations in terrestrial vegetation in China during 1982–2012. Environ. Monit. Assess. 2015, 187, 722. [Google Scholar] [CrossRef] [PubMed]
  43. Li, A.N.; Wang, A.S.; Liang, S.L.; Zhou, W.C. Eco-environmental vulnerability evaluation in mountainous region using remote sensing and GIS-A case study in the upper reaches of Minjiang River, China. Ecol. Model. 2006, 192, 175–187. [Google Scholar] [CrossRef]
  44. Yang, J.; Ding, Y.; Shen, Y.; Liu, S.; Chen, R. Climatic features of eco-environment change in the head areas of the Yangtze and Yellow rivers in recent 40 years. J. Glaciol. Geocryol. 2004, 26, 7–16. (In Chinese) [Google Scholar]
  45. Xie, H.; Ye, J.S.; Liu, X.M.; E, C.Y. Warming and drying trends on the Tibetan Plateau (1971–2005). Theor. Appl. Climatol. 2010, 101, 214–253. [Google Scholar] [CrossRef]
  46. Hua, T.; Wang, X.M. Research progresses on the interaction between desertification and climate change in arid and semiarid East Asia. Prog. Geogr. 2014, 6, 841–852. (In Chinese) [Google Scholar]
  47. Intergovernmental Panel on Climate Change (IPCC). Climate Change 2007: The Physical Science Basis. Working Group I Contribution to the Fourth Assessment Report of the IPCC; Cambridge University Press: Cambridge, UK, 2007. [Google Scholar]
  48. Dong, L.X.; Wang, W.K.; Kong, J.L. Supervise of eco-environmental change based on RS methods and causal analysis in Maduo county in upriver regions of the Yellow River. Bull. Soil Water Conserv. 2005, 25, 68–72. (In Chinese) [Google Scholar]
  49. Zhang, S.Q.; Guo, H.Y.; Luo, Y. Assessment on driving force of climate change and livestock grazing capacity to grassland sanding in Ruoergai. Chin. J. Grassl. 2007, 29, 64–71. (In Chinese) [Google Scholar]
  50. Yang, Y.X.; Wang, S.Y. Human disturbances on mire and peat soils in the Zoige Plateau. Resour. Sci. 2001, 23, 37–41. (In Chinese) [Google Scholar]
  51. Shao, Q.Q.; Liu, J.Y.; Huang, L.; Fan, J.W.; Xu, X.L.; Wang, J.B. Integrated assessment on the effectiveness of ecological conservation in Sanjiangyuan National Nature Reserve. Geogr. Res. 2013, 32, 1645–1656. (In Chinese) [Google Scholar]
Figure 1. Location of the study area and topography (a); and distribution of aeolian desertified land in 2005 (b) in the source areas of the Yangtze and Yellow Rivers. Figure 1b Source: [18].
Remotesensing 08 00626 g001
Figure 2. Illustration of the structure of the system for calculating the vulnerability to aeolian desertification in the source areas of the Yangtze and Yellow Rivers. AHP, analytic hierarchy process; DEM, digital elevation model; NDVI, normalized-difference vegetation index.
Remotesensing 08 00626 g002
Figure 3. Spatial distribution of the index of vulnerability to aeolian desertification (DVI) in the source areas of the Yangtze and Yellow Rivers in: 2000 (a); 2005 (b); and 2010 (c). Table 2 defines the DVI values in each vulnerability category.
Remotesensing 08 00626 g003
Figure 4. Areas in the different vulnerability to desertification classes (defined in Table 2) in 2000, 2005, and 2010 in: (a) the source areas of the Yangtze and the Yellow Rivers and of the Zoige Basin combined; (b) the source areas of the Yangtze River; (c) the source areas of the Yellow River; and (d) the Zoige Basin. Note that the y-axis in (a) differs greatly from that in the other graphs.
Remotesensing 08 00626 g004
Figure 5. Spatial distribution of variation of the desertification vulnerability index (DVI): from2000 to 2005 (a); and from 2005 to 2010 (b).
Remotesensing 08 00626 g005
Figure 6. Changes in mean annual temperature and precipitation (a) and mean annual wind speed (b) between 1970 and 2010, and the increase in population and livestock between 2000 and 2010 (c) in the source areas of the Yangtze and Yellow Rivers.
Remotesensing 08 00626 g006
Figure 7. Changes in mean annual temperature and precipitation (a); and mean annual wind speed (b) between 1970 and 2010, and change in population and livestock between 2000 and 2010 (c) in the source area of the Yangtze River.
Remotesensing 08 00626 g007
Figure 8. Changes in mean annual temperature and precipitation in Gonghe (a) and Maduo (b); and the mean annual wind speed in Gonghe and Maduo (c) between 1970 and 2010; and the increase in population and livestock between 2000 and 2010 in the source area of the Yellow River (d).
Remotesensing 08 00626 g008
Figure 9. Changes in mean annual temperature and precipitation (a); and the mean annual wind speed (b) in the Zoige Basin between 1970 and 2010; and the increase in population and number of livestock between 2000 and 2010 (c) in the Zoige Basin.
Remotesensing 08 00626 g009
Table 1. Evaluation indicator system for the assessment of vulnerability to aeolian desertification in the source areas of the Yangtze and Yellow Rivers. Calculation of the weights is described in Section 3.2.
DimensionIndicator 1WeightRelation with Aeolian Desertification
ExposureRelief of land surface [23]0.0650
Wind erosion climate erosivity [24]0.2235+
Mean annual temperature0.0698+
SensitivityVegetation index (NDVI) [25]0.2048-
Distribution of aeolian desertified land0.0786+
Distribution of severe aeolian desertified land0.1658+
Adaptive capacityPopulation density0.1297+
GDP density0.0628+
1 Distribution, the status of the area with some degree of aeolian desertification; GDP density, the total GDP/km2; NDVI, normalized-difference vegetation index; relief, a comprehensive topographic index defined in Section 3.2; wind erosion, based on mean monthly wind speed.
Table 2. Degrees of vulnerability to aeolian desertification and the range of DVI values used to define them.
VulnerabilityRange of DVI ValuesDescription
Very low0.00–0.24Stable, with relatively high vegetation cover (>40%) and high resistance to desertification; no signs of aeolian desertification
Low0.24–0.31Relatively stable, with relatively high vegetation cover (20% to 40%) and resistance to desertification; semi-exposed gravel or fixed dunes (sandy land) present in places. A steppe or desert steppe landscape
Moderate0.31–0.38Somewhat unstable, with relatively low vegetation cover (10% to 20%) and resistance to desertification; bare gravel and shifting dunes cover 10% to 30% of the land. A desert or desert steppe landscape
High0.38–0.51Unstable, with poor resistance to desertification and low vegetation cover (5% to 10%); semi-shifting dunes (sandy land) cover 30% to 50% of the land. The inter-dune depressions show a desert vegetation landscape.
Very high0.51–1.00Extremely unstable, with poor resistance to desertification and low vegetation cover (<5%); shifting dunes (sandy land) cover more than 50% of the area. A desert vegetation landscape
Table 3. Area and percentage of each vulnerability to aeolian desertification category in 2000, 2005, and 2010 in the whole study area and three sub-regions.
YearDegreeWhole AreaYangtze RiverYellow RiverZoige Basin
Area (km2)Percent (%)Area (km2)Percent (%)Area (km2)Percent (%)Area (km2)Percent (%)
2000Very low96,27535.323,56916.655,26849.517,43890.1
Low79,63329.241,74229.436,13932.317519.0
Moderate58,25521.342,76930.215,46213.8240.1
High32,28711.829,70220.924392.21460.8
Very high66892.441862.925032.200
2005Very low92,86833.921,15514.954,26748.617,26489.2
Low76,92828.235,69525.239,27235.1196110.1
Moderate53,53419.639,05527.514,46512.9140.1
High43,53215.941,68529.417271.51200.6
Very high64622.443203.021421.900
2010Very low95,98535.125,87718.250,84645.419,26299.5
Low97,66235.748,60434.148,97143.7870.4
Moderate52,34419.143,10030.392438.310
High24,2208.823,53016.56780.6120.1
Very high34891.312340.922552.000
Table 4. Integrated vulnerability index (IVI) values and their variation for the three sub-regions and the whole study area between 2000 and 2010.
RegionIVIVariation of IVI
2000200520102000–20052005–2010
Source areas of the Yangtze River2.64222.80382.47760.1616−0.3262
Source areas of the Yellow River1.75481.73351.7009−0.0213−0.0326
The Zoige Basin1.11561.12131.00690.0057−0.1144
The whole study area2.17092.24632.00570.0754−0.2406

