Article

Satellite Remote Sensing of Snow Depth on Antarctic Sea Ice: An Inter-Comparison of Two Empirical Approaches

1
Integrated Climate Data Center (ICDC), Center for Earth System Research and Sustainability (CEN), University of Hamburg, Hamburg 20144, Germany
2
Polar Research Center (PolReC), Maritime Faculty, Istanbul Technical University (ITU), Istanbul 34940, Turkey
*
Author to whom correspondence should be addressed.
Remote Sens. 2016, 8(6), 450; https://doi.org/10.3390/rs8060450
Submission received: 25 March 2016 / Revised: 16 May 2016 / Accepted: 18 May 2016 / Published: 26 May 2016
(This article belongs to the Special Issue Sea Ice Remote Sensing and Analysis)

Abstract

:
Snow on Antarctic sea ice plays a key role for sea ice physical processes and complicates retrieval of sea ice thickness using altimetry. Current methods of snow depth retrieval are based on satellite microwave radiometry, which perform best for dry, homogeneous snow packs on level sea ice. We introduce an alternative approach based on in-situ measurements of total (sea ice plus snow) freeboard and snow depth, which we use to compute snow depth on sea ice from Ice, Cloud, and land Elevation Satellite (ICESat) total freeboard observations. We compare ICESat snow depth for early winter and spring of the years 2004 through 2006 with the Advanced Scanning Microwave Radiometer aboard EOS (AMSR-E) snow depth product. We find ICESat snow depths agree more closely with ship-based visual and air-borne snow radar observations than AMSR-E snow depths. We obtain average modal and mean ICESat snow depths, which exceed AMSR-E snow depths by 5–10 cm in winter and 10–15 cm in spring. We observe an increase in ICESat snow depth from winter to spring for most Antarctic regions in accordance with ground-based observations, in contrast to AMSR-E snow depths, which we find to stay constant or to decrease. We suggest satellite laser altimetry as an alternative method to derive snow depth on Antarctic sea ice, which is independent of snow physical properties.

Graphical Abstract

1. Introduction

Snow on Antarctic sea ice plays a key role for sea ice formation and melt as well as for in- and under-ice biota. Snow insulates sea ice against the cold winter atmosphere retarding ice growth. Snow insulates sea ice against the warm summer atmosphere and shields it against solar radiation retarding ice melt. Snow reduces the availability of light within or underneath sea ice and therefore influences biogeochemical processes requiring solar radiation. In contrast to snow on Arctic sea ice, snow on Antarctic sea ice usually survives the summer melt season [1,2]; often the seasonal sea ice has melted from below before snow has melted. Environmental conditions in the Arctic Ocean, surrounded by landmasses, and the Southern Ocean surrounding Antarctica are different. Low pressure systems bring warm air and precipitation from the adjacent open ocean far south onto Antarctic sea ice year round. This is the main reason for a snow cover on Antarctic sea ice, which is not only thicker than in the Arctic but also more heterogeneous [3]. Alternating phases of warm air intrusions and cold spells result in a snow cover with a complex vertically layered structure [2,3,4,5].
The Southern Ocean is less stratified than the Arctic Ocean allowing for a larger upward oceanic heat flux also during winter. This reduces, in concert with the insulation by the thicker snow, the maximum thickness of thermodynamically grown sea ice. This thinner sea ice paired with the larger snow accumulation year round—compared to the Arctic—is the reason for an important secondary formation process of Antarctic sea ice: snow-ice formation. Due to the snow load the ice–snow interface of Antarctic sea ice is often very close to the sea surface, i.e., the sea ice freeboard often amounts only a few centimeters (e.g., [6]). This increases the likelihood to suppress the ice–snow interface below the sea surface. Depending on the permeability of the sea ice, which is a function of its temperature, and depending on other factors, sea water infiltrates the ice–snow interface and creates a slushy and salty basal snow layer from which water is further wicked up into the snow by capillary suction. The sea ice becomes flooded. If temperatures rise/stay above freezing the ice–snow interface stays flooded and the snow wet. If temperatures fall/stay below freezing the slush layer refreezes and forms snow-ice. This ice adds to the sea ice underneath, increasing its thickness and hence its buoyancy. A new ice–snow interface is created onto which snow can accumulate before another flooding event may occur. Evidence of such cycling between flooding and re-freezing has been found in profiles of the ice crystal structure (e.g., [7,8]).
Why is it important to detail the geophysical properties of snow on sea ice? Because snow on sea ice influences its microwave radiometric properties and thereby adds noise to, e.g., the retrieval of sea ice concentration using satellite microwave radiometry (e.g., [9,10,11]). In addition, snow depth is currently a key parameter for the retrieval of sea ice thickness from freeboard measurements by satellite altimetry in the Arctic [12,13] and Antarctic [14,15,16]. Alternative methods to retrieve Antarctic sea ice thickness without using snow depth information have been tested but either lack global application potential [17], or provide potentially biased results and require further inter-comparison and validation [16,18,19,20]. In addition, for an accurate retrieval of sea ice freeboard from satellite radar altimetry, snow depth is important, because it influences the travel time of the radar signal in the snow [21,22].
Observations of snow depth on Antarctic sea ice are extremely sparse [3,6,23]. Only satellite remote sensing allows obtaining daily, high-resolution, circum-Antarctic snow depth data. Currently, only one empirical approach exists for this purpose. It is based on satellite passive microwave brightness temperatures (TB) measured at 19 GHz and 37 GHz [24,25]. Snow depth is computed using TB from the Special Sensor Microwave/Imager (SSM/I) and the Advanced Microwave Scanning Radiometer (AMSR-E). The maximum retrievable snow depth is limited to approximately 50 cm, which does not seem to be enough for Antarctic sea ice [19]. In addition, numerous validation and inter-comparison studies illustrate how sensitive this approach [24,25] is with respect to snow wetness, density, and grain size as well as sea ice concentration, type and degree of deformation (e.g., [8,24,26,27,28,29,30]). As mentioned above, accurate snow depth information is required for the retrieval of sea ice thickness and concentration, and for an improved quantification of the role snow on Antarctic sea ice plays in the seasonal cycle of the sea ice cover via insulation and snow-ice formation. Therefore, it is highly desirable to have an alternative way to observe the circum-Antarctic snow depth distribution, which is less sensitive to the above-mentioned snow and sea ice properties.
Here we take advantage of a different method to retrieve snow depth on Antarctic sea ice. This different method is as well based on an empirical approach, which links total (sea ice plus snow) freeboard measurements with snow depth [6]. We describe the method further down. We applied the method here to total freeboard obtained from measurements of the Geophysical Laser Altimeter System (GLAS) aboard the Ice, Cloud, and land Elevation Satellite (ICESat) [16]. It potentially allows obtaining snow depth on Antarctic sea ice without limitation in maximum depth and independent of most of the above-mentioned snow and sea ice properties—in particular, independent of snow wetness, sea ice type and degree of deformation, the main sources for a bias in snow depth retrievals from SSM/I or AMSR-E data.
The main aim of the present paper is to take a look at the large-scale wintertime evolution of the snow depth on Antarctic sea ice as obtained with the two mentioned approaches. In particular, we discuss the difference in snow depth between early winter (May/June) and spring (October/November) and try to answer the question whether the simple linear approach proposed in [6] can be used to obtain a useful, physically consistent estimate of the large-scale snow depth distribution on Antarctic sea ice.
In the present, paper we briefly describe the data and two methods in Section 2. We present the snow depths and their differences in Section 3. In Section 4, we discuss the results in the context of available observations [19,23] as well as in the context of wintertime snow depth evolution.

2. Materials and Methods

2.1. Data

We use GLAS/ICESat L2 sea-ice altimetry data (GLA13) of release 33 altimetry binary [31]. We downloaded the data for ICESat measurement periods 2B to 2J from the U.S. National Snow and Ice Data Center (NSIDC): http://nsidc.org/data/gla13.html). We used this data to compute Antarctic wide distribution of the total freeboard as described in [16] at 100 km grid resolution separately for each ICESat period from 2B (February/March 2004 or FM04) to 3I (October/November 2007 or ON07) (see Table 1). Note that data need to be averaged over such long periods—about 33–35 days—to obtain a sufficiently dense coverage with valid freeboard values. In addition, we computed maps of the freeboard retrieval uncertainty as described in [16]. We focus on winter (MJ) and spring (ON) periods. Throughout the paper we use the abbreviations given in parentheses in Table 1 if we refer to specific periods; otherwise we refer to winter or spring. Further, we henceforth abbreviate May/June as MJ and October/November as ON.
We use the AMSR-E snow depth data set [32]. This data comes daily as 5-day mean values for the period June 2002 through September 2011. The data do not include any uncertainty information. We re-project the snow depth data from the 12.5 km NSIDC polar-stereographic grid with tangential plane at 70°S to the corresponding grid with 100 km grid resolution for each ICESat measurement period (Table 1). Note that a newer version V003 of this data set has been available for a while; however, the version history (see: http://nsidc.org/data/amsre/data_versions/index.html) indicates that the major changes between the latest release of version V002, which is V12 used here, and V003 are: (i) usage of a re-processed brightness temperature data set; and (ii) refinement of the land mask. These changes are unlikely to impact the main limitations of this data set, which we have described in the introduction, and are based on the physical snow and sea ice properties.
Sea ice concentration data are required to limit the ICESat freeboard retrieval to the sea ice covered area. We use the IFREMER-UHAM daily 5-day median-filtered ARTIST Sea Ice (ASI) algorithm ice concentration data set: http://icdc.zmaw.de/1/daten/cryosphere/seaiceconcentration-asi-ssmi.html [33,34] for this purpose. This data set has 12.5 km grid resolution, using the same polar-stereographic grid as the snow depth. In the freeboard retrieval and also later in the freeboard-to-snow depth conversion, we use only grid cells with SIC > 60%. The AMSR-E snow depth data set (see above) includes AMSR-E NASA-Team 2 algorithm SIC data at 12.5 km grid resolution [32].
We use an extended version of the Antarctic Sea Ice Processes and Climate (ASPeCt) protocol ship-based visual estimates of the snow depth ([23,35]; http://www.aspect.aq). The observations include (ideally) hourly recordings of latitude, longitude, total sea ice concentration, and conditions for the primary (thickest), secondary, and tertiary ice types (if any) observed. Ice type descriptions incorporate: partial concentration of each ice type, thickness, floe size, topography (ridge sail height and fractional coverage of ridges), snow type, and snow depth. Snow depth is measured against a reference, i.e., a ruler stick mounted to the ship by watching the ice floes turned aside by the ships’ hull as the ship traverses the sea ice. The original ASPeCt data set ends in 2005. We extended the data set with observations from the following cruises: WWOS (September–October 2006), and SIMBA (September–October 2007) [36]. Note that ASPeCt observations of the snow depth are potentially biased low [23]. This is due to two reasons. First, an ASPeCt observer is supposed to report snow depth on level sea ice. Secondly, ASPeCt observations are carried out from aboard ships that tend to follow easy-to-navigate sea ice conditions. Therefore, snow depth on very thick ice and snow depth on predominantly ridged ice is rarely reported. Consequently, ASPeCt snow depth observations represent a lower limit of the area-average snow depth on sea ice and miss the deeper snow on very thick and/or ridged sea ice.

2.2. Methods

AMSR-E snow depth data are derived from the brightness temperature (TB) observations at vertical polarization by the 19 GHz and 37 GHz channels of the AMSR-E. By exploiting the different penetration depths and the difference in scattering in the snow at these two frequencies an empirical relationship was established between the gradient Ratio GR3719V: TB (37GHz) minus TB (19 GHz) divided by the sum of both TB and ASPeCt (see above) as well as a few in-situ snow depth observations [24]. The influence of the sea ice concentration on GR3719V is removed prior to its application in the algorithm. The algorithm permits obtaining snow depth over basically all Antarctic sea ice under reasonably cold conditions with dry snow. Limitations are posed by sea ice having a microwave radiative signature like multiyear ice, wet snow, and melt–freeze cycles. Under these circumstances, this snow depth retrieval potentially provides biased snow depth estimates. Therefore, the AMSR-E snow depth product used here contains flags for wet snow and multiyear ice. In addition, it comes as 5-day averages to mitigate the influence of melt–refreeze cycles [24,32]. More details about the algorithm and its limitations are given in [19,24]. It needs to be stated clearly, that it has been illustrated in a number of studies that AMSR-E, or in general satellite passive microwave, snow depth on sea ice retrieval works best for level sea ice [27,28,29,37,38].
The empirical approach we use to derive snow depth on sea ice from ICESat data is based on the work of [6]. By using in-situ observations of sea ice thickness, snow depth and freeboard from 15 research cruises into the Southern Ocean [6] proposed a suite of regional empirical linear relationships that allow computing snow depth on sea ice from total freeboard measurements. The empirical relationships are derived for five different regions in the Southern Ocean: Western Weddell Sea (WSW), Eastern Weddell Sea, Eastern Antarctic (EA), Ross Sea, and Bellingshausen-Amundsen Sea [6]; see [39] and [23] for a more detailed definition of these regions. Single measurements carried out along survey lines with an average length of ~50 m across ice floes were averaged to obtain survey line mean values of total freeboard and snow depth. These were subsequently used to carry out a linear regression analysis separately for each region [6]. The linear correlation coefficients between total freeboard and snow depth are all above 0.9 and slopes of the regression lines are all close to 1. Intercept and slope values are given together with the number of contributing survey lines in Table 2.
Out of this set of coefficients we are taking those of regions WSW and WSE. In addition, we compute an average set of coefficients for the entire Antarctic from the coefficients of all regions, which we denote as AAall henceforth. By using the simple linear equation
S = b + a F
snow depth S is computed in centimeters as function of total freeboard F, input in centimeters. Uncertainties in S are estimated via Gaussian error propagation with uncertainties of the regression lines (see [6]) and of F (see [16,20]) as input. The used coefficients are summarized in Table 3.
We compute maps of the average Antarctic snow depth on sea ice distribution for all periods listed in Table 1 from the AMSR-E snow depth product and from the ICESat elevation measurements. The retrieval of the total freeboard is described in detailed in [16]. Here we briefly repeat a few key aspects. We first filter and pre-process ICESat surface elevations following [15,31]. Subsequently, we apply the lowest-level elevation method as described in [16] to approximate the sea surface height and compute the total freeboard [14,15,16]. The retrieved freeboard is quite sensitive to the parameters used in the lowest-level elevation method. The method is particularly limited in areas with very compact sea ice and hence a small number of leads or other openings in the sea ice cover which are required to determine the sea surface height. In such compact sea ice areas sea surface height undulations can cause a several centimeters large bias in the obtained total freeboard. Therefore, instead of including into our uncertainty estimation the very small freeboard retrieval uncertainties estimated by [15], which are of the order of a centimeter, we followed [16] and tripled the freeboard retrieval uncertainty. The resulting freeboard retrieval uncertainties per grid cell range between 3 cm and 12 cm, depending on the number of ICESat overpasses. We note that [18] used a slightly different way to retrieve the freeboard, which results in a slightly smaller freeboard than obtained with our method [16]; for the Weddell Sea our method provides freeboard values which are 5 cm and 9 cm larger than those of [18] for MJ and ON, respectively [16]. Once we have computed the average gridded total freeboard using ICESat measurements of an entire period (see Table 1), we derive the snow depth from the average gridded total freeboard. In order to have as complete a coverage as possible and to have data from as many ICESat overpasses as possible contributing to a grid-cell value, we use a coarse grid resolution of 100 km. Note that by this we smooth the spatial snow depth variability and reduce the range in the snow depth distribution expressed in a histogram towards a lower probability of deep and thin snow.

3. Results

In this section we first give examples of AMSR-E and ICESat snow depth distribution and the uncertainty of the latter. Subsequently, we show difference maps.

3.1. AMSR-E Snow Depth for ICESat Measurement Periods

During winter (Figure 1, top), largest AMSR-E snow depths occur in the southwestern and western Weddell Sea, known to be covered with perennial sea ice: snow depths range between 20 cm and 60 cm. Larger AMSR-E snow depths tend to spread eastward in the northwestern Weddell Sea. Other areas in the Amundsen/Bellingshausen and Ross Seas, which are partially covered with perennial sea ice, reveal snow depths of 20 cm to 40 cm, which are also elevated compared to the adjacent seasonal sea ice. Note the thicker snow depth patches in the northwestern Ross Sea in all winters shown and in the central Ross Sea in MJ05. Over most of the other seasonal sea ice, which makes about three quarters of the total sea ice cover in winter, snow depths are low and range between 5 cm and 15 cm. This is confirmed by the corresponding histograms we are showing in Figure 2 (top). The modal snow depth is in the bin 5–10 cm in all three winters. The circum-Antarctic mean snow depth is 12 cm in MJ05 and 16 cm in MJ04. A considerable fraction of the sea ice has snow depths > 25 cm, particularly in MJ04 and MJ06 (Figure 2, top). The area down-stream of the Ronne-Filchner Ice Shelf polynya as well as of the Ross Ice Shelf polynya is clearly visible by its lower snow depth in all three winters (Figure 1, top).
During spring (Figure 1, bottom), AMSR-E snow depths did not change too much on the seasonal sea ice; they take values between 5 cm and 20 cm. The areas with low snow depths located down-stream of the above-mentioned polynyas are well discernible—particularly in the Ross Sea. In the Weddell Sea, areas of deep snow have decreased and moved towards northeast and east. Note the band of snow depths close to 20 cm at 60°S in the Weddell Sea in ON04 and ON05 (Figure 1, bottom). In addition, the mean maximum snow depth has decreased compared to winter. Other areas with thick snow present already in winter, like in the Bellingshausen/Amundsen and Ross Sea (Figure 1, top), show a more variable evolution of the area covered by deep snow and of the maximum snow depth from winter to spring. In ON06, for instance, snow depths in the Bellingshausen Sea exceed 50 cm (Figure 1, bottom). For all spring periods shown, modal snow depths are in the bin 5–10 cm. The circum-Antarctic mean snow depth ranges between 11 cm (ON05 and ON06) and 13 cm (ON04) (Figure 2, bottom). The fraction of snow depths >25 cm is smaller in spring than in winter—particularly for 2005 and 2006. This could be partly explained by a larger number of grid cells with deep snow which are flagged in the snow depth product as being influenced by wet snow and/or rapid diurnal snow depth changes—especially in 2006: For ON06, Figure 1 (bottom) reveals a large area with invalid snow depths in the Weddell Sea where, for ON04, largest snow depths are observed.

3.2. ICESat Snow Depth and Uncertainty for ICESat Measurement Periods

For winter (Figure 3, top), the general distribution of ICESat snow depths is similar to the AMSR-E snow depth distribution (Figure 1, top). ICESat snow depths decrease from >60 cm in the western Weddell Sea to below 15 cm to 20 cm in the eastern Weddell Sea; this gradient is particularly pronounced in MJ04. The area downstream of the Filchner-Ronne Ice Shelf polynya exhibits snow depths <20 cm. In all three years, East Antarctic sea ice exhibits a quite variable and also comparably large snow depth: 20 cm to 40 cm. The Bellingshausen Sea has regions with ICESat snow depth >40 cm in every winter shown. In the Ross/Amundsen Sea, three regions can be identified. A large region with snow depths <20 cm which extends from the Ross Ice Shelf northwards and which stretches along the entire Shelf at its southern end. North and northeast of this thin snow region, exists a belt of larger snow depths: 20 cm to 40 cm. It is likely that this thicker snow cover is caused by perennial ice being imported into the Ross Sea from the East out of the Amundsen/Bellingshausen Sea. North of this belt, ICESat snow depths are <20 cm up until to the ice edge. Modal snow depths are in bin 15–20 cm (Figure 4, top). Mean snow depths range from 24 cm (MJ04) to 27 cm (MJ05). On about 20% of the sea ice, snow depth is >25 cm, and a considerable fraction of the sea ice has snow depths >50 cm (Figure 4, top).
For spring, ICESat and AMSR-E snow depth distributions are no longer similar. In spring (Figure 3, bottom), the ICESat snow depth seems to be an “elevated” version of the ICESat snow depth in winter (Figure 3, top). The majority of the sea ice has snow depths of 20 cm to 40 cm. Only the regions downstream of the Filchner-Ronne Ice Shelf polynya and the Ross Ice Shelf polynya exhibit snow depths <20 cm in two and three of the years shown, respectively. Larger parts of the eastern Weddell Sea, the East Antarctic sea ice cover and the northern Amundsen Sea also have ICESat snow depths <20 cm. There are many areas around Antarctica where ICESat snow depths exceed 60 cm. For instance, in the coastal Bellingshausen/Amundsen Sea snow depths are >80 cm in ON04 and ON06 (Figure 3, bottom). Note that in the Weddell Sea, similar to the results in Section 3.1, maximum snow depth seems to decrease between winter and spring, and that the areas of thickest snow tend to move north- and northeastward. Modal snow depths are in bin 20–25 cm (Figure 4, bottom). This corresponds to an increase in modal snow depth of 5 cm between winter and spring. Mean snow depth ranges from 30 cm (ON05) to 32 cm (ON04). This also corresponds to an increase in mean snow depth of about 5 cm between winter and spring. More than half of the sea ice has snow depths > 25 cm and about 10% of the grid cells have snow depths >50 cm (Figure 4, bottom).
In Figure 5, we illustrate the snow depth retrieval uncertainty as an example for periods MJ04 and ON04. Retrieval uncertainties are mostly <10 cm. Only over areas with thicker snow cover (compare Figure 3) uncertainties exceed 10 cm and may eventually become as large as 15 cm to 20 cm. We can state that the snow depth retrieval uncertainties are on average 30% of the snow depth.
In Figure 6, we demonstrate that the choice of the set of linear regression coefficients used to compute ICESat snow depth does not matter too much. We compare ICESat snow depths retrieved with the coefficients for WSW, WSE, and AAall (Table 3). The spatial snow depth distributions are very similar (not shown). The histograms shown in Figure 6 illustrate that for winter modal values stay in the same bin: 15–20 cm while for spring slight fluctuations between bin 15–20 cm and bin 20–25 cm can occur. The difference in the mean snow depth derived with WSW and WSE is 2 cm. Mean snow depths derived with the AAall coefficients differ to those derived with the WSW and WSE coefficients by 0 cm and 2 cm, respectively. In addition, we compared the average snow depth for the regions displayed further down in Figure 9 for these three sets of coefficients. For both, winter and spring, the difference in the average regional snow depth is 1 cm to 2 cm for most regions. It may be as large as 3 cm for regions with an average snow depth >50 cm. These small differences, paired with the considerably larger amount of profiles with valid in-situ measurements, which can be used to derive the AAall coefficients (see Table 3), led us to use the AAall coefficients for the present paper.

3.3. Differences between ICESat and AMSR-E Snow Depth

The difference maps shown in Figure 7 are dominated by positive values, i.e., ICESat snow depth exceeds AMSR-E snow depth. This applies in particular to spring when differences in the western Weddell Sea and along the coasts are particularly large—except in the Ross Ice Shelf polynya area. In winter, larger areas of differences around zero, i.e., ±6 cm, are only located in the Weddell and Ross Sea (Figure 7, top). In other areas, such as the East Antarctic ice cover, snow depth differences exceed 12 cm already in winter and increase towards spring. Modal values of the difference ICESat snow depth minus AMSR-E snow depth are in bin 5–10 cm in winter and in bin 10–15 cm in spring (Figure 8). This corresponds to an increase in the difference of the average modal snow depths by ~5 cm from winter to spring. Mean values of the difference ICESat snow depth minus AMSR-E snow depth vary in winter between 7 cm (MJ04) and 10 cm (MJ06), and increase towards spring to 15 cm (ON04) and 16 cm (ON06). Differences between mean snow depths increase slightly more than differences between modal snow depths.
In all maps shown, areas of negative differences can be identified. In these areas, AMSR-E snow depth exceeds ICESat snow depth. These areas occur in winter in the Weddell and/or the Ross Sea and also in spring in the Weddell Sea (ON04) and the Bellingshausen Sea (ON06) (Figure 7). All these areas tend to coincide with AMSR-E snow depths >20 cm (see Figure 1). At least for the Weddell Sea, these areas can be associated (partly) with perennial sea ice (see e.g., [29]).
For winter, a belt of larger positive differences occurs along the ice edge (Figure 7, top). On the one hand, this could be explained by an overestimation of ICESat snow depth. Unfiltered ocean swell could cause an overestimation of the total freeboard derived from ICESat elevation measurements, which in turn would cause an overestimation of the snow depth. On the other hand, ASPeCt observations carried out during SIMBA in the Bellingshausen Sea revealed snow depths of 20 cm to 30 cm on pancake ice, which has formed within 10–20 days. In the same area, AMSR-E snow depths are 5 cm to 10 cm [28], which corresponds to a substantial underestimation of the actual snow depth. Pancake ice is the usual type of sea ice formed seaward of the Antarctic pack ice cover. It can extend up to a few hundreds of kilometers from the ice edge southwards.

4. Discussion

In this section, we discuss qualitatively the results presented in the previous section. We note that our ICESat snow depth product is not validated. We first briefly discuss results from qualitative inter-comparisons of our ICESat snow depth with ASPeCt observations [35] and with Operation Ice Bridge (OIB) data [19]. We continue with a discussion about the consistency of the snow depth evolution between winter and spring. We give an overview of the sub-regions used in Section 4.2 and Section 4.3 in 
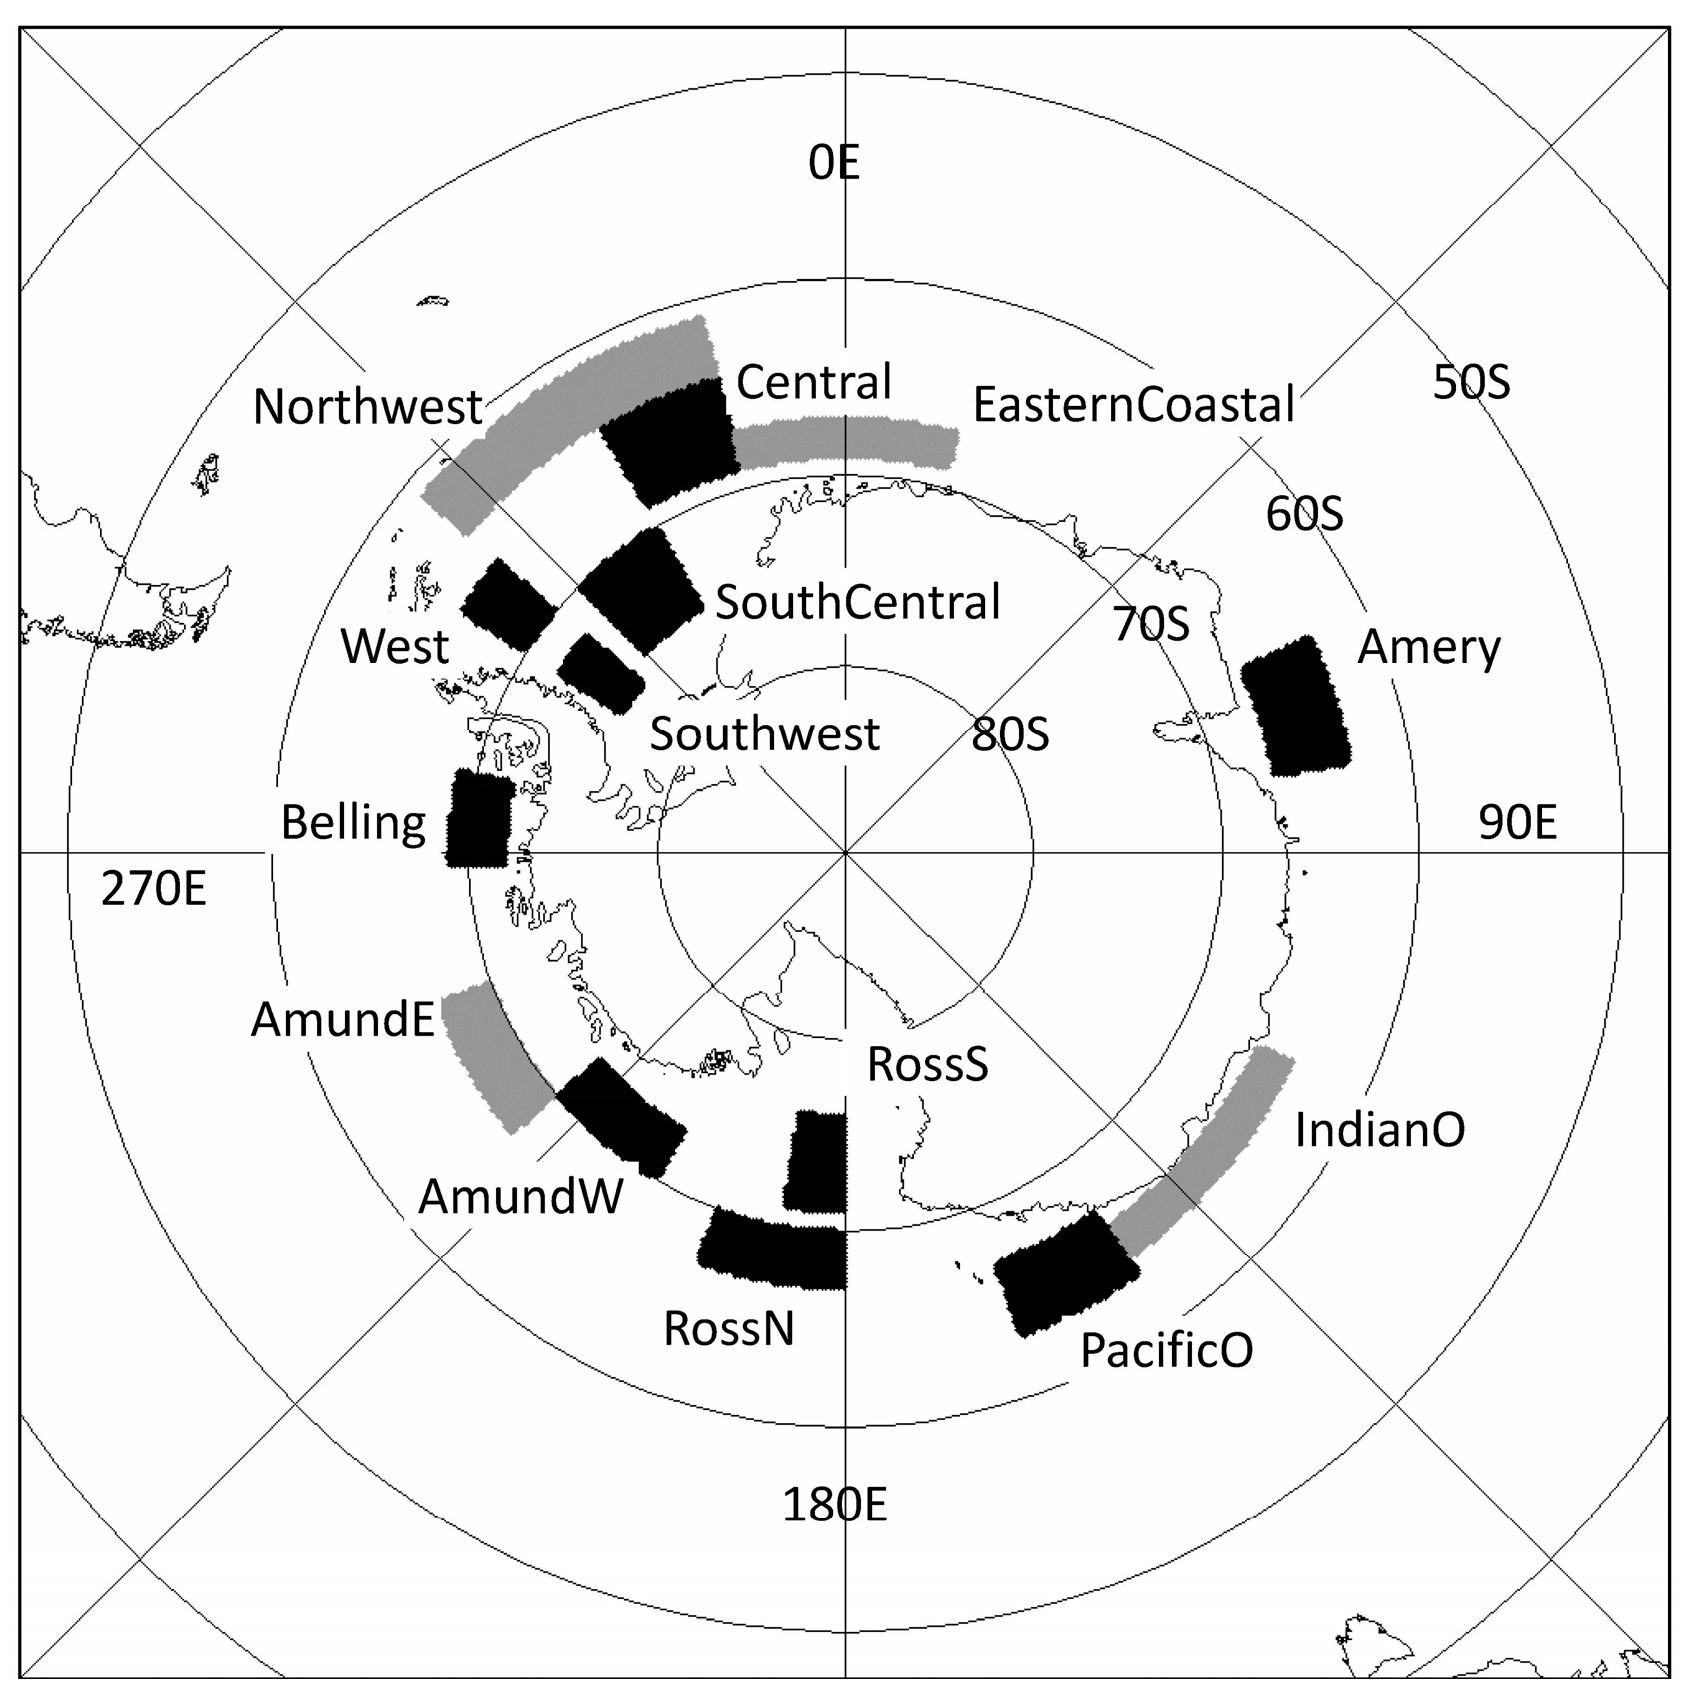
Figure 9. We chose the location of these sub-regions such that the influence of open water is minimal and that the coverage with valid ICESat snow depth data is maximal.
For the comparison with the ASPeCt observations (
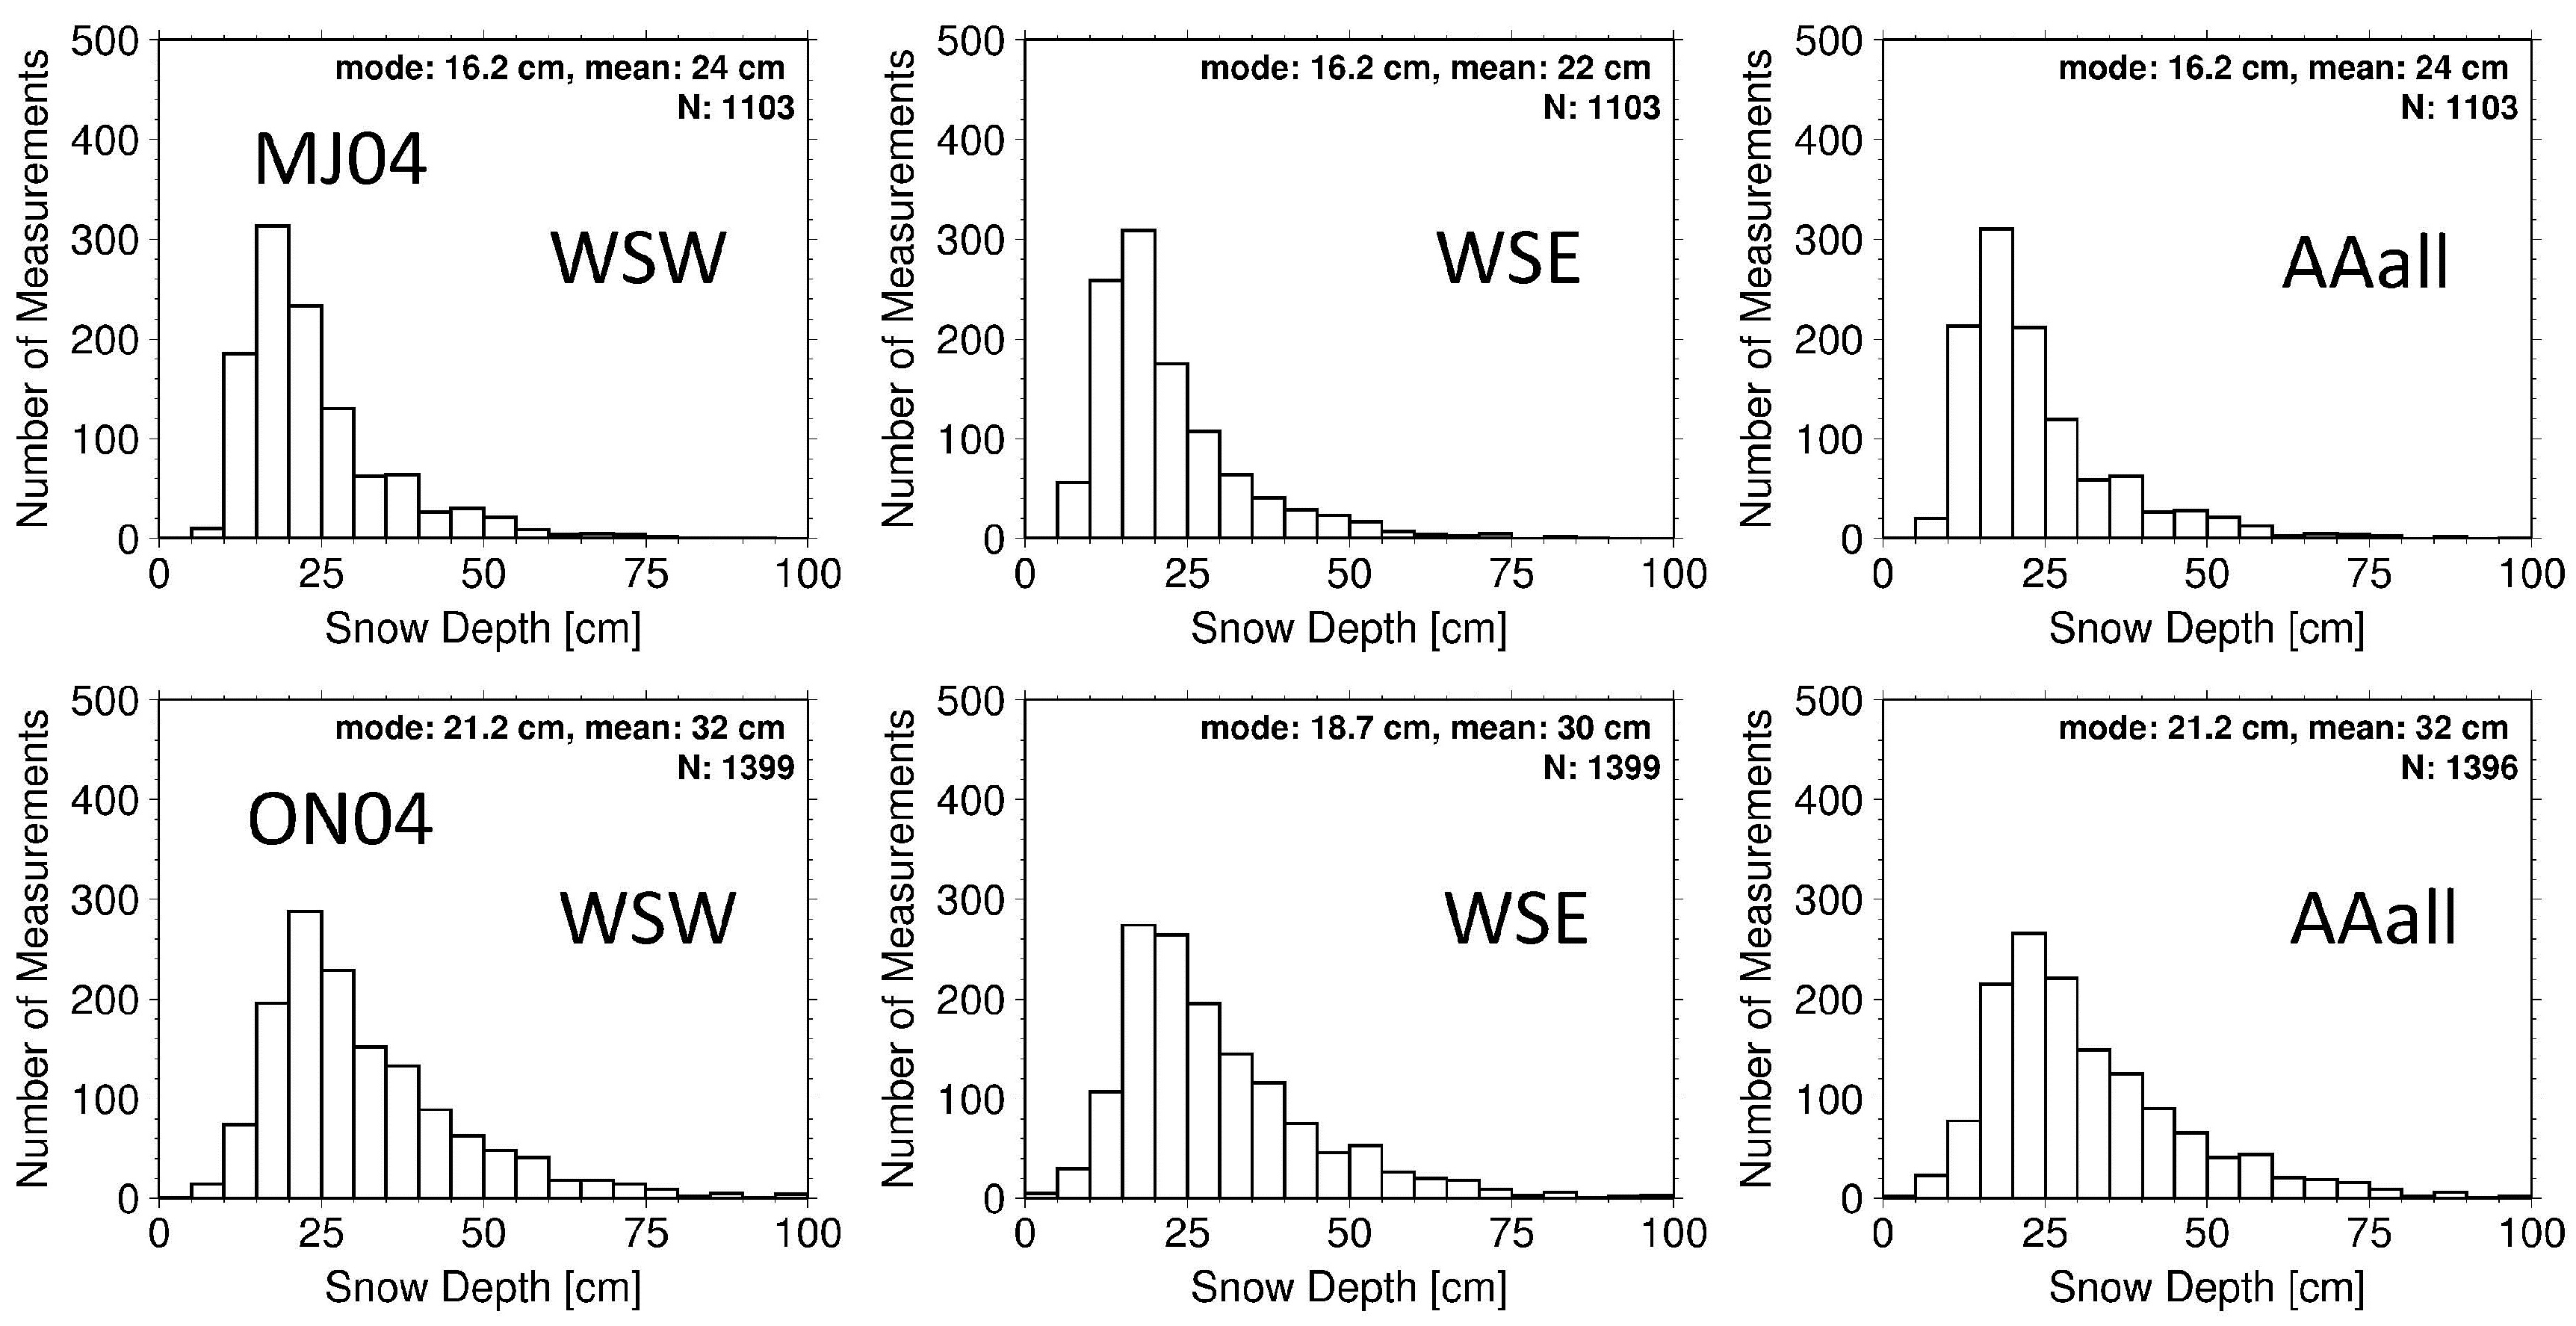
Section 4.1), we use ICESat snow depth retrieved at 25 km grid resolution. The main reason for this is that we can co-locate the ASPeCt observations with the gridded ICESat snow depth data at the finer grid resolution more accurately. We carried out an inter-comparison between ICESat snow depth obtained at 100 km and at 25 km grid resolution (not shown). The modal and the mean snow depths obtained for both, winter and spring, differ by less than 1 cm. The snow depth distribution histograms are very similar and mainly differ in a smoother tailing off of the number of measurements per bin towards larger snow depths.

4.1. Inter-Comparison with ASPeCt Visual Ship-Based Snow Depth Observations

Available in-situ observations of snow depth on sea ice from expeditions into the Weddell or Bellingshausen Sea or East Antarctic sea ice region either took place too early or too late to have temporal overlap with the ICESat measurement periods.
A comparison with ASPeCt observations carried out during the expedition SIMBA (24 September until 27 October 2007) [28,29] revealed AMSR-E snow depths of 25 cm to 35 cm south of 70°S, while ASPeCt snow depths ranged between 45 cm and 55 cm in the same area. For the ICESat period with temporal overlap: ON07 (see Table 1), our ICESat snow depths are 40 cm to 50 cm in the SIMBA area. Our ICESat snow depths therefore agree more closely with ASPeCt snow depths than AMSR-E snow depths.
The expedition WWOS ended a week before period ON06 started. In addition, WWOS took place in the region where many AMSR-E snow depth data are flagged as being influenced by wet snow and/or melt–refreeze cycles (see Figure 1, bottom, ON06). A comparison of our results with WWOS ASPeCt data does not seem meaningful therefore.
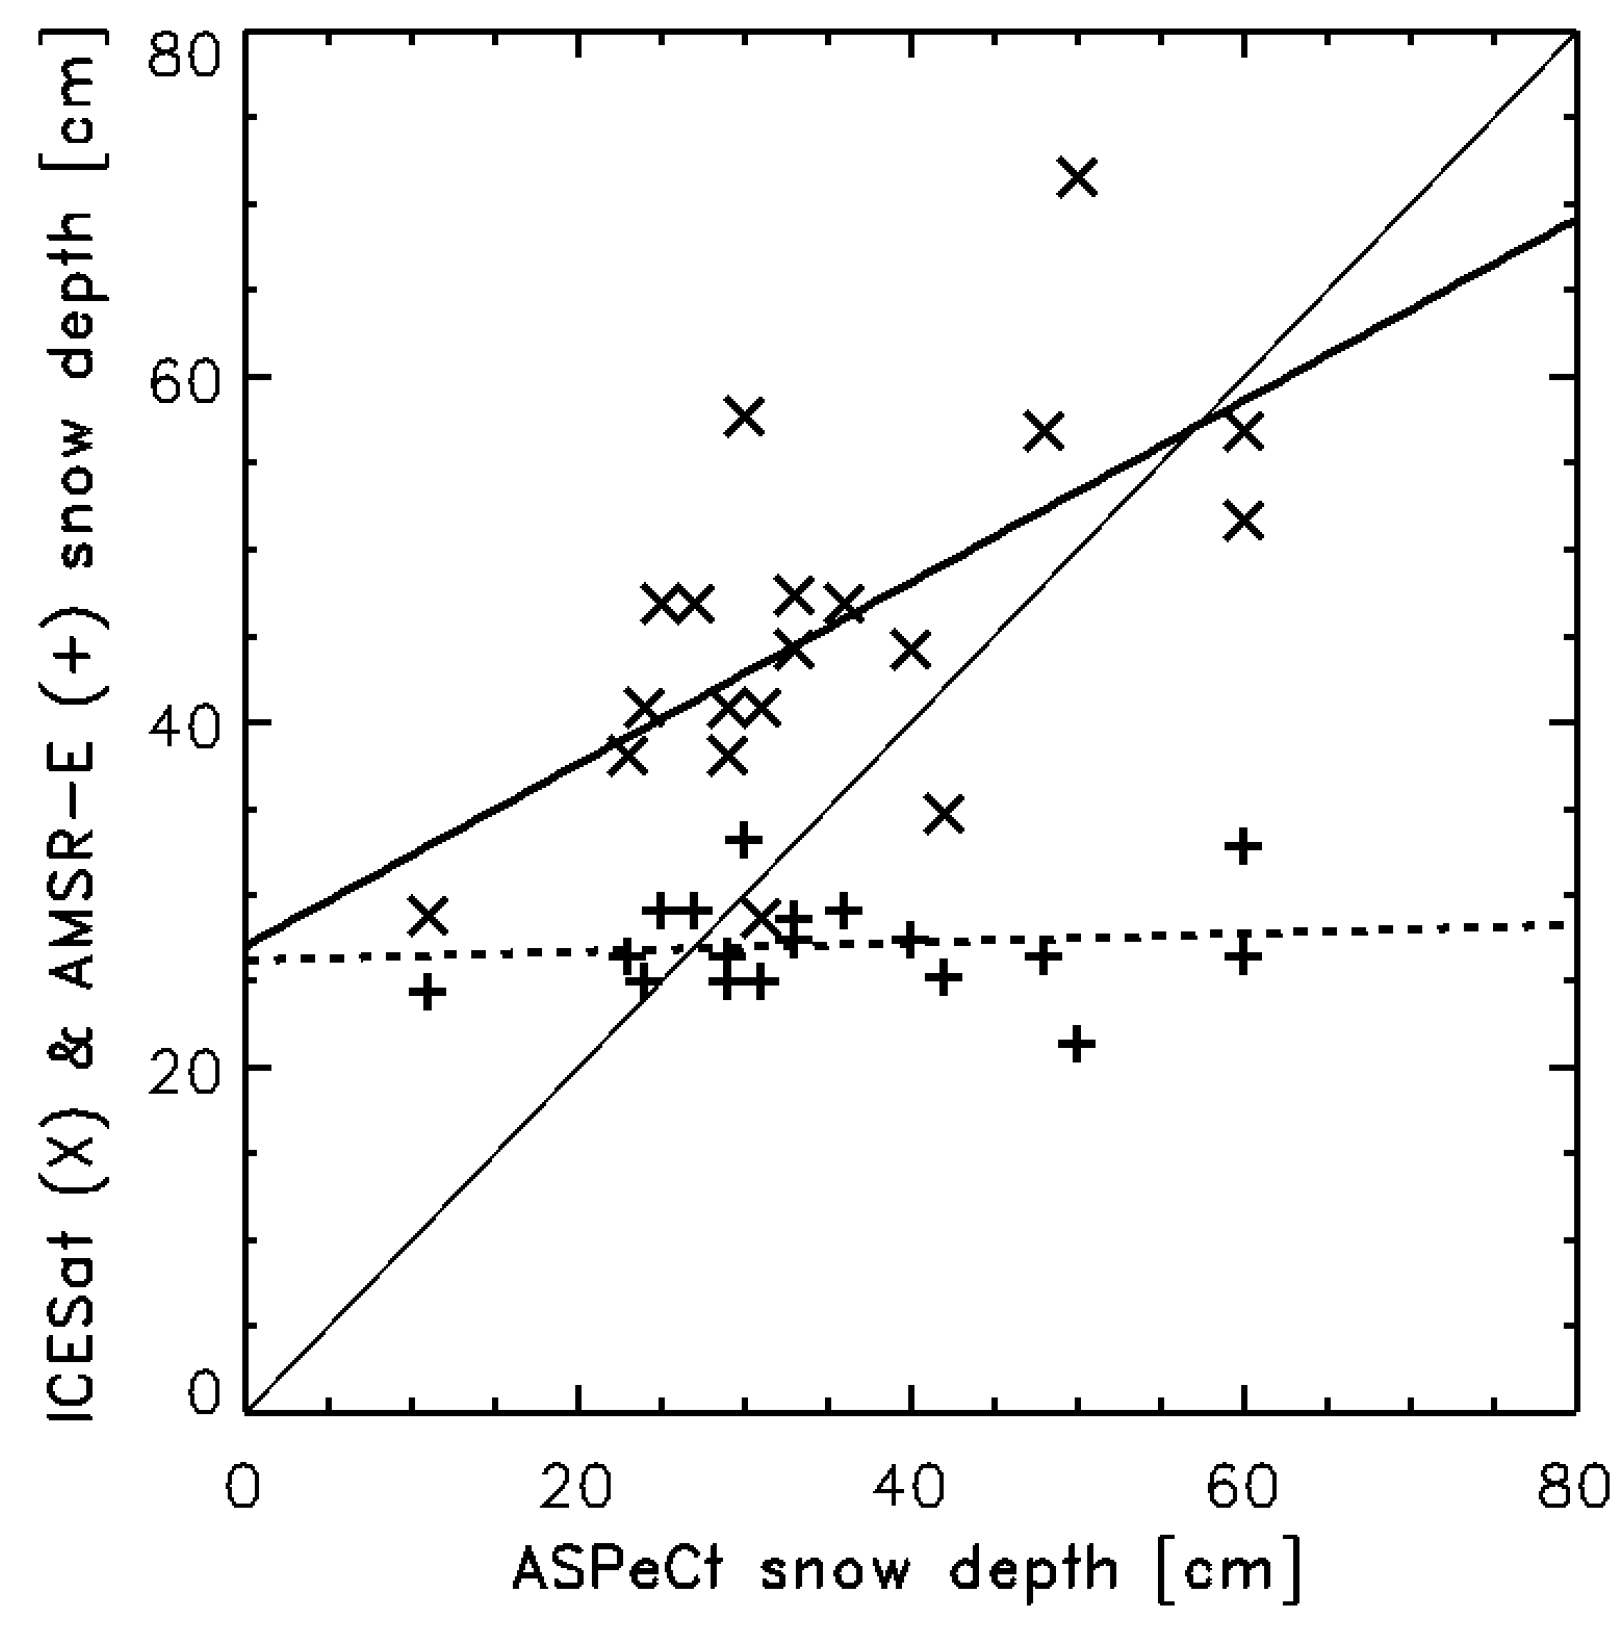
The expedition ISPOL took place a week after period ON04 ended but within two weeks the ice station was reached so that the time difference between ASPeCt observations from ISPOL and ICESat observations during the period ON04 is only 1–3 weeks. We therefore can carry out a qualitative inter-comparison between space-borne snow depth observations of ON04 and ASPeCt snow depth observations from ISPOL. For this purpose, we co-locate the ASPeCt observations to those satellite data 25 km resolution grid cells that have the smallest difference between grid cell center and ASPeCt observation location. We use only ASPeCt observations, which are separated from each other by at least 3 km to avoid giving too much weight to observations when the ship was on station or stuck in ice for several hours. We use only ASPeCt observations with a total sea ice concentration >90%. We treat ASPeCt observations with a snow depth larger or smaller than the mean ASPeCt snow depth plus or minus two standard deviations as outliers; this caused two values to be discarded from our analysis. The results are shown in Figure 10. The range of snow depths obtained from ICESat (25 cm to 70 cm) agrees substantially better with the one from ASPeCt (10 cm to 60 cm) than with the one from AMSR-E (22 cm to 34 cm). ICESat snow depths seem to be positively biased, particularly for smaller snow depths. However, ASPeCt observations of snow depth have a limited representativity and are potentially biased low as has been detailed in Section 2.1. By no means, these can be regarded as the truth and our results have to be interpreted carefully, as we also underline in the last paragraph of Section 4.1.
We include linear regression lines into Figure 10. These are meant to underline the general distribution of the data pairs rather than to suggest a linear relationship between the data sets. The latter would require a similar statistical distribution of the data sets, which we doubt is the case. On the one hand, ASPeCt observations are representative for a much smaller area (2 km times about 4 km) than the satellite data (grid resolution: 25 km × 25 km). On the other hand, ASPeCt observations miss the deeper snow on deformed sea ice and on very thick sea ice (see Section 2.1). We note also, that the satellite data represent the average snow depth of the entire period ON04, i.e., 35 days (see Table 1), while ASPeCt data (ideally) have hourly temporal resolution. In other words, we assume that the snow depth distribution remains constant over our investigation period. This is a severe constraint and underlines why we only carry out a qualitative inter-comparison, why we focus on the range of snow depths encountered, and why a discussion of the different spatial scales involved can be omitted.

4.2. Inter-Comparison with OIB Snow Depth Observations

Snow depth on Antarctic sea ice was estimated from air-borne snow radar measurements carried out during OIB flight campaigns in the Weddell and Bellingshausen Sea in October 2010 and 2011 [19]. The OIB snow radar is capable to provide an estimate of the snow depth on sea ice by measuring the distance between the supposedly strong reflection of the radar waves at the ice–snow interface and the reflection of the radar waves at the snow surface. The effective range resolution is between 6 cm and 7 cm [19]. The accuracy is between 3.5 cm and 5 cm for a snow depth range from 10 cm to 70 cm [19]. Strong density and/or grain size gradients in the snow, a flooded ice–snow interface and strongly deformed sea ice limit OIB snow depth retrieval. The finite range resolution leads to an under-sampling of thin snow. The bias due to this under-sampling is reported to be 5 cm to 8 cm for the Antarctic flights used here [19]. These values are of the same magnitude as those reported by [40] for the Arctic. Despite these limitations, the OIB observations provide us with very valuable information about the snow depth distribution along the flight tracks. We note, however, that OIB data were acquired in different years. Therefore our inter-comparison can only be a qualitative one.
For repeat track flights in the Weddell Sea, going basically from the tip of the Antarctic Peninsula to Cap Norvegia and back, [19] found along-track averaged snow depths between 27 cm and 41 cm, and 23 cm and 51 cm in late October of years 2010 and 2011, respectively. For tracks in the southern Bellingshausen Sea snow depths range between 26 cm and 74 cm in late October 2010 and between 28 cm and 63 cm in late October 2011. The track length was ~500 km. Even though these OIB observations were carried out after the ICESat lifetime we can check whether snow depth observations from the two empirical approaches used in the present paper fall into the range given by the OIB observations. We computed the mean AMSR-E and ICESat snow depth for all four spring periods (see Table 1) for regions “Belling” and “West” shown in Figure 9. The results are summarized in Table 4 and Table 5.
For region Bellingshausen Sea (see “Belling” in Figure 9), we find that the mean ICESat snow depth exceeds the mean AMSR-E snow depth by 15 cm to 20 cm. For three of the four years, ICESat snow depths fit better into the above-mentioned range of OIB snow depths than AMSR-E snow depths (Table 4). For ON04 and ON07, the mean AMSR-E snow depth even falls completely out of the OIB snow depth range. For ON06, however, the mean AMSR-E snow depth exceeds the mean ICESat snow depth by 16 cm and hence fits better into the OIB snow depth range. For region Weddell Sea (see “West” in Figure 9), OIB snow depths vary between 50 cm and 60 cm. Here the mean ICESat snow depth exceeds the mean AMSR-E snow depth by between 17 cm (ON07) and 34 cm (ON04). For all four ON period, the mean ICESat snow depth fits better into the OIB snow depth range than AMSR-E snow depths do (Table 5). Mean AMSR-E snow depths are about 20 cm to 30 cm smaller than OIB snow depths.
Even though the OIB snow depth estimates used here are from different years and have not yet been validated [19], these data suggest that snow depth on sea ice observed by AMSR-E is under-estimated in the two regions considered, and that the snow depth derived with our empirical approach from ICESat total freeboard agrees better with OIB snow depths.

4.3. Consistency Check: Winter to Spring Snow Depth Evolution

The lack of sufficient independent validation data for the ICESat lifetime motivated us to search for alternative measures of quality or consistency of our ICESat snow depth estimates. One such measure is the evolution of the snow depth from winter to spring. We computed the average snow depth for each region shown in 
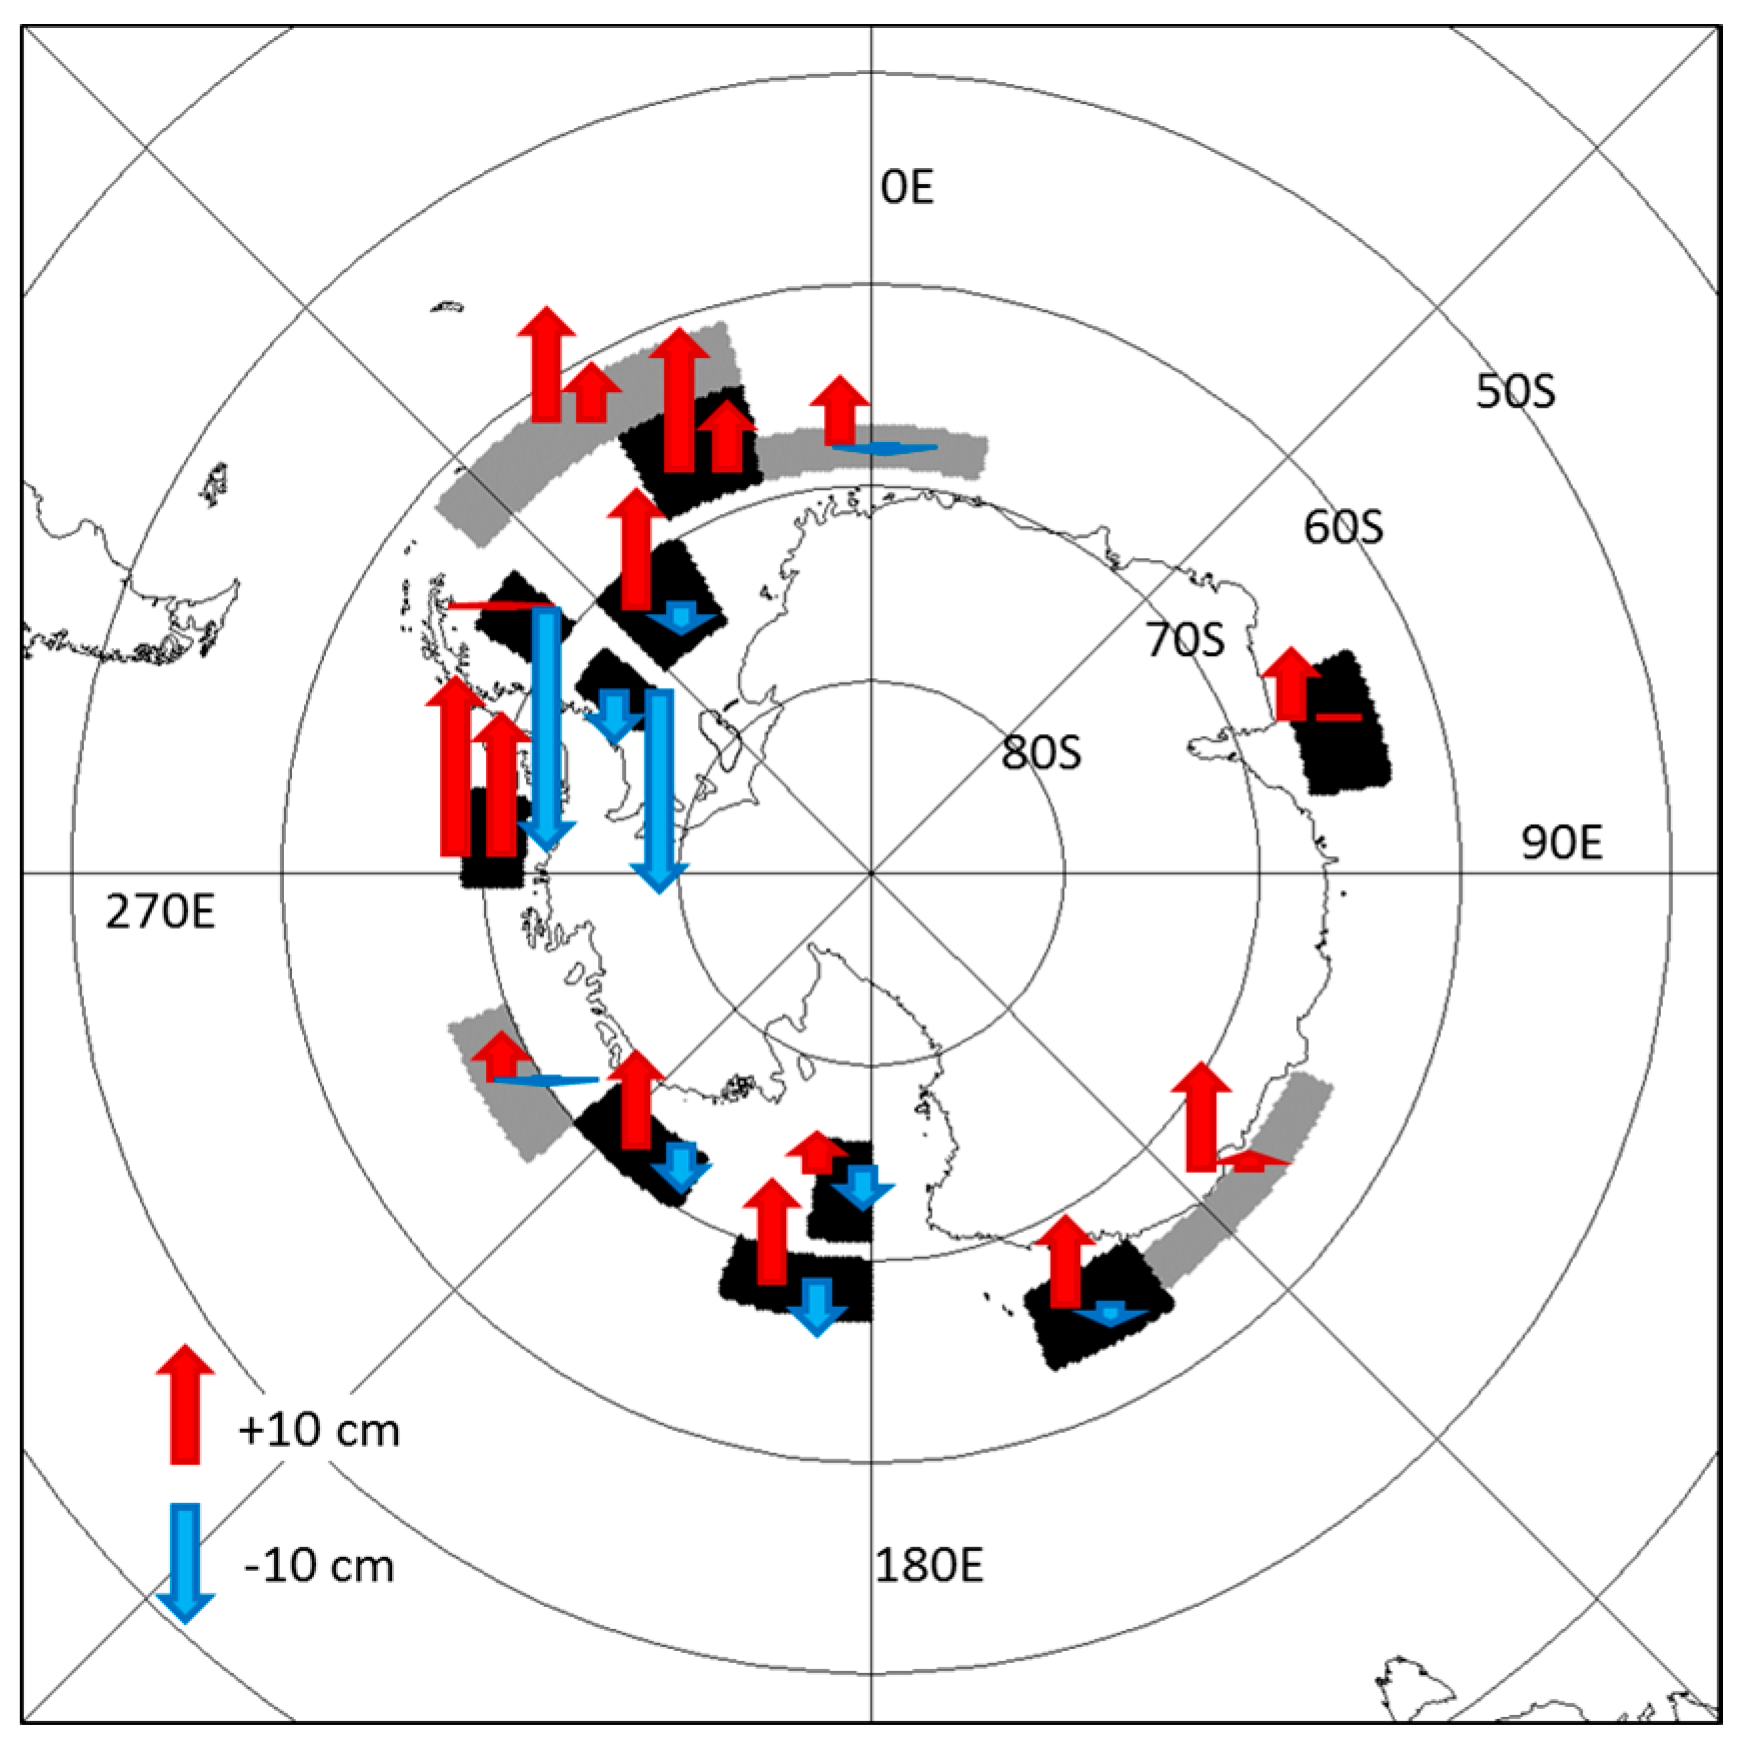
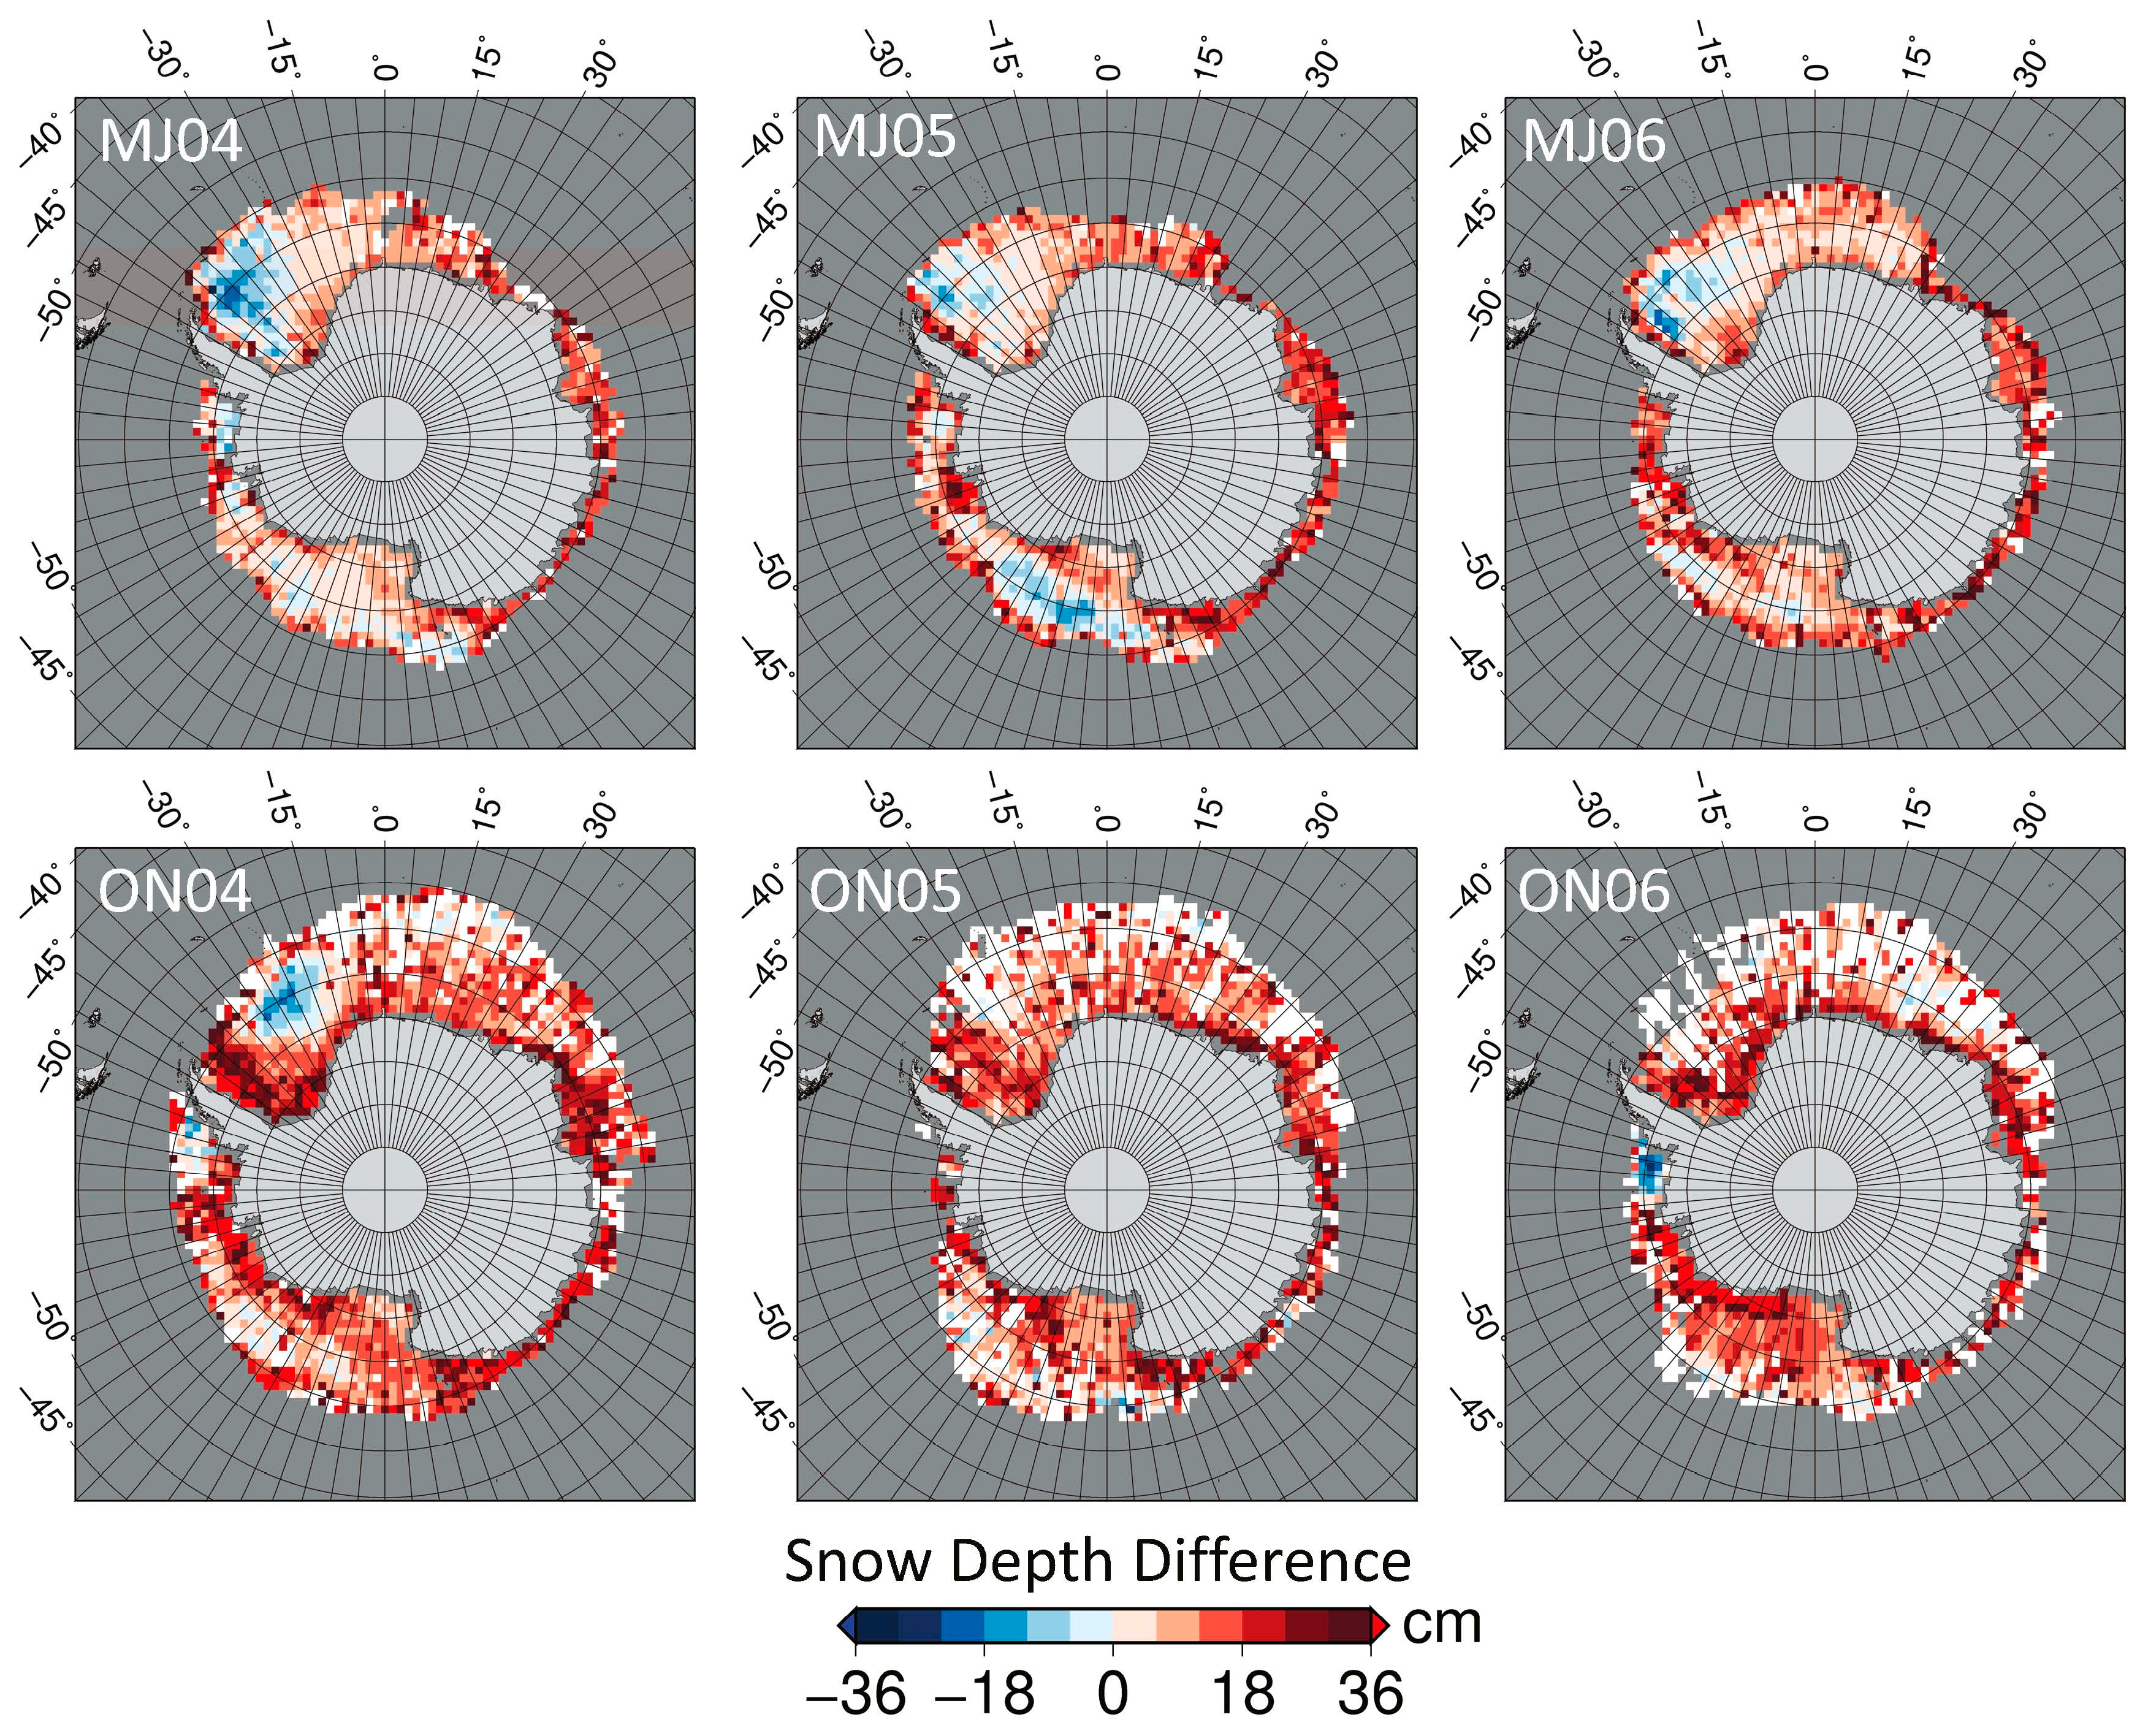
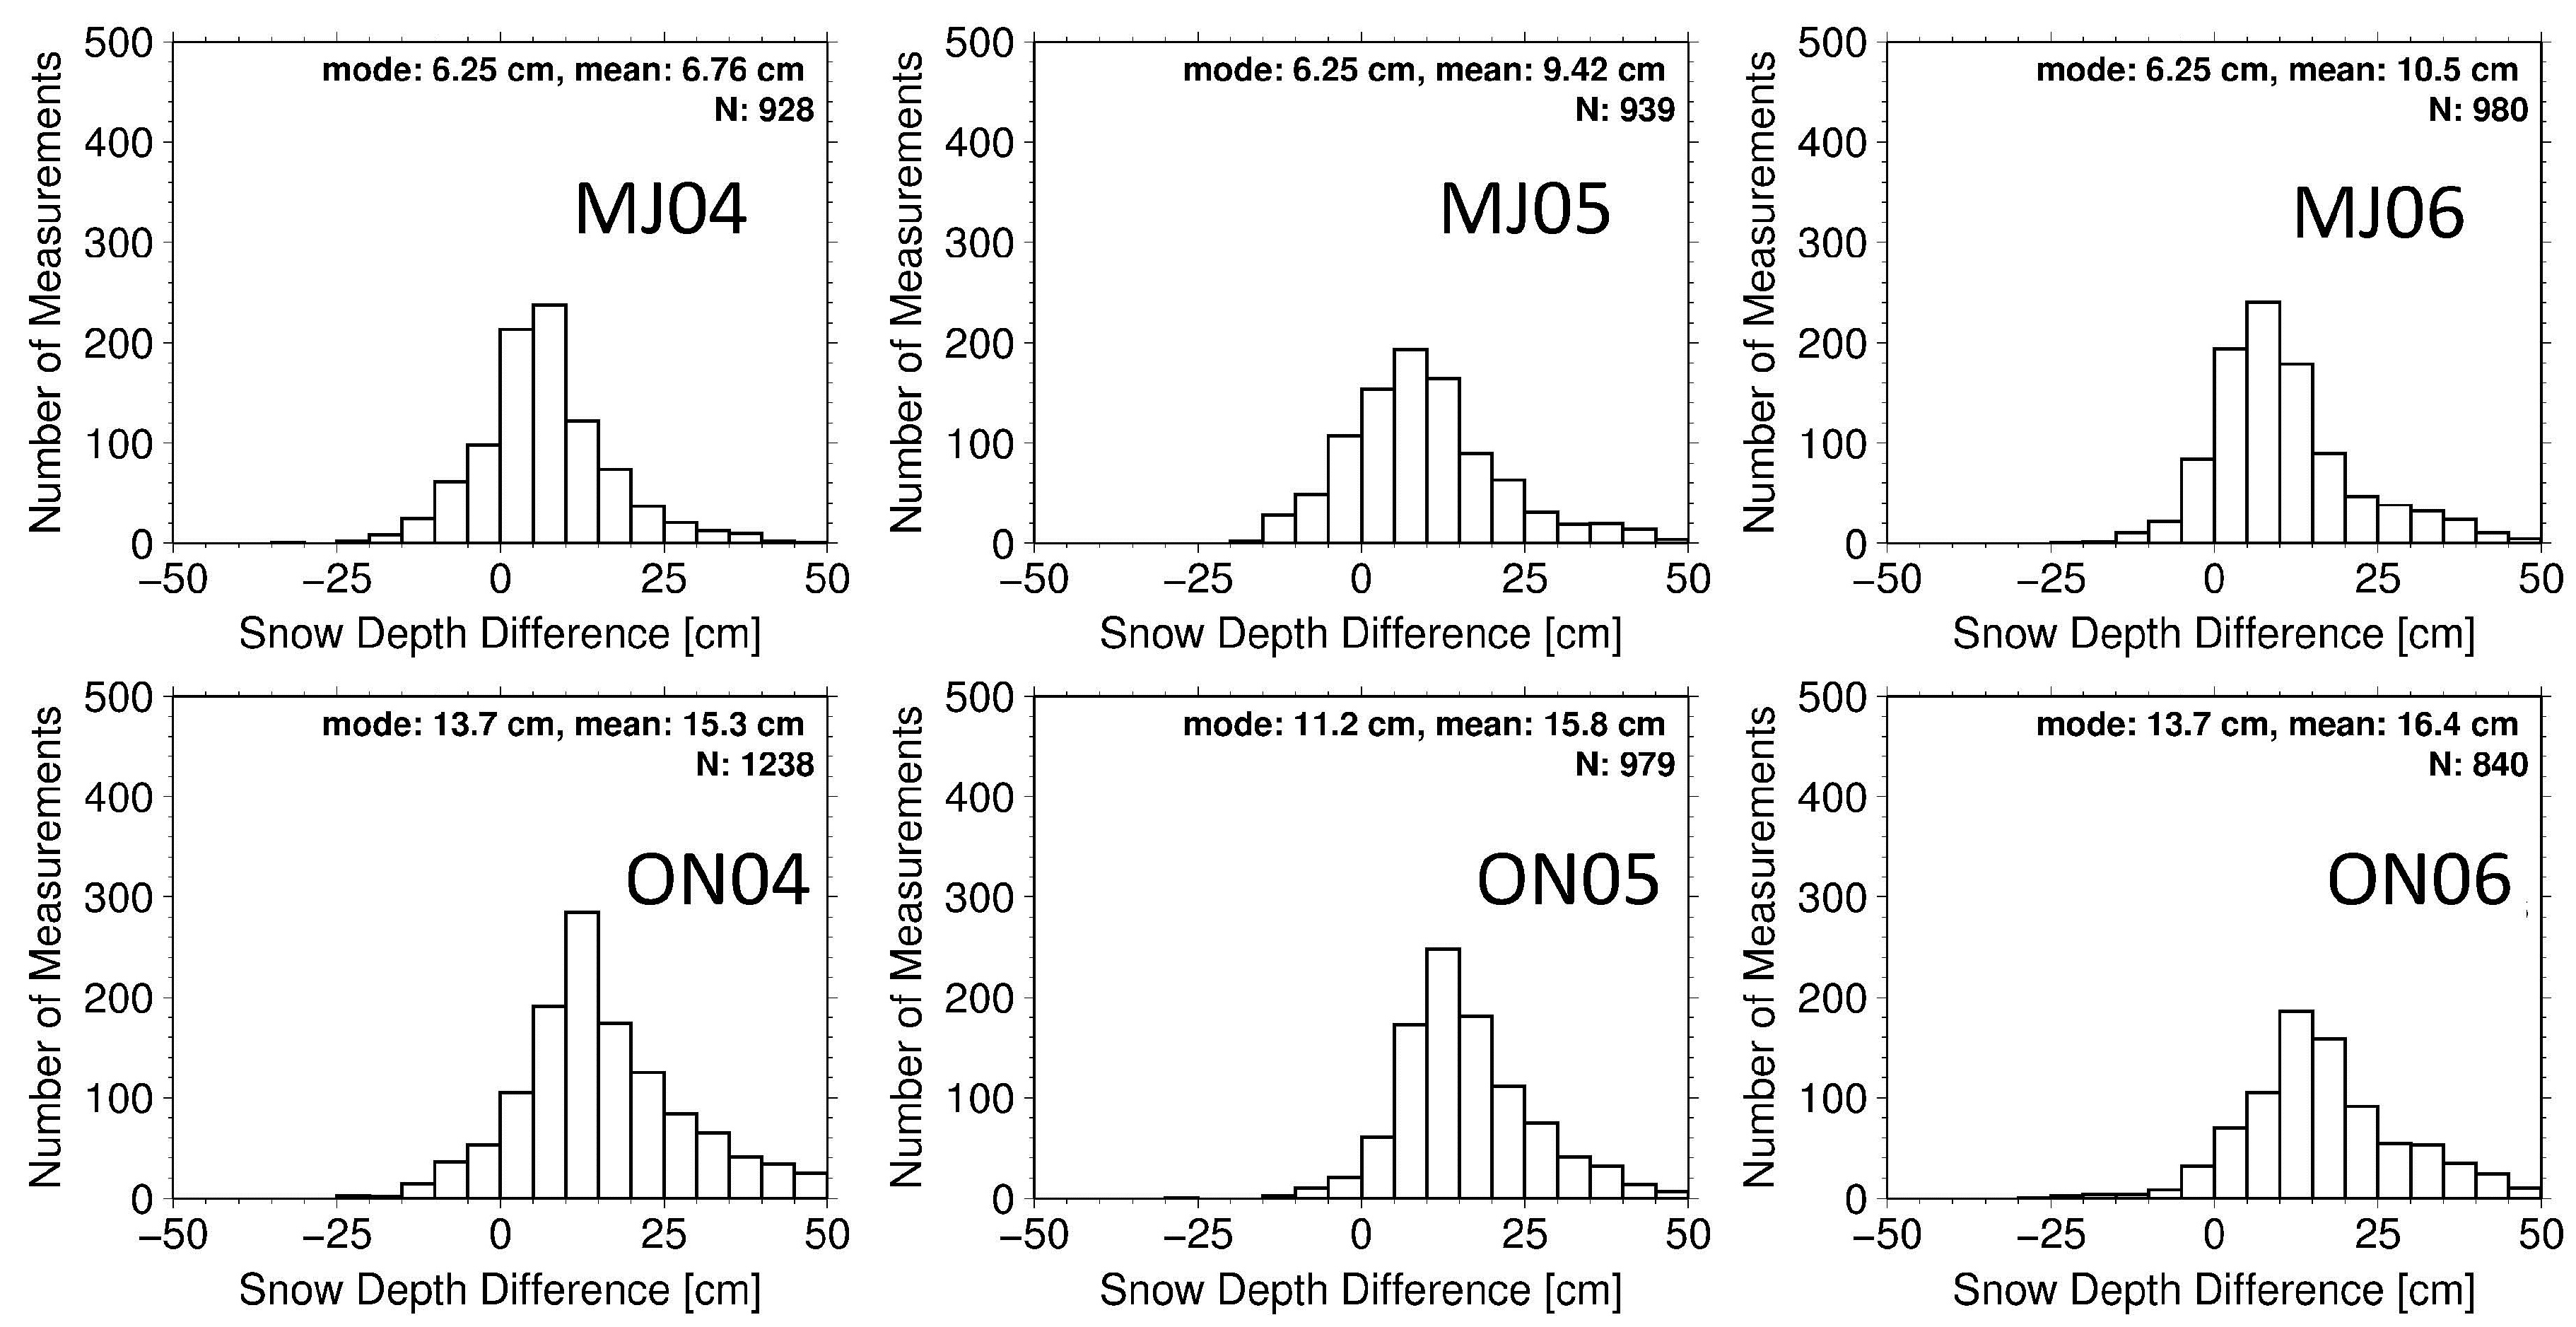
Figure 9. For ICESat and AMSR-E, we derived the average winter and average spring snow depth using data from years 2004 to 2006; only for these three years ICESat data exist for both seasons. Subsequently, we subtract the winter snow depth from the spring snow depth and visualize the resulting difference by upward red (snow depth increase) and downward blue (snow depth decrease) arrows in Figure 11.
All regions show an increase in ICESat snow depth from winter to spring by at least 3 cm, with two exceptions: regions “Southwest” and “West” (see Figure 9). In region “West”, ICESat snow depths stay constant, and in region “Southwest”, ICESat snow depth decreases by about 3 cm. In contrast, AMSR-E snow depth decreases by 3 cm or more from winter to spring in 7 of the 15 regions (Figure 11). This decrease is largest (~20 cm) in those two regions where ICESat snow depth does not increase. Of the remaining 8 regions, two have an AMSR-E snow depth increase from winter to spring, which is at least half the one observed by ICESat: Regions “Central” and “Northwest” (see Figure 9). Only region “Belling” reveals an increase in AMSR-E snow depth comparable to that of ICESat snow depth. Region “Belling” reveals the largest snow depth increase from winter to spring in both data sets. This agrees with the finding that the Antarctic Peninsula and western Antarctic receives large amounts of precipitation year round [8,41].
Can we explain the decrease in snow depth in regions “Southwest” and “West”? In these regions perennial ice is drifting north- and later-on northwestward. It is replaced by younger, thinner seasonal sea ice. This seasonal sea ice either originates from the Filchner-Ronne Ice Shelf polynya or from the regions further east: “SouthCentral” and “EasternCoastal” (see Figure 9). Perennial ice usually has a thicker snow cover than seasonal sea ice because the snow can accumulate on it for a longer time period. The replacement of the old by the younger ice in regions “Southwest” and “West” can explain a decrease in snow depth from winter to spring. Whether this decrease can be as large as 20 cm, as suggested by AMSR-E, remains to be investigated. However, we would expect that a change in snow depth caused by ice drift would influence the average regional snow depth similarly in both products.
AMSR-E snow depth is known to be relatively accurate for undeformed sea ice while snow depths are underestimated by up to a factor of 2 over deformed (rough) sea ice [27,28,29,30]. It was shown by [30] that combining AMSR-E brightness temperature observations with surface roughness information can lead to a substantial reduction in the AMSR-E snow depth bias over rough sea ice. In contrast, ICESat senses the snow surface and allows us to retrieve the snow depth independent from the ice surface roughness. Therefore, an increase in snow depth caused by more snow accumulation over deformed sea ice can most likely be identified in the ICESat snow depth data but it is less likely, that this increase can be identified in the AMSR-E snow depth data. We hypothesize that snow depth under-estimation by AMSR-E due to sea-ice deformation processes is one of the main factors contributing to the different evolution of the retrieved snow depth between winter and spring.
Snow-ice formation is another important factor that needs to be included when discussing the evolution of the snow depth from winter to spring [3,8]. Snow-ice formation is a three-step process. Step I: Snow accumulates on sea ice. Snow depth and total freeboard increase. Step II: The snow load suppresses the ice–snow interface below the sea surface. Seawater enters the ice–snow interface and the basal snow layer becomes wet. Snow depth and total freeboard evolution during this stage is uncertain as it depends on various environmental factors. Stage III: Under freezing conditions, the wet basal snow layer refreezes and becomes snow-ice, adding buoyancy to the sea ice and lifting it up by a few centimeters. Snow depth decreases relative to Stage I. The net change in total freeboard between Stages I and III is uncertain and depends on the amount of snow which is converted to snow-ice.
These changes in snow depth and total freeboard may be as large as several centimeters to, in extreme cases, a few ten centimeters. We hypothesize, however, that at a spatial scale of 100 km and a temporal scale of about one month, which we use, net changes in snow depth and total freeboard between the three mentioned stages are of the order of a few centimeters only. This is of the same order of magnitude as the ICESat snow depth retrieval uncertainty (see Figure 5). AMSR-E snow depth retrieval is sensitive to snow wetness and grain size [24]. Both parameters vary during snow-ice formation events and hence add noise to the snow depth retrieved from AMSR-E, making the estimates less accurate. In-situ observations suggest snow-ice fractions in sea ice cores of between 10 cm and 30 cm (Table 1 in [8]). Could repeated snow-ice formation events therefore result in a bias in the estimated snow depth because of the increase in the sea ice freeboard? Most likely this is not the case, because snow-ice formation events alternate with phases of snow accumulation during which the sea ice freeboard reduces again. This is supported by the compilation of in-situ observations by (Table 3 in [6]), which reveals average sea ice freeboard values of −1 cm to 5 cm.
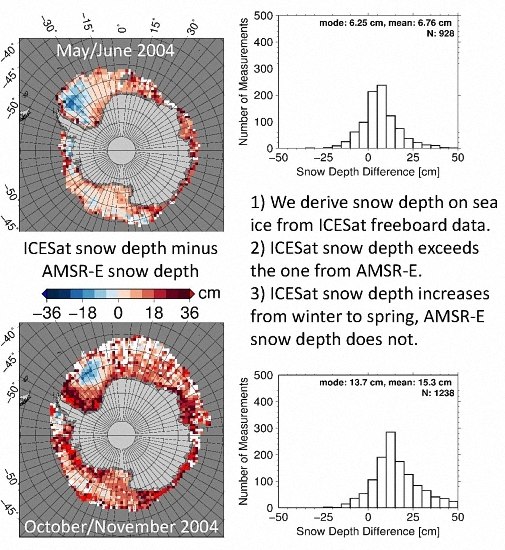
ASPeCt observations suggest an increase in the circum-Antarctic average snow depth from 11 cm in winter to 15 cm in spring, i.e., by ~5 cm [
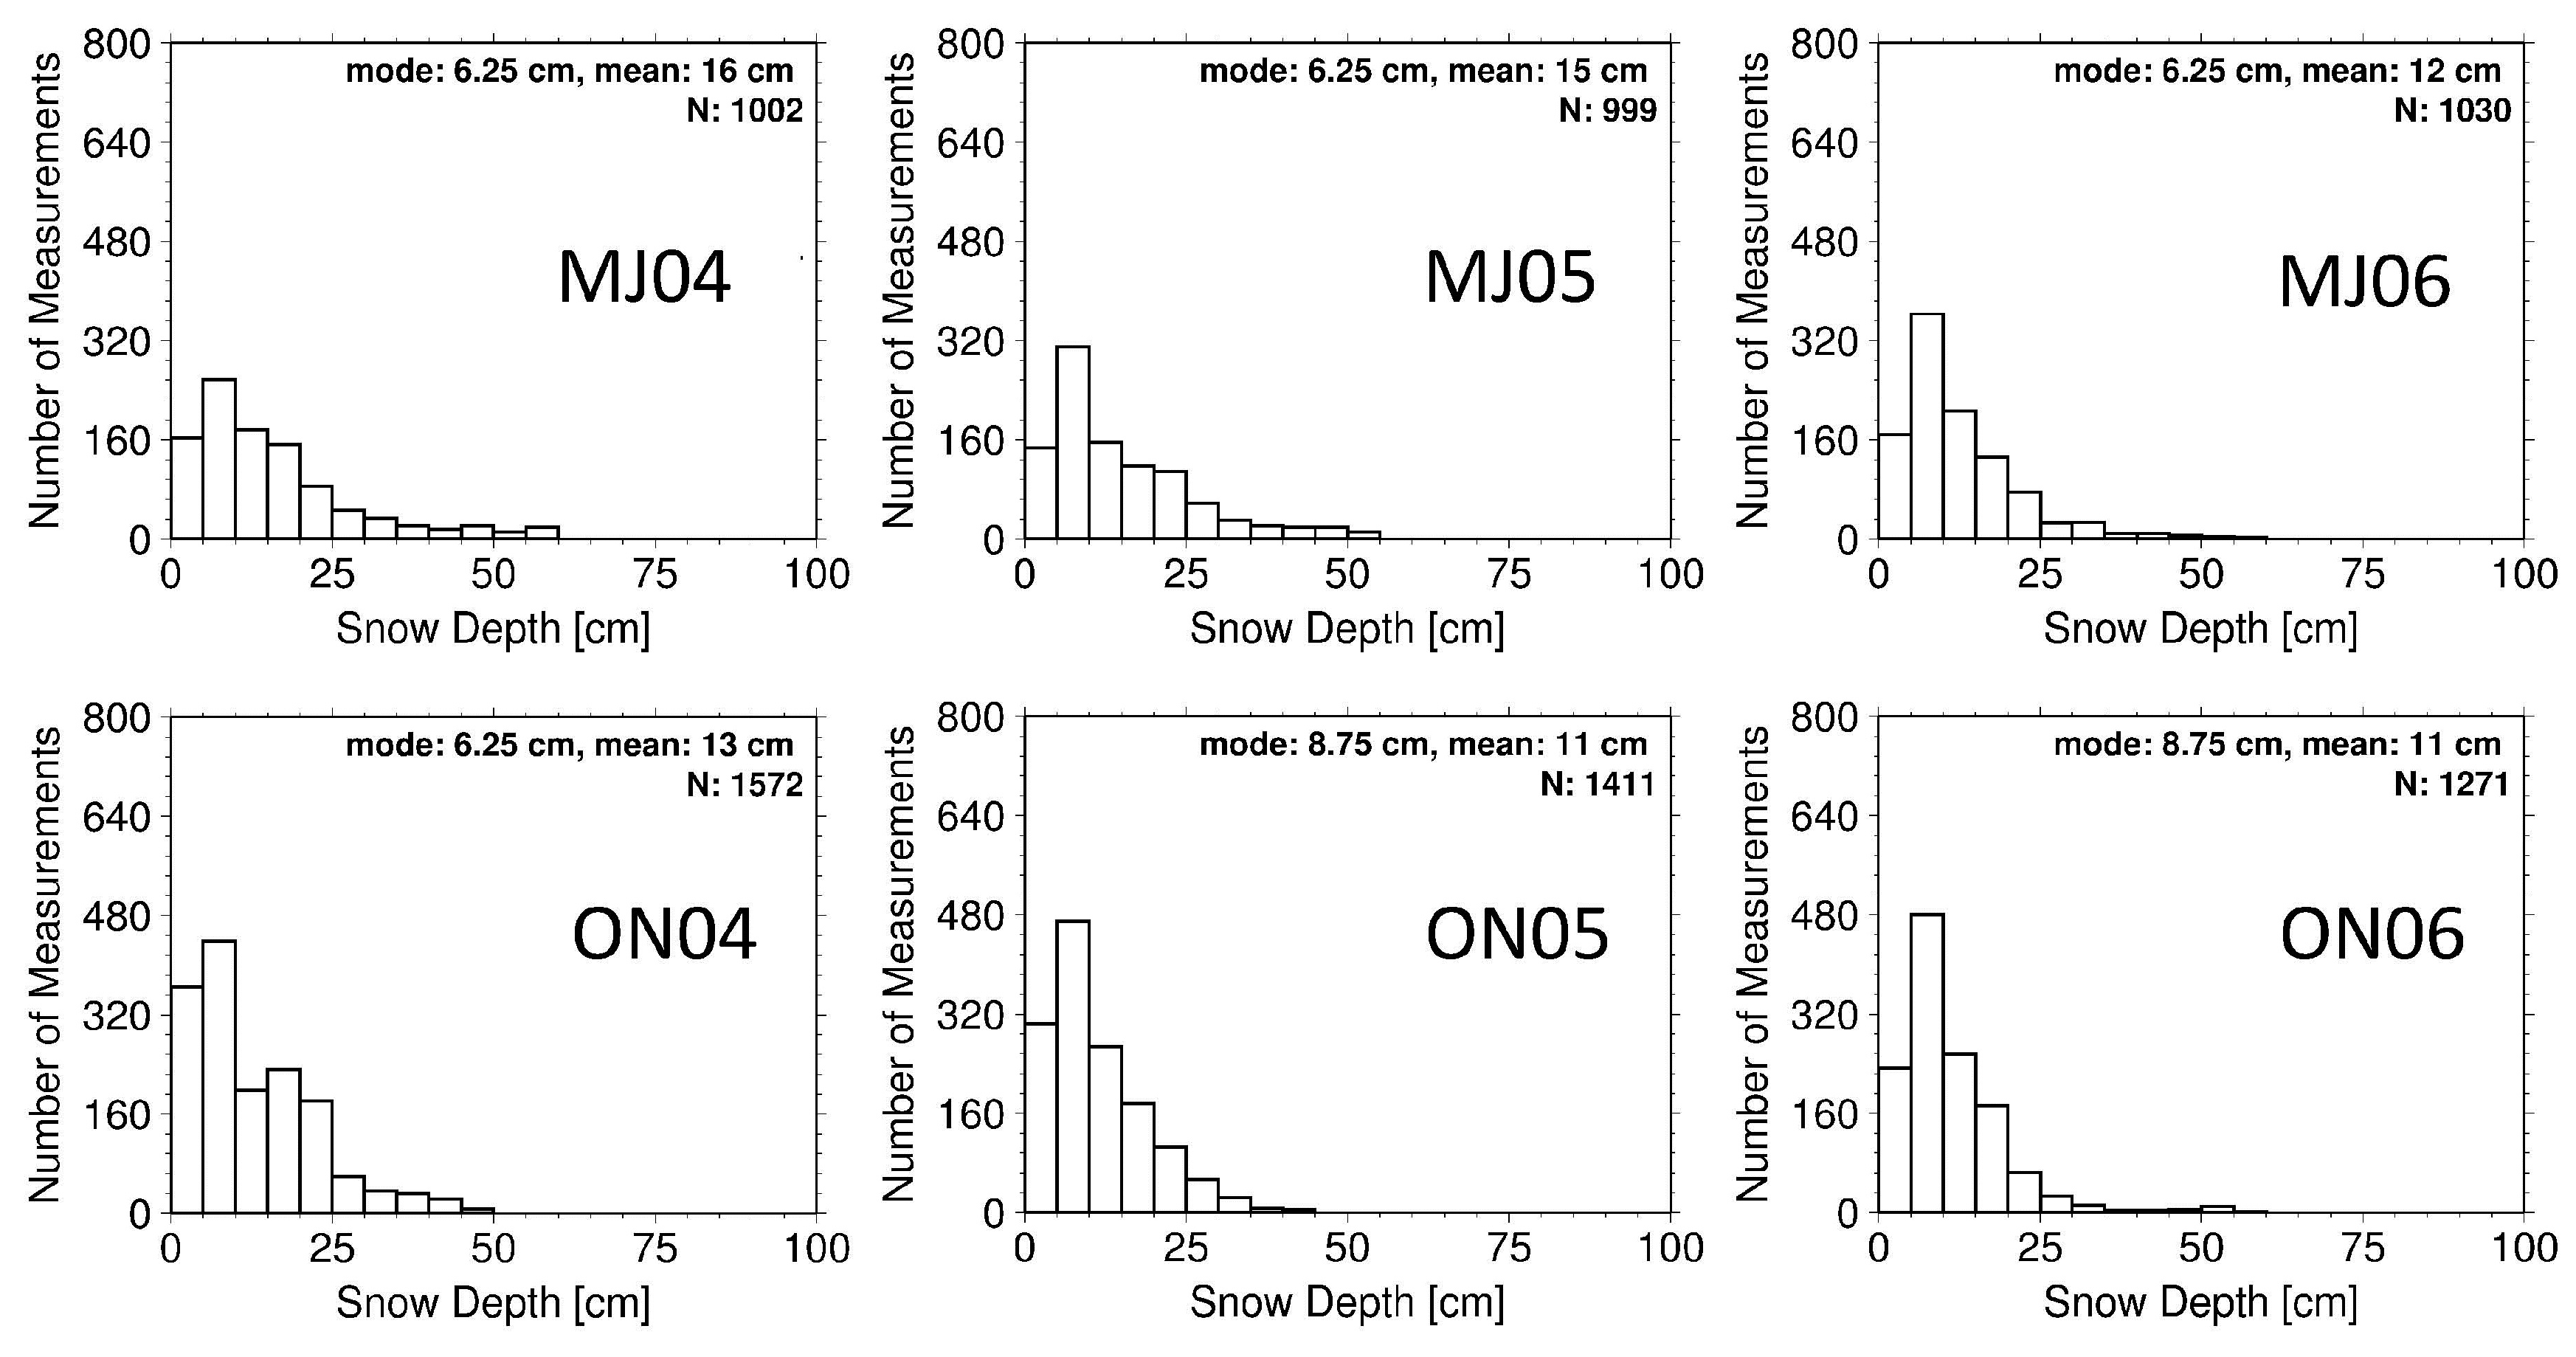
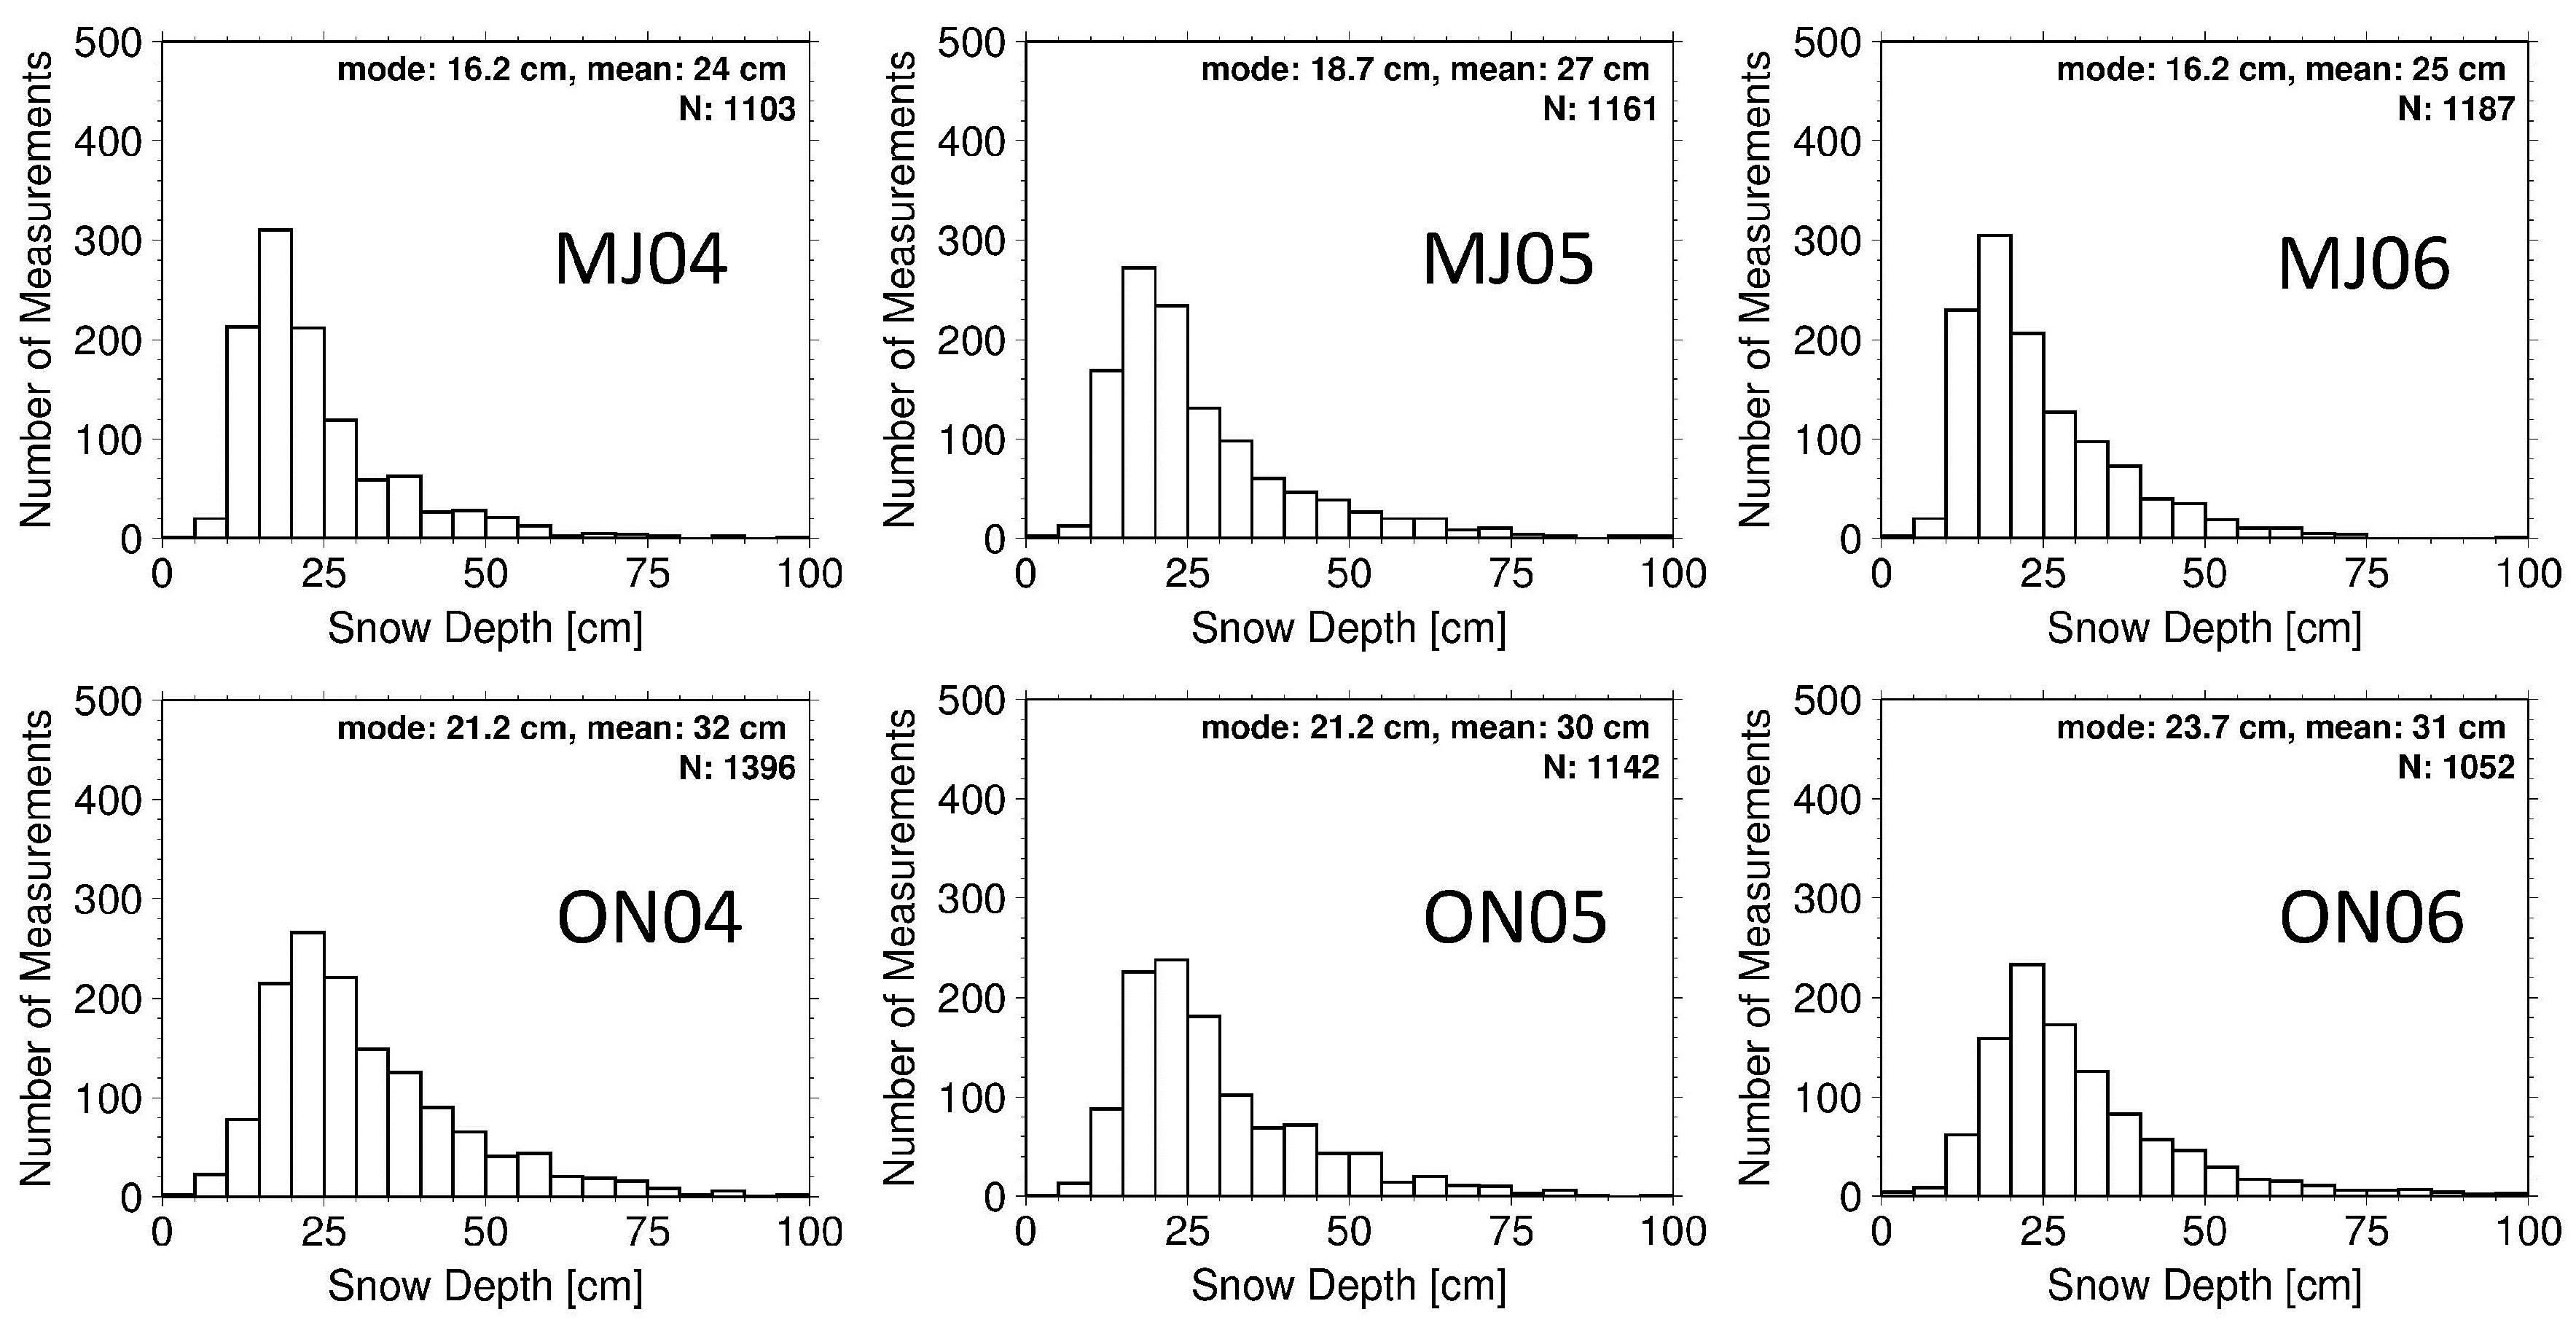
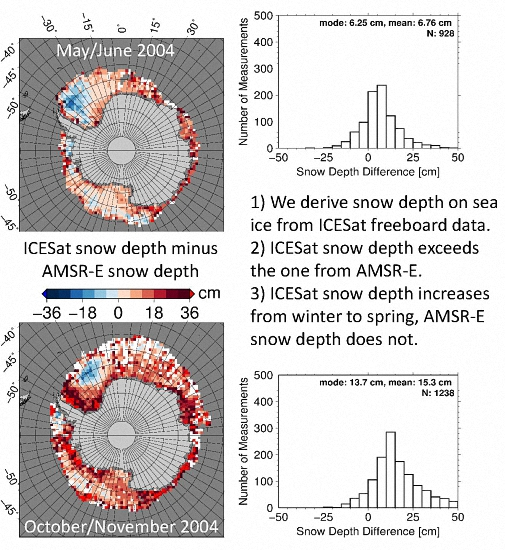
23]. We find that the increase in the average modal ICESat snow depth between winter and spring of years 2004 to 2006 fits well with the above-mentioned increase in ASPeCt snow depth. In contrast, the average modal AMSR-E snow depth does not increase from winter to spring (see discussion of Figure 3 and Figure 4) as does the average mean AMSR-E snow depth. Snow depth observations on fast ice near Neumayer Station in Atka Bay support the increase in snow depth from winter to spring: The average snow depth increases 0–10 cm, 10–25 cm, and 30–50 cm in May/June to 20–80 cm, 70–100 cm, and ~120 cm in October/November for years 2010, 2011, and 2013, respectively [42,43,44]. This corresponds to an average increase of ~50 cm. This is between about five to ten times more than what we obtain from ICESat and AMSR-E for the adjacent regions “CentralCoastal” and “Central” (see Figure 9) for years 2004 to 2006: 5 cm and 0 cm, and 10 cm and 5 cm, respectively (Figure 11). However, the difference in the magnitude of the observed snow depth increase can—in our opinion—be easily explained with the environmental conditions relevant for snow accumulation, which differ between drifting sea ice off the coast and fast ice close to the coast, and which include processes such as blowing snow, orographic enhancement of precipitation, snow-ice formation, and deformation.

5. Conclusions

We compare the Antarctic snow depth on sea ice product derived from satellite passive microwave observations of the Advanced Microwave Scanning Radiometer aboard the Earth Observation Satellite (AMSR-E) with a new snow depth product based on Ice Cloud and land Elevation Satellite (ICESat) total (sea ice plus snow) freeboard measurements. We derive ICESat snow depth from the total freeboard using an empirical approach, which is based on linear regression analysis of in-situ measurements of total freeboard and snow depth. We demonstrate that snow depth on Antarctic sea ice can be derived from ICESat total freeboard measurements successfully and that associated retrieval uncertainties remain at a reasonably low level.
We find that ICESat snow depth is larger than AMSR-E snow depth over the majority of the Antarctic sea ice cover. The average difference is about 5–10 cm in winter (May/June), and increases to 10–15 cm in spring (October/November). Both the modal and the mean AMSR-E snow depths are smaller than corresponding ICESat snow depths. From qualitative inter-comparison with Antarctic Sea ice Processes and Climate (ASPeCt) visual ship-based observations in the Weddell Sea we find that ICESat snow depths agree much better with the range of snow depths from ASPeCt observations than AMSR-E snow depths do. From another qualitative inter-comparison with Operation Ice Bridge (OIB) air-borne snow depth estimates in the Weddell and Bellingshausen Seas, we find that ICESat snow depths fit better into the range of snow depth estimates from OIB observations than AMSR-E snow depths do. In addition, we find that the average circum-Antarctic AMSR-E snow depth does not increase from winter to spring. In contrast, the circum-Antarctic modal and mean snow depth derived from ICESat increase by ~5 cm and ~7 cm, respectively, from winter to spring. This increase agrees well with ASPeCt observations and with the evolution of the snow depth on fast ice in Atka Bay. We investigate regional changes in snow depth from winter to spring and find an increase in ICESat snow depth of at least 3 cm for 13 of the 15 regions investigated and of at least 8 cm for 8 of these regions. In contrast, we find a decrease in AMSR-E snow depth by at least 3 cm for 7 of the 15 regions.
We conclude that, in terms of the snow depth range and in terms of the winter-to-spring snow depth evolution, ICESat snow depth agrees better with the actual snow depth on Antarctic sea ice than AMSR-E snow depth does. We conclude further that therefore an approach, which is based on satellite laser altimetry, might be even superior to satellite microwave radiometry because it is not sensitive to properties such as snow wetness and grain size and less sensitive to (ice) surface roughness. Based on our results, we underline, in accordance with previous studies, that snow depth on Antarctic sea ice based on satellite microwave radiometry should be used carefully and that such snow depth data potentially fail to capture correctly the snow depth evolution from winter to spring.
Future usage of the winter-to-spring snow depth evolution as a metric to assess the quality of snow depth products for Antarctic sea ice requires improvement in the understanding of the spatiotemporal evolution of the processes involved in snow accumulation on Antarctic sea ice. A substantial, yet unknown, fraction of the snow is blown into openings between the ice floes or is converted into snow-ice. The fraction of deformed sea ice and hence of ice with larger snow accumulation is unknown. A combination of multi-frequency satellite observations and numerical modeling of snow-ice-interaction processes and their impact on the microwave properties of the sea ice and snow relevant for its remote sensing by active and passive satellite microwave sensors is required to advance the knowledge and improve both retrieval and evaluation of snow depth on sea ice.

Acknowledgments

The work was carried out within the ESA Climate Change Initiative sea ice (SICCI) project as an activity of the Integrated Climate Data Center (ICDC) at the Center for Earth System Research and Sustainability (CEN). S. Kern acknowledges support given by the Center of Excellence for Climate System Analysis and Prediction (CliSAP). B. Ozsoy-Çiçek appreciates support given by the Istanbul Technical University (ITU) in the field of polar research, which greatly helped to conduct this study and to realize a recent Turkish research cruise into the Antarctic. The authors acknowledge support from the International Space Science Institute (ISSI), Bern, Switzerland, under project No. 245: Heil, P., and S. Kern, “Towards an integrated retrieval of Antarctic sea ice volume”. The authors thank five reviewers for their helpful comments.

Author Contributions

Stefan Kern and Burcu Ozsoy-Çiçek analyzed the data; Stefan Kern and Burcu Ozsoy-Çiçek contributed materials/analysis tools; and Stefan Kern wrote the paper.

Conflicts of Interest

The authors declare no conflict of interest.

Abbreviations

The following abbreviations are used in this manuscript:
AMSR-EAdvanced Microwave Scanning Radiometer aboard EOS
ASPeCtAntarctic Sea ice Processes and Climate
ICESatIce Cloud and Land Elevation Satellite

References

  1. Nicolaus, M.; Haas, C.; Bareiss, J.; Willmes, S. A model study of differences of snow thinning on Arctic and Antarctic first-year sea ice during spring and summer. Ann. Glaciol. 2006, 44, 147–153. [Google Scholar] [CrossRef]
  2. Nicolaus, M.; Haas, C.; Willmes, S. Evolution of first-year and second-year snow properties on sea ice in the Weddell Sea during spring-summer transition. J. Geophys. Res. 2009, 114, D17109. [Google Scholar] [CrossRef]
  3. Massom, R.A.; Eicken, H.; Haas, C.; Jeffries, M.O.; Drinkwater, M.R.; Sturm, M.; Worby, A.P.; Wu, X.; Lytle, V.I.; Ushio, S.; et al. Snow on Antarctic sea ice. Rev. Geophys. 2001, 39, 413–445. [Google Scholar] [CrossRef]
  4. Toyota, T.; Massom, R.; Tateyama, K.; Tamura, T.; Fraser, A. Properties of snow overlying the sea ice off East Antarctica in late winter, 2007. Deep Sea Res. II 2011, 58, 1137–1148. [Google Scholar] [CrossRef]
  5. Lewis, M.J.; Tison, J.L.; Weissling, B.; Delille, B.; Ackley, S.F.; Brabant, F.; Xie, H. Sea ice and snow cover characteristics during the winter-spring transition in the Bellingshausen Sea: An overview of SIMBA 2007. Deep Sea Res. II 2011, 58, 1019–1038. [Google Scholar] [CrossRef]
  6. Ozsoy-Cicek, B.; Ackley, S.F.; Xie, H.; Yi, D.; Zwally, J. Sea ice thickness retrieval algorithms based on in-situ surface elevation and thickness values for application to altimetry. J. Geophys. Res. Oceans 2013, 118, 3807–3822. [Google Scholar] [CrossRef]
  7. Jeffries, M.O.; Li, S.; Jana, R.A.; Krouse, H.R.; Hurst-Cushing, B. Late winter first-year ice floe thickness variability, seawater flooding and snow ice formation in the Amundsen and Ross Seas. In Antarctic Sea Ice: Physical Processes, Interactions and Variability; Jeffries, M.O., Ed.; AGU: Washington, DC, USA, 1998; Volume 74, pp. 69–87. [Google Scholar]
  8. Maksym, T.; Markus, T. Antarctic sea ice thickness and snow-to-ice conversion from atmospheric reanalysis and passive microwave snow depth. J. Geophys. Res. 2008, 113, C02S12. [Google Scholar] [CrossRef]
  9. Ivanova, N.; Pedersen, L.T.; Tonboe, R.T.; Kern, S.; Heyster, G.; Lavergne, T.; Sorensen, A.; Saldo, R.; Dybkjaer, G.; Brucker, L.; et al. Inter-comparison and evaluation of sea ice algorithms: towards further identification of challenges and optimal approach using passive microwave observations. Cryosphere 2015, 9, 1797–1817. [Google Scholar] [CrossRef] [Green Version]
  10. Willmes, S.; Nicolaus, M.; Haas, C. The microwave emissivity variability of snow covered first-year sea ice from late winter to early summer: A model study. Cryosphere 2014, 8, 891–904. [Google Scholar] [CrossRef] [Green Version]
  11. Comiso, J.C.; Cavalieri, D.J.; Parkinson, C.L.; Gloersen, P. Passive microwave algorithms for sea ice concentration: A comparison of two techniques. Remote Sens. Environ. 1997, 60, 357–384. [Google Scholar] [CrossRef]
  12. Kwok, R.; Cunningham, G.F. Variability of Arctic sea ice thickness and volume from CryoSat-2. Phil. Trans. R. Soc. A 2015, 373, 20140157. [Google Scholar] [CrossRef] [PubMed]
  13. Kwok, R.; Cunningham, G.F.; Wensnahan, M.; Rigor, I.; Zwally, H.J.; Yi, D. Thinning and volume loss of the Arctic Ocean sea ice cover: 2003–2008. J. Geophys. Res. 2009, 114, C07005. [Google Scholar] [CrossRef]
  14. Zwally, H.J.; Yi, D.; Kwok, R.; Zhao, Y. ICESat measurements of freeboard and estimates of sea-ice thickness in the Weddell Sea. J. Geophys. Res. 2008, 113, C02S15. [Google Scholar] [CrossRef]
  15. Yi, D.; Zwally, H.J.; Robbins, J.W. ICESat observations of seasonal and interannual variations of sea-ice freeboard and estimated thickness in the Weddell Sea, Antarctica (2003–2009). Ann. Glaciol. 2011, 52, 43–51. [Google Scholar] [CrossRef]
  16. Kern, S.; Spreen, G. Uncertainties in Antarctic sea-ice thickness retrieval from ICESat. Ann. Glaciol. 2015, 56, 107–119. [Google Scholar] [CrossRef]
  17. Xie, H.; Tekeli, A.E.; Ackley, S.F.; Yi, D.; Zwally, H.J. Sea ice thickness estimations from ICESat altimetry over the Bellingshausen and Amundsen Seas, 2003–2009. J. Geophys. Res. Oceans 2013, 118, 2438–2453. [Google Scholar] [CrossRef]
  18. Kurtz, N.T.; Markus, T. Satellite observations of Antarctic sea ice thickness and volume. J. Geophys. Res. 2012, 117, C08025. [Google Scholar] [CrossRef]
  19. Kwok, R.; Maksym, T. Snow depth of the Weddell and Bellingshausen sea ice covers from IceBridge surveys in 2010 and 2011: An examination. J. Geophys. Res. Oceans 2014, 119, 4141–4167. [Google Scholar] [CrossRef]
  20. Kern, S.; Ozsoy-Cicek, B.; Worby, A.P. Antarctic sea ice thickness retrieval from ICESat: Inter-comparison of different approaches. Remote Sens. under review.
  21. Ricker, R.; Hendricks, S.; Helm, V.; Skourup, H.; Davidson, M. Sensitivity of CryoSat-2 Arctic sea-ice freeboard and thickness on radar-waveform interpretation. Cryosphere 2014, 8, 1607–1622. [Google Scholar] [CrossRef] [Green Version]
  22. Kwok, R. Simulated effects of a snow layer on retrieval of CryoSat-2 sea ice freeboard. Geophys. Res. Lett. 2014, 41, 5014–5020. [Google Scholar] [CrossRef]
  23. Worby, A.P.; Geiger, C.A.; Paget, M.J.; Van Woert, M.L.; Ackley, S.F.; DeLiberty, T.L. The thickness distribution of Antarctic sea ice. J. Geophys. Res. 2008, 113, C05S92. [Google Scholar] [CrossRef]
  24. Markus, T.; Cavalieri, D.J. Snow depth distribution over sea ice in the southern ocean from satellite passive microwave data. In Antarctic Sea Ice: Physical Processes, Interactions and Variability; Jeffries, M.O., Ed.; AGU: Washington, DC, USA, 1998; Volume 74, pp. 19–39. [Google Scholar]
  25. Comiso, J.C.; Cavalieri, D.J.; Markus, T. Sea ice concentration, ice temperature, and snow depth using AMSR-E data. Trans. Geosci. Remote Sens. 2003, 41, 243–252. [Google Scholar] [CrossRef]
  26. Markus, T.; Cavalieri, D.J.; Gasiewski, A.; Klein, M.; Maslanik, J.; Powell, D.; Stankov, B.; Stroeve, J.; Sturm, M. Microwave signatures of snow on sea ice: Observations. Trans. Geosci. Remote Sens. 2006, 44, 3081–3090. [Google Scholar] [CrossRef]
  27. Worby, A.P.; Markus, T.; Steer, A.D.; Lytle, V.I.; Massom, R.A. Evaluation of AMSR-E snow depth product over East Antarctic sea ice using in situ measurements and aerial photography. J. Geophys. Res. 2008, 113, C05S94. [Google Scholar] [CrossRef]
  28. Ozsoy-Cicek, B.; Kern, S.; Ackley, S.F.; Xie, H.; Tekeli, A.E. Intercomparisons of Antarctic sea ice types from visual ship, RADARSAT-1 SAR, Envisat ASAR, QuikSCAT, and AMSR-E satellite observations in the Bellingshausen Sea. Deep Sea Res. II 2011, 58, 1092–1111. [Google Scholar] [CrossRef]
  29. Kern, S.; Ozsoy-Cicek, B.; Willmes, S.; Nicolaus, M.; Haas, C.; Ackley, S.F. An intercomparison between AMSR-E snow depth and satellite C- and Ku-Band radar backscatter data for Antarctic sea ice. Ann. Glaciol. 2011, 52, 279–290. [Google Scholar] [CrossRef]
  30. Markus, T.; Massom, R.A.; Worby, A.P.; Lytle, V.I.; Kurtz, N.; Maksym, T. Freeboard, snow depth and sea-ice roughness in East Antarctica from in situ and multiple satellite data. Ann. Glaciol. 2011, 52, 242–248. [Google Scholar] [CrossRef]
  31. Zwally, H.J.; Schutz, R.; Bentley, C.; Bufton, J.; Herring, T.; Minster, J.; Spinhirne, J.; Ross, T. GLAS/ICESat L2 Sea Ice Altimetry Data; Version 33 altimetry binary. (Periods 2B to 3J); National Snow and Ice Data Center: Boulder, CO, USA, 2011. [Google Scholar]
  32. Cavalieri, D.J.; Markus, T.; Comiso, J.C. AMSR-E/Aqua Daily L3 12.5 km Brightness Temperature, Sea Ice Concentration, and Snow Depth Polar Grids; Updated daily, V012, September 2002 to November 2009; National Snow and Ice Data Centre: Boulder, CO, USA, 2003. [Google Scholar] [CrossRef]
  33. Kaleschke, L.; Lüpkes, C.; Vihma, T.; Haarpaintner, J.; Bochert, A.; Hartmann, J.; Heygster, G. SSM/I sea ice remote sensing for mesoscale ocean-atmosphere interaction analysis. Can. J. Remote Sens. 2001, 27, 526–537. [Google Scholar] [CrossRef]
  34. Kern, S.; Kaleschke, L.; Spreen, G. Climatology of the Nordic (Irminger, Greenland, Barents, Kara and White/Pechora) seas ice cover based on 85 GHz satellite microwave radiometry: 1992–2008. Tellus 2010, 62A, 411–434. [Google Scholar] [CrossRef]
  35. Worby, A.P.; Allison, I. A Ship-Based Technique for Observing Antarctic Sea Ice: Part I. Observational Techniques and Results; Research Report 14; Antarctic Cooperative Research Center, University of Tasmania: Hobart, Tas, Australia, 1999; p. 63. [Google Scholar]
  36. Beitsch, A.; Kern, S.; Kaleschke, L. Comparison of SSM/I and AMSR-E sea ice concentrations with ASPeCt ship observations around Antarctica. Trans. Geosci. Remote Sens. 2015, 53, 1985–1996. [Google Scholar] [CrossRef]
  37. Cavalieri, D.J.; Markus, T.; Ivanoff, A.; Miller, J.A.; Brucker, L.; Sturm, M.; Maslanik, J.A.; Heinrichs, J.F.; Gasiewski, A.J.; Leuschen, C.; et al. A comparison of snow depth on sea ice retrievals using airborne altimters and AMSR-E simulator. Trans. Geosci. Remote Sens. 2012, 50, 3027–3040. [Google Scholar] [CrossRef]
  38. Brucker, L.; Markus, T. Arctic-scale assessment of satellite passive microwave-derived snow depth on sea ice using Operation IceBridge airborne data. J. Geophys. Res. Oceans 2013, 118, 2892–2905. [Google Scholar] [CrossRef]
  39. Gloersen, P.; Campbell, W.J.; Cavalieri, D.J.; Comiso, J.C.; Parkinson, C.L.; Zwally, H.J. Arctic and Antarctic Sea Ice, 1978–1987; Satellite Passive Microwave Observations; NASA Special Publication, NASA SP-511; NASA: Washington, DC, USA, 1992. [Google Scholar]
  40. Holt, B.; Johnson, M.P.; Perkovic-Martin, D.; Panzer, B. Snow depth on Arctic sea ice derived from radar: In situ comparisons and time series analysis. J. Geophys. Res. Oceans 2015, 120, 4260–4287. [Google Scholar] [CrossRef]
  41. Lenaerts, J.T.M.; van den Broeke, M.R.; van de Berg, W.J.; van Meijgaard, E.; Kuipers-Munneke, P. A new high-resolution surface mass balance map of Antarctica (1979–2010) based on regional atmospheric climate modeling. Geophys. Res. Lett. 2012, 39, L04501. [Google Scholar] [CrossRef]
  42. Hoppmann, M.; Nicolaus, M.; Schmithüsen, H. Summary of AFIN Measurements on Atka Bay Landfast Ice in 2010, Field Report 2011. Available online: http://epic.awi.de/24642/ (accessed on 26 January 2016).
  43. Hoppmann, M.; Nicolaus, M.; Asseng, J. Summary of AFIN Measurements on Atka Bay Landfast Sea Ice in 2011, Field Report 2012. Available online: http://epic.awi.de/30991/1/AFIN2011_opt.pdf (accessed on 26 January 2016).
  44. Hoppmann, M.; Nicolaus, M.; Behrens, L.-K.; Regnery, J. Summary of AFIN Measurements on Atka Bay Landfast Sea Ice in 2011, Field Report 2014. Available online: http://epic.awi.de/30991/1/AFIN2013.pdf (accessed on 26 January 2016).
Figure 1. AMSR-E snow depth distribution for winter: MJ04 to MJ06 (top) and spring: ON04 to ON06 (bottom). White areas denote regions with sea ice concentration >60% but <5 days with a valid snow depth. Grid resolution is 100 km.
Remotesensing 08 00450 g001
Figure 2. Histograms of the AMSR-E snow depth for winter: MJ04 to MJ06 (top) and spring: ON04 to ON06 (bottom). Bin size is 5 cm. The modal and mean snow depth is given together with the number of valid data N in the upper right corner of each image.
Remotesensing 08 00450 g002
Figure 3. ICESat snow depth distribution derived with the AAall set of coefficients (see Table 3) for winter: MJ04 to MJ06 (top) and spring: ON04 to ON06 (bottom). White areas denote regions with missing ICESat data but sea ice concentrations >60%. Grid resolution is 100 km.
Remotesensing 08 00450 g003
Figure 4. Histograms of the ICESat snow depth for winter: MJ04 to MJ06 (top) and spring: ON04 to ON06 (bottom). Bin size is 5 cm. The modal and mean snow depth is given together with the number of valid data N in the upper right corner of each image.
Remotesensing 08 00450 g004
Figure 5. ICESat snow depth retrieval uncertainty for one winter: MJ04 (left) and one spring period: ON04 (right). White areas denote regions with missing ICESat data but sea ice concentrations >60%. Grid resolution is 100 km.
Remotesensing 08 00450 g005
Figure 6. Histograms of the ICESat snow depth derived with different sets of coefficients: WSW, WSE and AAall (see Table 3) for one winter: MJ04 (top) and one spring period: ON04 (bottom). Bin size is 5 cm. The modal and mean snow depth is given together with the number of valid data N in the upper right corner of each image.
Remotesensing 08 00450 g006
Figure 7. ICESat snow depth minus AMSR-E snow depth for winter: MJ04 to MJ06 (top) and spring: ON04 to ON06 (bottom). White areas denote grid cells with sea ice concentration >60% but invalid either AMSR-E or ICESat data. Grid resolution is 100 km.
Remotesensing 08 00450 g007
Figure 8. Histograms of the difference ICESat snow depth minus AMSR-E snow depth for winter: MJ04 to MJ06 (top) and spring: ON04 to ON06 (bottom). Bin size is 5 cm. The modal and mean snow depth differences are given together with the number of valid data N in the upper right corner of each image.
Remotesensing 08 00450 g008
Figure 9. Sub-regions selected for the inter-comparison of ICESat and AMSR-E snow depth data with respect to the winter-to-spring snow depth evolution: RossS and RossN: Southern and Northern Ross Sea, respectively; IndianO and PacificO: Indian and Pacific Ocean region, respectively; AmundW and AmundE: Western and Eastern Amundsen Sea, respectively; Belling: Bellingshausen Sea; Amery: Amery Ice Shelf region; all other sub-regions denote a part of the Weddell Sea.
Remotesensing 08 00450 g009
Figure 10. Comparison between ASPeCt snow depth and satellite data; ICESat: “X” symbols, AMSR-E: “+” symbols. Thin solid line: 1-to-1 fit; thick solid line: linear regression ICESat to ASPeCt; dashed line: linear regression AMSR-E to ASPeCt.
Remotesensing 08 00450 g010
Figure 11. Illustration of the change in the mean regional snow depth from winter to spring averaged for the years 2004 to 2006. In each region the left arrow is for ICESat while the right one is for AMSR-E snow depths. Arrows given in the lower left corner are for reference.
Remotesensing 08 00450 g011
Table 1. ICESat measurement periods used. Abbreviations given in parentheses in each cell are used throughout the paper to denote the respective period.
YearSpring (ON)Fall (FM)Winter (MJ)
20043 October–8 November (ON04)17 February–21 March (FM04)18 May–21 June (MJ04)
200521 October–24 November (ON05)17 February–24 March (FM05)20 May–23 June (MJ05)
200625 October–27 November (ON06)22 February–27 March (FM06)24 May–26 June (MJ06)
20072 October–5 November (ON07)12 March–14 April (MA07)--
Table 2. Intercept (in cm) and slope of the linear regression between total freeboard and snow depth for the five regions investigated together with the number of survey lines used. WSW, WSE, EA, RS, and BAS stand for Weddell Sea West, Weddell Sea East, East Antarctic, Ross Sea, and Bellingshausen-Amundsen Sea, respectively.
RegionWSWWSEEARSBAS
Intercept0.9−1.0−0.2−0.50.1
Slope0.880.870.831.050.95
N868222353
Table 3. Intercept (in cm) and slope used to compute snow depth from total freeboard for WSW, WSE and the entire Antarctic (AAall).
RegionWSWWSEAAall
Intercept0.9 ± 0.6−1.0 ± 0.10.4 ± 1.2
Slope0.88 ± 0.080.87 ± 0.120.92 ± 0.06
N868174
Table 4. Mean snow depth (in cm) for the region Bellingshausen Sea from ICESat and AMSR-E for ON04 to ON07.
PeriodON04ON05ON06ON07
ICESat42.949.433.632.8
AMSR-E23.529.149.818.2
Table 5. Mean snow depth (in cm) for the region Weddell Sea from ICESat and AMSR-E for ON04 to ON07.
PeriodON04ON05ON06ON07
ICESat60.458.836.049.6
AMSR-E26.330.418.431.7

