Article

Wide-Area Landslide Deformation Mapping with Multi-Path ALOS PALSAR Data Stacks: A Case Study of Three Gorges Area, China

1
State Key Laboratory of Information Engineering in Surveying, Mapping and Remote Sensing, Wuhan University, 129 Luoyu Road, Wuhan 430079, China
2
Collaborative Innovation Center for Geospatial Technology, 129 Luoyu Road, Wuhan 430079, China
3
SAIT Polytechnic, 1301-16 Avenue NW Calgary, Calgary, AB, T2M 0L4, Canada
*
Author to whom correspondence should be addressed.
Remote Sens. 2016, 8(2), 136; https://doi.org/10.3390/rs8020136
Submission received: 30 November 2015 / Accepted: 29 January 2016 / Published: 6 February 2016
(This article belongs to the Special Issue Remote Sensing in Geology)

Abstract

:
In recent years, satellite synthetic aperture radar interferometry (InSAR) has been adopted as a spaceborne geodetic tool to successfully measure surface deformation of a few well-known landslides in the Three Gorges area. In consideration of the fact that most events of slope failure happened at places other than those famous landslides since the reservoir impoundment in 2003, focusing on a limited number of slopes is insufficient to meet the requirements of regional-scale landslide disaster prevention and early warning. As a result, it has become a vital task to evaluate the overall stability of slopes across the vast area of Three Gorges using wide-coverage InSAR datasets. In this study, we explored the approach of carrying out joint analysis of multi-path InSAR data stacks for wide-area landslide deformation mapping. As an example, three ALOS (Advanced Land Observing Satellite) PALSAR (Phased Array type L-band Synthetic Aperture Radar) data stacks of neighboring ascending paths covering the area along the Yangtze River from Fengjie to Zigui were analyzed. A key problem to be solved is the separation of the tropospheric signal from the interferometric phase, for which we employed a hybrid description model of the atmospheric phase screen (APS) to improve APS estimation from time series interferograms. The estimated atmospheric phase was largely correlated with the seasonal rainfall in the temporal dimension. The experimental results show that about 30 slopes covering total areas of 48 km2 were identified to be landslides in active deformation and should be kept under routine surveillance. Analyses of time series displacement measurements revealed that most landslides in the mountainous area far away from Yangtze River suffered from linear deformation, whereas landslides located on the river bank were destabilized predominantly by the influences of reservoir water level fluctuation and rainfall.

Graphical Abstract

1. Introduction

Landslides including rock falls and debris flows are one of the most destructive geological hazards, accounting for around 80% of geological disasters [1]. In the Three Gorges area landslides are a major threat to navigation, people’s lives and properties. Wide areas of the Three Gorges are recognized as being at high risk, particularly areas near the bank of the Yangtze River [2]. The significant increase of the water level causes overland flooding in many areas in the Three Gorges which significantly affects the stability of the slopes. Additionally, periodical fluctuation of the water level and seasonal rainfall can make the situation even worse. Therefore, the detection and mapping of active slopes is a critical task for landslide disaster prevention and developing early warnings.
The Chinese government has spent many resources to find effective methods for landslide monitoring and reinforcement in the Three Gorges area [3]. Among the tools employed in landslide deformation monitoring, Synthetic Aperture Radar Interferometry (InSAR) as an important complement to traditional techniques has been applied to landslide investigation in the Three Gorges area. Serious decorrelation caused by dense vegetation coverage makes the application very difficult [4,5]. Advanced InSAR methods such as Persistent Scatterers InSAR (PSI) [6] and small baselines subset InSAR (SBAS) [7,8], proposed to overcome the limitations of decorrelation and atmospheric influence, were also used in landslide detection in Three Gorges area. Sparse point-like targets identified on landslides caused by decorrelation significantly affect the interpretation with TerraSAR-X and ENVISAT ASAR data [9]. Successful applications with advanced InSAR methods such as PSI, Quasi Permanent Scatterers (QPS) and SBAS were achieved on single landslides such as the Huangtupo landslide [10,11,12,13] and Fanjiaping landslide [14].
Until now, successful InSAR-based studies have focused only on small areas such as the Huangtupo and Fanjiaping landslides. This may be a result of two important reasons: (1) the dense vegetation coverage within the Three Gorges area causes serious decorrelation, leaving a limited number of sparse point-like targets and therefore resulting in unreliable measurements over large regions; (2) dynamic variation of the heterogeneous atmospheric condition across the vast area cannot be simply estimated using spatial and temporal filters, which can further reduce the accuracy of landslide deformation measurements. However, it remains insufficient to focus on just a few known landslides that have been closely monitored with traditional techniques such as GPS and extensometer. Identification of unknown active slopes is more important for risk management and government action, thus it is a main focus of this study. Furthermore, time series analysis will also be extremely helpful in evaluating the potential driving factors on slope instability.
In order to perform large-area landslide deformation mapping, the problems of decorrelation and atmospheric disturbances must be overcome. To mitigate the decorrelation, L-band PALSAR data of longer wavelength are used rather than C-band or X-band SAR data to ensure better coherence in mountainous areas covered by dense vegetation [15]. To deal with the problem of atmospheric disturbances, the Stanford Method for Persistent Scatterers (StaMPS) SBAS, developed by Hooper [8] for natural terrain displacement monitoring, was employed for time series analysis. In particular, since the unfavorable atmospheric phase screen (APS) induced by tropospheric path delay in mountainous areas usually consists of two components, namely stratified APS which is correlated with topography and turbulent APS which is independent of topography, a hybrid description model of APS was used to estimate APS from time series interferograms in the StaMPS SBAS method.
In this study, we investigated an approach for carrying out wide-area landslide deformation mapping with multi-path satellite SAR data stacks. Three ALOS PALSAR datasets acquired from adjacent paths were analyzed to detect landslides in the Three Gorges area along the Yangtze River. Deformation patterns of these landslides detected were characterized and the impacts of driving factors were evaluated qualitatively. Reservoir water level fluctuation and rainfall have been considered two major driving factors for slope instability [16], and correlations between water level/rainfall and displacements are analyzed and discussed.

2. Study Area and Test Datasets

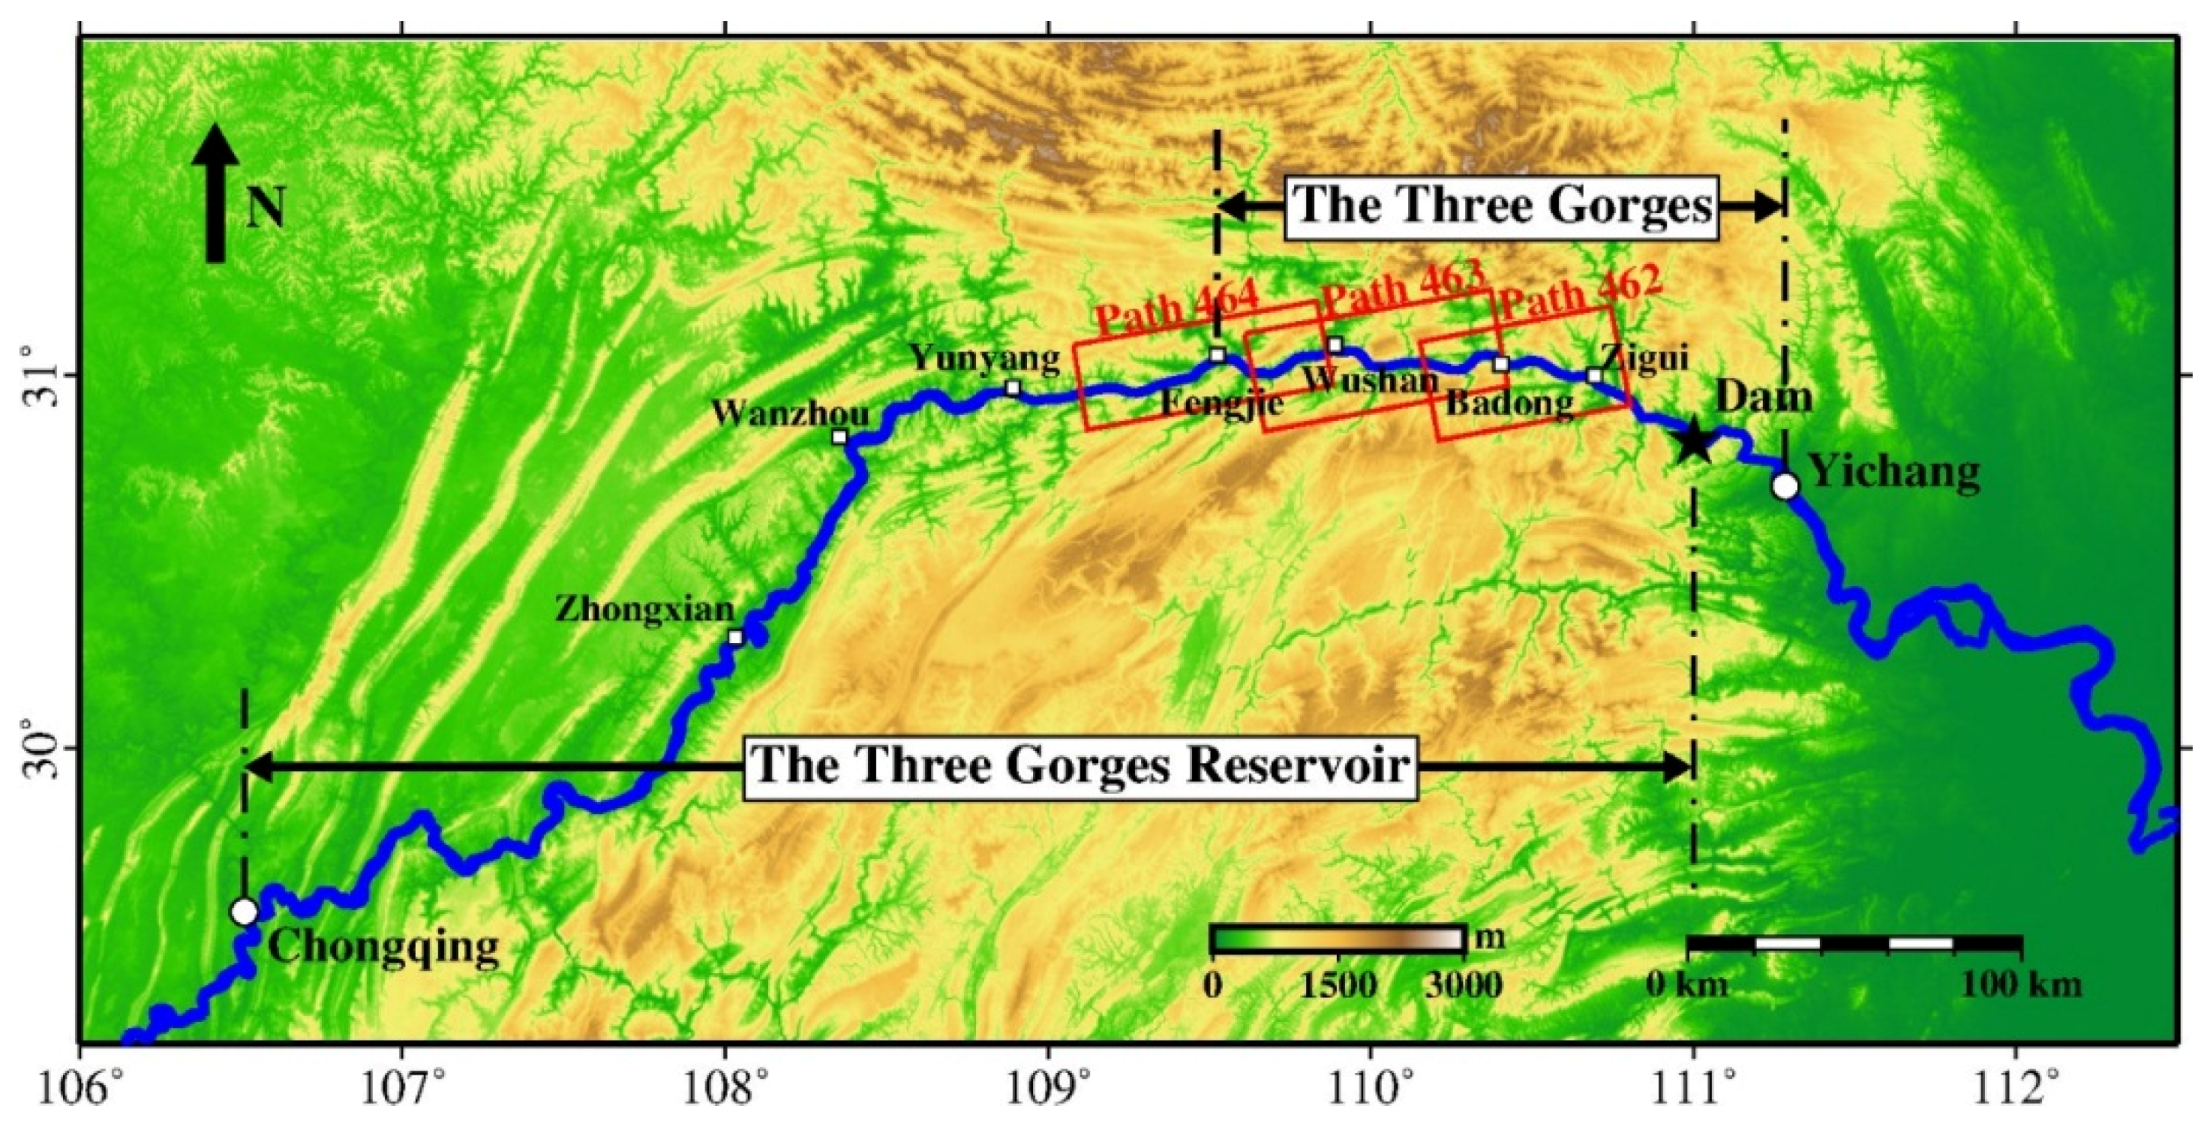
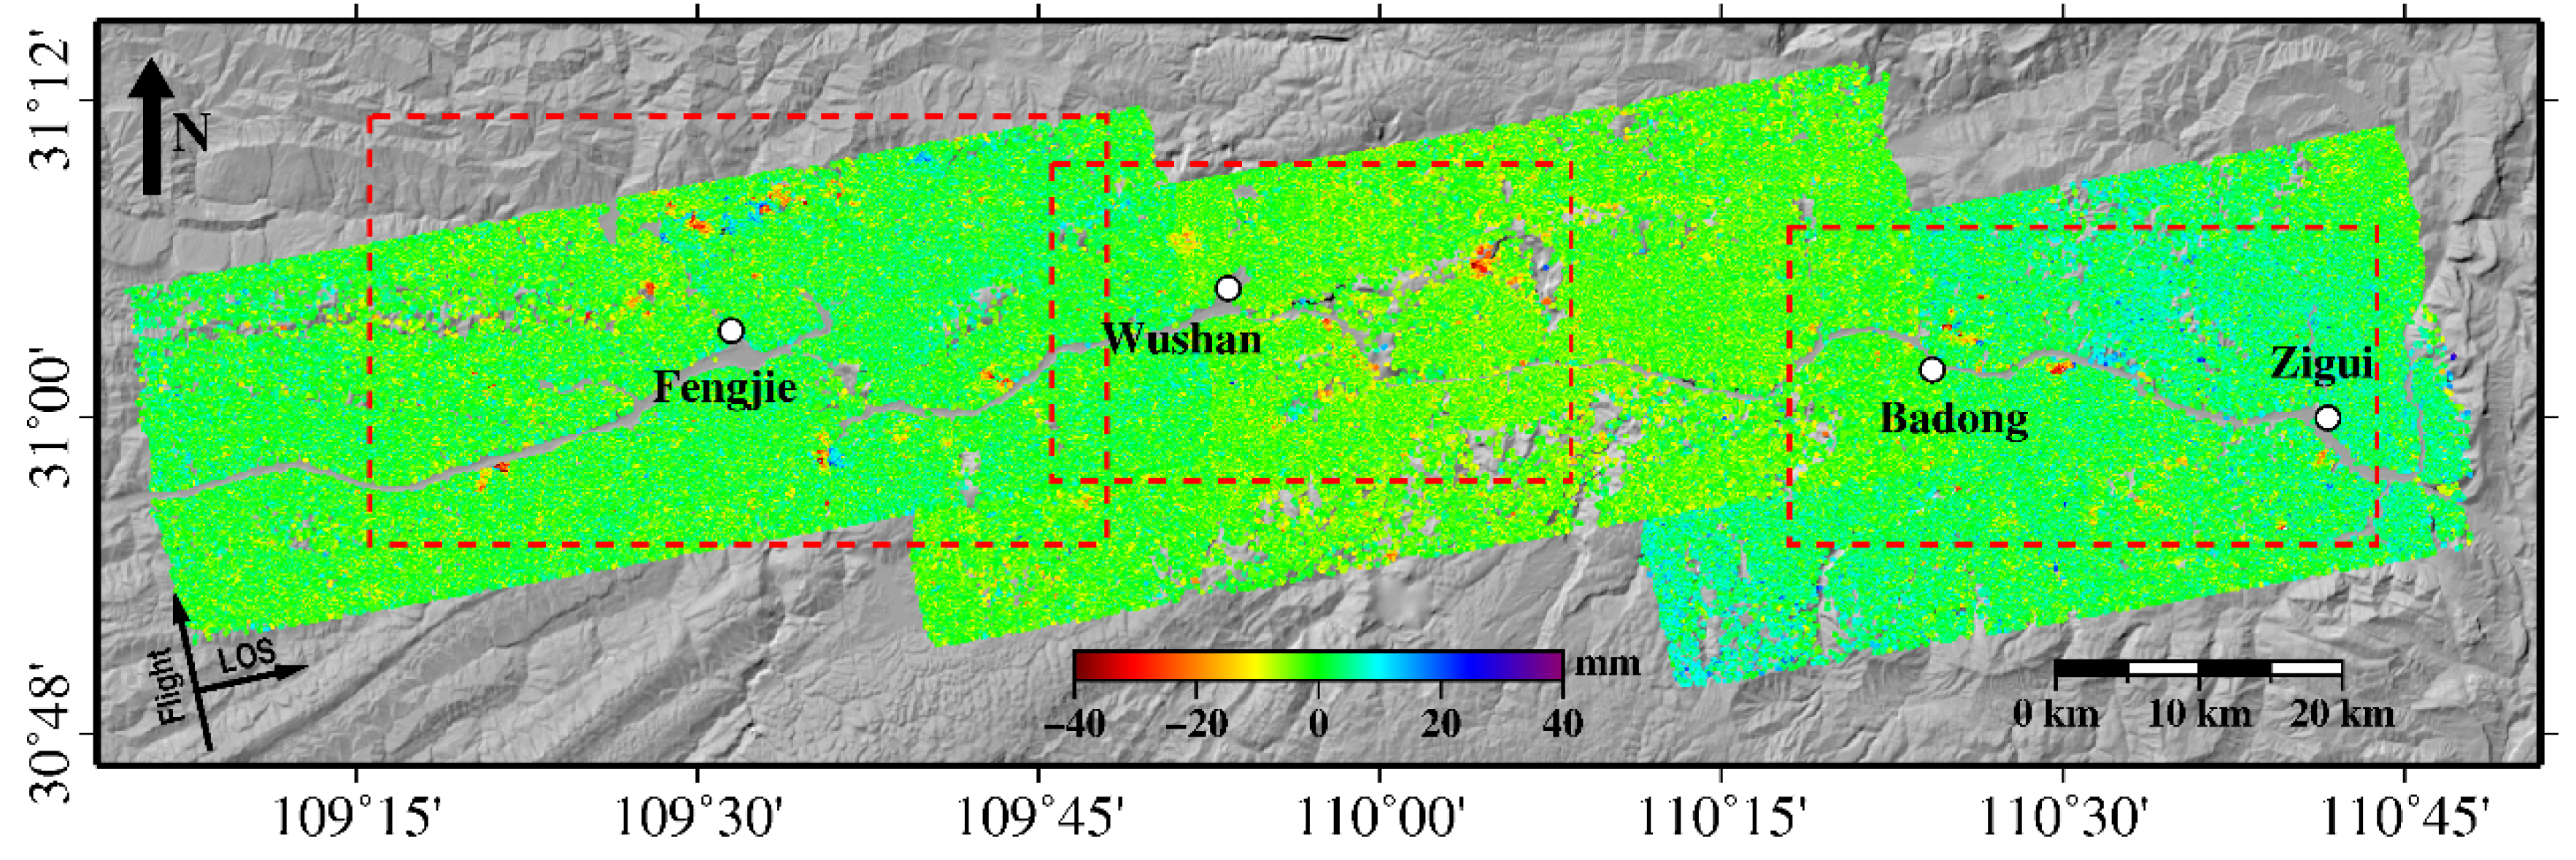
2.1. Three Gorges Area

The Three Gorges Reservoir refers to the upstream region of the Yangtze River involved in the water impoundment of the Three Gorges Project within the Chongqing municipality and Hubei Province. The Three Gorges is a smaller region spanning from Fengjie County in Chongqing municipality to Yichang city in Hubei Province, as shown in Figure 1. This region lies in the transition zone from the second to the third topographic step of China, with more than 70% being mountainous areas. The maximum elevation in our study area is greater than 2000 m.
Construction of the Three Gorges Dam was finished in 2006, and the reservoir water level rose to 175 m for the first time in 2009. According to the operational scheme of the Three Gorges Reservoir, large seasonal water level fluctuations occur annually in three periods: a rise from 145 m to 175 m between early October and early November, a decrease from 175 m to 156 m between early January and April, and a further decrease from 156 m to 145 m between May and mid-June [17]. During the flooding season (June to September) when heavy rainfall occurs, the water level is maintained at 145 m [17]. The water level of the upstream Yangtze River and the weekly cumulative rainfall in Fengjie during the period from 2007 to 2011 are plotted in Figure 2.
Figure 1. Geographic coverage of the Three Gorges area, with red rectangles indicating our test areas.
Remotesensing 08 00136 g001
Many landslide disasters have happened in this area, such as the Xintan landslide in 1985 [2] and the Qianjiangping landslide in 2003 [18]. The wide distribution of landslides can be attributed in large part to a combination of lithological composition, planar geological structures, and climate conditions [2]. The huge water level fluctuations since the initial impoundment in 2003 make the conditions in this area more complex. The Qianjiangping landslide occurred a few days after the impoundment [18].
The climate in this area is categorized as subtropical monsoon with a hot and rainy summer. As we can see from Figure 2, the rainfall is mainly concentrated in summer with weekly cumulative rainfall at Fengjie reaching more than 150 mm. Intuitively, seasonal rainfall could introduce seasonal atmospheric signals into InSAR measurements and should be removed accordingly.
Figure 2. Water levels of upstream Yangtze River and weekly cumulative rainfall in Fengjie from 2007 to 2011.
Remotesensing 08 00136 g002

2.2. Datasets

Three ascending paths, path 462, path 463 and path 464, of the ALOS PALSAR datasets were collected over the Three Gorges area, spanning from the end of 2006 to early 2011. There are overlaps between adjacent paths (Figure 1). A similar look angle of approximately 34 degrees was applied in these three paths and they are all in the same flight direction. The images acquired by fine beam dual-polarization (FBD) mode are oversampled to match the pixel spacing of the fine beam single polarization (FBS) mode for cross-mode interferometry. The SRTM (Shuttle Radar Topography Mission) DEM (Digital Elevation Model) of 1-arc-second resolution covering our study area was employed in the generation of single look differential interferograms and geocoding. Thresholds of 1000 days and 1000 m are used for temporal and perpendicular baselines separately during interferogram generation. As a result, 40 interferograms, 37 interferograms and 36 interferograms were produced from path 462, 463 and 464 datasets, respectively, for the final time series analysis (Figure 3).
Figure 3. Interferograms used for small baselines analysis (a) path 462, (b) path 463 and (c) path 464. The circles represent the images and solid lines represent the interferograms.
Remotesensing 08 00136 g003

3. Methodology

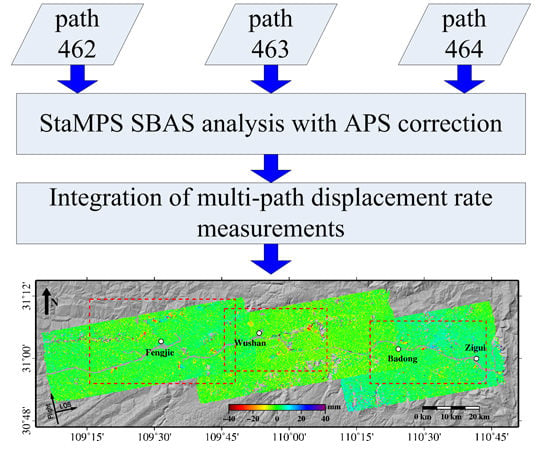
3.1. Small Baselines Subset InSAR Analysis

The small baseline subset method was initially proposed to overcome the problem of decorrelation by making full use of the interferograms with both small temporal baselines and short perpendicular baselines [7]. Since then it has been frequently applied in displacement monitoring in rural areas [11,19,20,21,22]. Compared with the original method which can operate with separated subsets of SAR acquisitions, isolated interferograms are not allowed in StaMPS SBAS analysis. Interferograms with a temporal baseline and perpendicular baseline below given thresholds were first generated to maximize the coherence and then grouped by common master or slave images to form subsets. Separated subsets were connected by interforgrams with large baselines to ensure the temporal continuity.
SAR amplitude information was initially exploited to exclude bad-quality pixels based on amplitude dispersion values [8]. The pixels with a slow decorrelating filtered phase (SDFP) that are widely distributed in natural terrain and have maintained good coherence during a short time interval are identified and analyzed to monitor surface displacements [8]. Phase characteristics are used to select the SDFP pixels. The spatially-correlated phase component and spatially-uncorrelated look angle error are estimated from the wrapped phase. The spatially-correlated contribution to the interferometric phase of a pixel, due to spatially-correlated signals including height error, orbit error and ground displacement, etc., is estimated by the bandpass filtering of surrounding pixels in the frequency domain. A spatially-uncorrelated look angle error, which is mainly composed of spatially-uncorrelated height error, is then estimated through its correlation with the perpendicular baseline. The residual, after removal of these two terms from the wrapped phase, gives an estimate of the decorrelation noise γ [8].
γ = 1 N | i = 1 N exp { - 1 ( ψ Δ ψ ^ u Δ ψ ˜ ) } |
where N is the interferograms, ψ is the wrapped phase, Δ ψ ^ u is the spatially-uncorrelated look angle error and Δ ψ ˜ is the spatially-correlated term.
Once the SDFP pixels were selected according to γ, three-dimensional phase unwrapping was carried out on all the pixels [23]. The unwrapped phase on a given pixel can be expressed as:
φ = φ d + φ T + φ a + φ o + φ n
where φ is the unwrapped phase, φd, φT, φa, φo and φn are the phase components due, respectively, to surface displacements, topographic error, atmospheric disturbance, inaccurate orbit information and noise. In the StaMPS SBAS analysis, these different components were estimated by iterative filtering with consideration of their identifying characteristics in spatial-temporal domains.
Phase ramps due to orbital errors are spatially correlated and should be removed preferentially before the estimation of other terms. Orbital phase ramps caused by inaccurate ephemeris records in interferograms can be corrected using a bilinear or biquadratic model [19]. Usually, ALOS PALSAR data with large perpendicular baselines suffer considerably from orbital phase ramps. In most cases, a full second-order polynomial phase ramp correction method should be sufficient [24]. Therefore, a biquadratic model was used to correct the phase ramps in our study.
φ o = a 0 + a 1 x + a 2 y + a 3 x y + a 4 x 2 + a 5 y 2
where ai (i= 0, 1,..., 5) are the coefficients used in orbital error phase estimation; x and y are the coordinates in azimuth and range direction on a SDFP pixel. Then phase ramps were estimated over all interferograms using the SDFP pixels. Typically, the deformation signal will leak into the orbital errors when there are displacements distributed in large areas, as in the case of earthquakes. If this occurs, these areas with displacements should be masked out before performing orbital error estimation.
The 1-arc-second SRTM DEM was used to remove the topographic phase in our study. The topographic changes since 2000 cannot be neglected, especially in developing countries such as China [25]. There is a linear relationship between topographic error and baseline.
φ T = 4 π λ B R sin θ Δ h
B, Δh, λ, R, θ stand for perpendicular baseline, topographic error, radar wavelength, slant range and incidence angle, respectively. Thus, the topographic error can be accurately estimated by using a least squares approach with multi-baseline interferograms. Interferograms with long temporal baselines sensitive to displacements were excluded from topographic error estimation.
According to previous studies [19,21,26], atmospheric delays in mountainous areas are normally composed of stratified APS and turbulent APS. Usually there is a linear relationship between phase delays introduced by stratified APS and terrain elevation.
φ a = φ s + φ a _ r
φ s = b h
where φs, φa_r represent the phase delays introduced by the stratified APS and residual, respectively; b is the coefficient used to represent the relationship between elevation and phase delays caused by stratified APS; and h is the elevation. A hybrid description model of the atmospheric phase screen (APS) was incorporated into StaMPS SBAS analysis to improve APS estimation from time series interferograms. The phase delays introduced by stratified APS were estimated by a least squares procedure using all the unwrapped SDFP pixels. Then the atmospheric phase residuals were estimated with temporally high-pass and spatially low-pass filters. Afterwards, time series deformation can be inverted using singular value decomposition (SVD) [7,8].
An iterative procedure was employed to ensure the estimation accuracy of each term in Equation (2). Since unwrapping errors are more prevalent in interferograms with longer perpendicular baselines, the estimated DEM error using Equation (4) was reduced before phase unwrapping to improve the unwrapping accuracy. Re-estimation of each term in Equation (2) was carried out with the newly unwrapped phase. This procedure can be repeated until the change of the residual is less than a target threshold.

3.2. Integration of Multi-Path Displacement Measurements

Since our objective is to detect potential landslides across the wide area of the Three Gorges Reservoir, the resultant displacement maps derived from the three paths of ALOS PALSAR data separately should be further integrated into one map. Usually, an assumed stable point is chosen as a reference point by which all the other parameters are estimated [7,27]. In this study, different reference points were used in our process for each path. Since no in-situ data was available, reference points located at Badong and the Fengjie city council building were used. The Badong reference point was used for both path 462 and path 463. The Fengjie reference point was used to calibrate the SBAS results from path 464. Biases between path 463 and the other two paths in the line-of-sight (LOS) direction are estimated and corrected as [27] did based on the average displacement rate differences in the overlapping area with respect to the Badong reference point.
It is worth noting that besides a displacement rate map in the LOS direction, generally a displacement map along the slope direction can also be obtained by a simple projection. However, here the displacement rate map in the along-slope direction was not available for two reasons: (1) the LOS deformation could be projected to the slope direction if the landslide is a translational landslide based on both geomorphological and DEM models [28], but we have no idea of the specific landslide category of each active slope detected; (2) the slopes along the Yangtze River are mostly south-north oriented while the LOS deformation is primarily sensitive to the deformation in the east-west and vertical directions, hence the projection between the LOS and slope direction would be inaccurate.

4. Experimental Results and Analyses

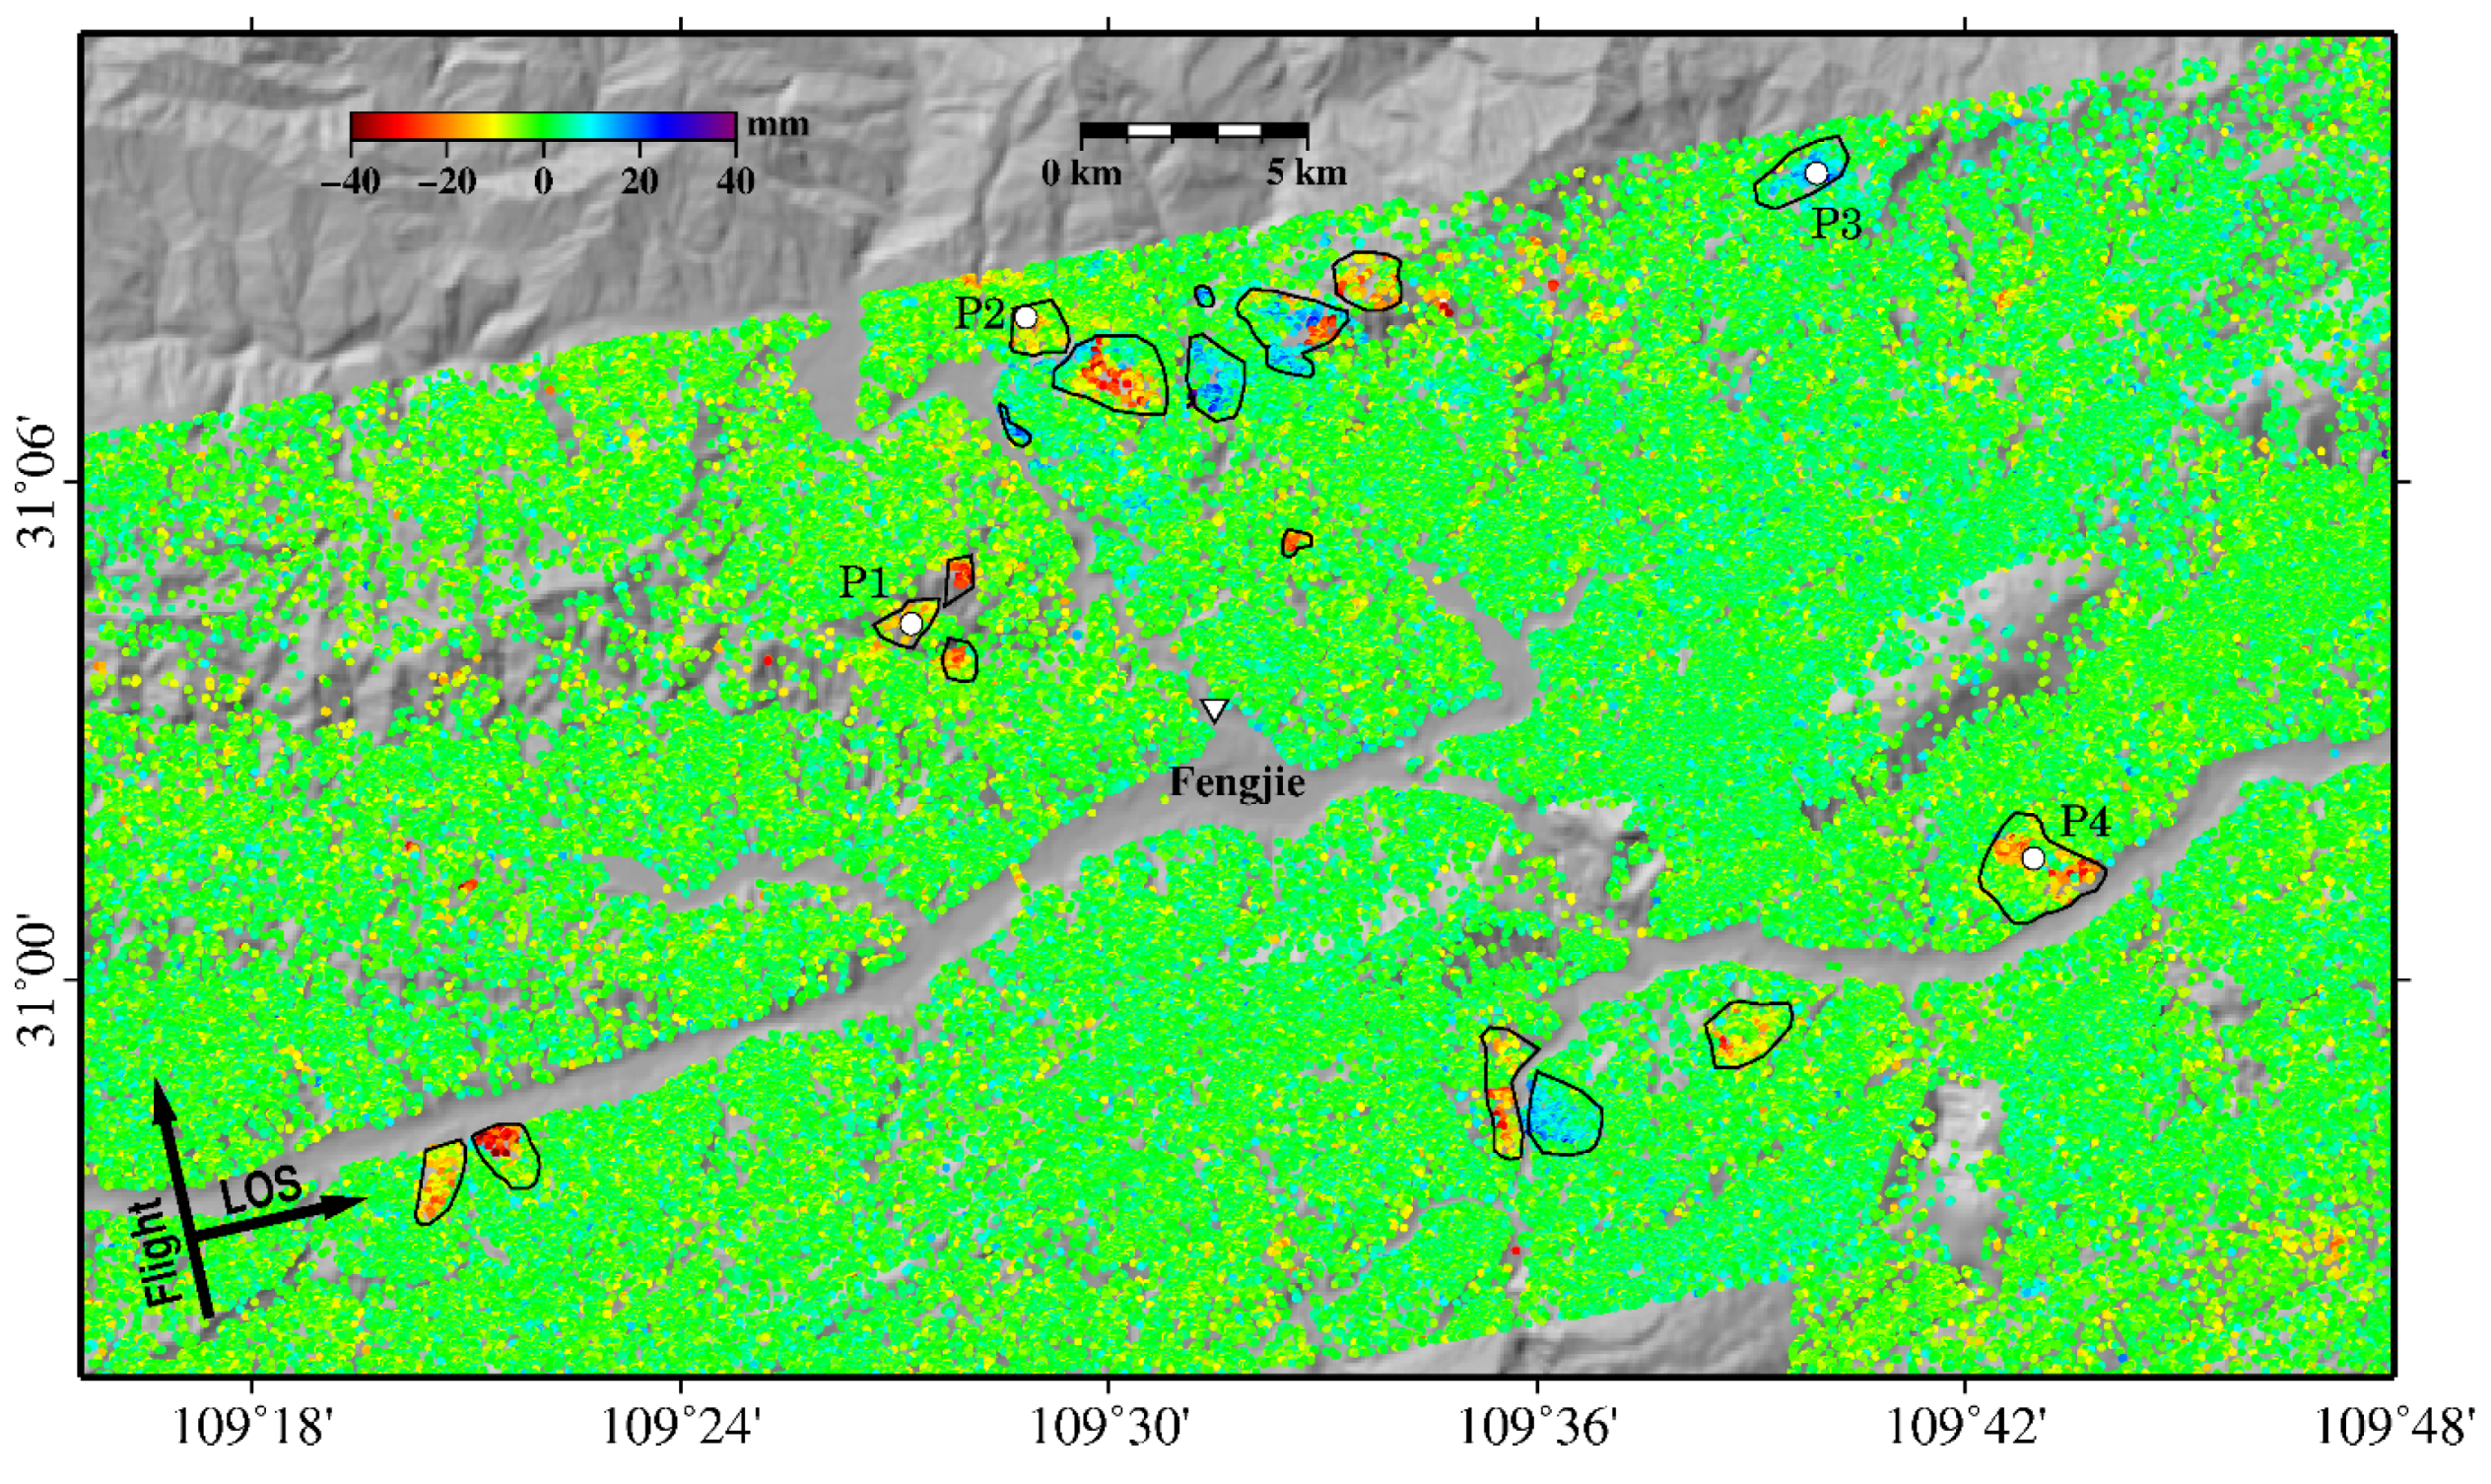
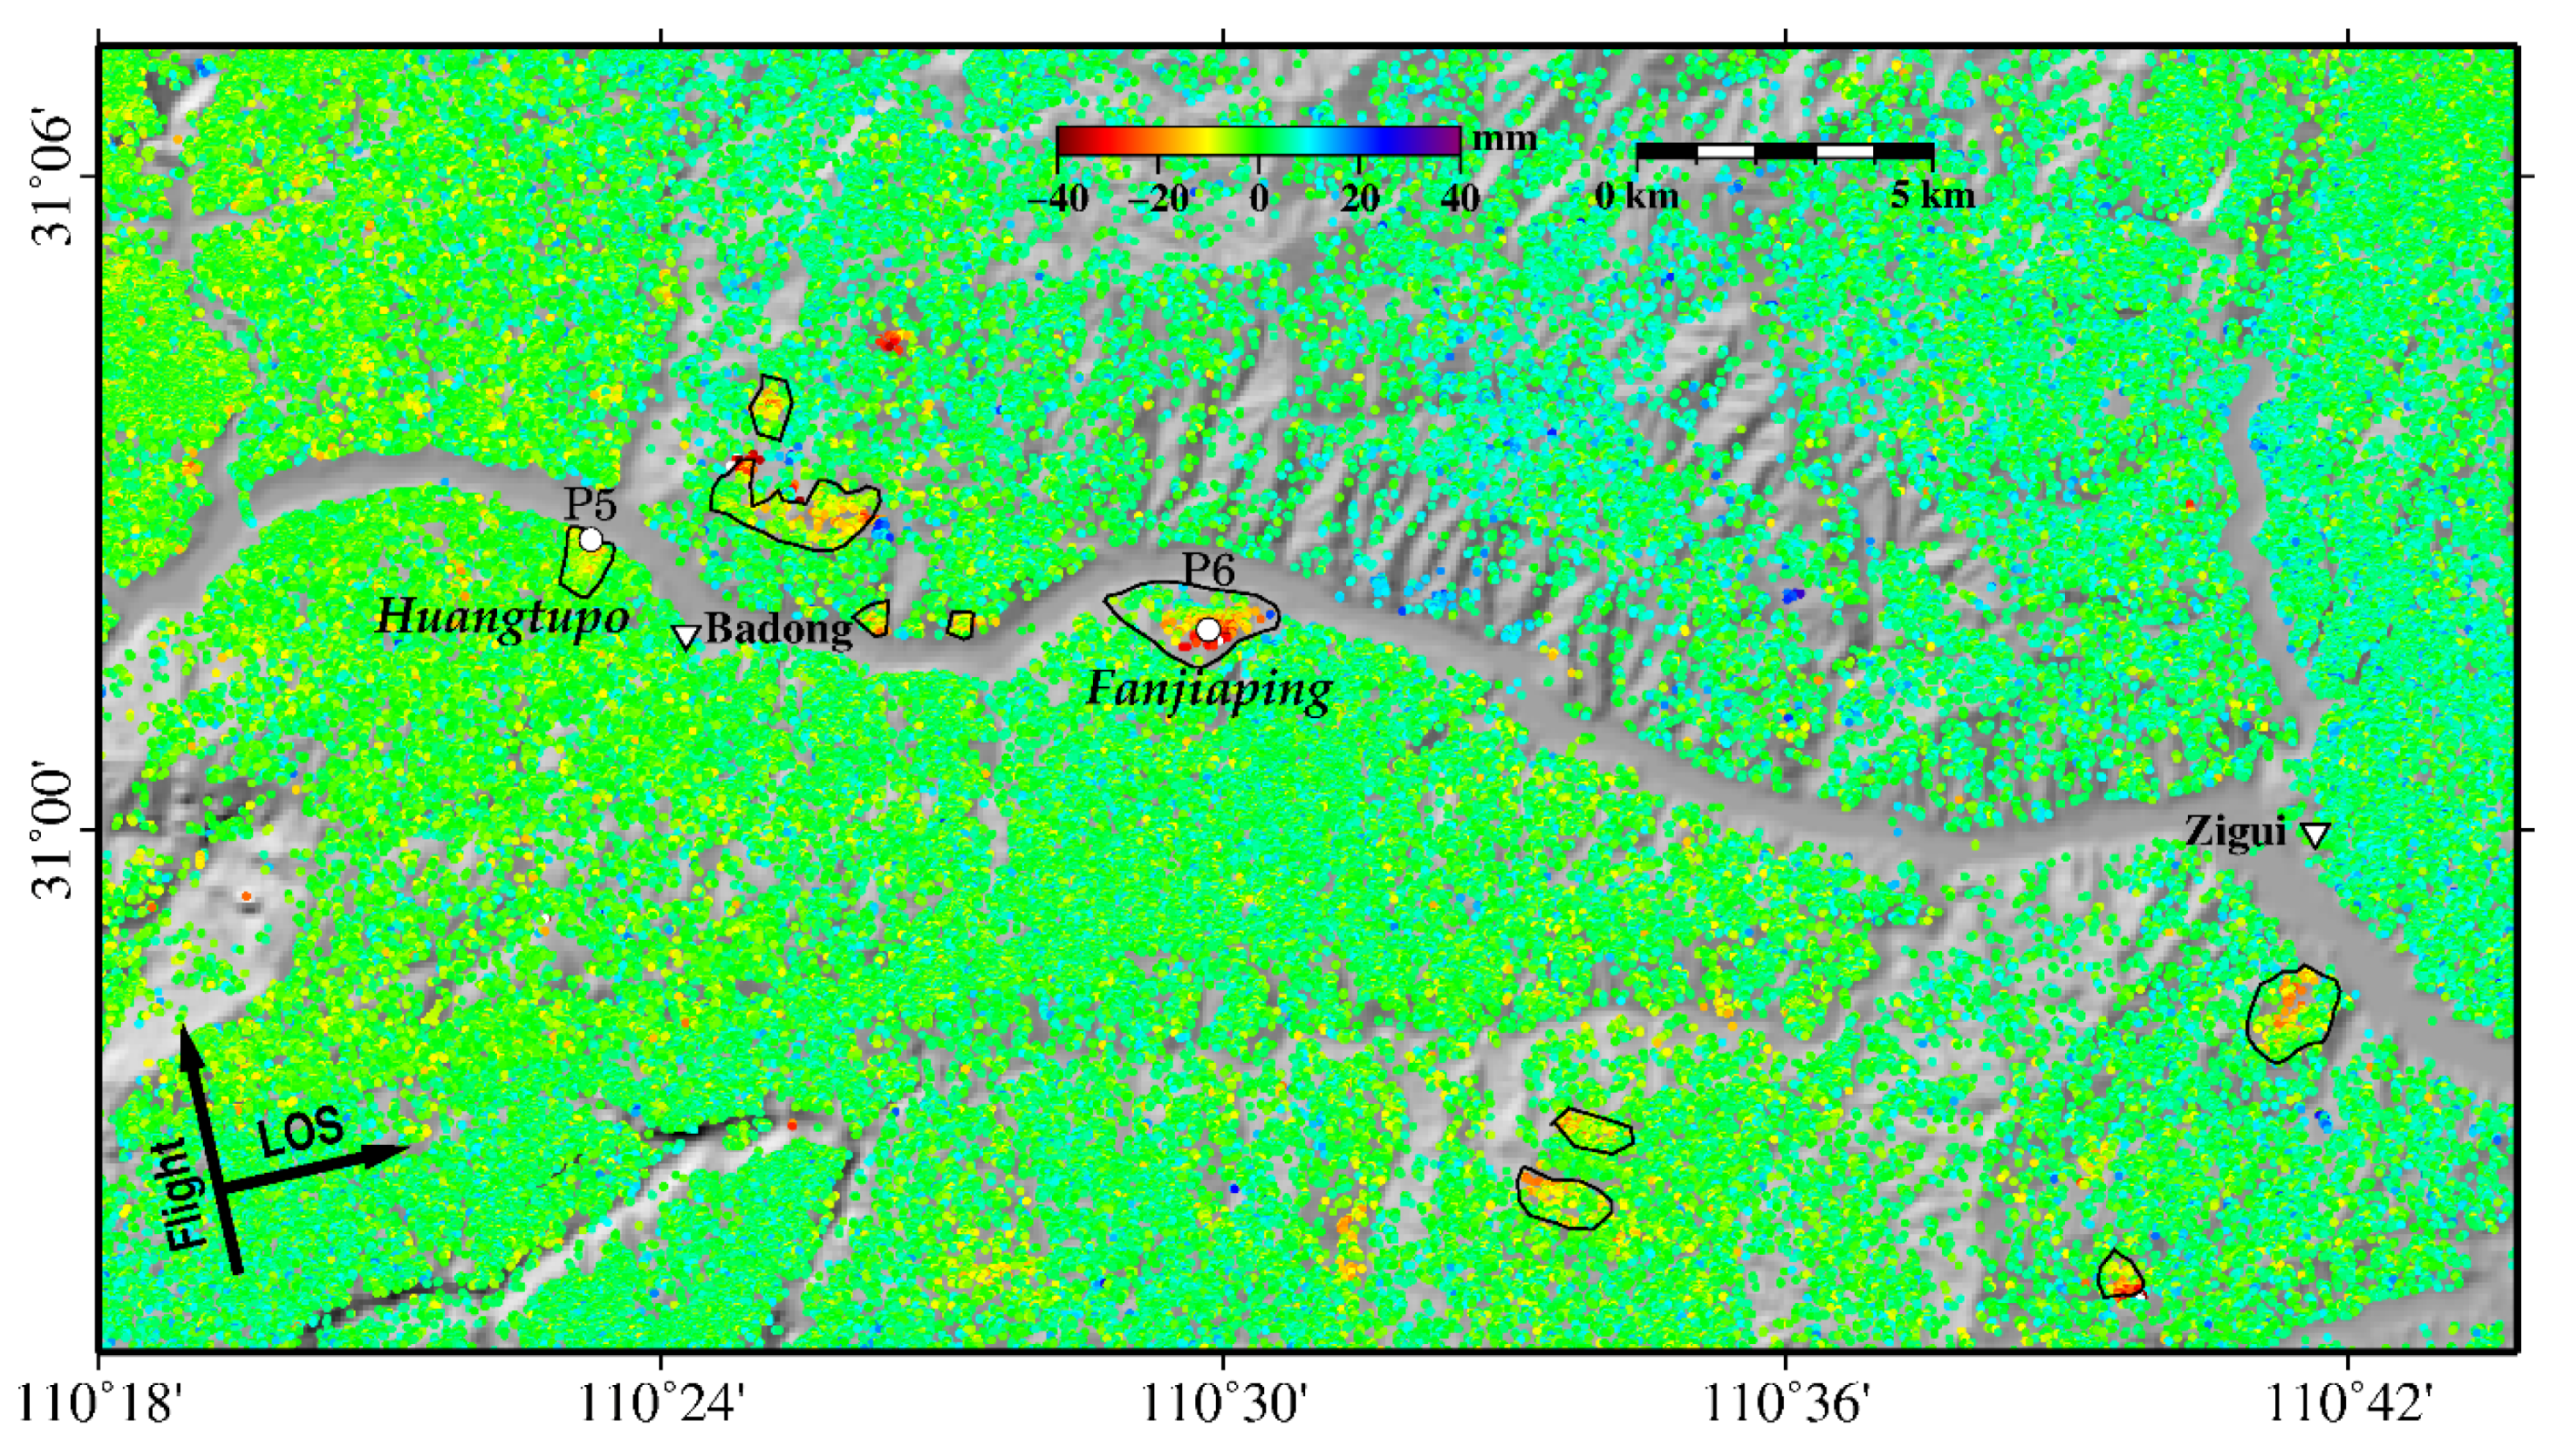
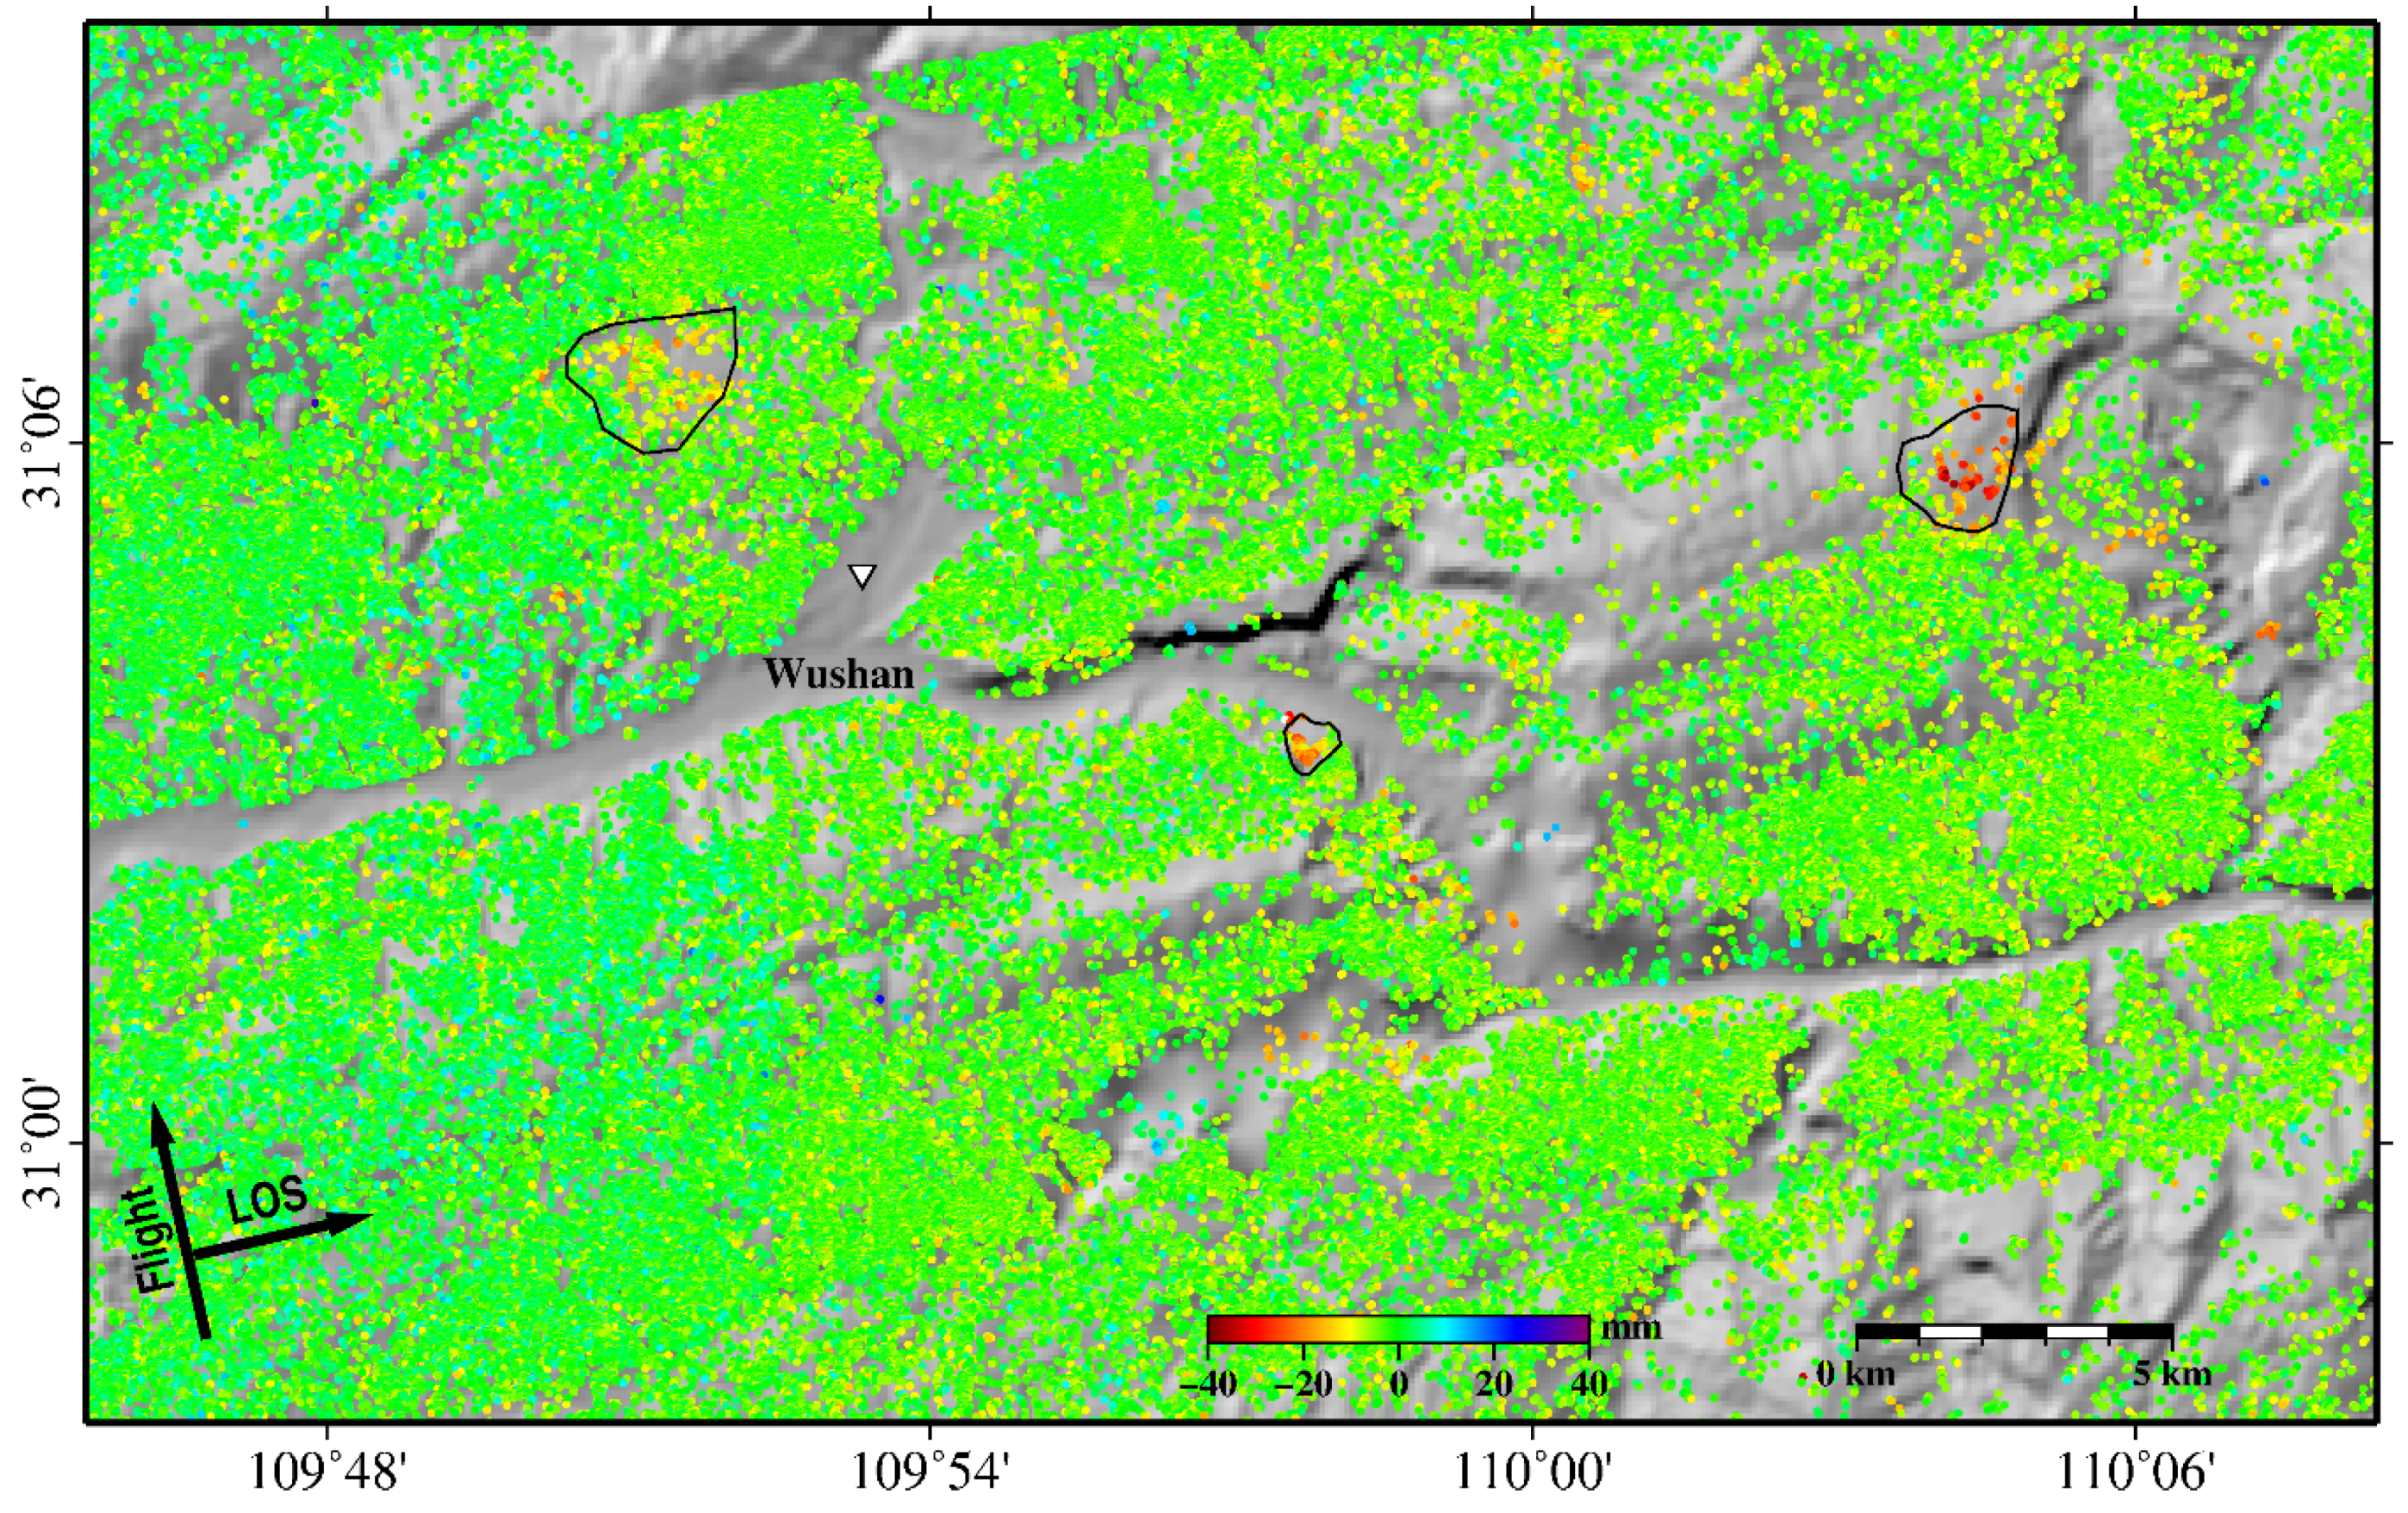
4.1. Mean Displacement Rate Map

The obtained displacement rate map in the LOS direction over the Three Gorges area from Fengjie County to Zigui County is shown in Figure 4. A total of 1,775,238 points were identified in our analysis, covering an area of 4800 km2 from Fengjie County to Zigui County along the Yangtze River. Approximately 96% of the points show displacements rates between −10 mm/year and 10 mm/year, which indicated the overall stability of the study area. About 30 slopes with total areas of 48 km2 were identified as being in active deformation.
Figure 4. Mean displacement rate map of Three Gorges area generated from three ALOS PALSAR data stacks. Three selected areas are highlighted by dashed rectangles.
Remotesensing 08 00136 g004
The distribution of landslides in Fengjie is strongly connected with the orientation of synclinal stratigraphic structures. The stratum which initiates the instability is located at the transitional zone which is steeply dipping in the elevated regions and gently dipping in the lower regions [29]. As a famous karst region, stratigraphic formations in the west of Fengjie mainly consist of Jurassic red beds, while formations in the east mostly consist of Triassic carbonate rock [1]. Approximately half of the detected active landslides in our study area are distributed in Fengjie County (Figure 5). The SDFP pixels with positive values in Figure 5 are located on west-facing slopes. This is reasonable since most movements were in the downslope direction. According to [29], there are many landslides distributed along the banks of the Yangtze River, and it seems that most of them are stable and only six active landslides were detected along the river judging from our results. The slopes along the Yangtze River are generally facing north-south, which is insensitive for InSAR measurements. Nevertheless, local variations in slope orientation allow InSAR to detect some movements, such as the landslide where P4 is located. According to a previous study in Wanzhou, located in the west of the Three Gorges area, slopes of active landslides concentrate within the interval from 16 to 26 degrees [30]. Here the detected active landslides in Fengjie are also distributed on gentle slopes with angles varying from 15 to 30 degrees.
Figure 5. Mean displacement rate map measured at Fengjie. P1, P2, P3, P4 are points used for time series analysis shown in later sections.
Remotesensing 08 00136 g005
Figure 6 shows the displacement rate over the area of Wushan and three active landslides were detected. The landslide susceptibility map given by [31] shows that most of the landslide-prone areas were distributed around the south of the town of Wushan. All three landslides are located within the areas prone to landslides according to the susceptibility map [31]. However, those areas with steep slopes of more than 50 degrees seem generally stable, according to our results. Most of the areas along the bank of the Yangtze River are stable according to our InSAR results, which is consistent with the susceptibility map.
Figure 7 shows the mean displacement rate map covering areas around Badong and Zigui. According to the landslide susceptibility map [31,32], the Badong blocks consisting of the Badong formation are prone to landslides. About five active landslides were detected within Badong County, among which the Huangtupo landslide was the most famous that has been studied using the InSAR method [10,11,12,13,14]. The mean displacement velocity of the Huangtupo landslide is about 10~15 mm/year. The active Huangtupo landslide has forced the government to change the relocation plan of the town of Badong. The Fanjiaping landslide that is located at the south bank of the Yangtze River and approximately 8 km east of the town of Badong was another one in active deformation [9,14,33]. The displacement rate of the Fanjiaping landslide can reach nearly 40 mm/year and is possibly correlated with the water level fluctuations and rainfall, which will be analyzed in the following sections.
Figure 6. Mean displacement rate map of Wushan.
Remotesensing 08 00136 g006
Figure 7. Mean displacement rate map covering areas around Badong and Zigui. P5 and P6 are points used in time series analysis shown in later sections.
Remotesensing 08 00136 g007

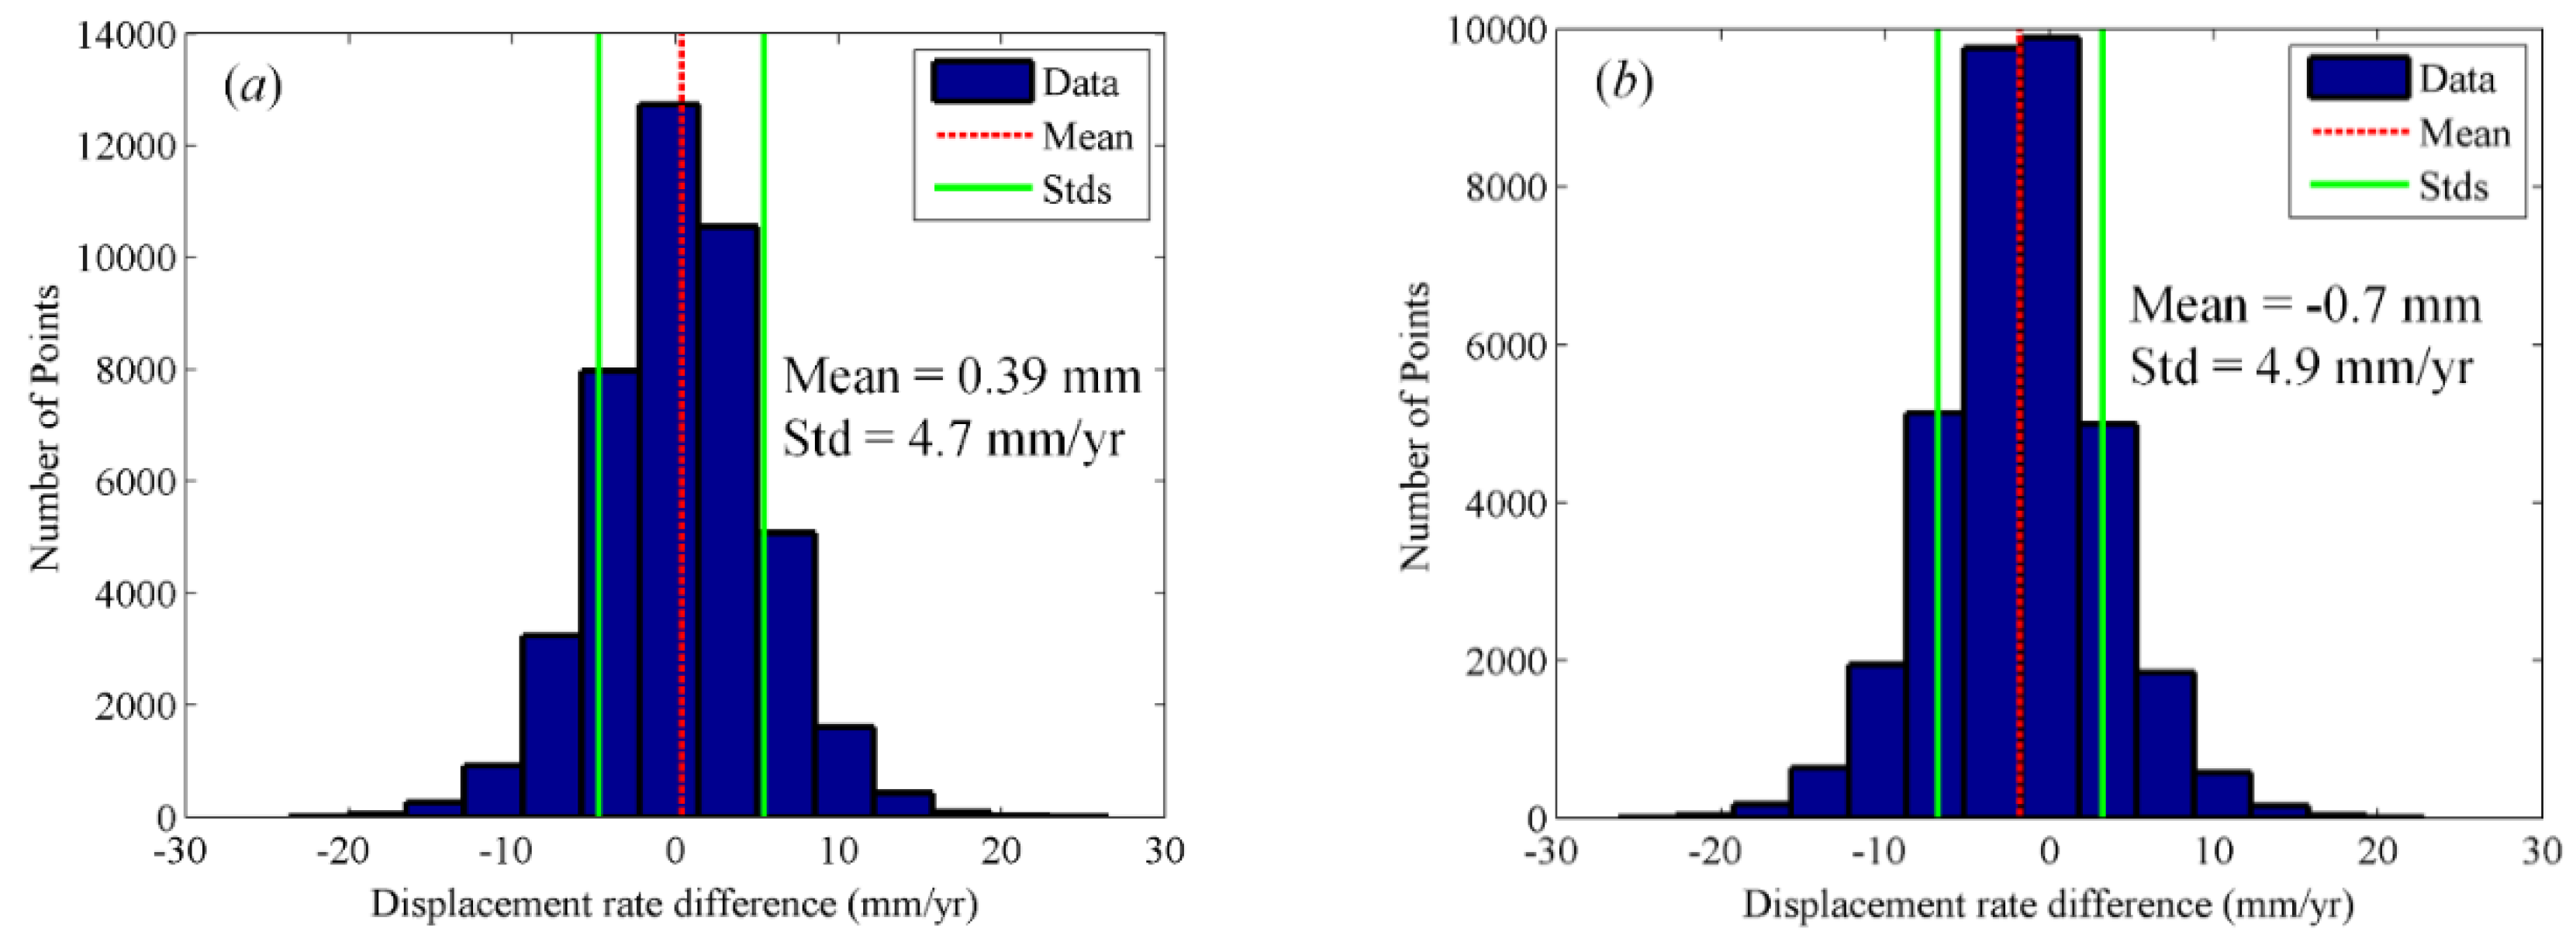
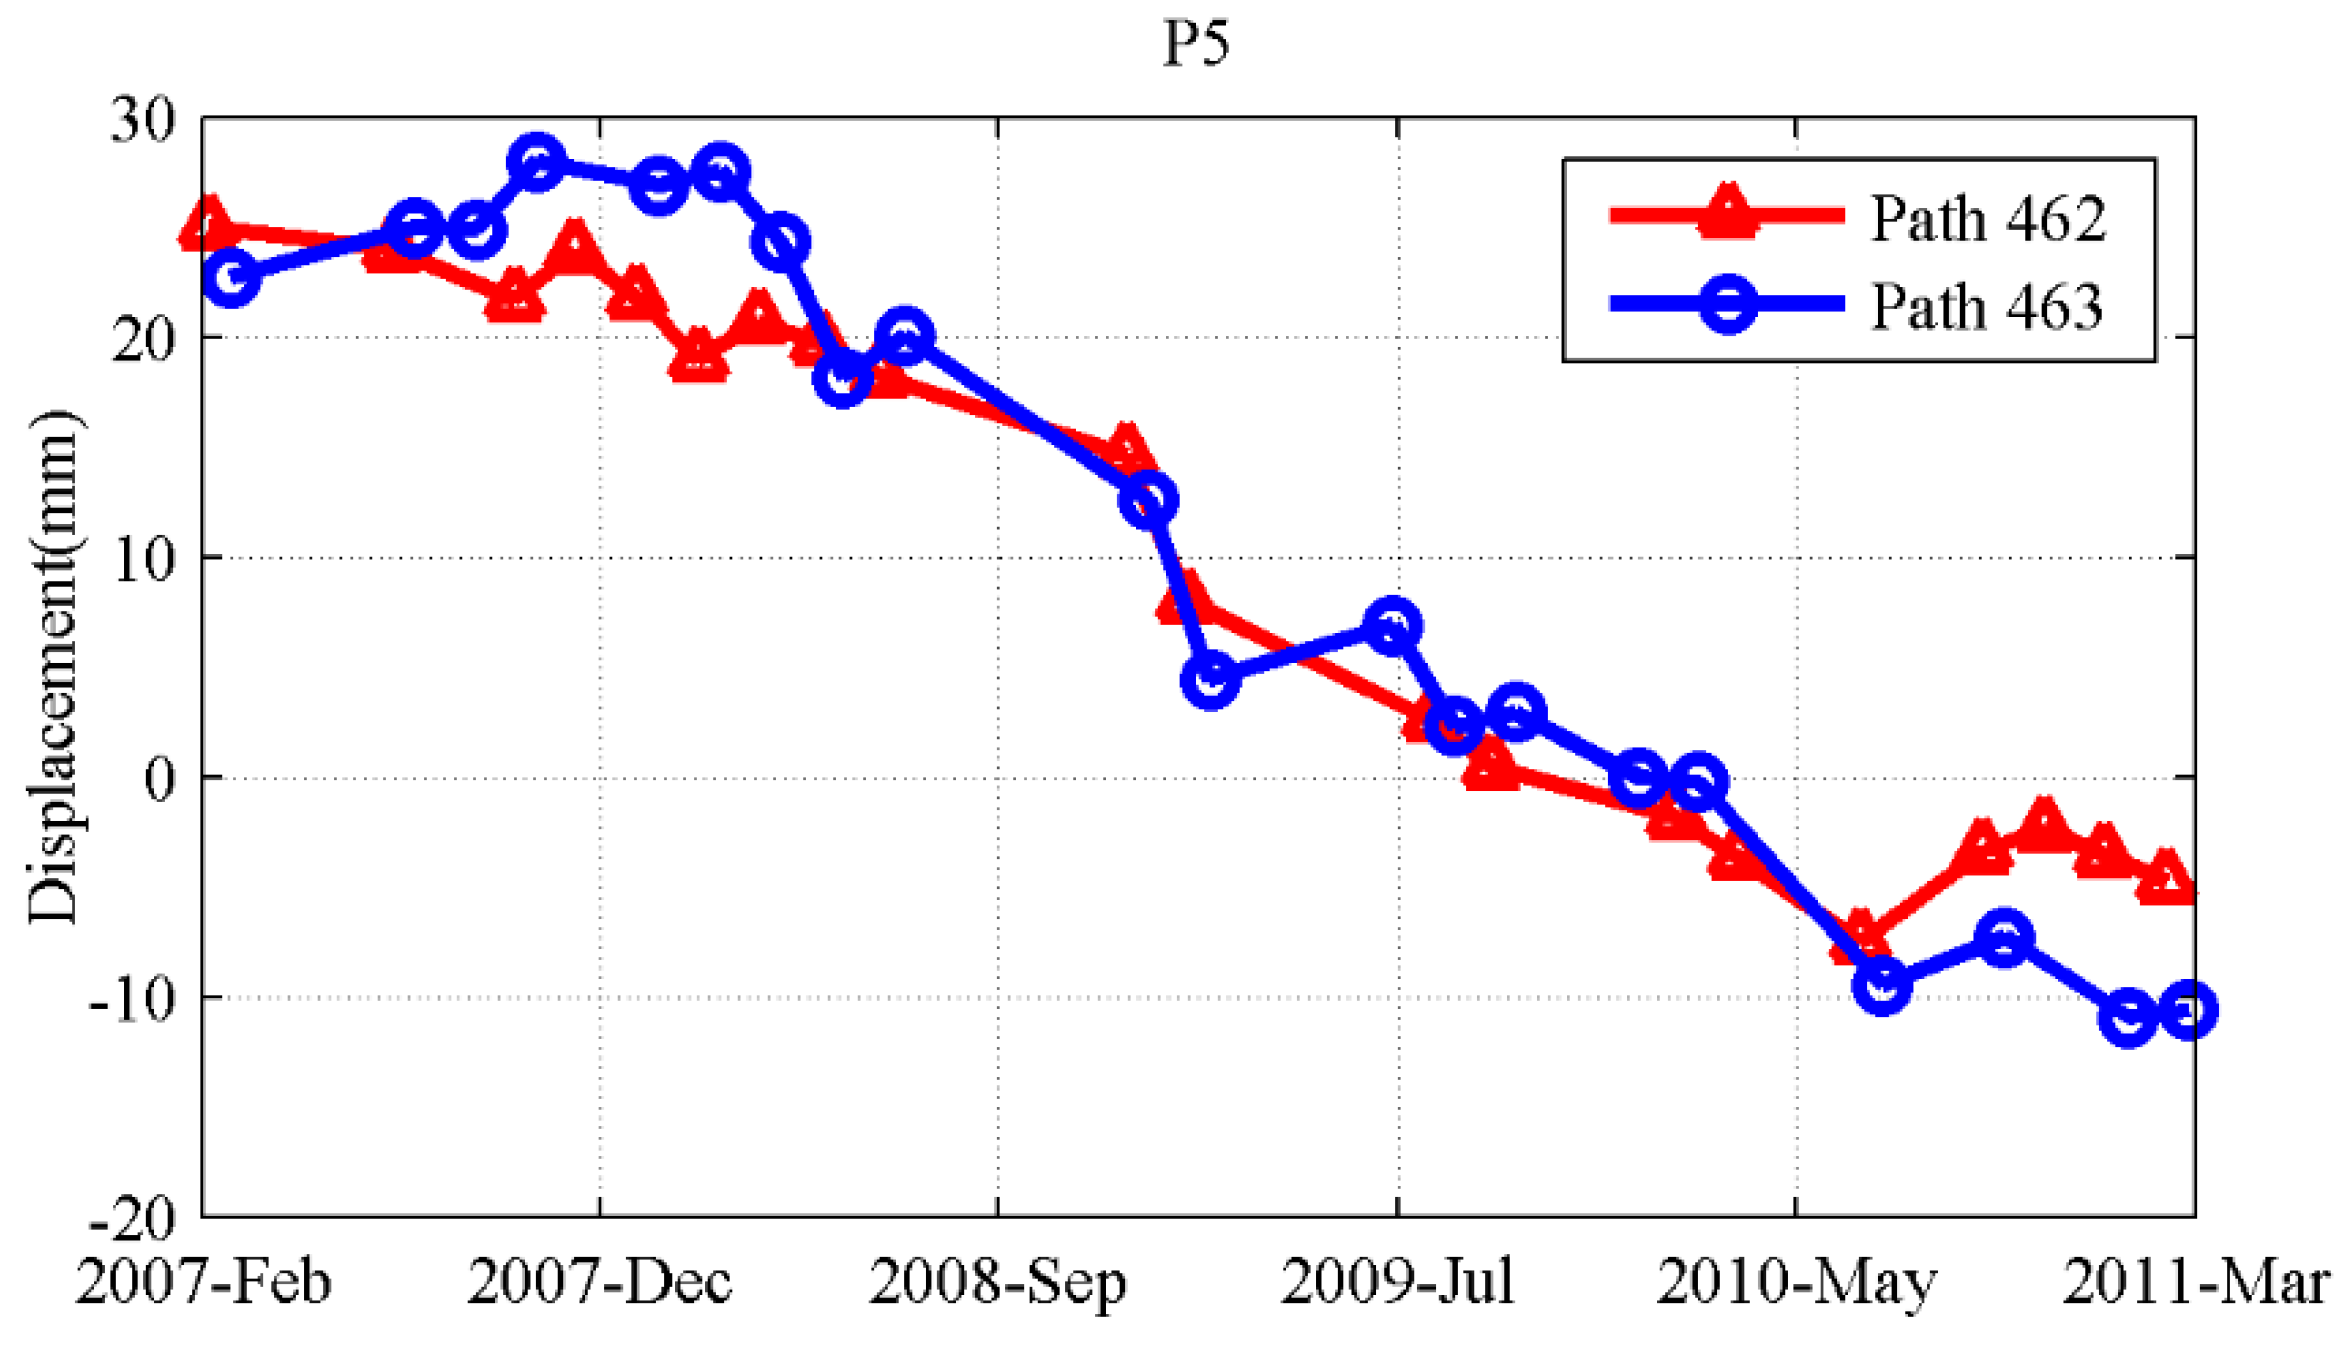
4.2. Measurement Consistency Evaluation

In order to evaluate the consistency of the results, a quantitative analysis of the differences within the overlapping areas from different paths was performed. Figure 8 displays the difference in displacement rate values between adjacent paths. The standard deviations of the displacement rate differences on the common pixels between path 464 and path 463, and path 463 and path 462 are 4.7 mm/year and 4.9 mm/year, respectively. Possible factors which caused the disparity between different paths over the overlapping areas have been analyzed in detail in [27]. In brief, the main causes were identified as: (1) A slight difference in incidence angle and satellite heading angle caused by the different observation geometries at corresponding points on different paths. In our case, this difference was found to reach a maximum of more than 2 degrees. (2) The observation time series of three paths are different, resulting in different temporal samplings of the landslide progression. Since the progression of landslides is usually nonlinear, sampling time differences may cause inconsistencies in mean velocity estimation. (3) The SRTM DEM acquired in 2000 was used in our process and ground surface changes could introduce DEM uncertainties. This could cause the estimation of the displacement velocity to be inaccurate, in addition to causing a mismatch of points between adjacent paths. (4) There are some active landslides in the overlapping areas. In our case, the number of landslides in the overlapping areas is no more than three, so their contributions to this disparity may be limited.
Figure 8. The distribution of displacement rate difference for the overlapping areas between (a) path 464 and path 463 datasets; (b) path 463 and path 462 datasets.
Remotesensing 08 00136 g008
Figure 9. Time series displacement of point P5 along the slope direction located at the Huangtupo landslide.
Remotesensing 08 00136 g009
Unfortunately, we have no in-situ measurement data in the Three Gorgers area, so it is impossible to evaluate the absolute accuracy of our results. To evaluate the consistency of time series measurements, time series displacements from path 462 and path 463 at point P5 (refer to Figure 7) located on the Huangtupo landslide were illustrated in Figure 9. The Huangtupo landslide is a translational landslide [34]. The LOS displacements were transformed onto the downslope direction. Slight discrepancies can be observed between the measurements from path 462 and path 463, for which the reasons might be the same as discussed above. On the other hand, the measurements of path 462 were referenced with respect to 4 January 2010 while the measurements of path 463 were referenced with respect to 21 January 2010. This could also be an important cause for the discrepancies in displacement differences between the two paths. Additionally, phase unwrapping artifacts induced by different datasets might also be considered.

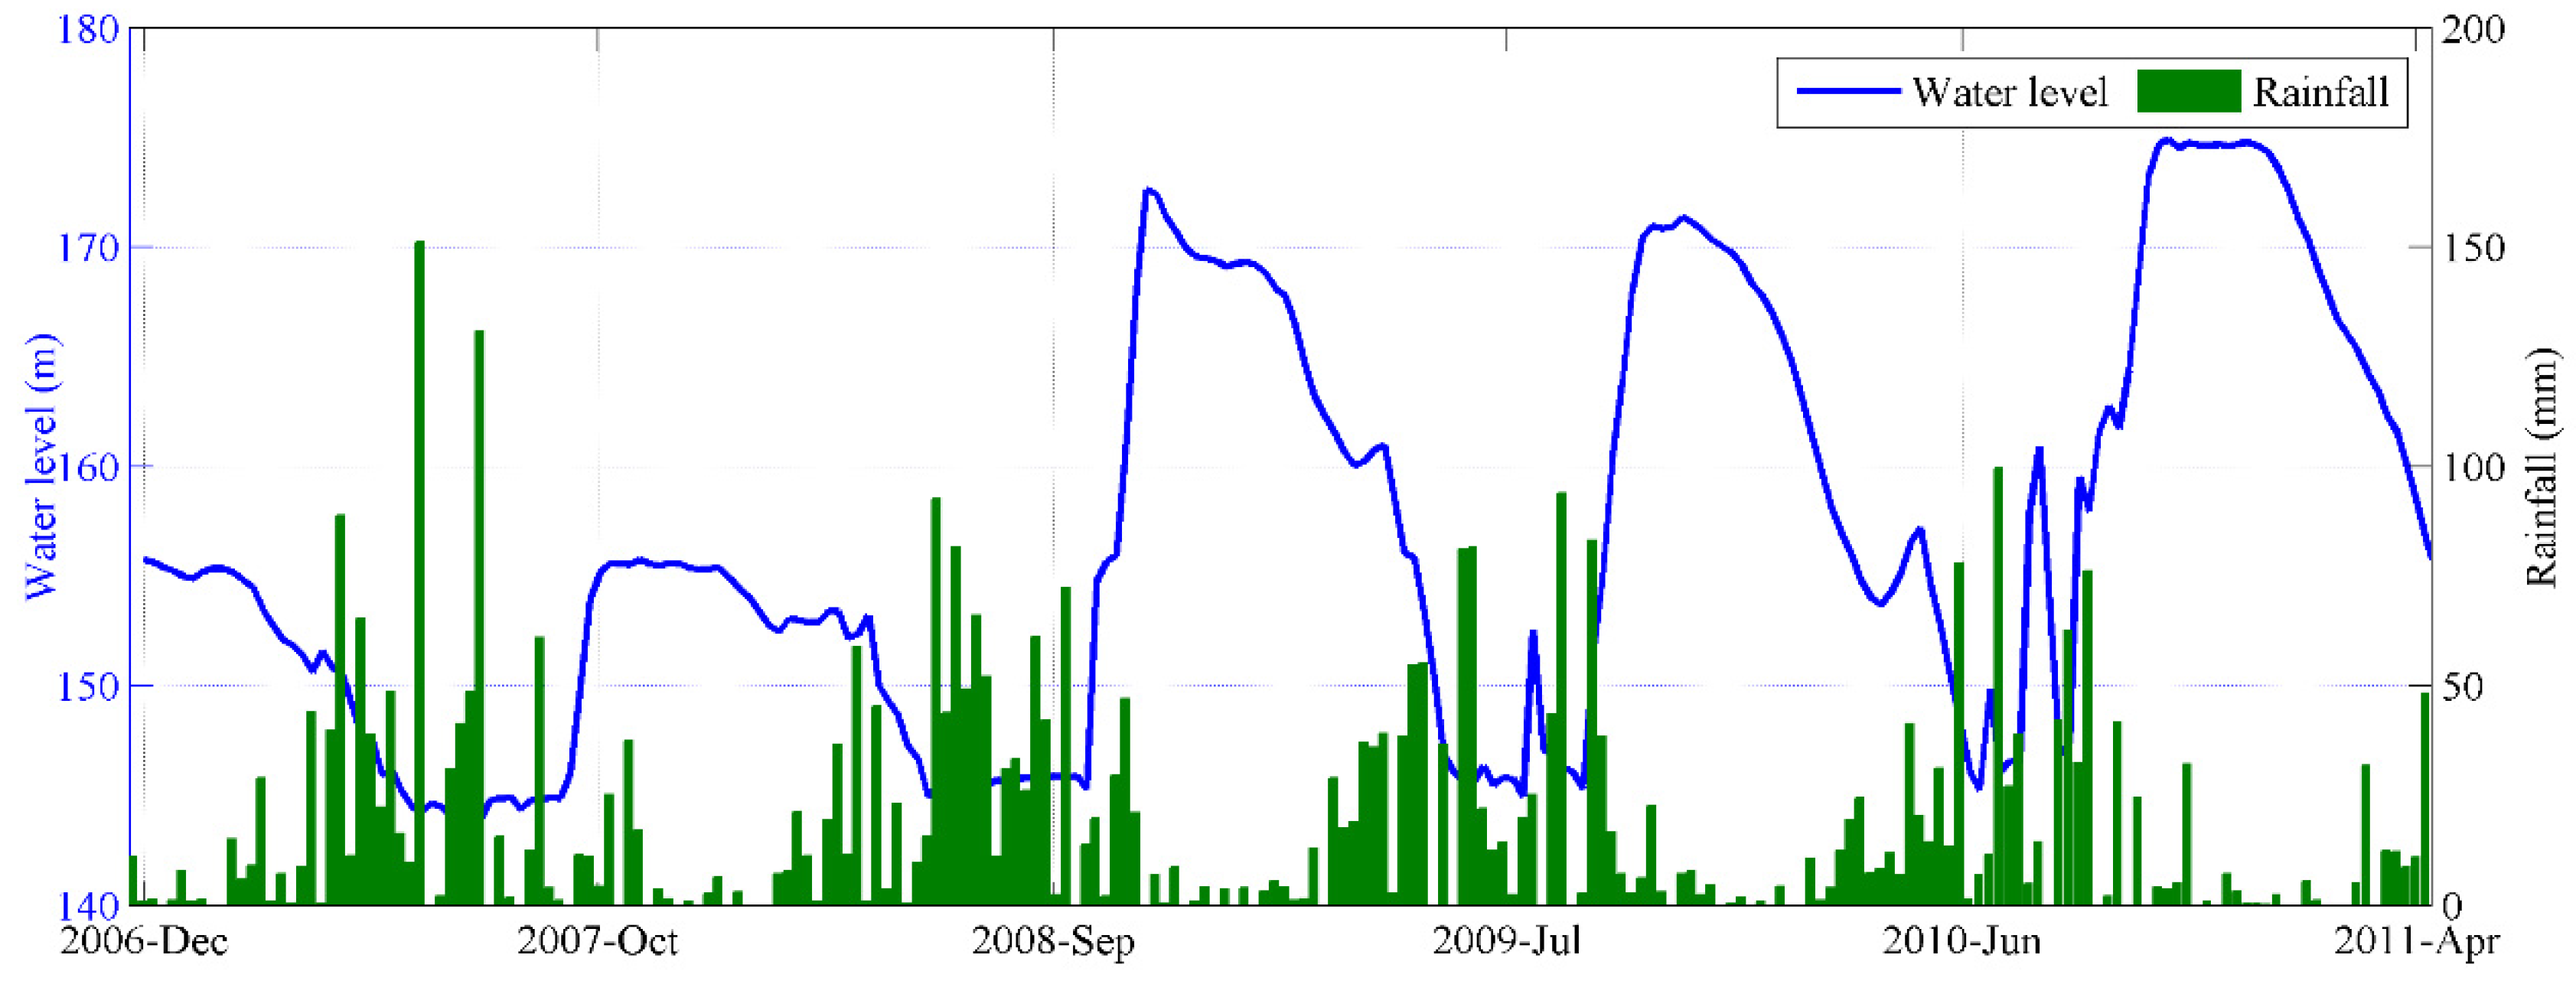
4.3. Effect of Seasonal Rainfall on APS Variation

Preceding the analysis of the time series results of SDFT pixels, the influence of atmospheric turbulence to our displacement estimation was discussed. In a mountainous area such as the Three Gorges region along the Yangtze River, the phase distortions induced by atmospheric turbulence are very significant. Figure 10a gives the phase signal induced by atmospheric turbulence on point P2 for each slave image with respect to the master image. Strong correlation can be observed between atmospheric signal and seasonal rainfall. More specifically, we can see that the seasonal rainfall caused large atmospheric artifacts in the rainy seasons while the effect is relatively small in dry seasons. On the other hand, water level fluctuation might also contribute to the amount of water vapor in the Three Gorges area, whereby the large water level fluctuation in the Three Gorges area might result in a change in water vapor concentration. However, compared to the effect of rainfall on atmospheric turbulence, it seems that the effect of water level fluctuation is relatively minor.
The differences among estimations of APS with or without stratified APS corrections are very small for pixels with heights close to the reference point. For pixels with large elevation differences with respect to the reference point, if the atmospheric signal is not properly estimated and removed, the seasonal effects will remain in the displacement signal and significantly hinder the interpretation of the results. Figure 10b shows the time series displacements signal after removing the spatially-correlated atmospheric signal with and without stratified APS correction. We can see that without stratified APS correction, part of the APS signal still remains in the time series displacements, while the results appear to be more reasonable after correction.
Figure 10. (a) Estimated atmospheric signal on P1 and impact factors: water level (unit: m) and rainfall (unit: mm), the dashed line represents the temporal location of the master image. (b) Time series displacements on P1 with and without stratified APS correction.
Remotesensing 08 00136 g010

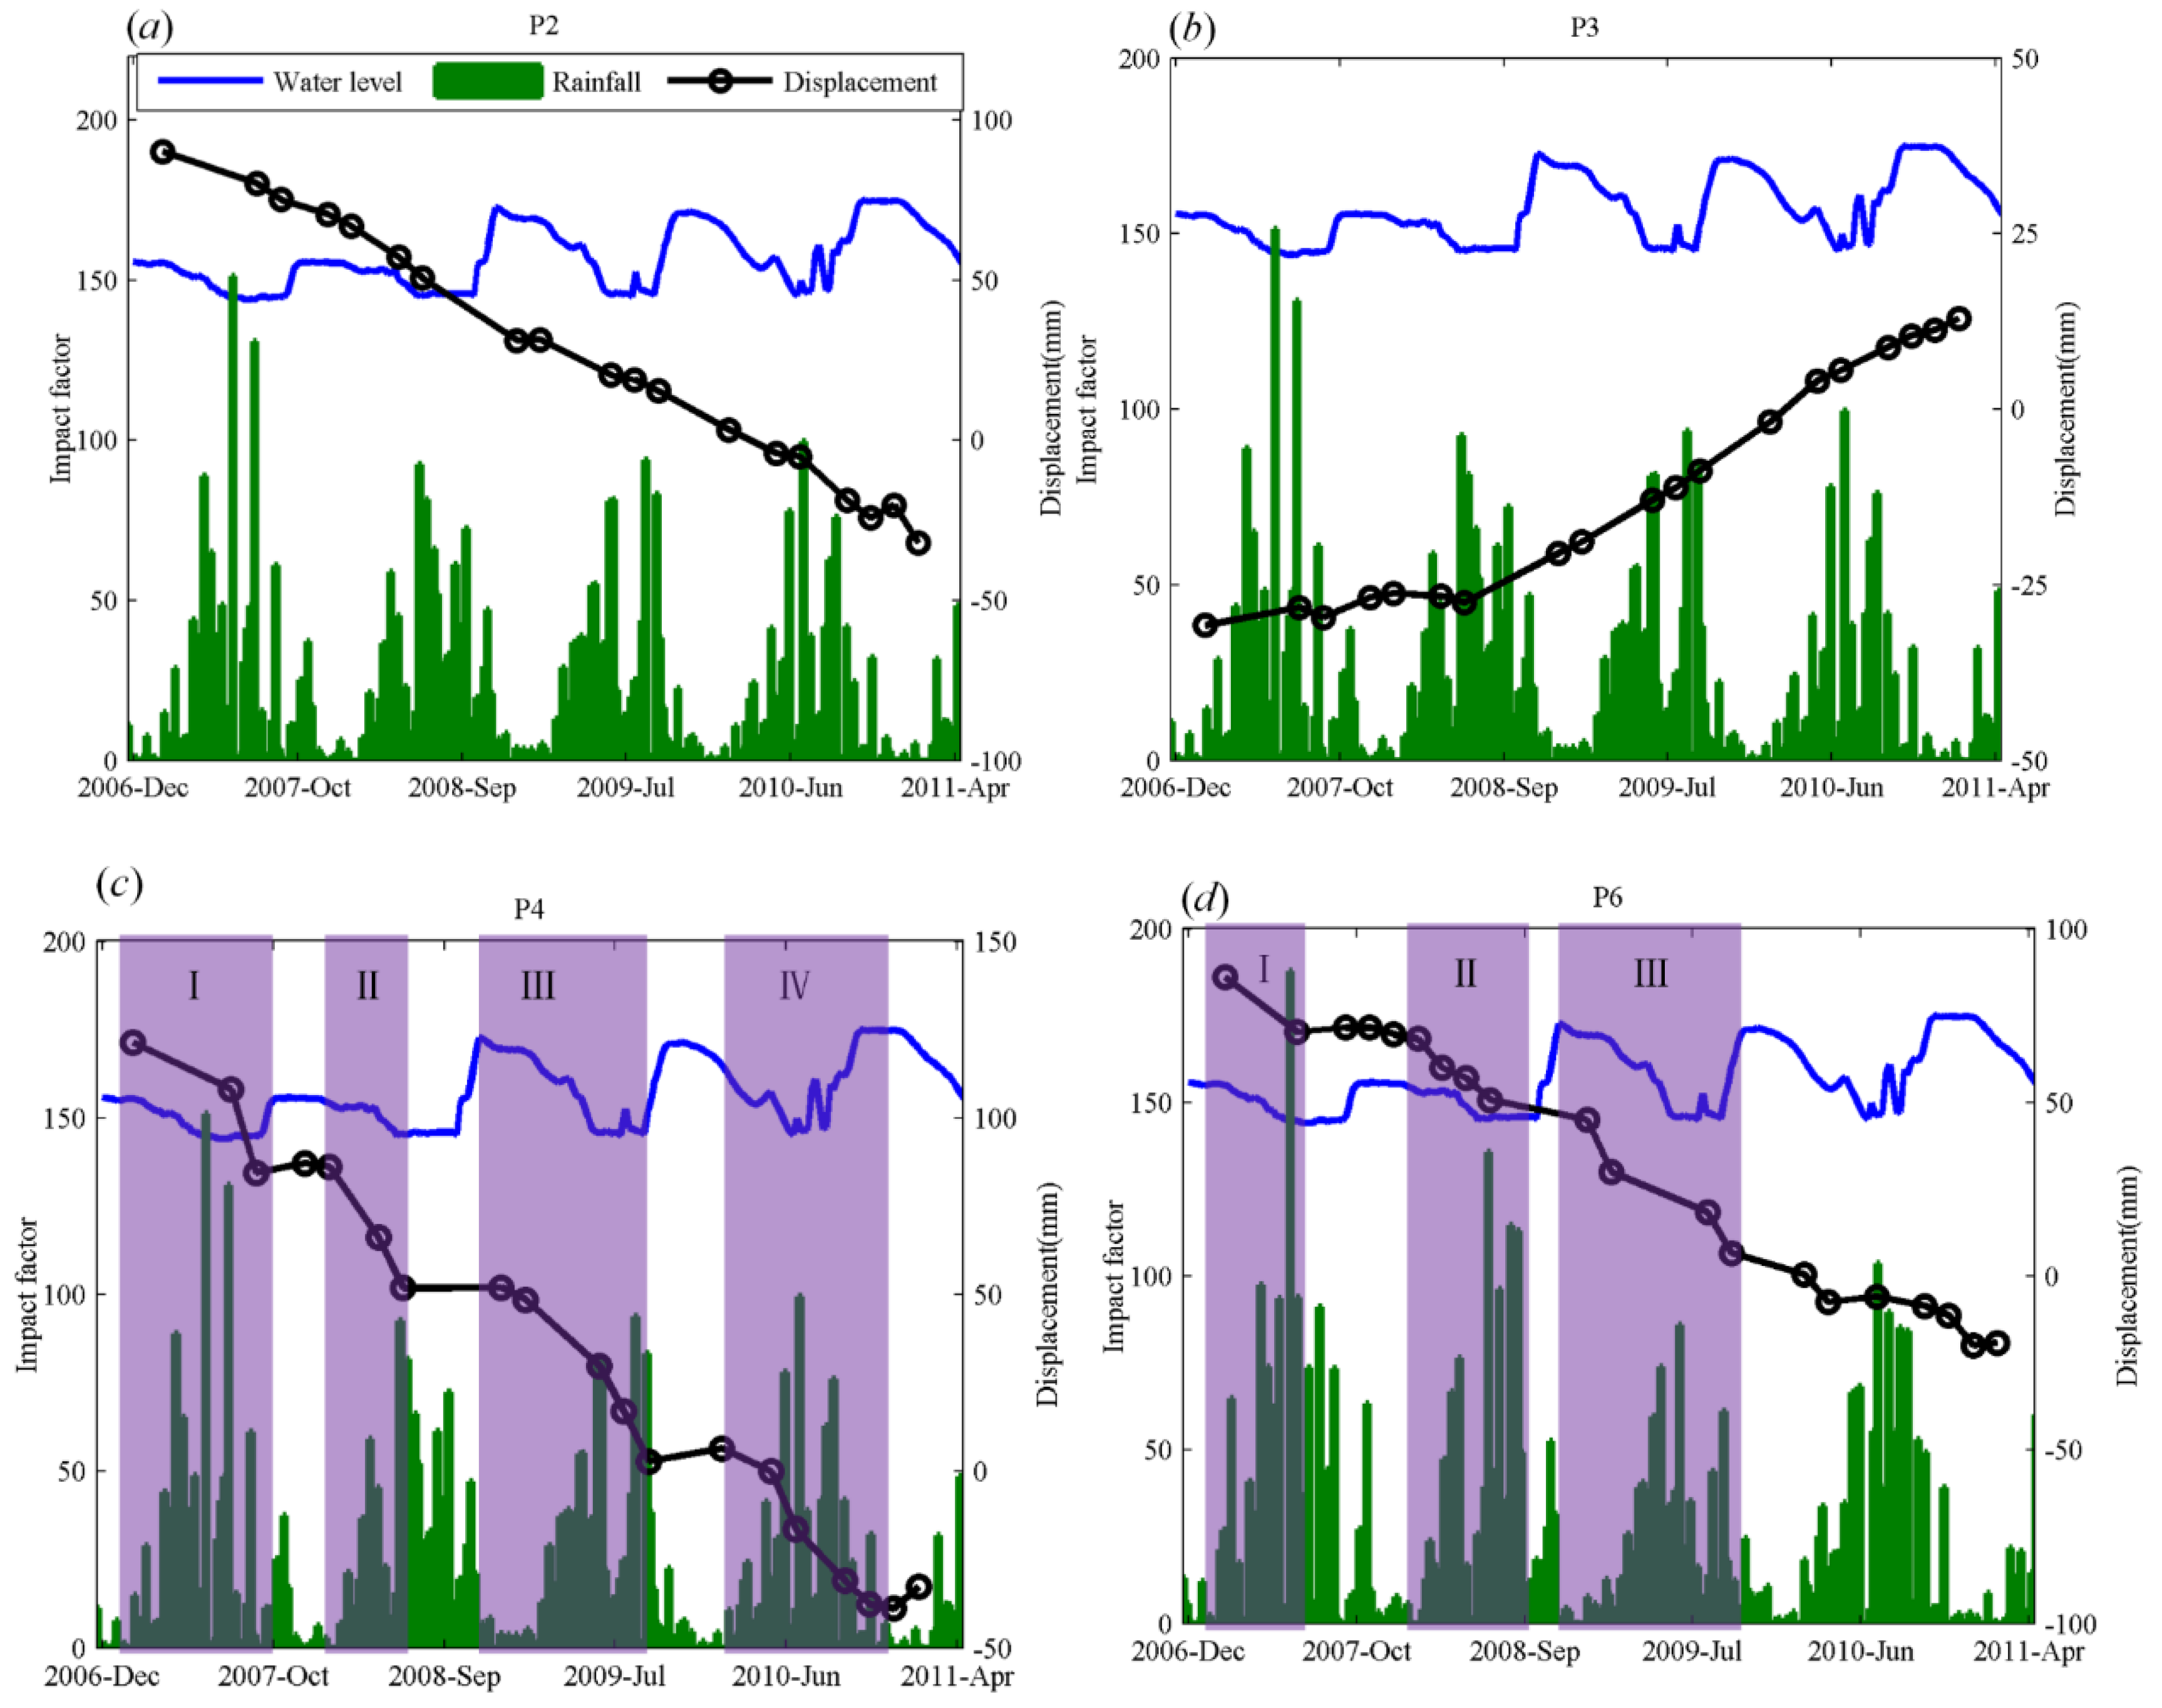
4.4. Impact Factors for Landslide Activities

According to our results, most of the landslides have a nearly linear displacement trend as shown in Figure 11a, particularly landslides located farther away from the Yangtze River. While small variations in the displacement trend might be occurring throughout the entire time span, the influence of water level variation is not obvious and can be neglected on these landslides.
Considering Figure 11b, the displacements of P3 can be divided into two periods. The displacement of P3 is very small with almost a linear rate before August 2008. Acceleration of displacement occurred during the second period, but the displacement trend is still linear. The change in displacement rate between these two periods might be triggered by the consecutive rainfall in the summer of 2008.
Figure 11. Relationship between impact factors and displacements on (a) P2; (b) P3; (c) P4; (d) P6. The measurement units are meter for water level and millimeter for rainfall separately.
Remotesensing 08 00136 g011
Water level fluctuations and rainfall are the two most important impact factors of slope stabilities in the Three Gorges region for slopes near the river [16]. The upstream water level of Three Gorges and rainfall records from Badong and Fengjie were used to investigate the relationship between displacements and water level fluctuation/rainfall. Since the temporal sampling rate of ALOS PALSAR is very low, the relationship between displacements and water level/rainfall was analyzed by visual inspection. As we can see from Figure 11c, the landslides located at P4 experienced stepwise displacements. The landslides in the Three Gorges areas with stepwise displacement progression mainly undergo two main processes: the sliding process and the dormant process [16]. During the sliding process, the landslide moves at inconsistent rates, whereas during the dormant stage, shear strength has been recovered and stability is achieved for some duration of time.
There are generally four periods of movement at P4. Among the four periods, period II could be caused by the decline of the water level when the rainfall is relatively small. Periods I, III and IV could be caused by the joint effect of water level decline and rainfall. During these three periods, the rainfall was relatively low at first while the fast decline of the reservoir water level triggered the movement by changing the pressure difference between the groundwater inside the slope and the reservoir waterbody outside [35]. The following heavy rainfall caused the displacement to accelerate, especially during period I when the weekly rainfall reached more than 150 mm. It is also worth noting that a lag effect of water level may be present. For periods III and IV, although heavy rainfall followed when the decline of the water level ceased, the lag effect of the water level decline might also have contributed to the movement at the end of periods III and IV.
The movement of P6 located at the Fangjiaping landslide was fairly complicated, as shown in Figure 11d. There may be a constant displacement trend that exists during the entire progression of the Fangjiaping landslide; nevertheless, we can find three periods with where accelerations occur. Periods I and II may be mainly caused by the reservoir water level decline. Although the weekly rainfall at the end of period I reached more than 180 mm, no acceleration was observed during the following process. The movement of periods II and III might be accelerated by the water level decline and the following movements at the end of these two periods might be caused by the rainfall and lag effect of the water level decline.

5. Conclusions

In this paper, we investigated the stability of slopes from Fengjie to Zigui within the Three Gorges area by time series InSAR analysis. InSAR data with its large coverage and millimeter accuracy is suitable for displacement monitoring in the vast Three Gorges area. However, we have to overcome decorrelation effects and atmospheric disturbances to achieve good results. To avoid decorrelation as much as possible, L-band SAR data with longer wavelengths are preferred. To overcome atmospheric disturbances, a hybrid description model of atmospheric phase screen (APS) is necessary to improve APS estimation from time series interferograms, particularly in mountainous areas such as the Three Gorges region. The estimated atmospheric phase was mainly correlated with the seasonal rainfall in the temporal dimension.
About 30 slopes covering areas of 48 km2 in total were identified to be active with slopes ranging from 15 to 30 degrees. Through time series analysis, active landslides far away from the Yangtze River exhibit a linear displacement trend. Rainfall plays a key role in the change of the displacement trend. For those active landslides located near the river, rapid water level decline and consecutive rainfall are potentially two key factors to increase slope instability.
It is worth noting that the limitations of the InSAR method can make it blind to several active phenomena. InSAR methods applied to polar-orbit satellite SAR datasets are only sensitive to displacement in the LOS direction, while they hardly detect movements parallel to the flight direction, such as the north-south direction in our study. Geometric distortions such as shadow and obscuring landscape features can also make many slopes invisible in SAR images [22]. Descending and ascending datasets can be combined to increase the effective coverage of InSAR measurements. Additionally, for fast-moving landslides, a large displacement gradient might go beyond the upper detectability of InSAR methods, which would make interferometric phase observation completely fail to measure these displacements. An effective tool for fast-moving landslide detection is the pixel offset tracking method with high-resolution SAR data. Successful applications have also been achieved on the Shuping landslide in the Three Gorges area with high-resolution TerraSAR-X data [22,35,36,37]. A combination of the InSAR method and pixel offset tracking methods can be carried out with high-resolution SAR datasets in our future work.

Acknowledgments

This work was financially supported by the National Key Basic Research Program of China (Grant No. 2013CB733205 and No. 2013CB733204) and the National Natural Science Foundation of China (Grant No. 61331016 and 41271457). The PALSAR datasets were provided by Japan Aerospace Exploration Agency (JAXA) through the ALOS-RA4 project (PI1247, PI1440). Ziyun Wang from Wuhan University was appreciated for helping to collect the water level data of the upstream of Yangtze River.

Author Contributions

Xuguo Shi processed ALOS PALSAR data, interpreted the results and wrote the original manuscript. Mingsheng Liao supervised the research. Menghua Li contributed to some processings of the InSAR images. Lu Zhang wrote the manuscript and interpreted the results. Cory Cunningham proofread and edited the manuscript. All authors have read and approved the final manuscript.

Conflicts of Interest

The authors declare no conflict of interest.

References

  1. Liu, C.; Liu, Y.; Wen, M.; Li, T.; Lian, J.; Qin, S. Geo-hazard initiation and assessment in the Three Gorges Reservoir. In Landslide Disaster Mitigation in Three Gorges Reservoir, China; Wang, F., Li, T., Eds.; Springer Berlin: Heidelberg, Germany, 2009; pp. 3–40. [Google Scholar]
  2. Peng, L.; Niu, R.; Huang, B.; Wu, X.; Zhao, Y.; Ye, R. Landslide susceptibility mapping based on rough set theory and support vector machines: A case of the Three Gorges area, China. Geomorphology 2014, 204, 287–301. [Google Scholar] [CrossRef]
  3. Plateau, T. Three Gorges Dam: Into the unknown. Science 2006, 25, 1034. [Google Scholar]
  4. Xia, Y.; Kaufmann, H.; Guo, X. Differential SAR interferometry using corner reflectors. IEEE Int. Geosci. Remote Sens. Symp. 2002, 2, 1243–1246. [Google Scholar]
  5. Xia, Y.; Kaufmann, H.; Guo, X. Landslide monitoring in the Three Gorges area using D-InSAR and corner reflectors. Photogramm. Eng. Remote Sens. 2004, 70, 1167–1172. [Google Scholar]
  6. Ferretti, A.; Prati, C.; Rocca, F. Permanent scatterers in SAR interferometry. IEEE Trans. Geosci. Remote Sens. 2001, 39, 8–20. [Google Scholar] [CrossRef]
  7. Berardino, P.; Fornaro, G.; Lanari, R.; Sansosti, E. A new algorithm for surface deformation monitoring based on small baseline differential SAR interferograms. IEEE Trans. Geosci. Remote Sens. 2002, 40, 2375–2383. [Google Scholar] [CrossRef]
  8. Hooper, A. A multi-temporal InSAR method incorporating both persistent scatterer and small baseline approaches. Geophys. Res. Lett. 2008, 35, L16302. [Google Scholar] [CrossRef]
  9. Liao, M.S.; Tang, J.; Wang, T.; Balz, T.; Zhang, L. Landslide monitoring with high-resolution SAR data in the Three Gorges region. Sci. China Earth Sci. 2012, 55, 1–12. [Google Scholar] [CrossRef]
  10. Perissin, D.; Wang, T. Repeat-Pass SAR Interferometry With Partially Coherent Targets. IEEE Trans. Geosci. Remote Sens. 2012, 50, 271–280. [Google Scholar] [CrossRef]
  11. Liu, P.; Li, Z.; Hoey, T.; Kincal, C.; Zhang, J.; Zeng, Q.; Muller, J.-P. Using advanced InSAR time series techniques to monitor landslide movements in Badong of the Three Gorges region, China. Int. J. Appl. Earth Observ. Geoinf. 2013, 21, 253–264. [Google Scholar] [CrossRef]
  12. Tantianuparp, P.; Shi, X.; Zhang, L.; Balz, T.; Liao, M. Characterization of Landslide Deformations in Three Gorges Area Using Multiple InSAR Data Stacks. Remote Sens. 2013, 5, 2704–2719. [Google Scholar] [CrossRef]
  13. Shi, X.; Zhang, L.; Liao, M.; Balz, T. Deformation monitoring of slow-moving landslide with L- and C-band SAR interferometry. Remote Sens. Lett. 2014, 5, 951–960. [Google Scholar] [CrossRef]
  14. Zhang, L.; Liao, M.; Balz, T.; Shi, X.; Jiang, Y. Monitoring landslide activities in the Three Gorges Area with multi-frequency satellite SAR data sets. In Modern Technologies for Landslide Monitoring and Prediction; Scaioni, M., Ed.; Springer Berlin Heidelberg: Berlin, Germany, 2015; pp. 181–208. [Google Scholar]
  15. Ng, A.H.-M.; Chang, H.-C.; Ge, L.; Rizos, C.; Omura, M. Assessment of radar interferometry performance for ground subsidence monitoring due to underground mining. Earth Planets Space (EPS) 2009, 61, 733. [Google Scholar] [CrossRef]
  16. Miao, H.; Wang, G.; Yin, K.; Kama, T.I.; Li, Y. Mechanism of the slow-moving landslides in Jurassic red-strata in the Three Gorges Reservoir, China. Eng. Geol. 2014, 171, 59–69. [Google Scholar] [CrossRef] [Green Version]
  17. Cojean, R.; Caï, Y.J. Analysis and modeling of slope stability in the Three-Gorges Dam reservoir (China)—The case of Huangtupo landslide. J. Mountain Sci. 2011, 8, 166–175. [Google Scholar] [CrossRef]
  18. Wang, F.; Zhang, Y.; Huo, Z.; Peng, X.; Wang, S.; Yamasaki, S. Mechanism for the rapid motion of the Qianjiangping landslide during reactivation by the first impoundment of the Three Gorges Dam reservoir, China. Landslides 2008, 5, 379–386. [Google Scholar] [CrossRef]
  19. Sun, Q.; Zhang, L.; Ding, X.L.; Hu, J.; Li, Z.W.; Zhu, J.J. Slope deformation prior to Zhouqu, China landslide from InSAR time series analysis. Remote Sens. Environ. 2015, 156, 45–57. [Google Scholar] [CrossRef]
  20. Teshebaeva, K.; Roessner, S.; Echtler, H.; Motagh, M.; Wetzel, H.-U.; Molodbekov, B. ALOS/PALSAR InSAR Time series Analysis for Detecting Very Slow-Moving Landslides in Southern Kyrgyzstan. Remote Sens. 2015, 7, 8973–8994. [Google Scholar] [CrossRef]
  21. Tang, P.; Chen, F.; Guo, H.; Tian, B.; Wang, X.; Ishwaran, N. Large-Area Landslides Monitoring Using Advanced Multi-Temporal InSAR Technique over the Giant Panda Habitat, Sichuan, China. Remote Sens. 2015, 7, 8925–8949. [Google Scholar] [CrossRef]
  22. Wasowski, J.; Bovenga, F. Investigating landslides and unstable slopes with satellite Multi Temporal Interferometry: Current issues and future perspectives. Eng. Geol. 2014, 174, 103–138. [Google Scholar] [CrossRef]
  23. Hooper, A.; Zebker, H.A. Phase unwrapping in three dimensions with application to InSAR time series. J. Opt. Soc. Am. A 2007, 24, 2737–2747. [Google Scholar] [CrossRef]
  24. Zhang, L.; Ding, X.; Lu, Z.; Jung, H.-S.; Hu, J.; Feng, G. A novel multitemporal InSAR model for joint estimation of deformation rates and orbital errors. IEEE Trans. Geosci. Remote Sens. 2014, 52, 3529–3540. [Google Scholar] [CrossRef]
  25. Perissin, D.; Wang, T. Time series InSAR Applications Over Urban Areas in China. IEEE J. Sel. Top. Appl. Earth Observ. Remote Sens. 2011, 4, 92–100. [Google Scholar] [CrossRef]
  26. Liao, M.; Jiang, H.; Wang, Y.; Wang, T.; Zhang, L. Improved topographic mapping through high-resolution SAR interferometry with atmospheric effect removal. ISPRS J. Photogramm. Remote Sens. 2013, 80, 72–79. [Google Scholar] [CrossRef]
  27. Ng, A.H.-M.; Ge, L.; Li, X. Assessments of land subsidence in the Gippsland Basin of Australia using ALOS PALSAR data. Remote Sens. Environ. 2015, 159, 86–101. [Google Scholar] [CrossRef]
  28. Cascini, L.; Fornaro, G.; Peduto, D. Advanced low- and full-resolution DInSAR map generation for slow-moving landslide analysis at different scales. Eng. Geol. 2010, 112, 29–42. [Google Scholar] [CrossRef]
  29. Qiao, J.; Wang, M. Distribution Features of Landslides in Three Gorges Area and the Contribution of Basic Factors. In Landslide Disaster Mitigation in Three Gorges Reservoir, China; Springer: Berlin, Germany, 2009; pp. 173–192. [Google Scholar]
  30. Gui, L. Research on Landslide Development Regularities and Risk in Wan Zhou District, Three Gorges Reservoir. PhD Thesis, China University of Geosciences, Wuhan, China, 31 May 2014. [Google Scholar]
  31. Fourniadis, I.G.; Liu, J.G.; Mason, P.J. Landslide hazard assessment in the Three Gorges area, China, using ASTER imagery: Wushan–Badong. Geomorphology 2007, 84, 126–144. [Google Scholar] [CrossRef]
  32. Liu, J.G.; Mason, P.J.; Cleric, N.; Chen, S.; Davis, A.; Miao, F.; Deng, H.; Liang, L. Landslide hazard assessment in the Three Gorges area of the Yangtze river using ASTER imagery: Zigui–Badong. Geomorphology 2004, 61, 171–187. [Google Scholar] [CrossRef]
  33. Xia, Y. Synthetic Aperture Radar Interferometry. In Sciences of Geodesy—I; Xu, G., Ed.; Springer Berlin Heidelberg: Berlin, Germany, 2010; pp. 415–474. [Google Scholar]
  34. Chai, B.; Yin, K.; Du, J.; Xiao, L. Correlation between incompetent beds and slope deformation at Badong town in the Three Gorges reservoir, China. Environ. Earth Sci. 2013, 69, 209–223. [Google Scholar] [CrossRef]
  35. Shi, X.; Zhang, L.; Balz, T.; Liao, M. Landslide deformation monitoring using point-like target offset tracking with multi-mode high-resolution TerraSAR-X data. ISPRS J. Photogramm. Remote Sens. 2015, 105, 128–140. [Google Scholar] [CrossRef]
  36. Singleton, A.G.; Li, Z.; Hoey, T.; Muller, J.P. Evaluating sub-pixel offset techniques as an alternative to D-InSAR for monitoring episodic landslide movements in vegetated terrain. Remote Sens. Environ. 2014, 147, 133–144. [Google Scholar] [CrossRef]
  37. Singleton, A.G. Analysing Landslides in the Three Gorges Region (China) Using frequently Acquired SAR Images. PhD Thesis, University of Glasgow, Glasgow, UK, 2014. [Google Scholar]

