Article

Analysis of Aerosol Properties in Beijing Based on Ground-Based Sun Photometer and Air Quality Monitoring Observations from 2005 to 2014

1
College of Geoscience and Surveying Engineering, China University of Mining & Technology, Beijing 100083, China
2
Satellite Surveying and Mapping Application Center, National Administration of Surveying, Mapping and Geoinformation, Beijing 101300, China
3
Beijing Key Lab of Spatial Information Integration & Its Applications, Peking University, Beijing 100871, China
*
Authors to whom correspondence should be addressed.
These authors contributed equally to this work.
Remote Sens. 2016, 8(2), 110; https://doi.org/10.3390/rs8020110
Submission received: 27 October 2015 / Revised: 25 January 2016 / Accepted: 28 January 2016 / Published: 3 February 2016

Abstract

:
Aerosol particles are the major contributor to the deterioration of air quality in China’s capital, Beijing. Using ground-based sun photometer observations from 2005 to 2014, the long-term variations in optical properties and microphysical properties of aerosol in and around Beijing were investigated in this study. The results indicated little inter-annual variations in aerosol optic depth (AOD) but an increase in the fine mode AODs both in and outside Beijing. Furthermore, the single scattering albedo in urban Beijing is larger, while observations at the site that is southeast of Beijing suggested that the aerosol there has become more absorbing. The intra-annual aspects were as follow: The largest AOD and high amount of fine mode aerosols are observed in the summer. However, the result of air pollution index (API) that mainly affected by the dry density of near-surface aerosol indicated that the air quality has been improving since 2006. Winter and spring were the most polluted seasons considering only the API values. The inconsistency between AOD and API suggested that fine aerosol particles may have a more important role in the deterioration of air quality and that neglecting particulate matter with aerodynamic diameter less than 2.5 μm (PM2.5) in the calculation of API might not be appropriate in air quality evaluation. Through analysis of the aerosol properties in high API days, the results suggested that the fine mode aerosol, especially PM2.5 has become a major contributor to the aerosol pollution in Beijing.

Graphical Abstract

1. Introduction

Aerosol is an important component of the atmosphere that affects the environment [1,2,3], weather [4], climate [5] and even human health [6,7,8]. Thus, monitoring aerosol properties via both ground-based observations and satellite observations has become important [4,9,10]. However, monitoring aerosol properties, including aerosol optic depth (AOD), size distributions, and single scattering albedo (SSA), is a difficult task as remote sensing techniques obtain aerosol properties through measuring direct solar radiance and sky scattering signals [11]. For ground-based observations, AOD can be measured with high accuracy, while the accuracies of size distribution and single scattering albedo are not as high quality as AOD. For satellite observations, the utilization of weak backscattering signal, which is easily “polluted” by land surface, reflection signals makes the retrieval of AOD less reliable. However, satellite observations provide unique tools for monitoring wide-range aerosol properties considering the available wide coverage of the earth surface, and various satellite-based sensors such as the Moderate Resolution Imaging Spectroradiometer (MODIS), Multi-angle Imaging Spectroradiometer (MISR) and POLarization and Directionality of the Earth’s Reflectances (POLDER) were launched to provide huge quantity of aerosol observation data [12,13,14]. However, retrieval of aerosol properties with satellite data relies on the backscattering signal of atmospheric particles, which is easily “contaminated” by bright surface reflection [15], although various efforts have been made to overcome this problem, e.g., via “Deep-Blue” algorithm for MODIS [16]. Furthermore, although AOD is the major product that can be evaluated via satellite observations, other aerosol properties determined via satellite observations seems to be unreliable.
Ground-based observations, by deploying sun photometers aimed directly at the sun, do not have the problem of bright surface contaminations. The Aerosol Robotic Network (AERONET) includes more than 400 ground-based observation sites all over the world, including cities, rural areas, deserts, forests, grasslands, and ocean [17,18,19]. Besides AERONET, there are several international ground-based sunphotometer networks such as SKYradiometer NETwork (SKYNET), China Aerosol Remote Sensing Network (CARSNET) [20,21] and Chinese Sun Hazemeter Network (CSHNET) [22]. The multi-year AERONET data suggest that the lognormal, instead of normal distribution, is a good empirical statistical tool for AOD analysis [23,24,25]. AERONET measurements could enable accurate retrieval of AOD, SSA, and particle size distribution by taking into account the direct solar measurements and scattering measurements [26,27] and thus have become the benchmark for validation of satellite AOD retrievals [28,29,30,31] and radiative forcing calculation for aerosol [32,33]. However, highly inhomogeneous aerosol distribution in both spatial and temporal range is observed. The ground-based measurements could not cover a wide spatial range and, therefore, had to be restricted to local applications or satellite validations. For local categories, AERONET observations, especially long-term continuous observation could provide unique tools to investigate the aerosol property variations [34].
Beijing, the capital of China, is a megacity with a population of more than 19 million [35] and has experienced rapid economic development over the past decades. Beijing shows distinct seasonal transitions: in the winter, winds are mainly from north or northwest directions with little precipitation, while in the summer, the weather is humid and hot with a large amount of rainfall. Aerosols here also show typical seasonal variations. Atmospheric pollution, especially high aerosol particle concentrations (i.e., particulate matter with aerodynamic diameter less than 2.5 and 10 μm (PM2.5 and PM10, respectively)) is serious environmental problem for local residents [36,37,38]. Therefore, determining the aerosol properties in Beijing is important. Based on ground observations, the relationship between aerosol optic properties and meteorological parameters could be investigated in detail to identify the aerosol pollution sources in Beijing [39]. The vertical distributions of aerosol particles could be analyzed through aircraft studies [40]. The source and properties of aerosol pollution and haze-fog events in winter in Beijing have been determined by performing remote sensing [41] or surface monitoring [36,37,38].
Five AERONET stations have been deployed in the region in and around Beijing (Beijing site, Beijing-CAMS site, PKU_PEK site, Xianghe site and Yufa PEK site), and continuous observations have been carried out since 2005 at the Beijing and Xianghe sites. Aerosol properties were retrieved by utilizing direct sun and diffuse sky radiances [42]. These two stations have been treated as an urban station and suburban station of Beijing with different aerosol properties [43]. In this paper, two stations with continuous data since 2005 were selected to analyze the aerosol properties from 2005 to 2014.
The main objective of this study is to analyze the aerosol property variations since 2005 via ground-based observations. The paper is structured as follows. Description of the data and sites used in the paper are introduced in Section 2. Section 3 describes the observations and inversion at the two sites. In Section 4, the air quality monitoring data and aerosol measurements results are compared. The conclusions are given in Section 5.

2. Data and Methodology

2.1. AERONET Observations

The AERONET observations, including more than 400 stations worldwide, provided aerosol properties inversions by fitting the sun radiance and the angular distribution of sky radiance at four wavelengths (440 nm, 675 nm, 870 nm and 1020 nm) to the successive order scattering (SOS) radiative transfer model. The AOD for each band is calculated under direct sun radiance at cloud-free conditions by eliminating gaseous absorption, and molecular scattering as follow:
τ a e r o s o l ( λ ) = τ t o t a l ( λ ) τ g a s ( λ ) τ m o l e c u l a r ( λ )
where τ t o t a l ( λ ) is the total optic depth of the atmosphere, τ a e r o s o l ( λ ) is the AOD, and τ g a s ( λ ) and τ m o l e c u l a r ( λ ) are the optic depth of gas absorption and molecular scattering, respectively [44].
The estimation of the inversion of micro properties of aerosol involves the Ångström exponent (α), volume size distribution, SSA and refractive index. The Ångström exponent is estimated by using two wavelengths, 870 nm and 440 nm, as it is more stable than that estimated using 675 nm and 440 nm:
τ a e r o s o l ( 870 ) τ a e r o s o l ( 440 ) = ( 870 440 ) α
For other properties, a statistical optimized algorithm was developed to estimate simultaneously the volume size distribution, SSA and refractive index [44,45]. AOD estimation, which is mainly dependent on the direct sun radiance, has an accuracy of 0.01–0.02. For SSA, the uncertainty ranges between 0.03 and 0.07. The volume size distribution’s uncertainty depends on the radius of aerosol particle [17].
In the Beijing region, long-term monitoring of aerosol properties has been carried out at two sites since March 2001: Beijing (39°58′37′′N, 116°22′51′′E) and Xianghe (39°45′14′′N, 116°57′43′′E). The retrieval parameters included AOD, volume size distributions, single scattering properties, refractive index, Ångström parameters, and fraction of spherical aerosol component. These long-term retrieval results provided by AERONET enable the analysis of the aerosol properties in Beijing.
Although these two sites provide the longest historical data about aerosol properties in Beijing, some data were missing due to several reasons such as weather limitations (on cloudy and rainy days), and equipment failure. For the Xianghe site, although the first public release of data began from March 2001, the data from May 2001 to August 2004 were not released. Therefore, the continuous observations from Xianghe site began from September 2004. Similarly, the continuous data from the Beijing site began April 2002 and ended in October 2014. As a result, the data from 2005 to 2014 were downloaded and analyzed in this study. There are three levels of aerosol retrieval data provided by AERONET: Level 1.0, Level 1.5, and Level 2.0. Level 1.0 provides data on direct inversion of aerosol properties without sufficient quality check. Level 1.5 data enable cloud screening and additional quality control, including data quality checks, triplet stability criterion check, diurnal stability check and three standard deviation criteria check to exclude clouds [46]. Level 2.0 data enable more rigorous quality checks including instrument performance check, temperature sensor check, calibration check, aerosol optical depth spectral dependency check, cloud contamination check, consistency check and historical data impact check [17]. In this paper, in order to provide sufficient and high quality data for analysis, level 1.5 AERONET retrieval data were selected and downloaded. Due to cloud contamination, instrument failure, bad weather conditions, and other issues, there might not be sufficient data to enable daily aerosol property retrieval. Therefore, the data for a few months are insufficient to be representative. Considering the representativeness of the retrieval results, we selected data for seasons with more than 40 successful daily retrievals. The data are summarized in Table 1. The seasonal retrieval results that are less than 40 are marked in bold in the table; data for these seasons were not included in the analysis.
Table 1. Summary of the AERONET (Aerosol Robotic Network) observations data *.
SiteYearNumber of Aerosol Optic Depth and Ångström Parameters (Spring, Summer, Autumn and Winter)Number of Retrievals of Particle Size Distribution and Other Parameters (Spring, Summer, Autumn and Winter)
Beijing Xianghe200573,67,75,75
79,73,71,73
63,40,69,64
68,60,64,64
Beijing Xianghe200682,53,73,75
82,68,78,78
73,34,65,67
74,46,69,69
Beijing Xianghe200772,68,73,0
77,66,63,76
68,48,63,0
69,49,53,70
Beijing Xianghe200845,45,16,82
36,63,68,77
35,13,14,70
29,42,62,68
Beijing Xianghe200984,68,46,73
78,63,58,59
70,50,42,63
73,49,49,54
Beijing Xianghe201076,70,74,86
68,60,68,81
66,55,64,79
56,46,58,76
Beijing Xianghe201187,76,46,79
86,66,66,69
73,53,41,73
71,43,57,66
Beijing Xianghe201280,50,15,68
65,41,70,50
71,19,3,57
58,26,65,24
Beijing Xianghe201382,54,48,69
80,56,74,33
74,45,39,65
71,42,66,24
Beijing Xianghe201478,67,47,76
82,76,63,82
68,48,18,39
36,47,47,74
* The seasonal retrieval results that are less than 40 are marked bold.

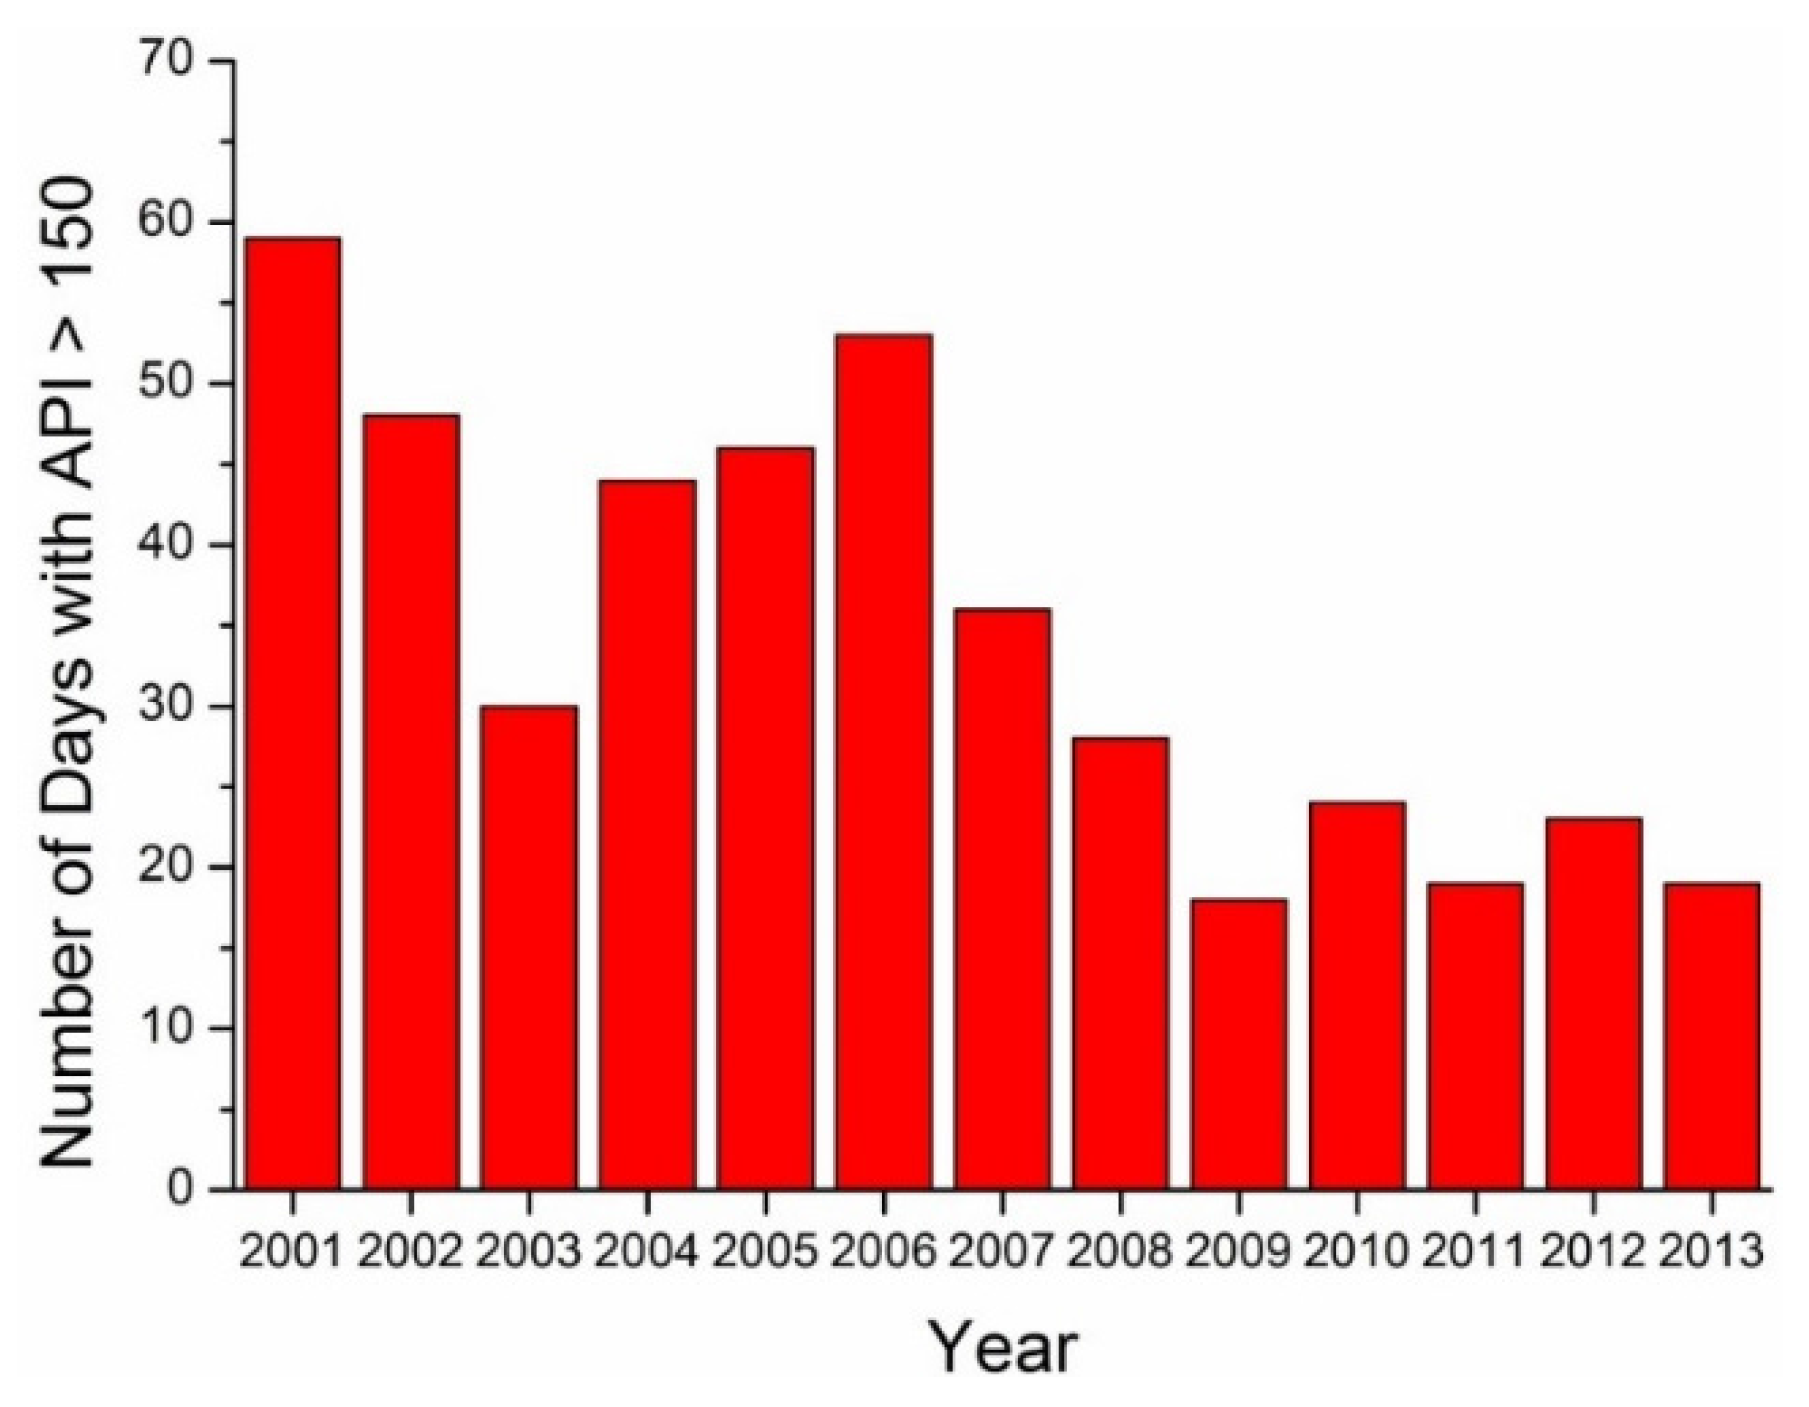
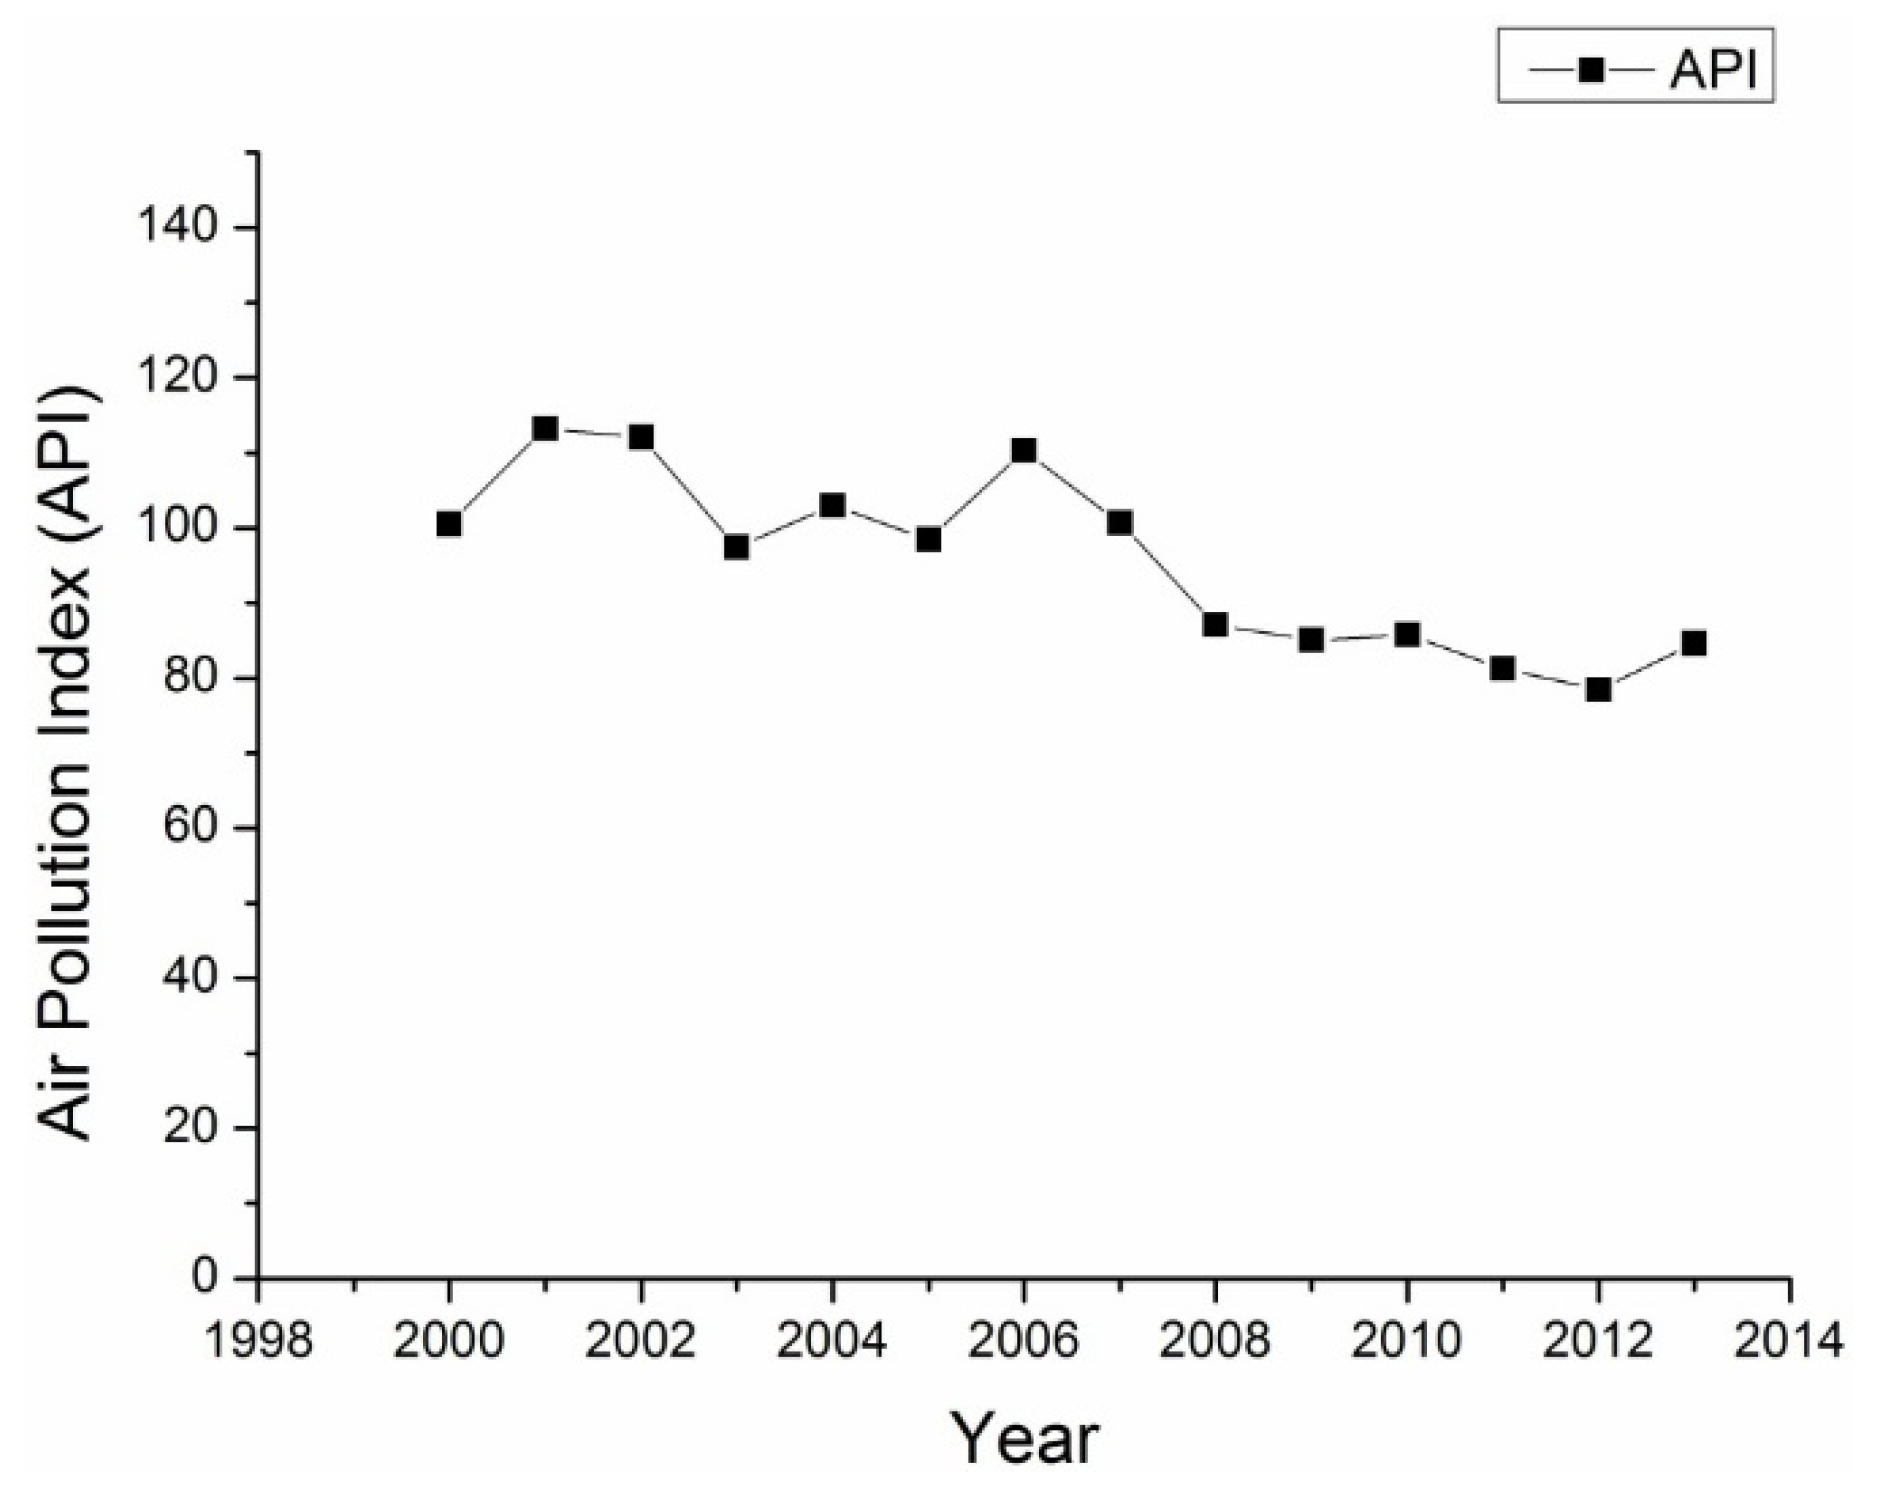
2.2. Air Quality Monitoring

In addition to the AERONET observation data, the air quality monitoring data were also included in in study. Since 2000, Beijing began to report daily air quality publicly at the request of the former State Environmental Protection Agency of China (now the Ministry of Environmental Protection of China) on its official [47]; the daily air pollution index (API) was calculated by taking into account PM10, SO2 and NO2. From January 2013, a new National Ambient Air Quality Standard was adopted for air quality monitoring by taking into account PM2.5, PM10, O3, SO2, NO2 and CO to monitor the air quality efficiently.
Before 2013, the API was the only public available long-term air quality monitoring data. The first step to calculate API is to calculate the individual API (IAPI) of each pollutant (i.e., PM10, SO2, NO2) as follows:
I A P I P = I A P I H i I A P I L o B P H i B P L o ( C P B P L o ) + I A P I L o
where IAPIp is the individual air pollution index for pollutant P, Cp is the concentration of pollutant P, BPHi and BPLo are, respectively, the nearby high and low values of Cp shown in Table 1, and IAPIHi and IAPILo are, respectively, the individual air pollution indexes in terms of BPHi and BPLo shown in Table 2.
After calculating the IAPI of each pollutant, the daily API was then calculated by:
A P I = m a x ( I A P I PM10 , I A P I SO 2 , I A P I NO 2 )
As there are no publicly available long-term data on particulate matter concentrations, the daily average PM10 concentrations were back-calculated using Equation (3), as the PM10 is the most frequent primary pollutants in Beijing without considering PM2.5 [48].
After 2013, real-time monitoring data for six pollutants (PM2.5, PM10, O3, SO2, NO2 and CO) were released by the Ministry of Environmental Protection of China in a national web-platform [49] for Beijing and other major cities in China. By deploying a web-based downloadable program, the real-time monitoring data in Beijing were obtained to calculate the daily average concentrations of particulate matters.
Table 2. Individual air pollution indexes and their corresponding concentration limits.
IAPIDaily SO2 Concentration (μg/m3)Daily NO2 Concentration (μg/m3)Daily PM10 Concentration (μg/m3)
50508050
100150120150
200800280350
3001600565420
4002100750400
5002620940600

3. Results

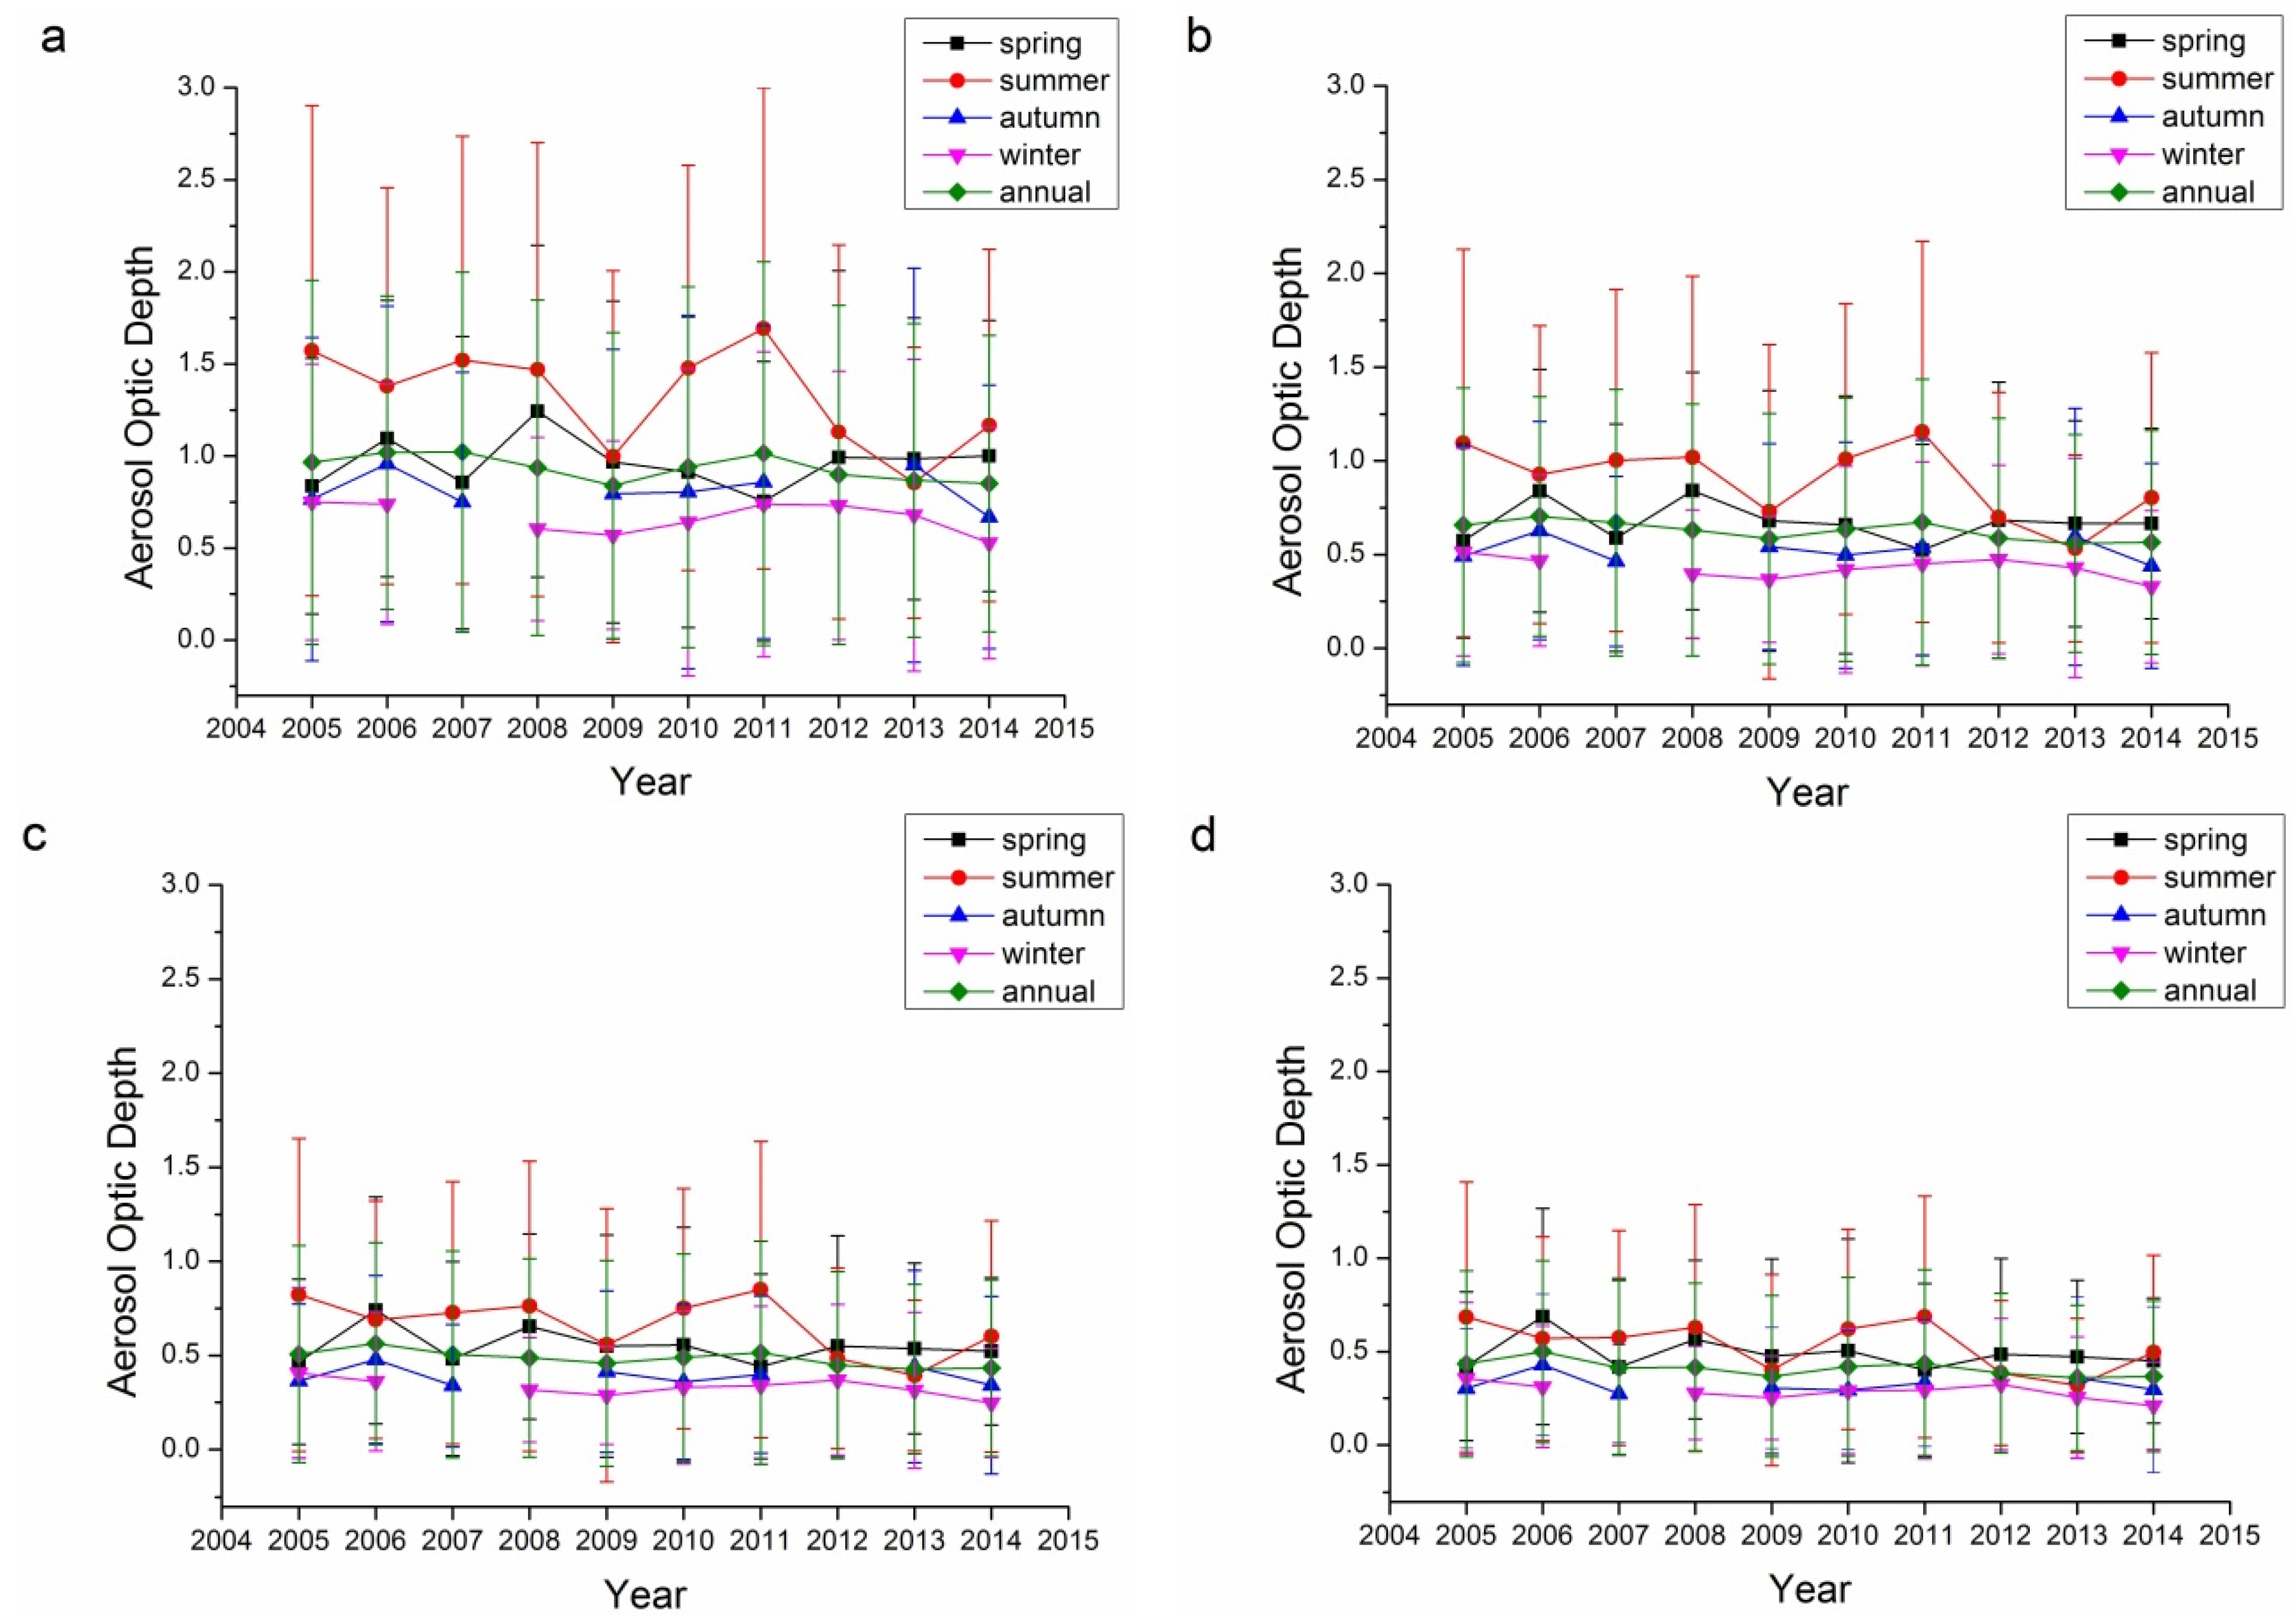
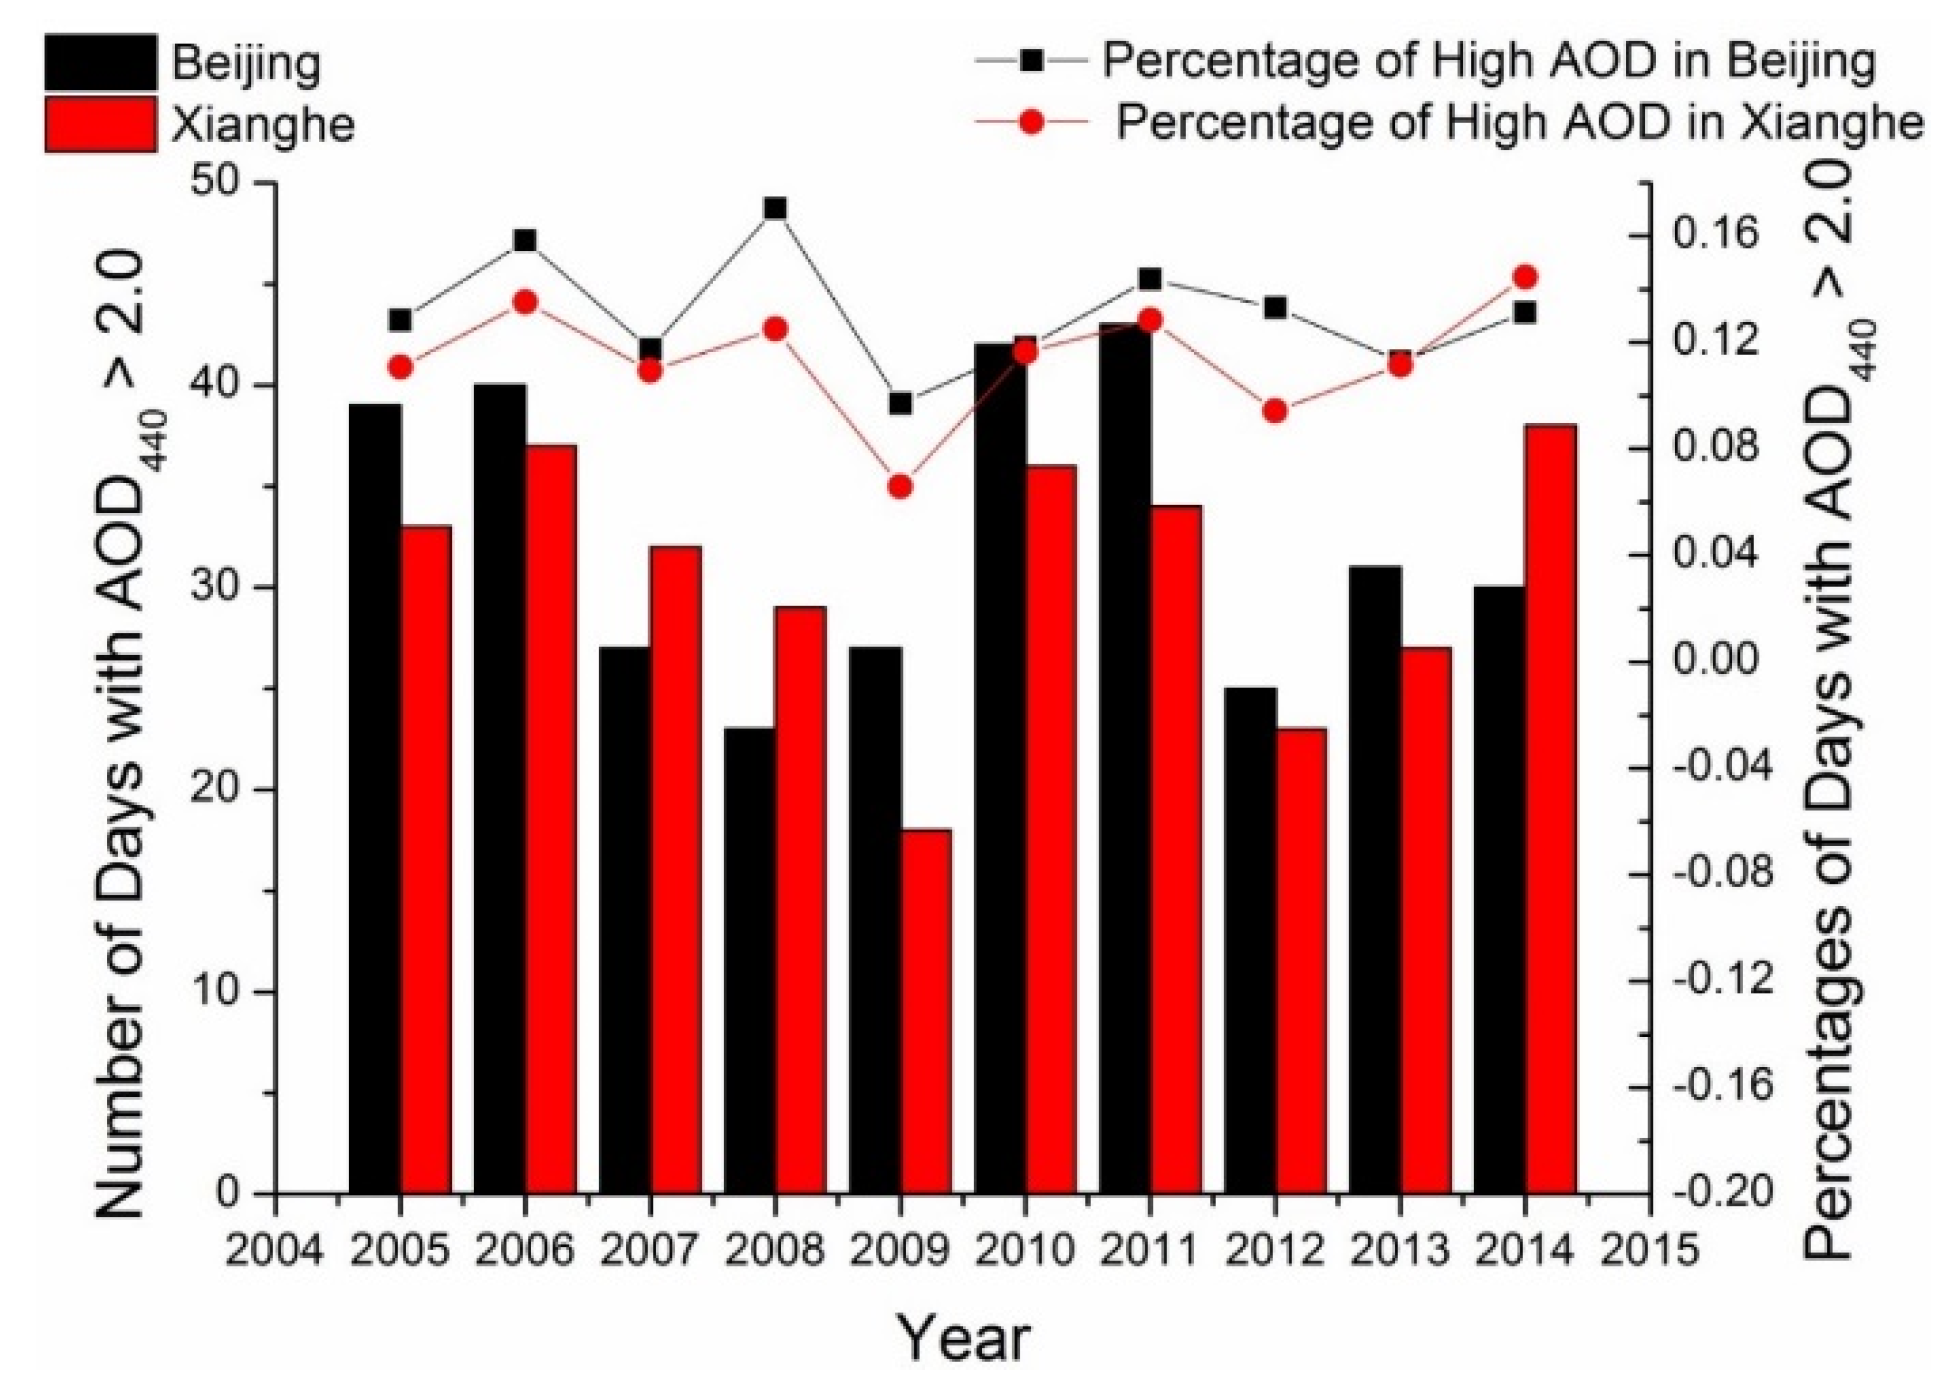
3.1. Aerosol Optic Depth (AOD) Trends
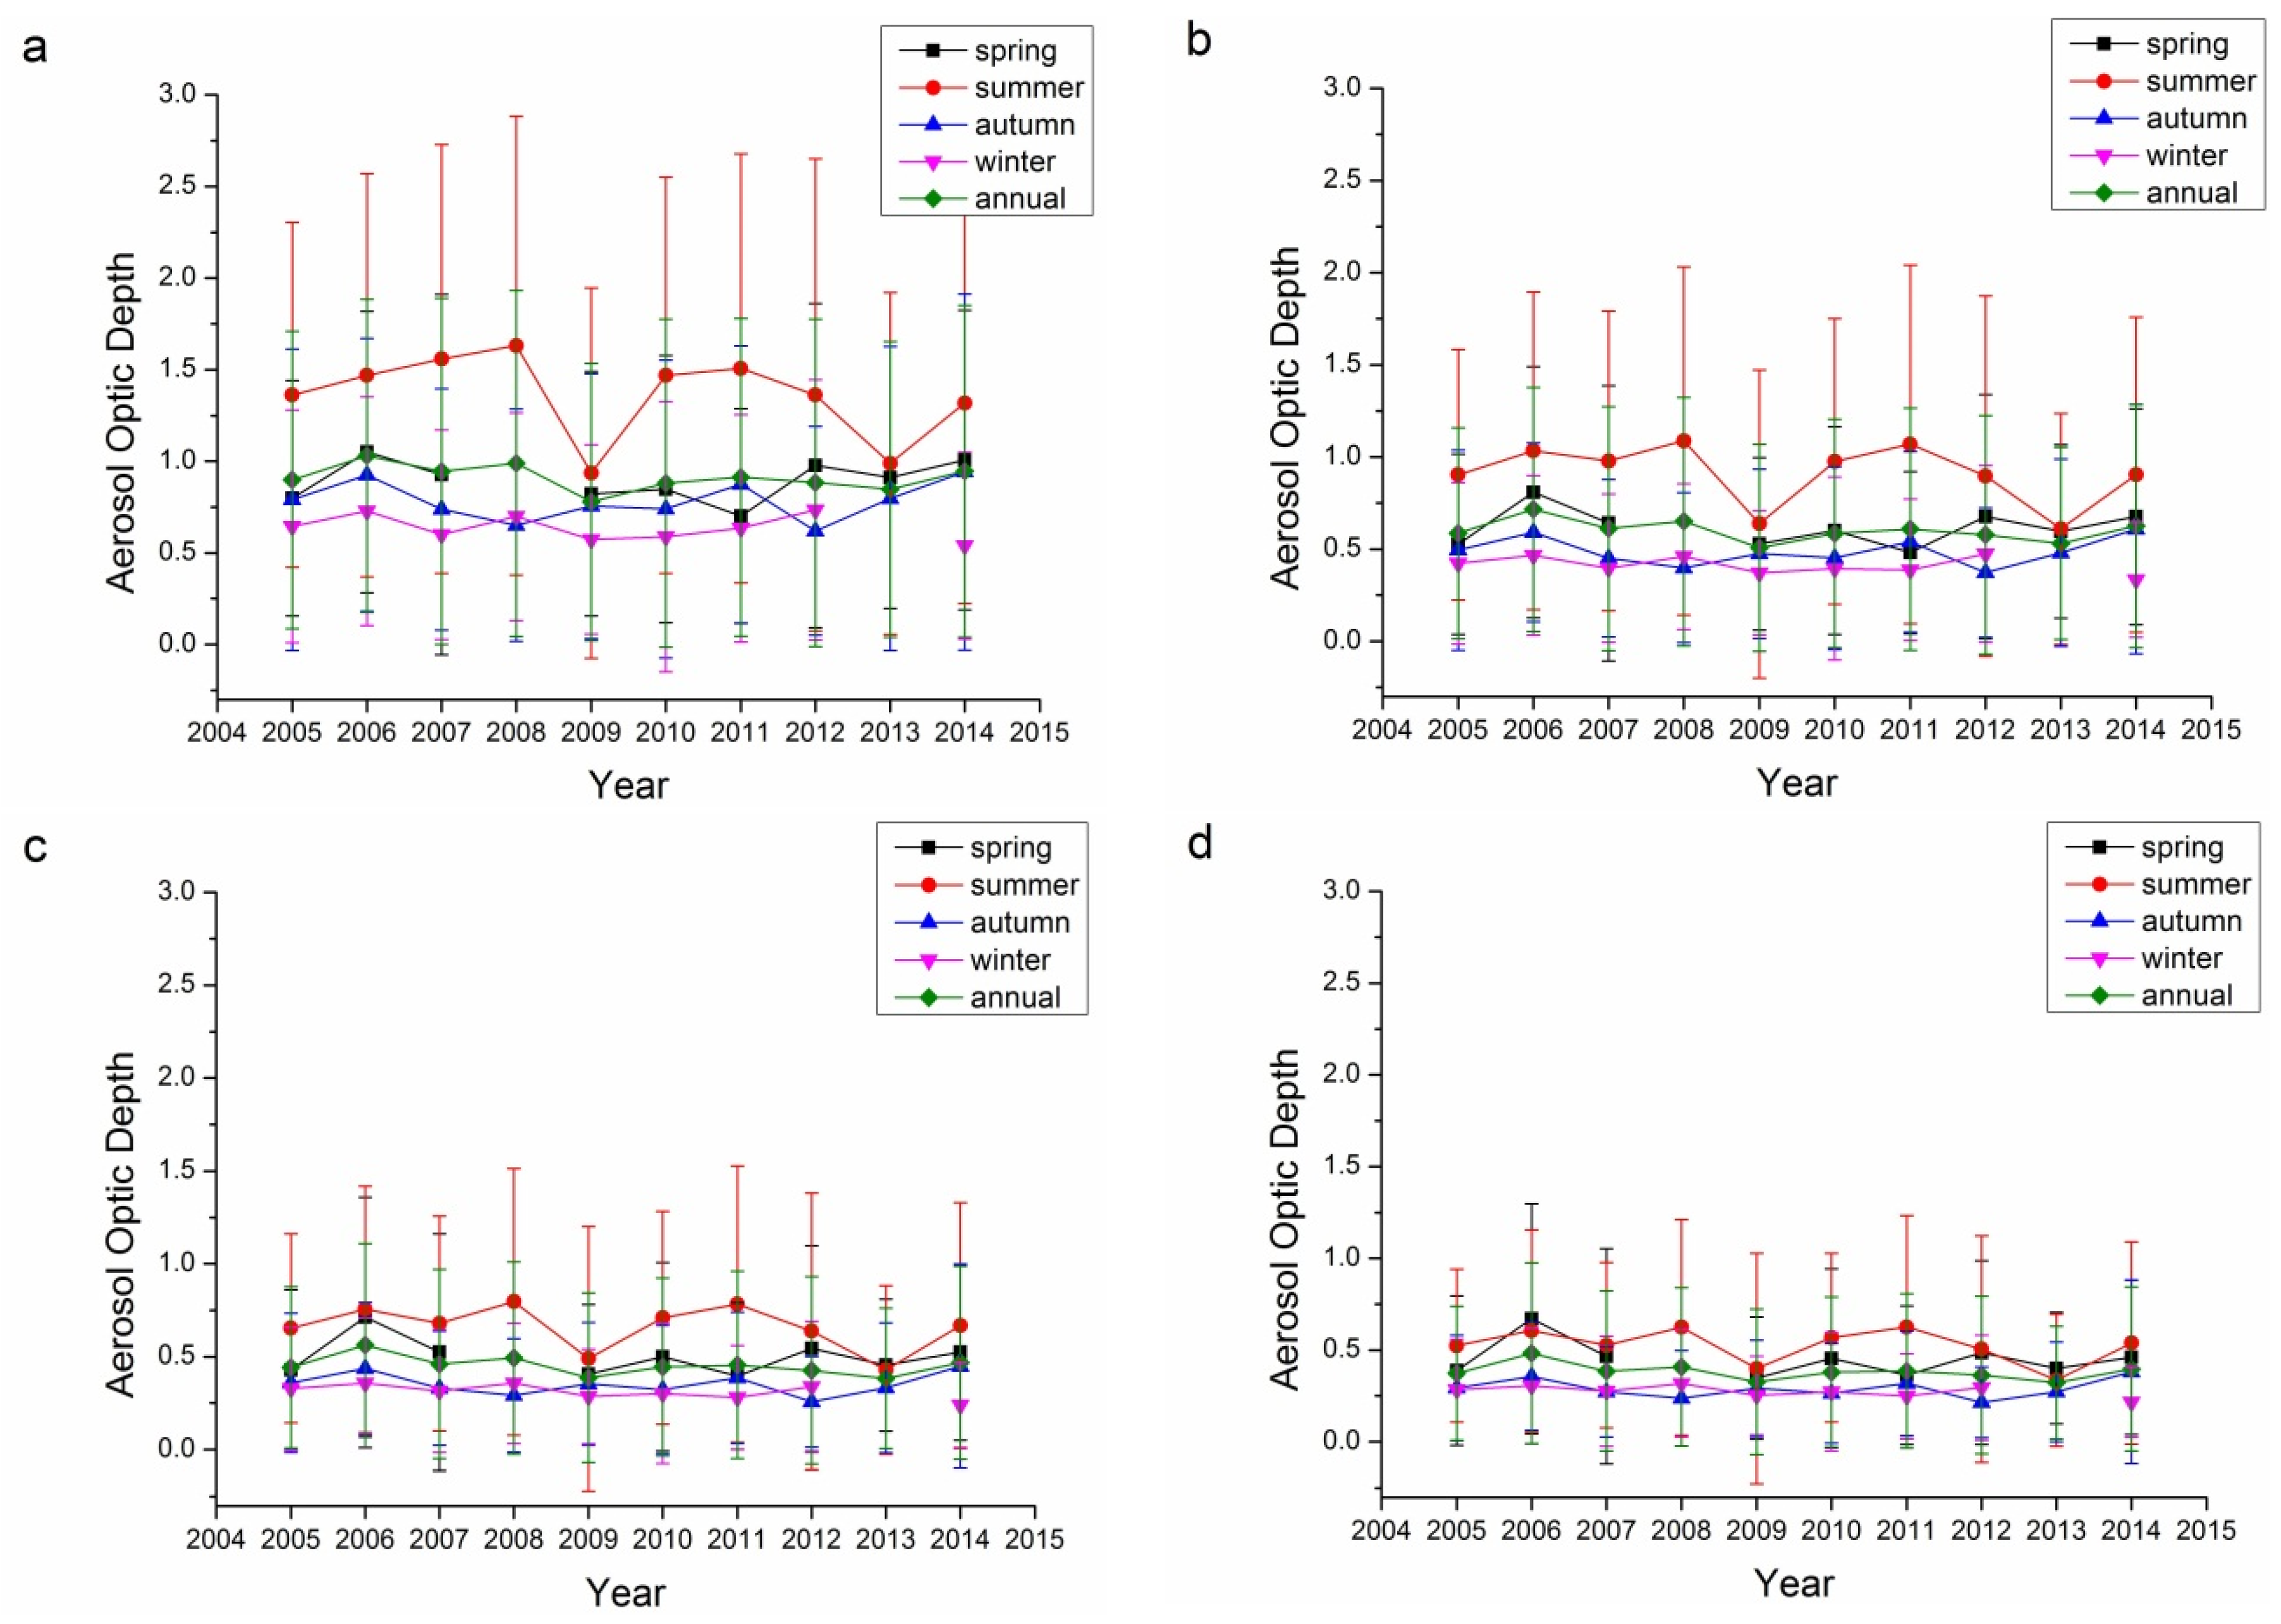
The AOD from 2005 to 2014 of Beijing and Xianghe sites in four bands (440 nm, 675 nm, 870 nm and 1020 nm) are shown in Figure 1 and Figure 2, respectively. For the Beijing site, the average AOD for 440 nm, 675 nm, 870 nm and 1020 nm in spring, summer, autumn, winter and annual average values are summarized in Table 3 and shown in Figure 1a. In intra-annual aspect, summer usually has the highest average AOD as reported in some previous studies [50,51,52], followed by spring, autumn and winter. The largest seasonal averaged AOD in 440 nm is 1.33 compared to previous report of 0.93 [53]. In inter-annual aspect, AOD decreased in the period from 2005 to 2009 (−0.034 per year, p < 0.10) and then increased in 2010 and 2011 (0.088 per year, p < 0.05), followed by a decrease from 2012 to 2014 (−0.052 per year, p < 0.05). The result is similar to that suggested in [54], which showed an AOD decrease in the range of 2007 to 2010 that might be caused by the efforts made by Chinese government for the preparation of Olympic Games in 2008. The decreasing trend is also shown in [55] with level 2.0 products. During these three periods, the AOD in summer varied most significantly while the variations in other seasons were less significantly.
For the Xianghe site, the average AOD for 440 nm, 675 nm, 870 nm, and 1020 nm in spring, summer, autumn, winter, and annual average values are summarized in Table 4 and shown in Figure 2a. The average AOD values for the Xianghe site were slightly lower than those for the Beijing site. The intra-annual variations at the Xianghe site were similar to those at the Beijing site. For inter-annual variations, there was no obvious AOD-decrease period before 2009 (−0.028 per year, r = 0.46, insignificant), and the average AOD in 2009 decreased sharply especially in summer, while the AOD in autumn did not decrease in 2009. The annual AOD increases slightly after 2009 (0.021 per year, p < 0.1).
In retrieval of aerosol optical properties, it is common to assume that aerosol consists of two components: fine mode and coarse mode aerosol, which are mainly distinguished by their particle sizes. For Beijing with various aerosol sources (local, coarse particles from the north and fine particles from the south), it is important to investigate the fine mode aerosol contribution to the total aerosol optic depth. Figure 3 shows the fine mode aerosol for the Beijing site from 2005 to 2014. In most years, summer has the largest fine mode AOD while the rest other seasons’ fine mode AODs are comparable. While considering fine mode fraction, almost all four seasons’ fine mode fractions were larger than 50%, even more than 70% for summer. These results suggested that the fine mode aerosol is the major component in the aerosol of Beijing area in all four seasons especially in summer. The trends at the Xianghe site as shown in Figure 4 are similar to those at the Beijing site with even larger fine mode fraction in this site; this suggests that the Xianghe site is more affected by fine mode aerosol (r = 0.952, p < 0.01).
Figure 1. Seasonal and annual variations in the aerosol optic depth at the Beijing site: (a) 440 nm; (b) 675 nm; (c) 870 nm; and (d) 1020 nm.
Remotesensing 08 00110 g001
Figure 2. Seasonal and annual variations in the aerosol optic depth at the Xianghe site: (a) 440 nm; (b) 675 nm; (c) 870 nm; and (d) 1020 nm.
Remotesensing 08 00110 g002
Figure 3. Fine mode aerosol fraction at the Beijing site.
Remotesensing 08 00110 g003
Figure 4. Fine mode aerosol fraction at the Xianghe site.
Remotesensing 08 00110 g004
Table 3. Average aerosol optic depth (AOD) measured by AERONET at the Beijing site *.
SeasonAverage AOD and Range for 440 nmAverage AOD and Range for 440 nmAverage AOD and Range for 440 nmAverage AOD and Range for 440 nm
Spring0.96 (0.75–1.24)0.67 (0.52–0.84)0.55 (0.44–0.74)0.49 (0.40–0.69)
Summer1.33 (0.85–1.69)0.90 (0.53–1.15)0.66 (0.39–0.85)0.54 (0.32–0.69)
Autumn0.82 (0.67–0.96)0.52 (0.44–0.63)0.39 (0.34–0.48)0.32 (0.27–0.43)
Winter0.66 (0.52–0.75)0.43 (0.33–0.51)0.33 (0.25–0.41)0.29 (0.21–0.36)
Annual0.93(0.84–1.02)0.63 (0.56–0.70)0.48 (0.43–0.56)0.41 (0.36–0.50)
* The range in the table is the maximum and minimum value of AOD.
Table 4. Average aerosol optic depth (AOD) measured by AERONET at the Xianghe Site *.
SeasonAverage AOD and Range for 440 nmAverage AOD and Range for 440 nmAverage AOD and Range for 440 nmAverage AOD and Range for 440 nm
Spring0.89 (0.70–1.05)0.61 (0.48–0.81)0.50 (0.40–0.72)0.45 (0.34–0.67)
Summer1.36 (0.94–1.63)0.91 (0.61–1.09)0.66 (0.43–0.80)0.52 (0.34–0.62)
Autumn0.78 (0.62–0.94)0.49 (0.37–0.61)0.35 (0.25–0.45)0.29 (0.21–0.38)
Winter0.63 (0.54–0.73)0.41 (0.33–0.47)0.31 (0.24–0.36)0.27 (0.22–0.32)
Annual0.91 (0.77–1.03)0.60 (0.51–0.72)0.45 (0.39–0.56)0.38 (0.32–0.48)
* The range in the table is the maximum and minimum value of AOD.

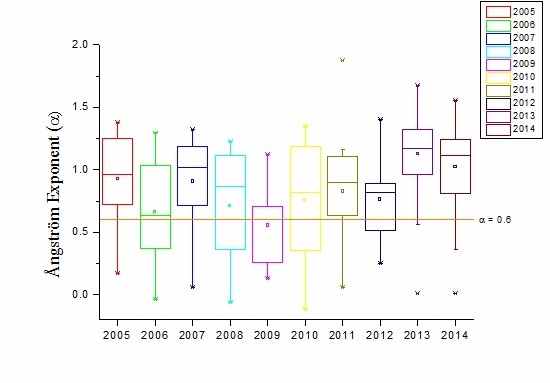
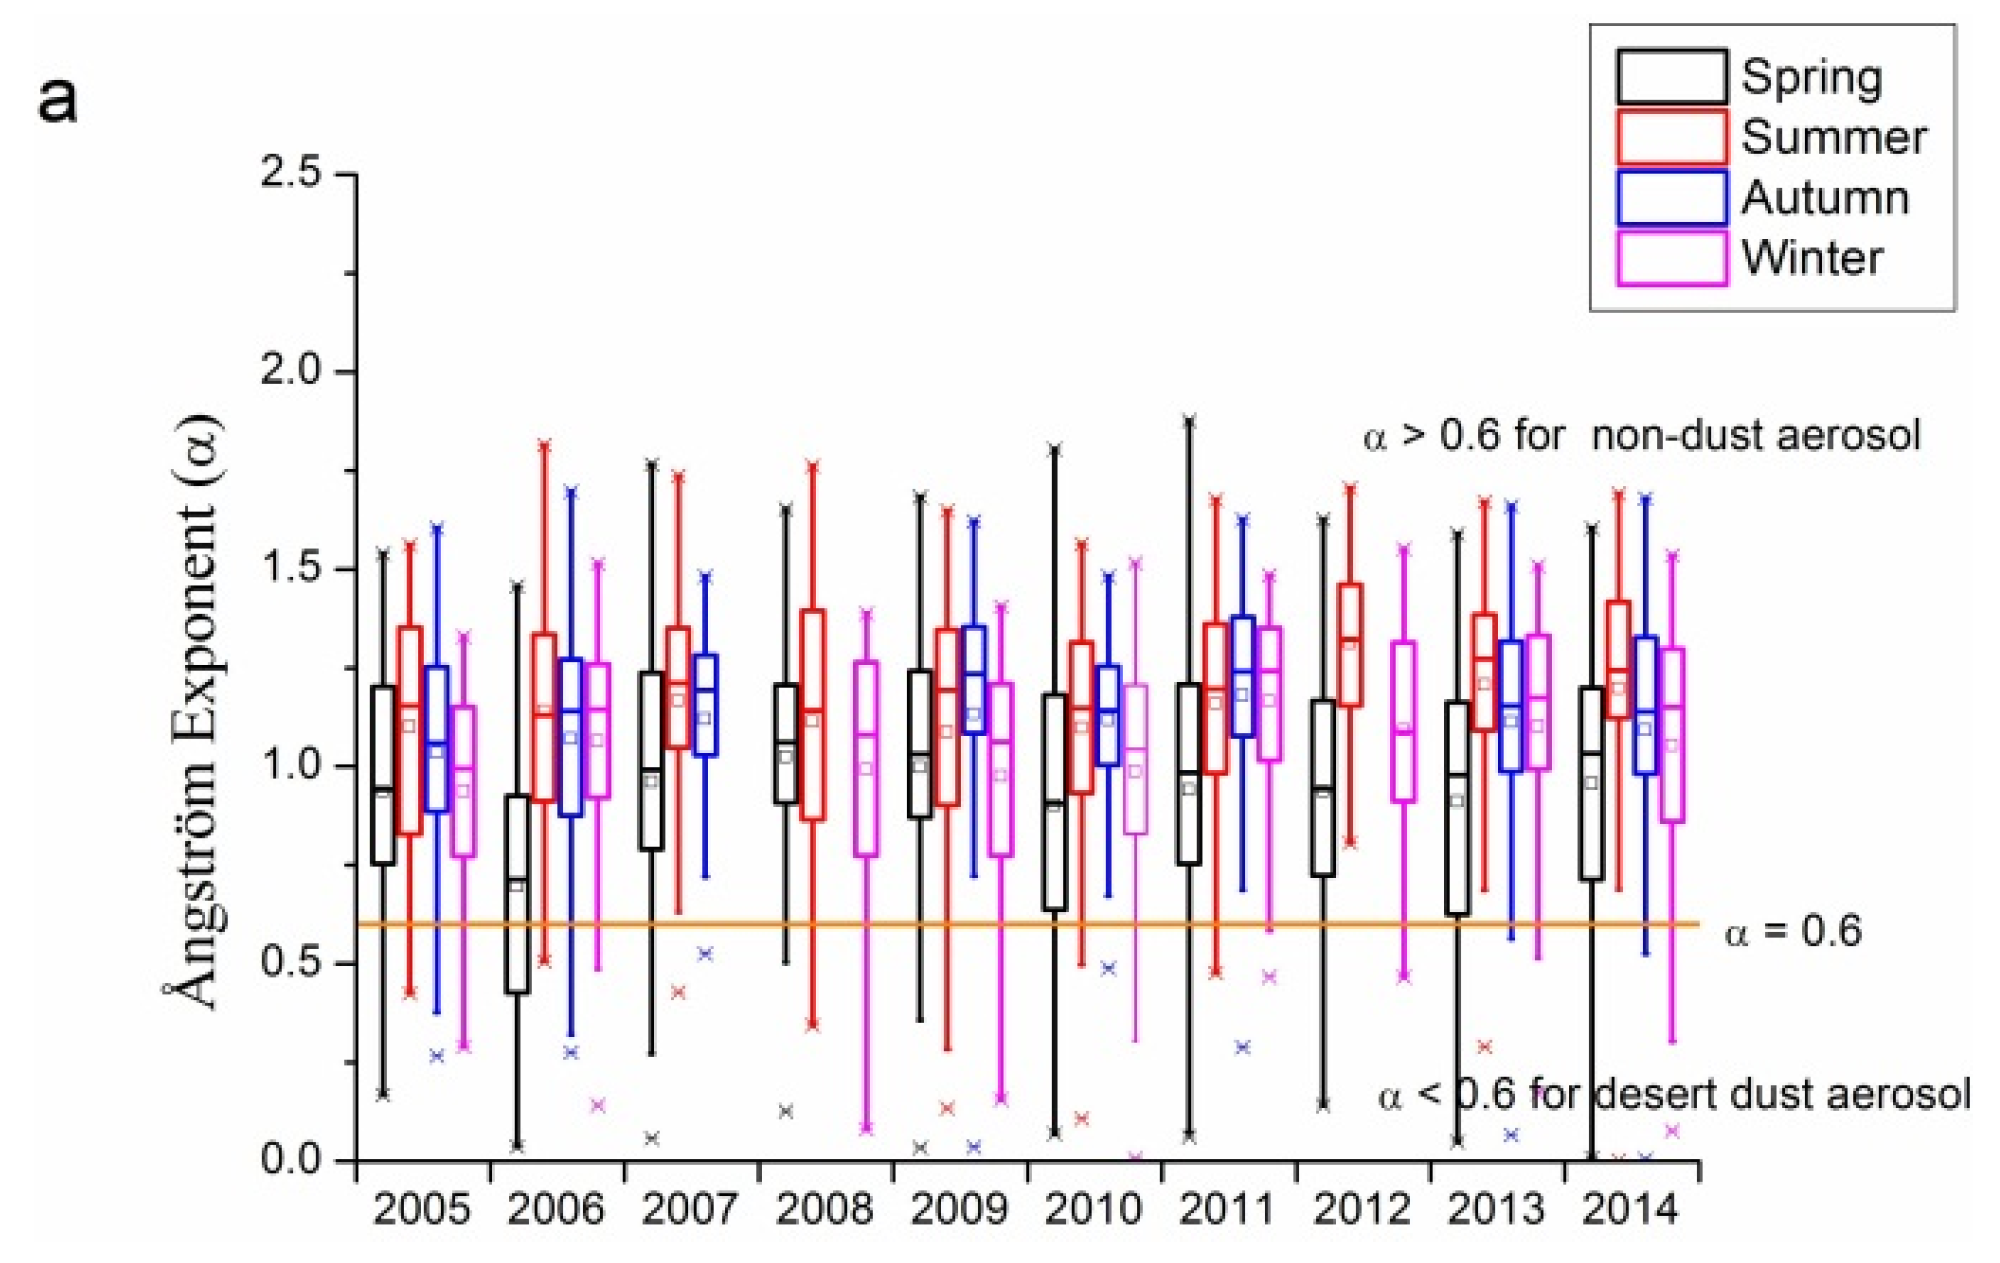
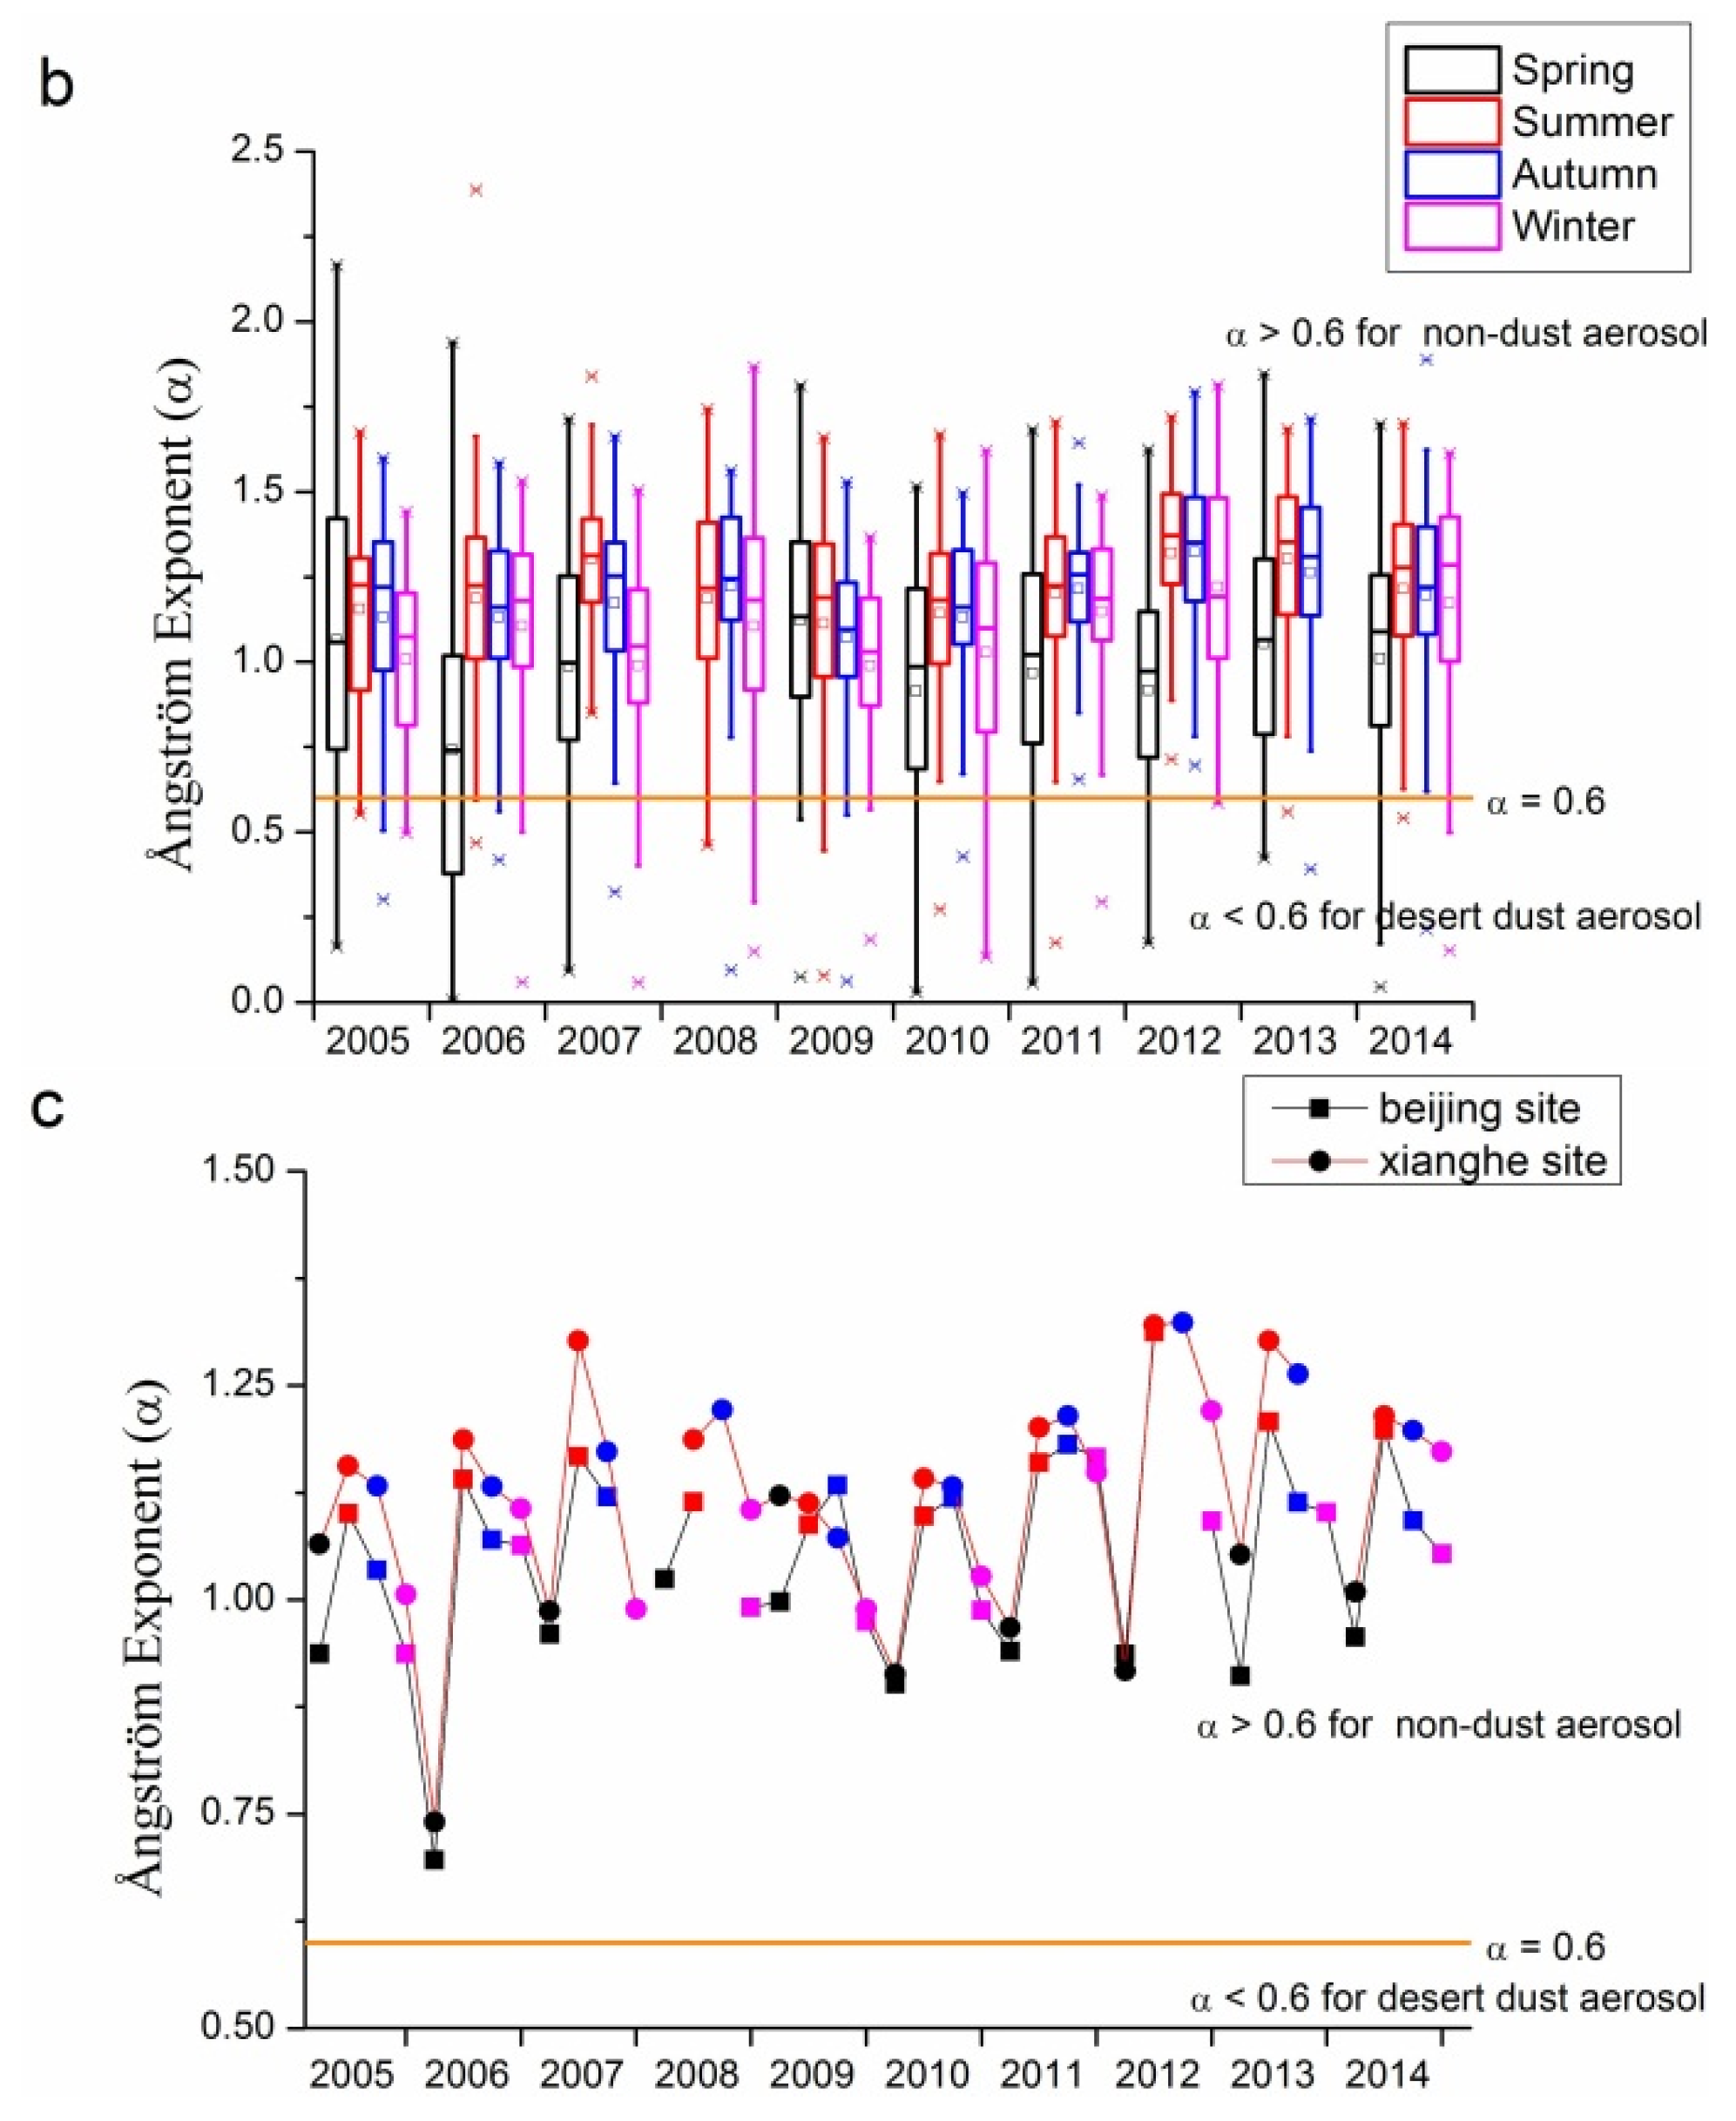
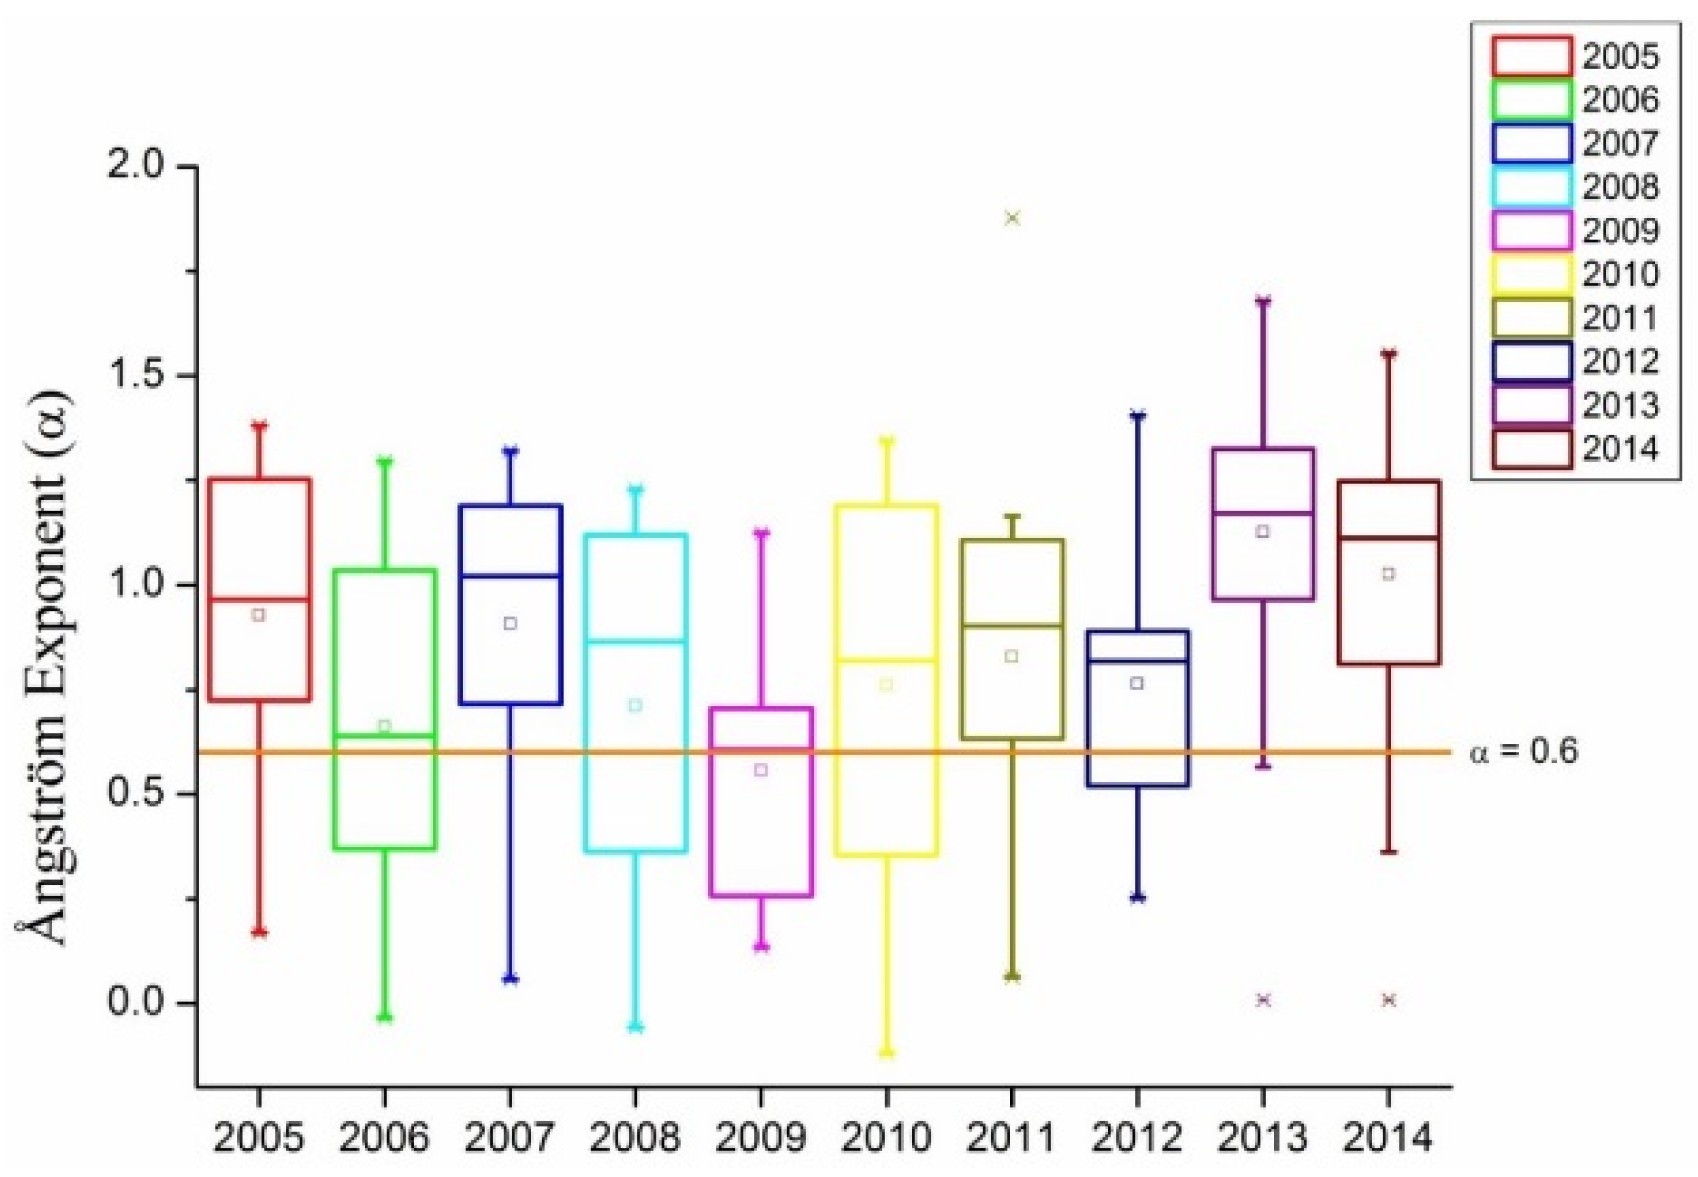
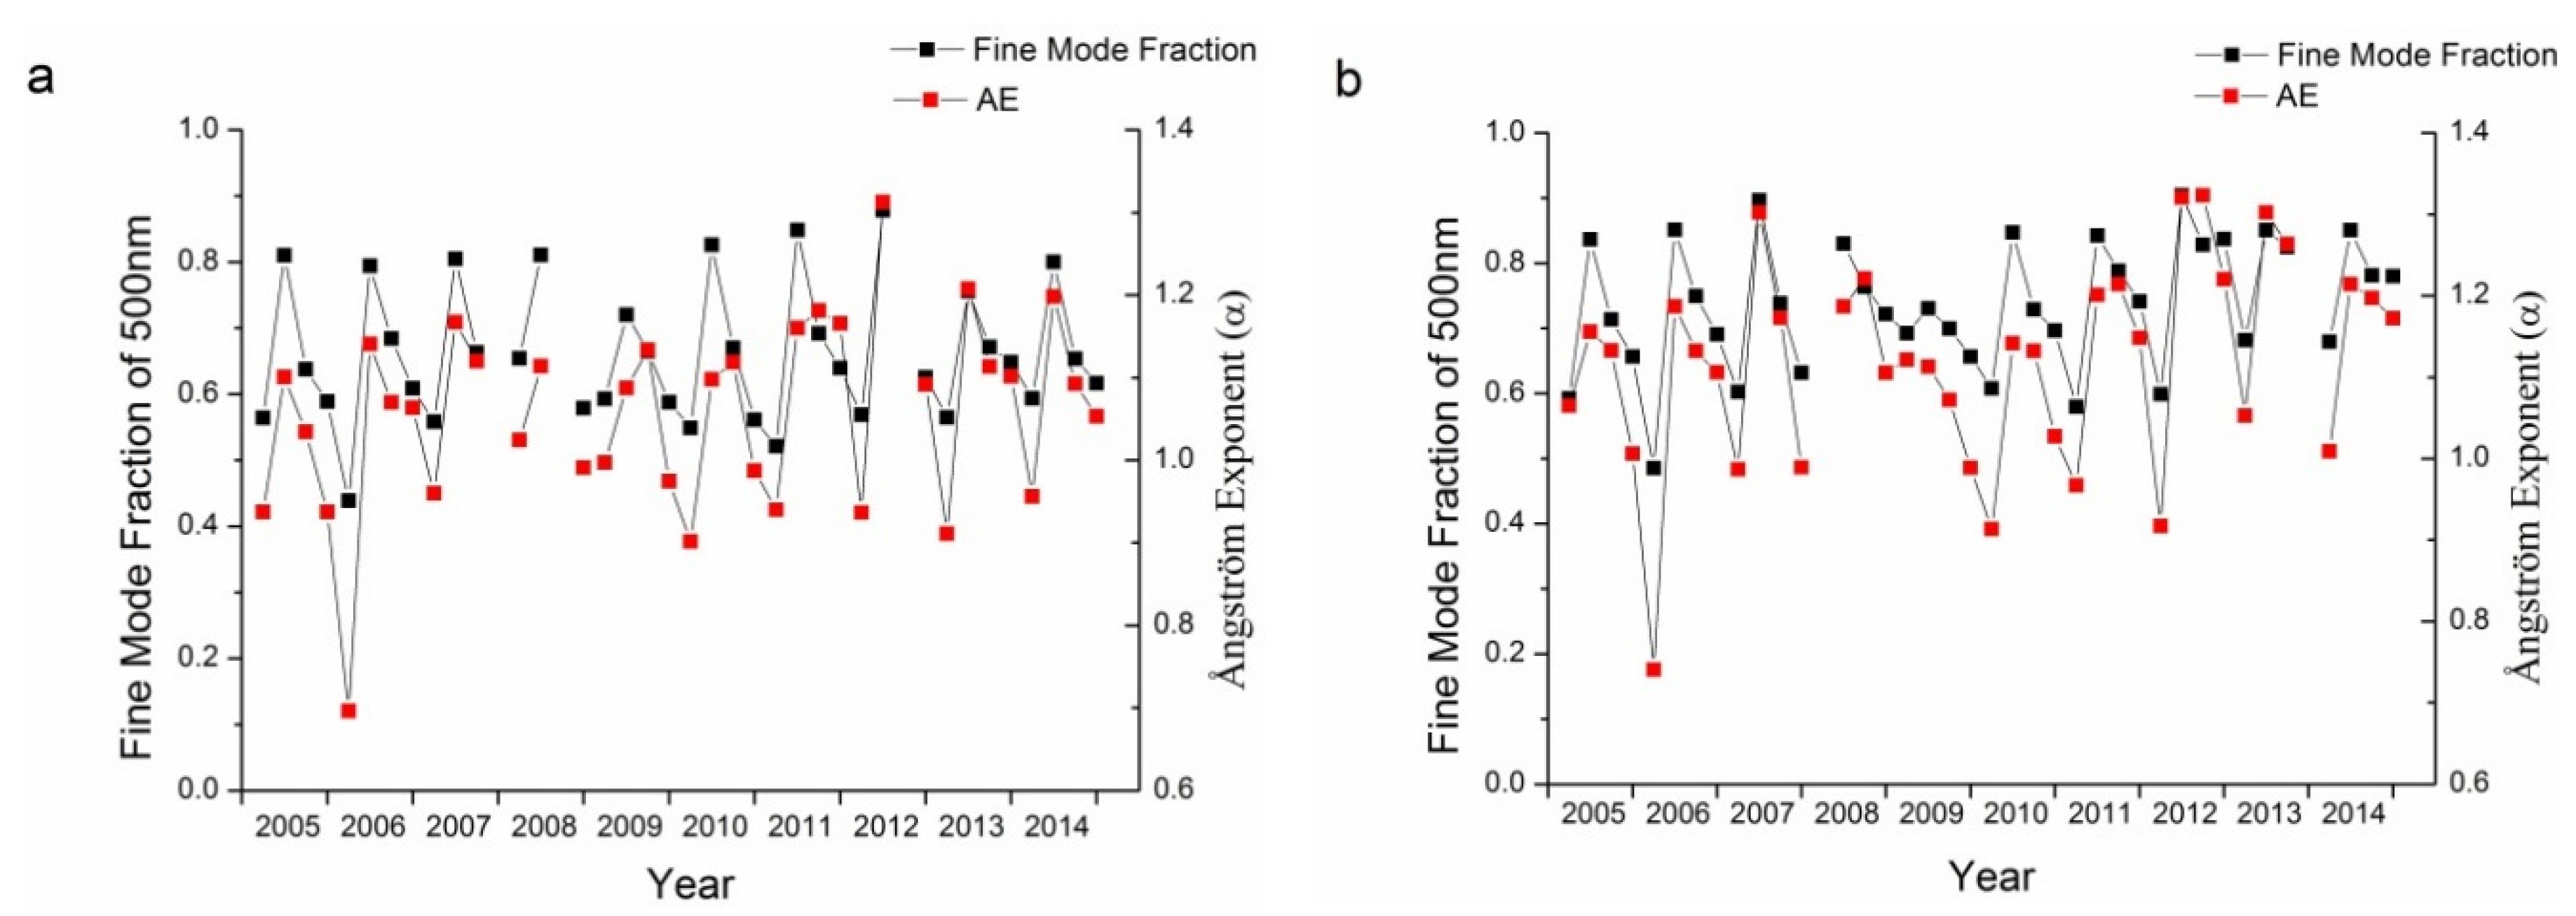
3.2. Ångström Exponent (α)

The Ångström exponent (α) is an aerosol optic parameter that is defined based on the spectral differences in AOD and wavelengths, as shown in Equation (1). In AERONET retrieval results, the Ångström exponent is calculated by two typical bands, while the most widely used Ångström exponent calculated is that computed using 440 and 870 nm. Furthermore, the AOD products in most remote sensing retrieval products, e.g., MODIS, and MISR are normalized to 550 nm, while most AERONET equipment does not include the 550 nm band. To effectively validate the satellite AOD products at 550 nm, α is used to interpolate the AOD for 550 nm for AERONET retrievals. α (675–440 nm) seems to be the best choice to interpolate, as the two bands are the two nearest bands of 550 nm. However, α (675–440 nm) is not stable enough to use in the analysis. Therefore, α (870–440 nm) is the most commonly used Ångström exponent in analysis recommended in many studies [19,56]. Besides particle size distribution with volume concentrations in 22 radius bins, which specifically show the coarse/fine aerosol distributions, α is another basic measure of the aerosol size distribution for simply and quickly recognizing dust aerosols: the smaller α is, the larger the size of aerosol particles is [57]. α is usually in the range of 0 to 2. Small α to around 0 usually means that the aerosol particles are mainly large with dust particles, while large α to around 2 means aerosol particles are mostly fine mode. α < 0.6 indicates the dust aerosol [17,50,56].
Figure 5 shows α for the Beijing and Xianghe sites from 2005 to 2014. Figure 5a,b demonstrate the inter- and intra-annual variations in α for these two sites. For both Beijing and Xianghe sites, more than 75% of α for nearly all seasons in each year except the spring of 2006 were larger than 0.6 (the orange line in the three sub-figures of Figure 5), with average values of around 1.0. Moreover, average α values have gradually increased from around 1.0 (1.1) in 2005 to 1.1 (1.2) in 2014 for the Beijing site (Xianghe site), suggesting that during the past 10 years, fine mode aerosol loading at both the Beijing and Xianghe sites has been increasing gradually. The Xianghe site is more likely to be affected by the sources in the Hebei province, and has more amount of fine mode aerosol than the Beijing site. In seasonal aspects, spring has obvious lower α , while the other seasons’ α are comparable under most circumstances at the Beijing site. For the Xianghe site, the situation is slightly different: spring usually has the lowest α , except in 2009. Unlike the Beijing site, α in the other three seasons at the Xianghe site are different: winters usually have a lower α than summer and autumn, whose α are comparable.
Typically, coarse mode aerosol has larger value of α. The reason for this is that as the wavelength increases, the extinction caused by both coarse and fine particles will change, and this is the basic principle for the dark target retrieval of MODIS AOD product by assuming the aerosol has nearly negligible effects on the extinction at 2.1 μm band [4,9,10]. Typically, through MIE simulation of specific size distribution and refractive indices, α can be obtained. Although α can be seen as one basic term for the particle size classification, it is sometimes not enough to use α to define the aerosol particles, as suggested in [58]. There is some overlap between the values of α for several typical aerosol types, such as dust, maritime, and biomass. Therefore, combining α and α difference might be a useful tool for aerosol classification. Therefore, to more accurately distinguish the properties of aerosol, the volume size distribution and fine mode fraction data might be useful.
Figure 5. Seasonal and annual variations in Ångström exponents at the Beijing and Xianghe sites from 2005 to 2014: (a) Beijing site; (b) Xianghe site; and (c) seasonal comparisons between Beijing and Xianghe sites. The orange lines in the three sub-figures represent α = 0.6, separating dust aerosol from other small particles. In (a) and (b), the small squares and lines inside the box are the mean and median values, respectively; the top and short lines of the box denote the upper quartile and lower quartile values, respectively; the top and bottom lines outside the boxes represent 1.5 interquartile range values; and the star signs outside the top and bottom lines are maximum and minimum values, respectively.
Remotesensing 08 00110 g005aRemotesensing 08 00110 g005b

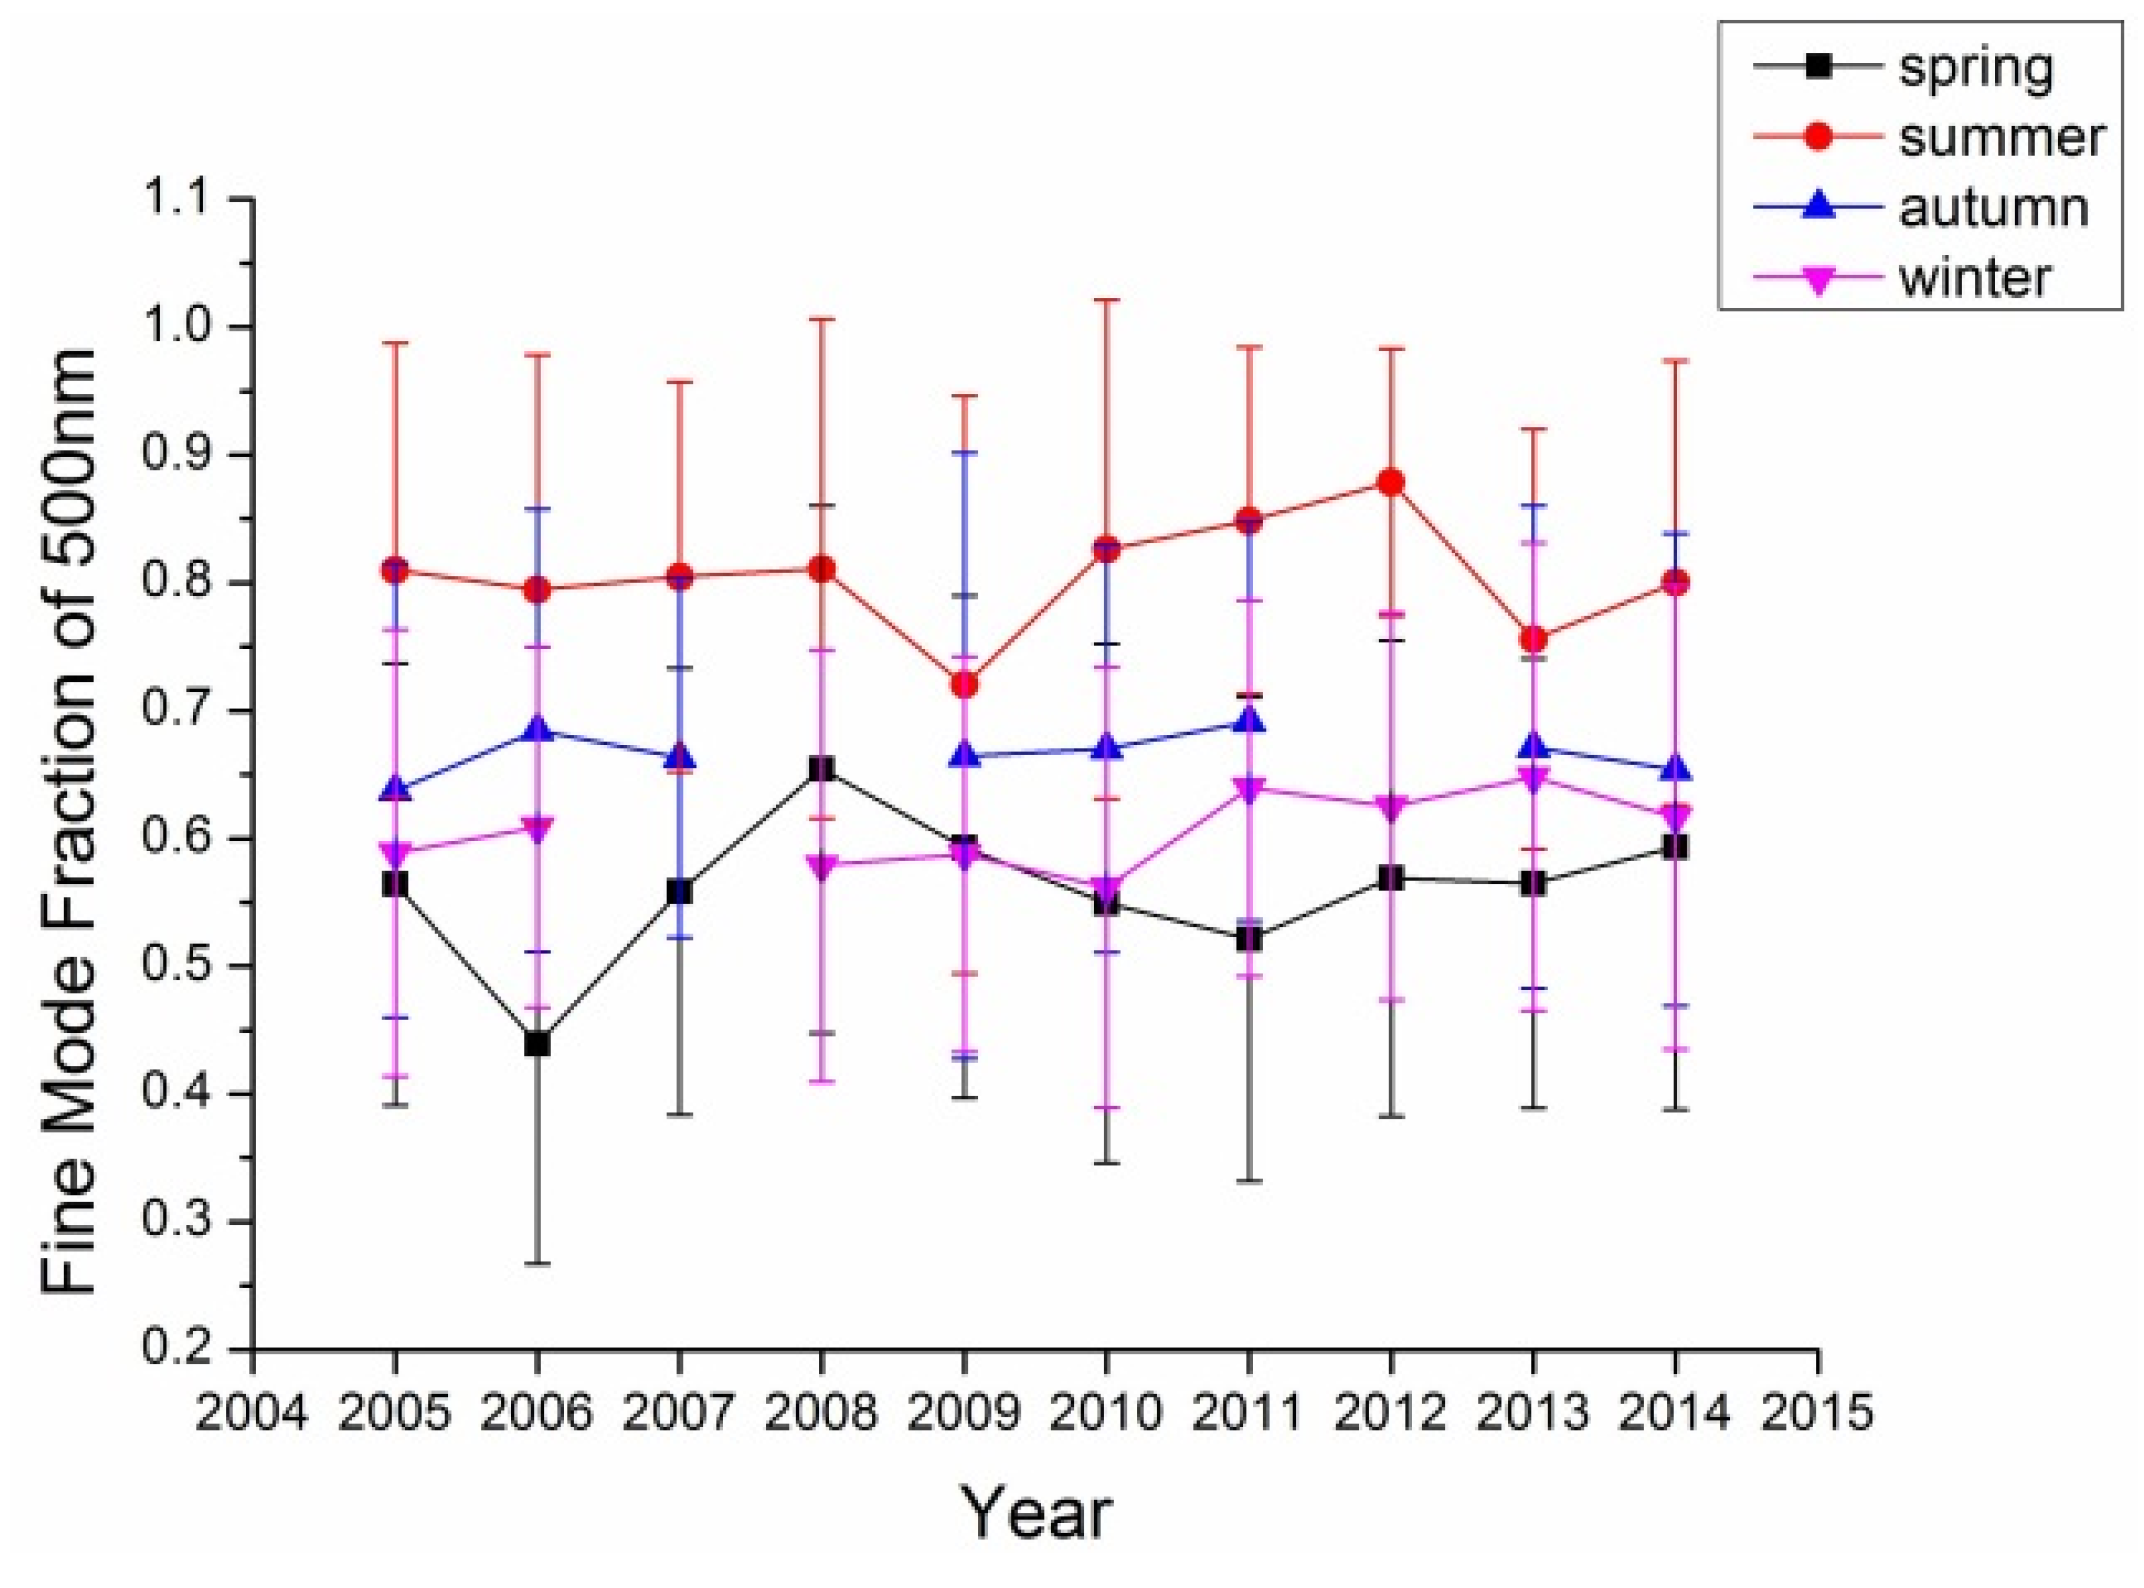
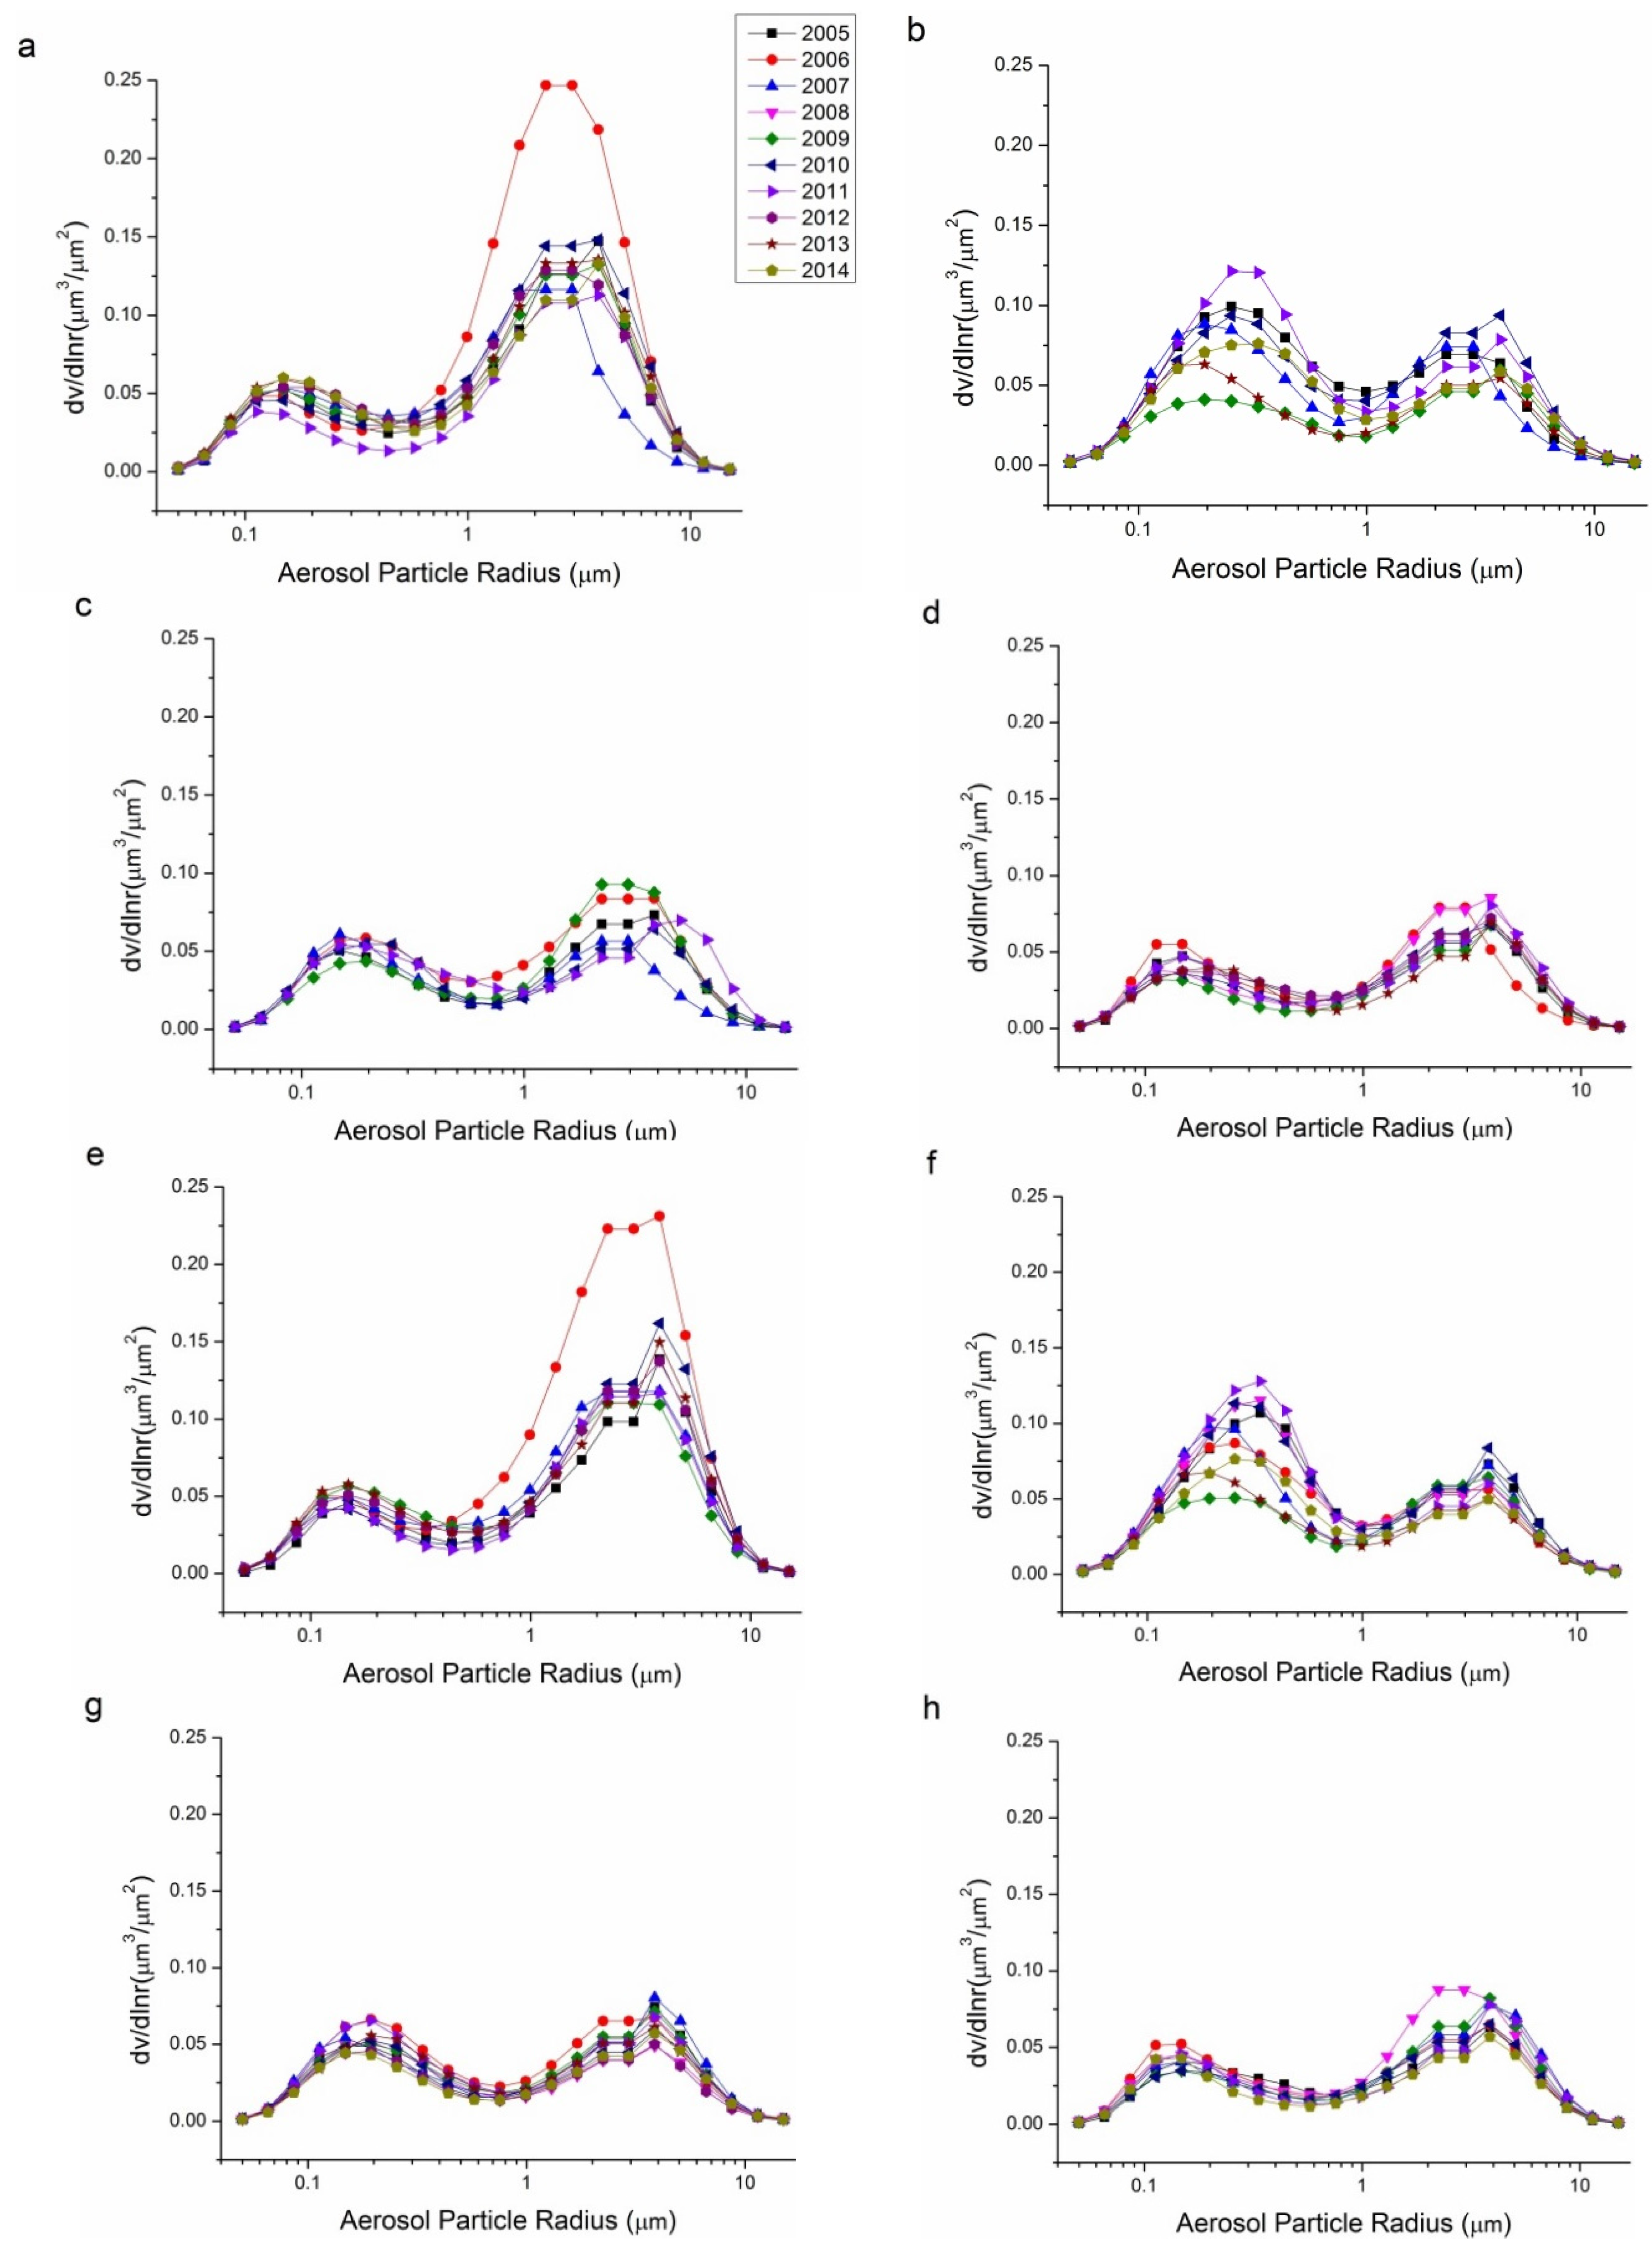
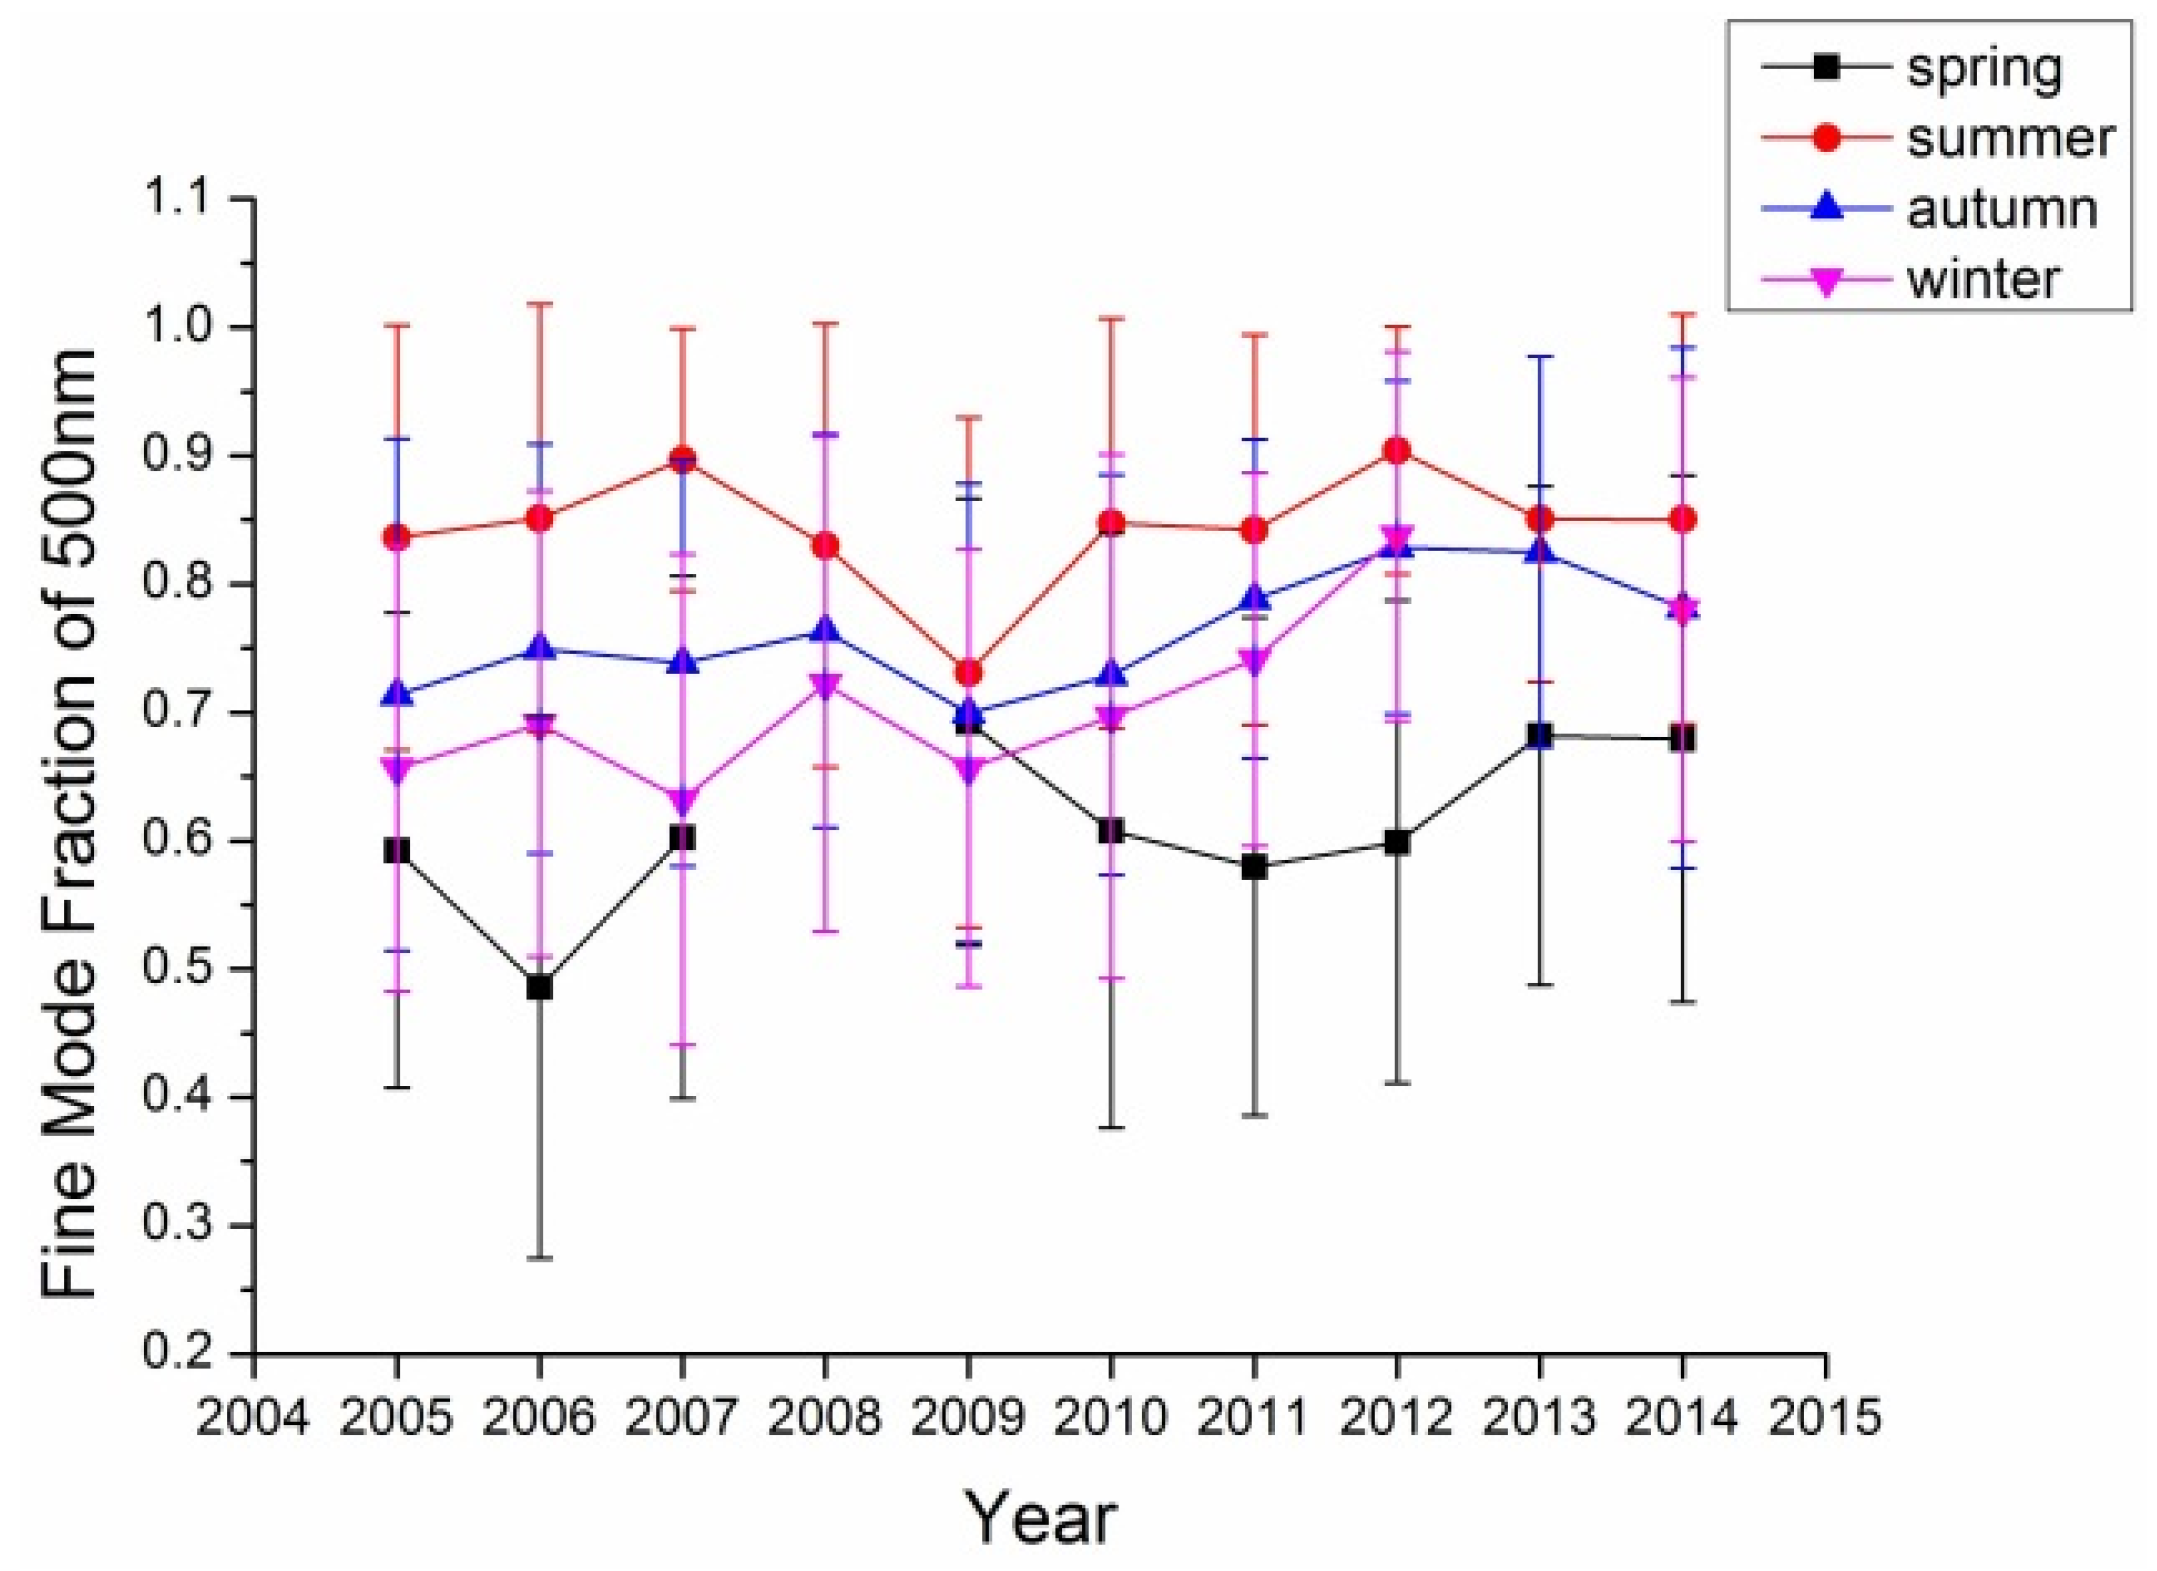
3.3. Volume Size Distribution

The retrieval of aerosol volume size distribution was conducted for certain situations (e.g., AOD440 > 0.05, solar zenith angle ≥ 45°, and sky residual < 5%). The retrieval of volume size distribution divided the aerosol particle ranges into 22 bins, from 0.05 to 15 μm, with direct and scattering signals of the 440, 675, 870, and 1020 nm bands. It is obvious that these bands’ signals are sensitive to those aerosol particles whose sizes are comparable to the wavelength. Therefore, for those aerosol particles whose radii are far larger or smaller than these four bands, the volume size distribution retrieval errors are much larger. In particular, for particle size ranges (0.1–7 μm) comparable to the four retrieval bands’ wavelengths, the retrieval errors do not exceed 10% at 7 μm and 35% at 0.1 μm. However, for the two edges (0.05–0.1 μm and 7–15 μm), the retrieval error may increase to 80%–100% [44]. Despite the high uncertainty of volume size distribution retrieval, it remains a powerful tool for the aerosol particle analysis in the optical remote sensing area.
Volume size distribution, demonstrated by dv / dlnr in 22 radius bins, is an effective tool to investigate the particle size distribution of aerosol particles. The seasonal variations in volume size distribution from 2005 to 2014 for the Beijing and Xianghe sites are shown in Figure 6. According to Table 1, seasonal retrievals with daily averages number less than 40 are neglected considering their representativeness, therefore, 10 seasonal data for the Beijing site and five seasonal data for the Xianghe site are removed from Figure 6. For both sites, spring showed the highest coarse mode aerosol volume concentrations, especially in 2006, which coincides with the data shown in Figure 5, wherein the Ångström exponents in the spring of 2006 were the lowest at around 0.6; this suggests that, in the spring 2006, dust particles were affected more severely than other years. The fine mode aerosol concentration is the highest in summer, with peak values that are nearly twice those of other seasons. Winter and autumn had similar coarse mode and fine mode aerosol peak dv / dlnr . The volume size distributions for both sites are consistent with the results suggested by the Ångström exponents. Spring seasons have the largest coarse mode aerosol similar to the research presented in [59,60].
Figure 6. Seasonal variations in the volume size distribution of aerosols for the Beijing and Xianghe Sites: (a) Beijing spring; (b) Beijing summer; (c) Beijing autumn; (d) Beijing winter; (e) Xianghe spring; (f) Xianghe summer; (g) Xianghe autumn; and (h) Xianghe winter.
Remotesensing 08 00110 g006

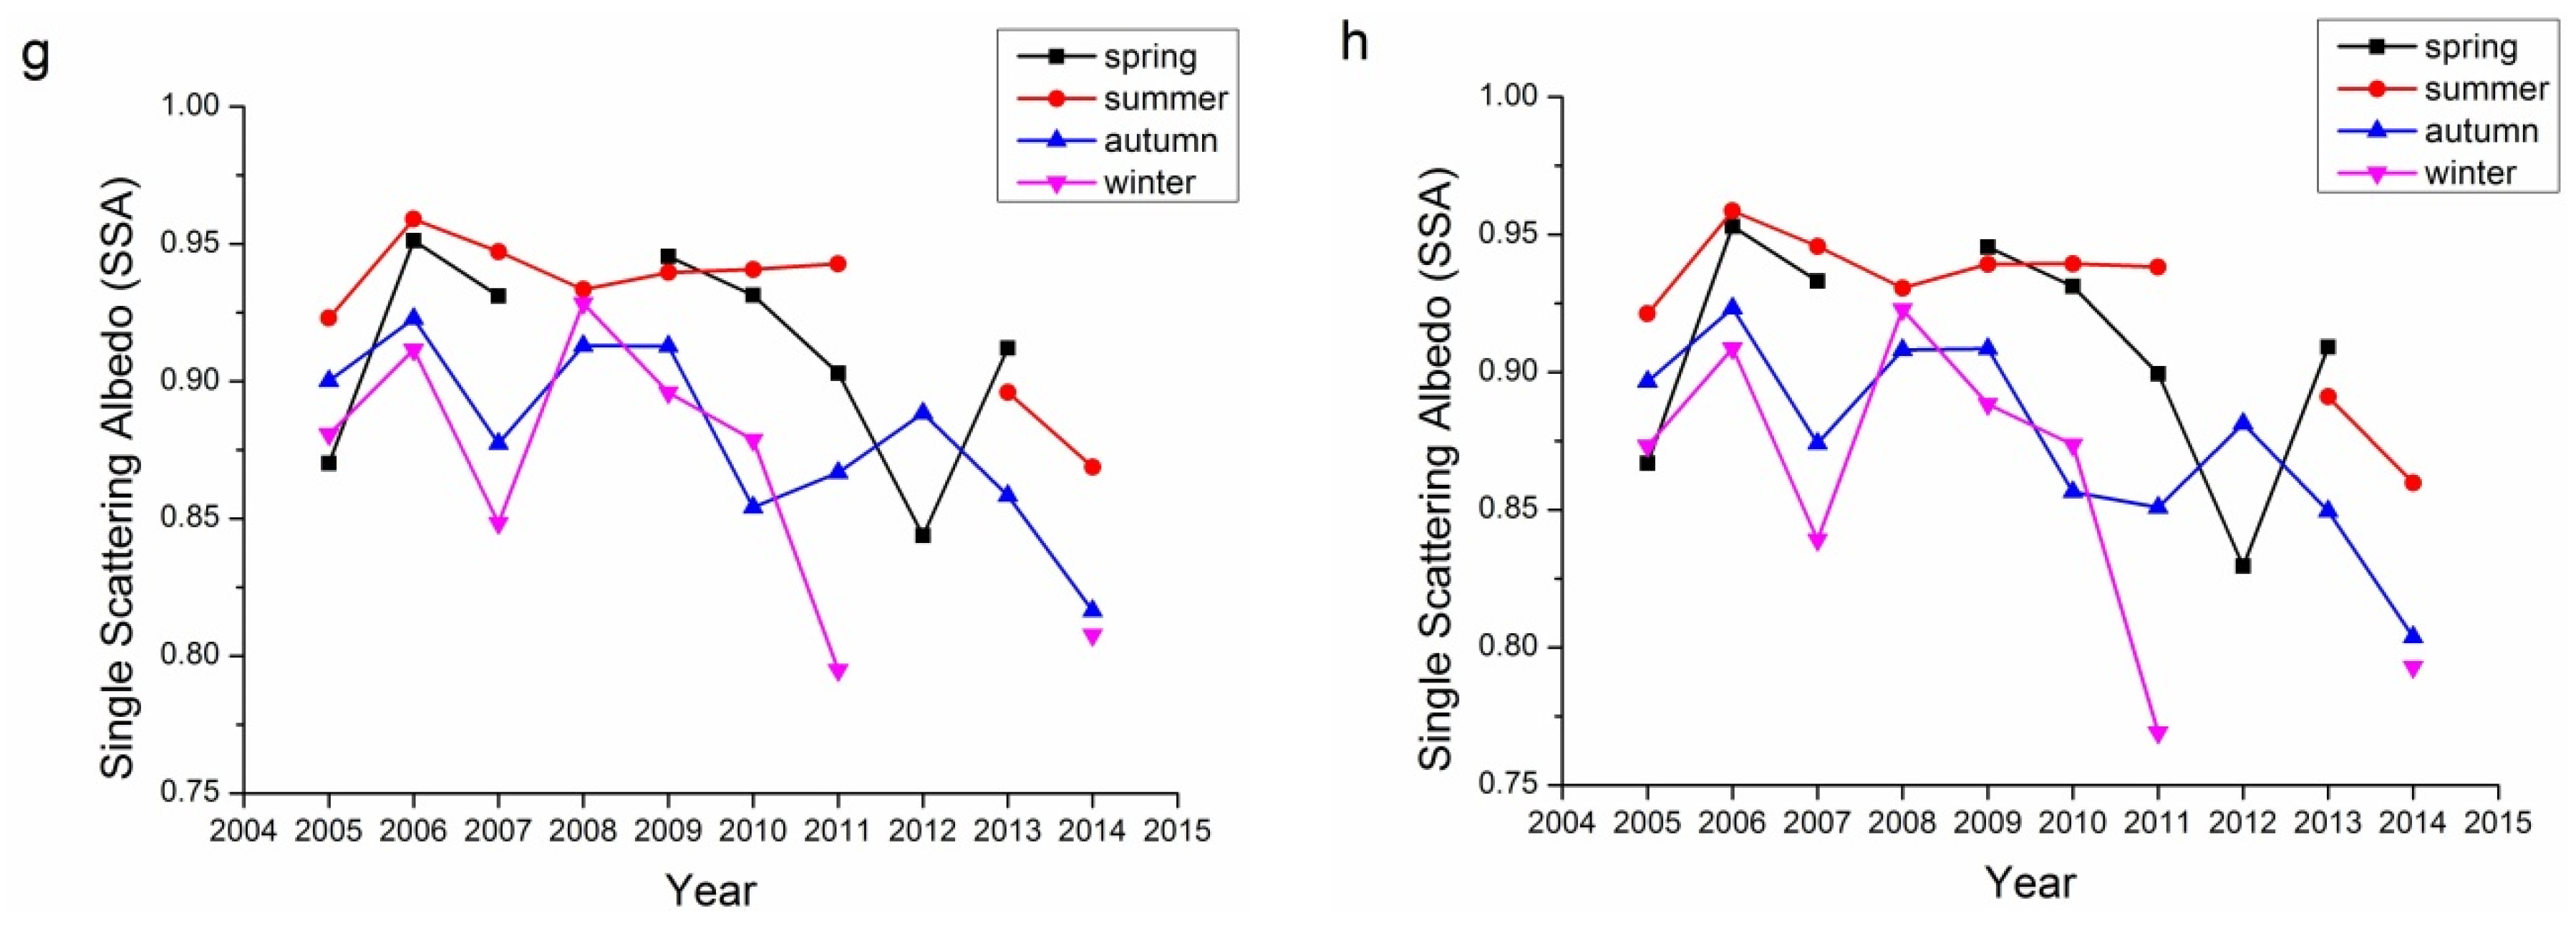
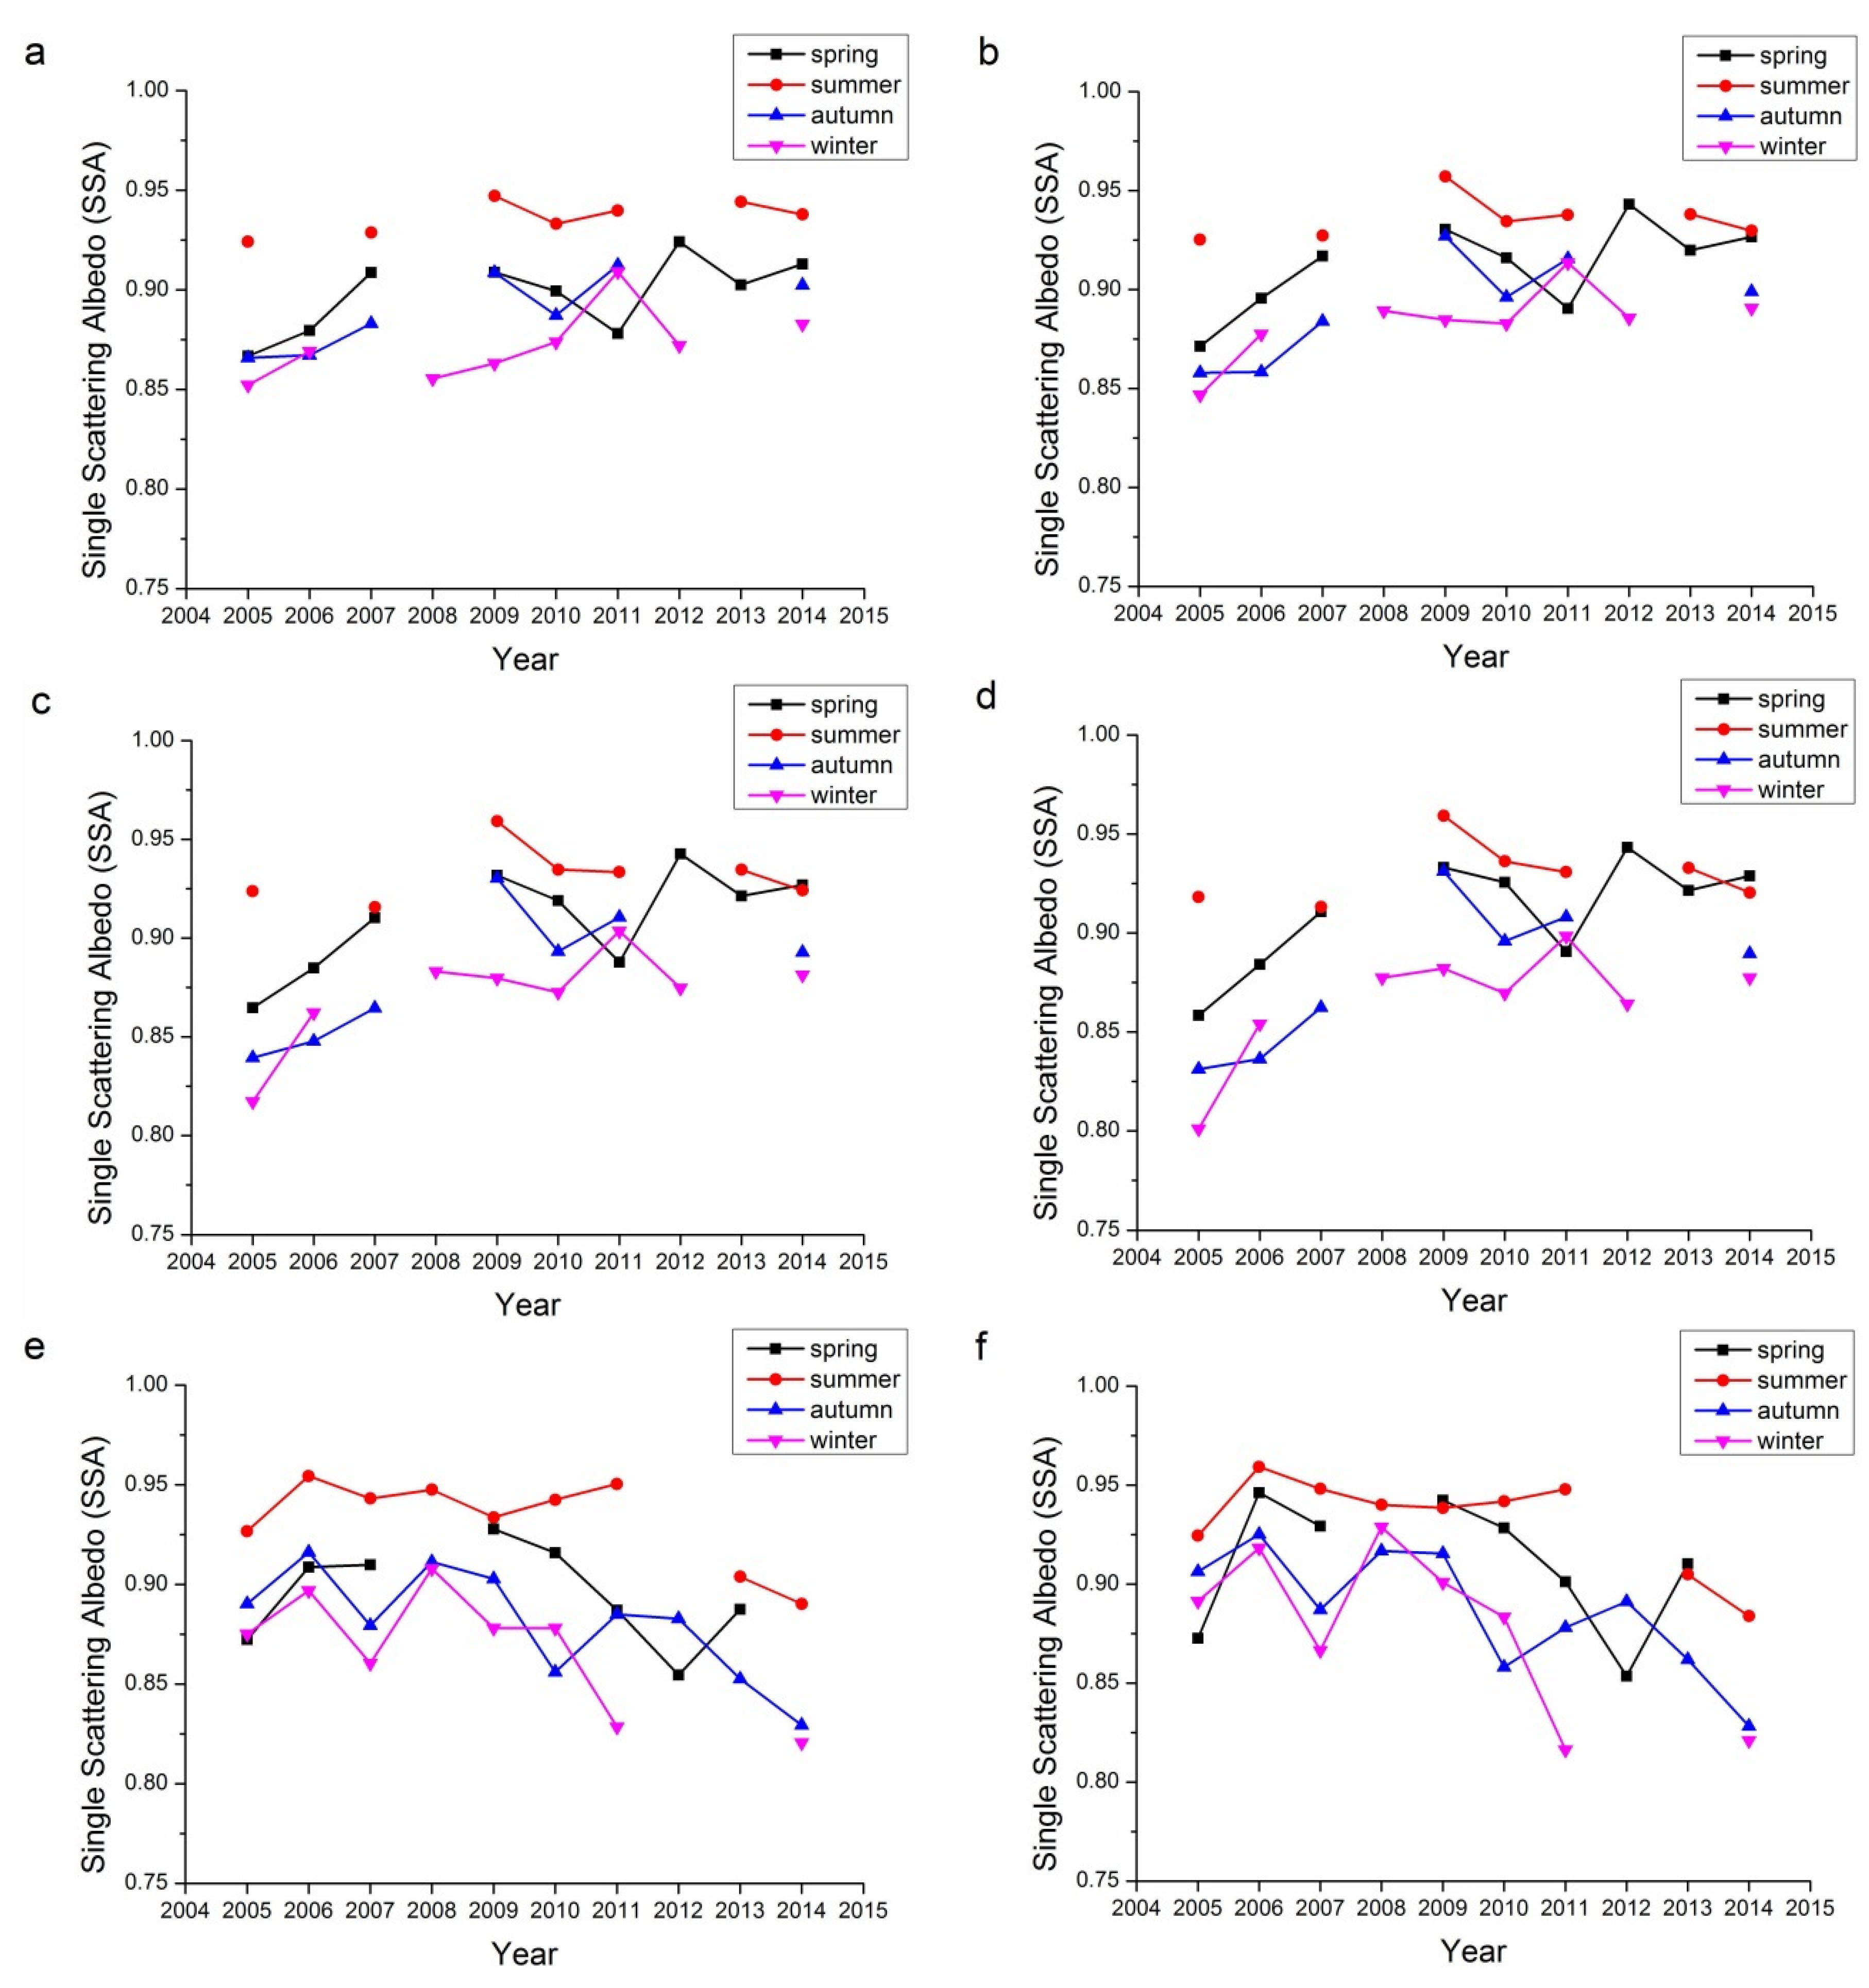
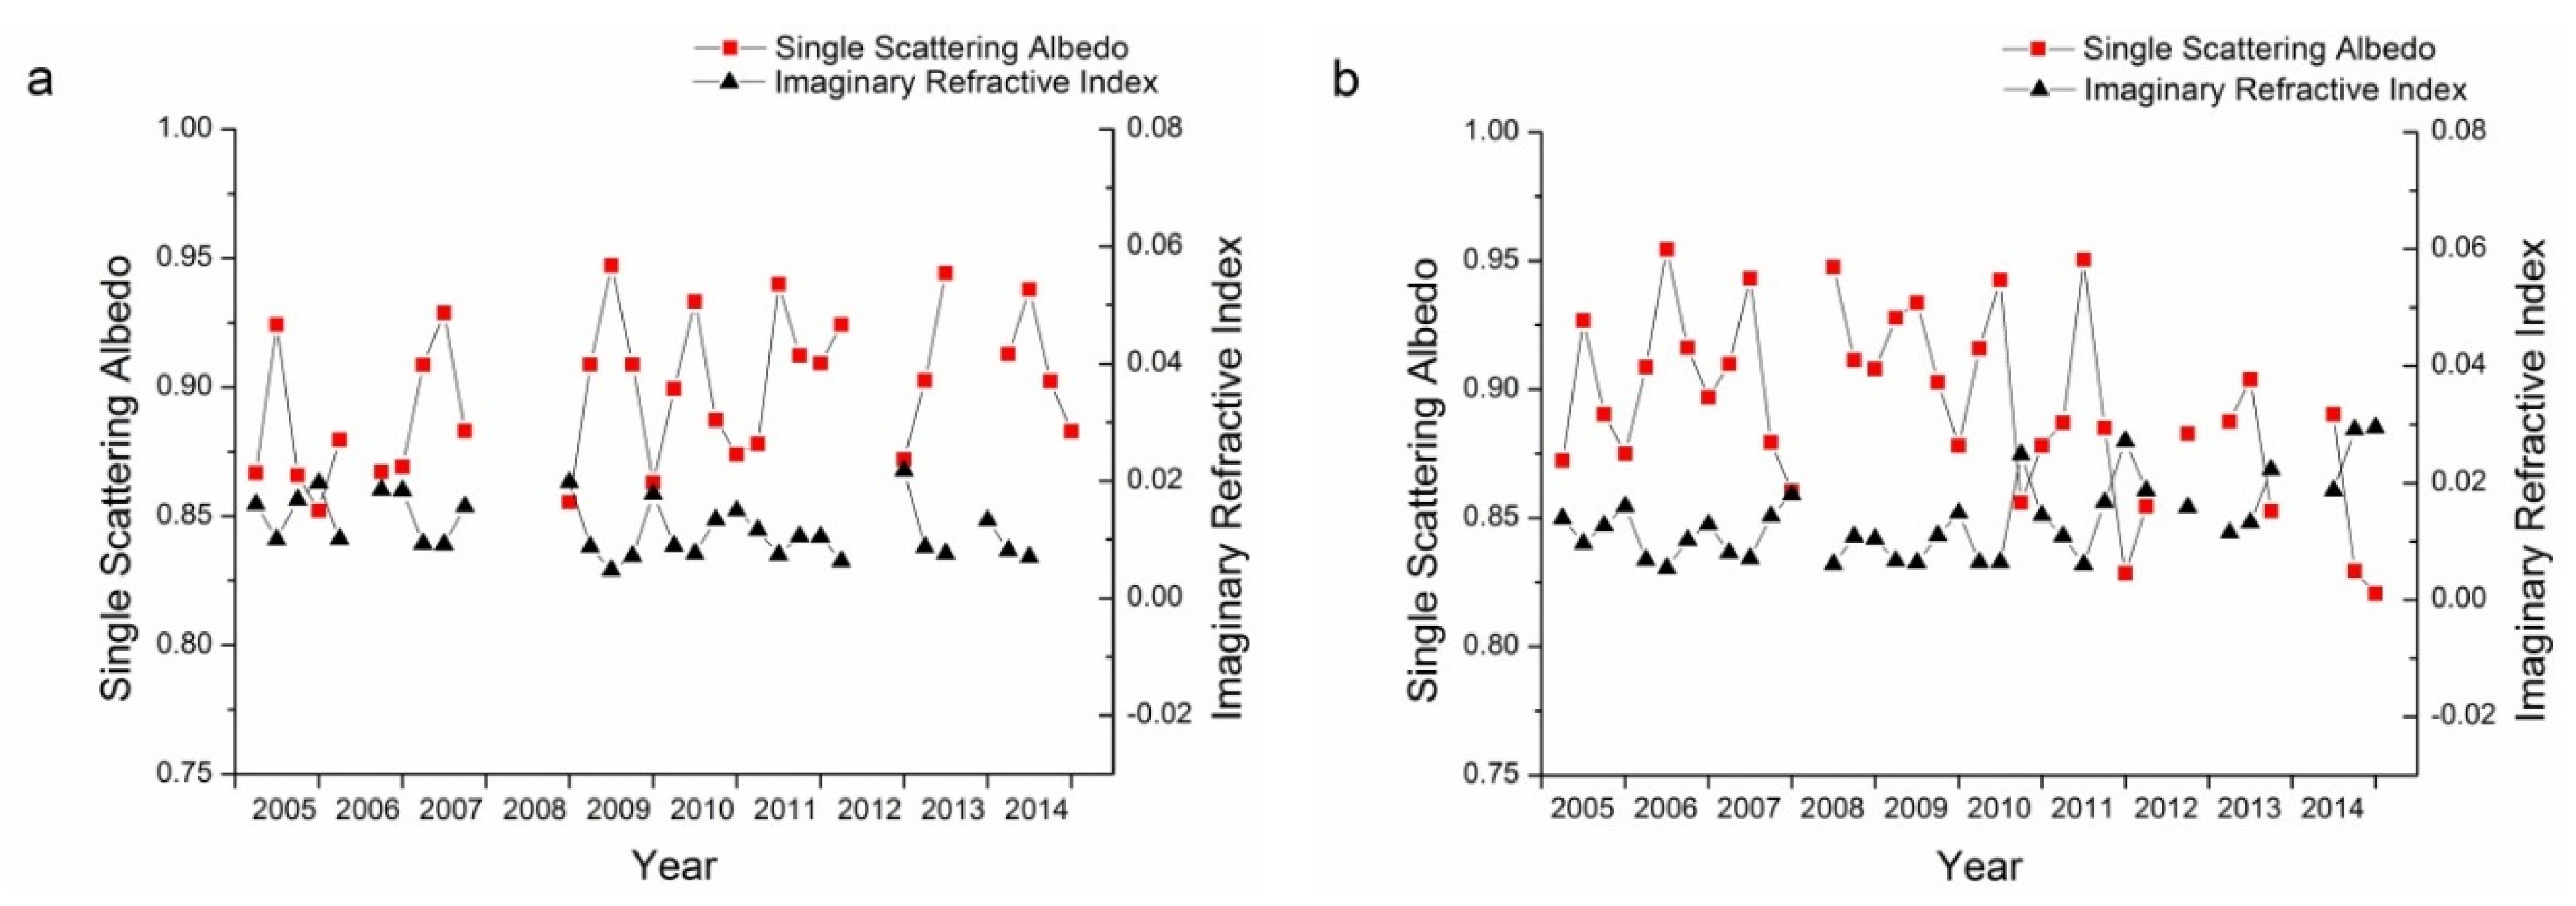
3.4. Single Scattering Albedo

SSA describes the absorbing characteristics of aerosol, with SSA ≈ 1.0 referring to totally non-absorbing aerosols and SSA ≈ 0.0 referring to totally absorbing aerosols. Actually, totally absorbing aerosols seldom exist and the SSA usually falls in the range of 0.7–1.0. There is no commonly accepted definition for the line separating absorbing and scattering aerosols. Figure 7 demonstrates the single albedos of the 440, 675, 870, and 1020 nm bands for both Beijing and Xianghe sites. According to Table 1, seasons with retrieval number less than 40 were not included in Figure 7 because of their representativeness. For both Beijing and Xianghe sites, the summers have the highest SSAs, while winters have the lowest. The SSAs of spring and autumn were comparable.
However, in contrast to the previous aerosol properties, the inter-annual variations in the SSAs for these two sites were different. The SSAs of Beijing have been increasing slowly from 2005 to 2014. By 2014, the SSAs of the Beijing site for four bands were all around 0.9. The trends at the Xianghe site were different, as the SSAs of Xianghe decreased from around 0.9 to around 0.85. These results suggest that the absorbing characteristics in these two sites are different.
Figure 7. Seasonal variations in SSA for the Beijing and Xianghe Sites: (a) 440 nm Beijing; (b) 675 nm Beijing; (c) 870 nm Beijing; (d) 1020 nm Beijing; (e) 440 nm Xianghe; (f) 675 nm Xianghe; (g) 870 nm Xianghe; and (h) 1020 nm Xianghe.
Remotesensing 08 00110 g007aRemotesensing 08 00110 g007b

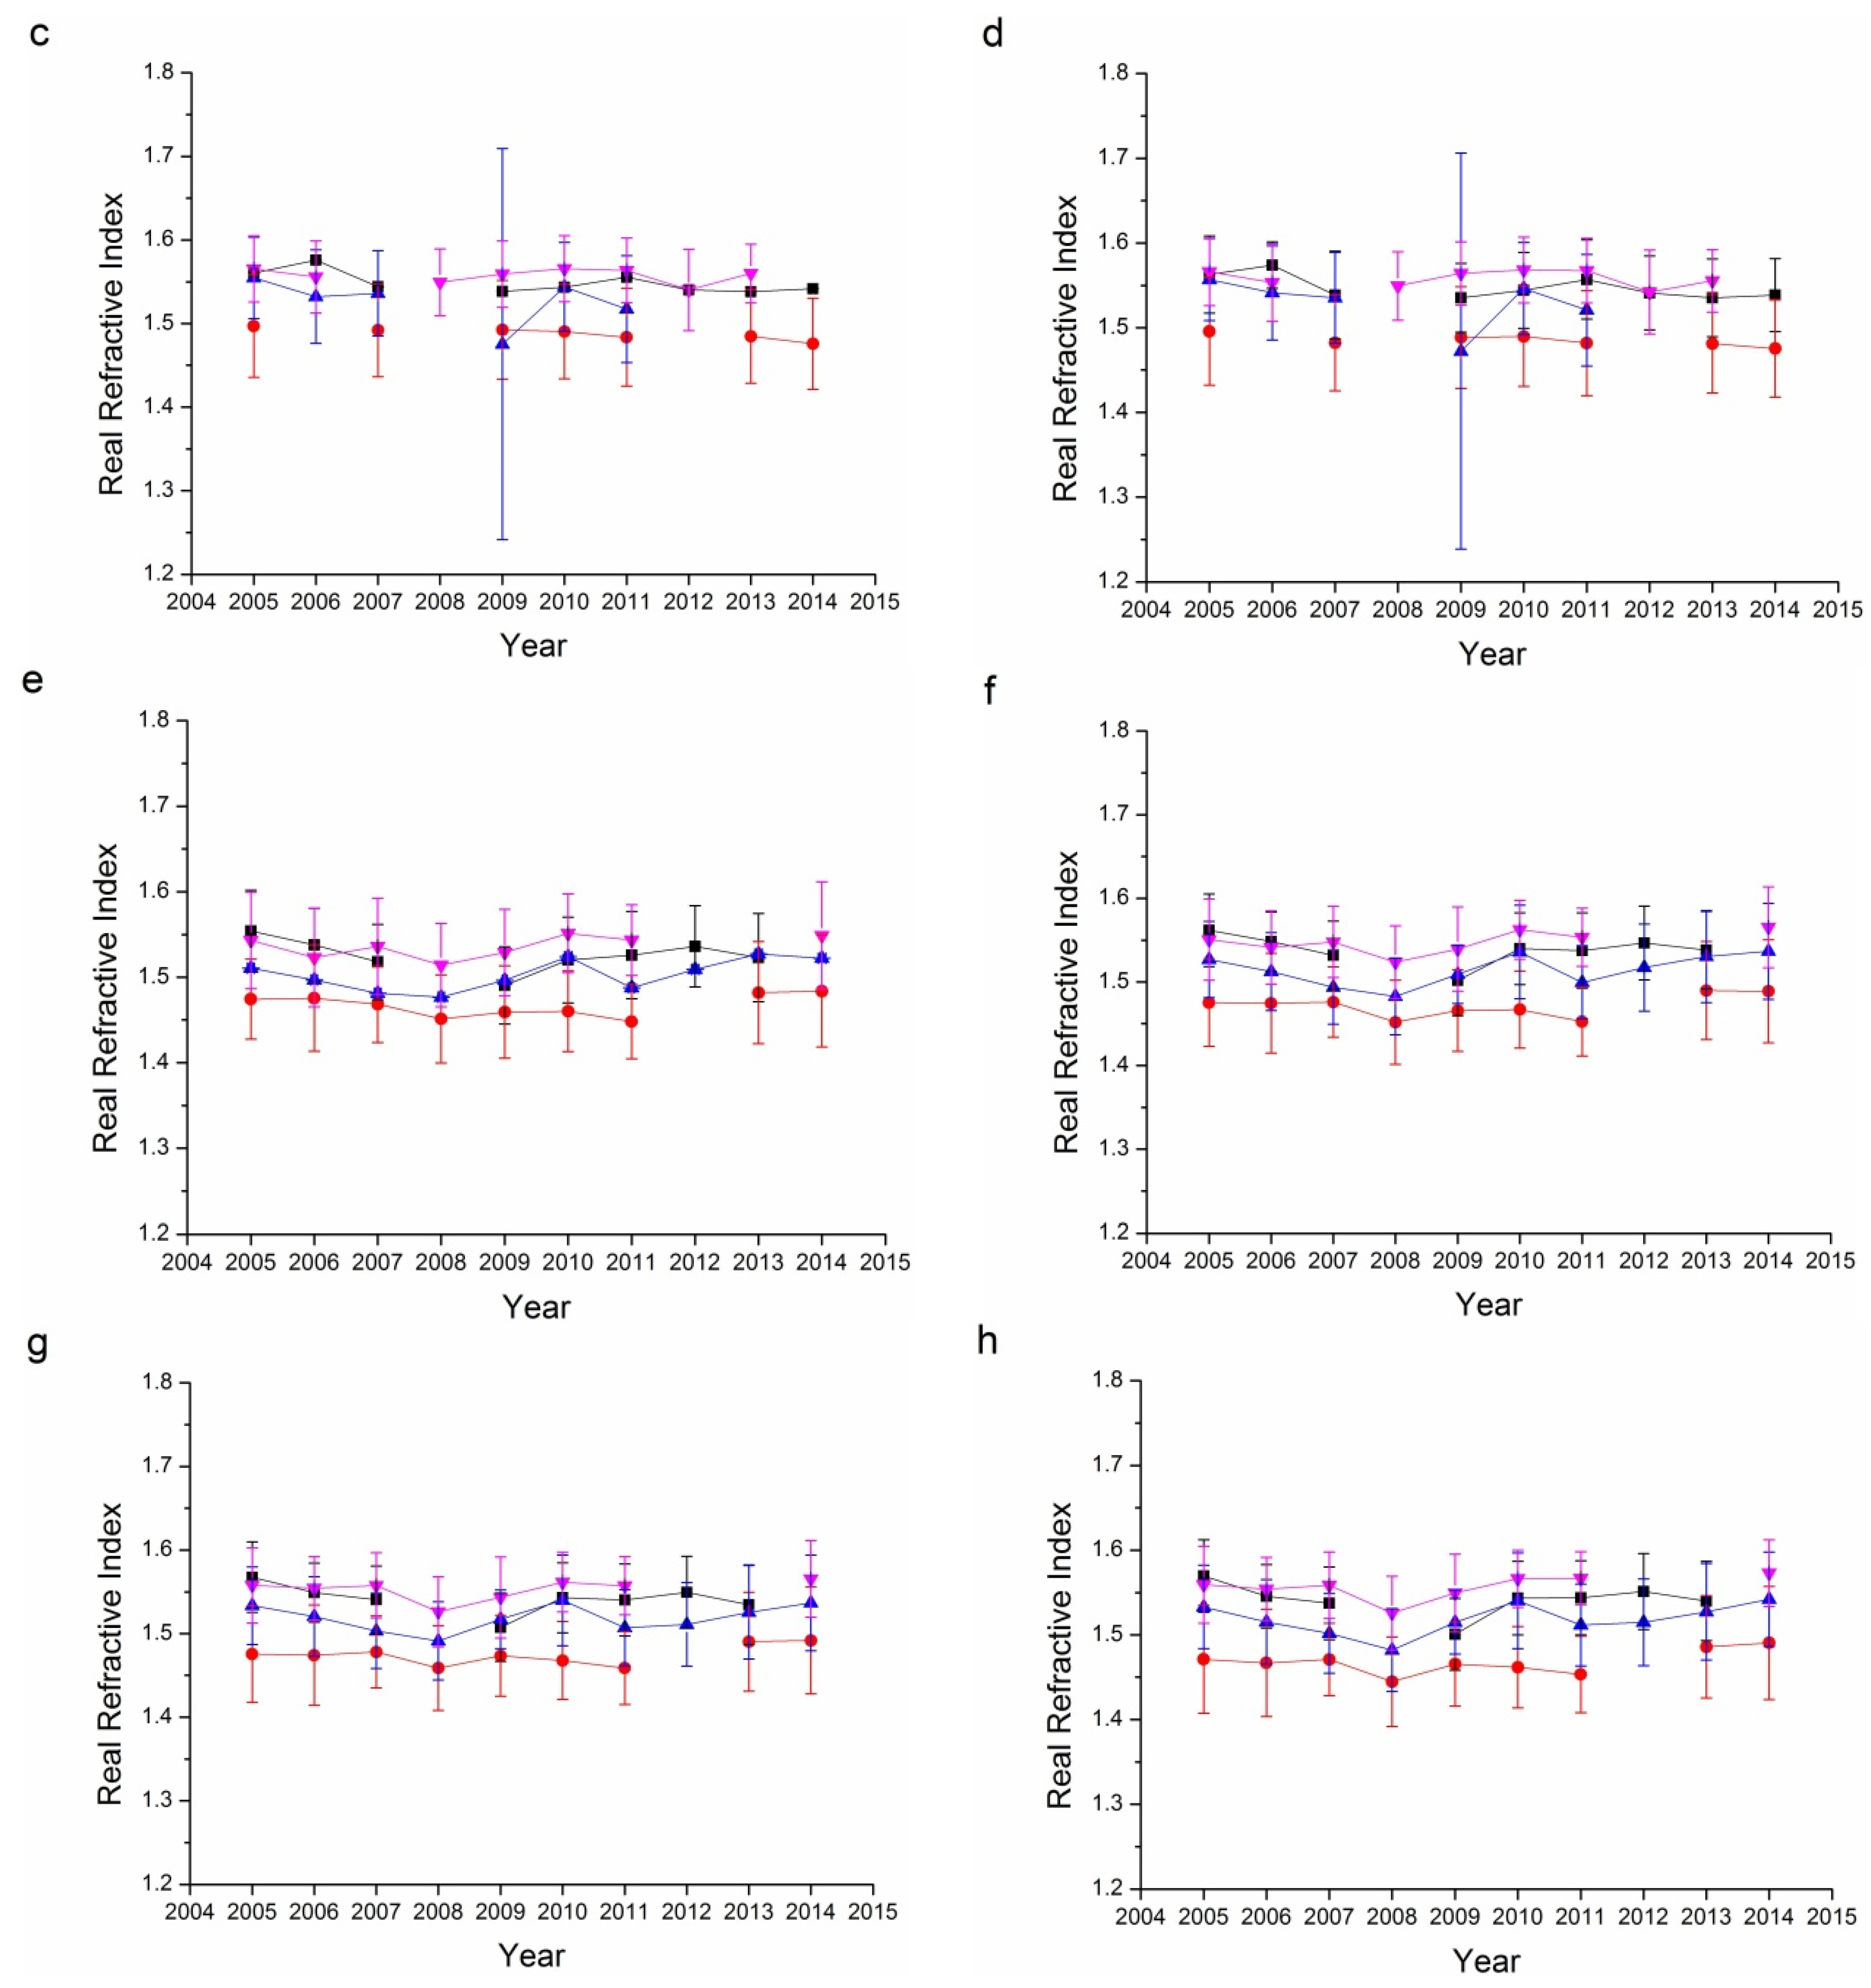
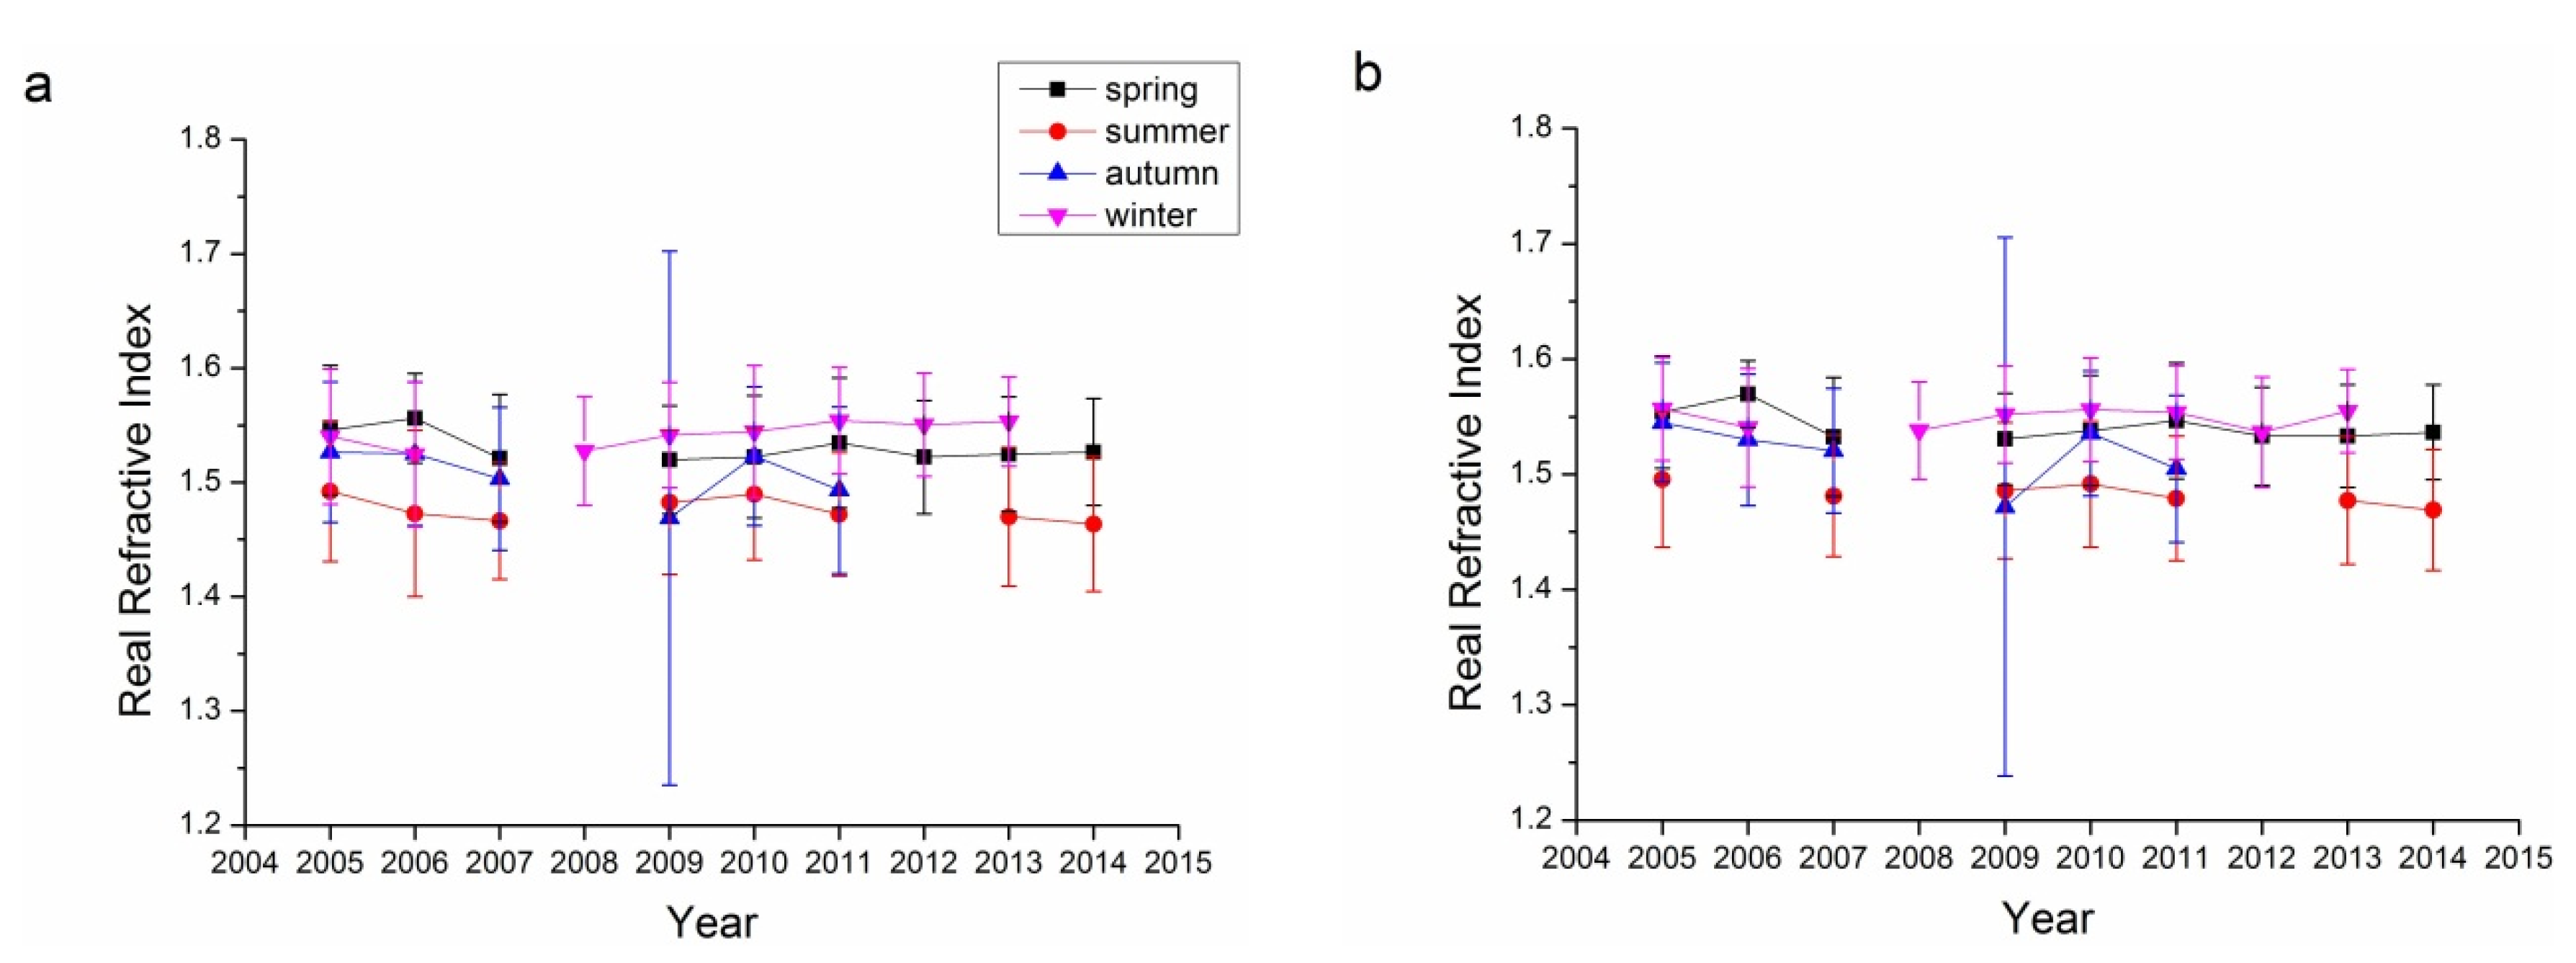
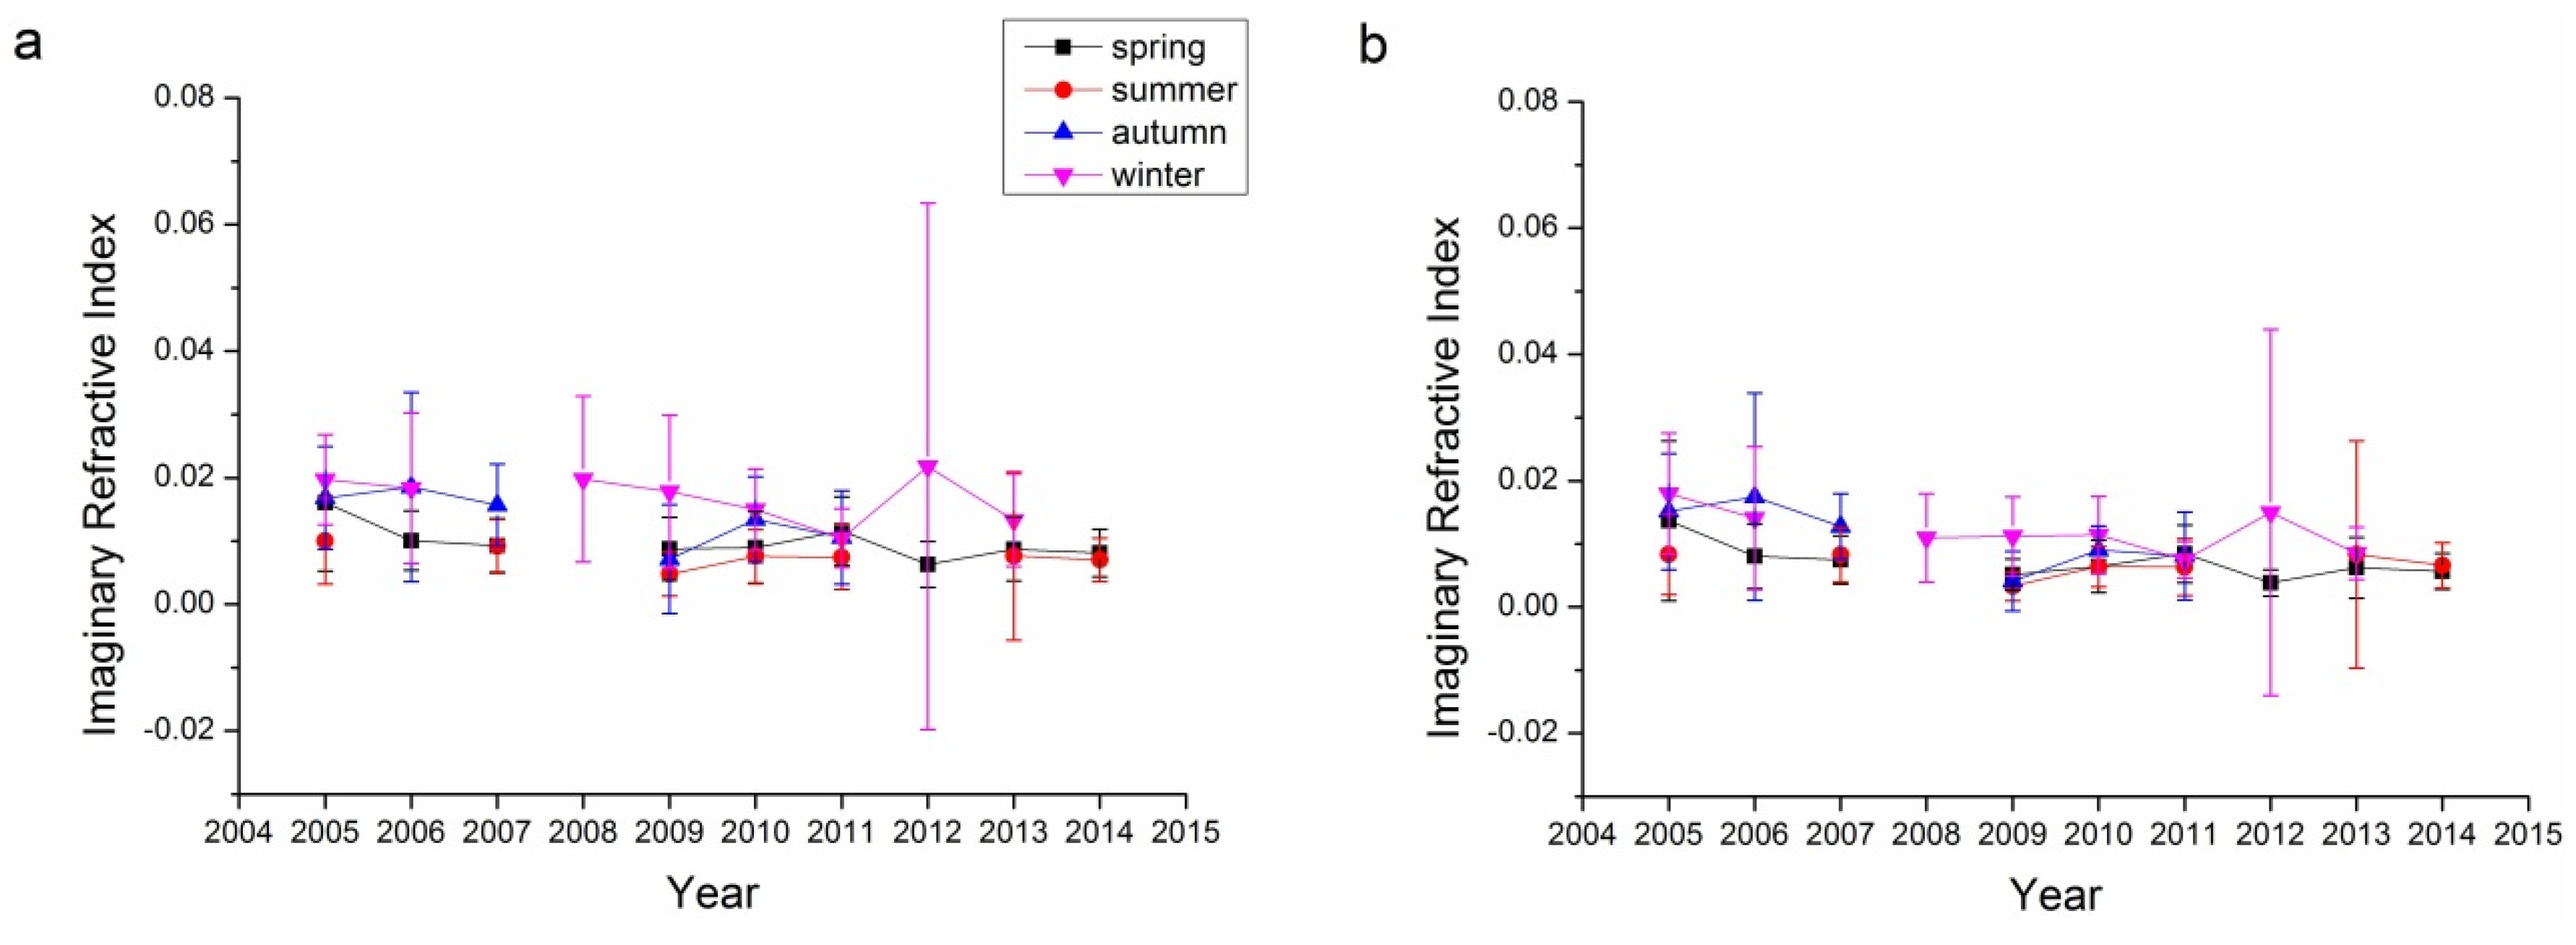
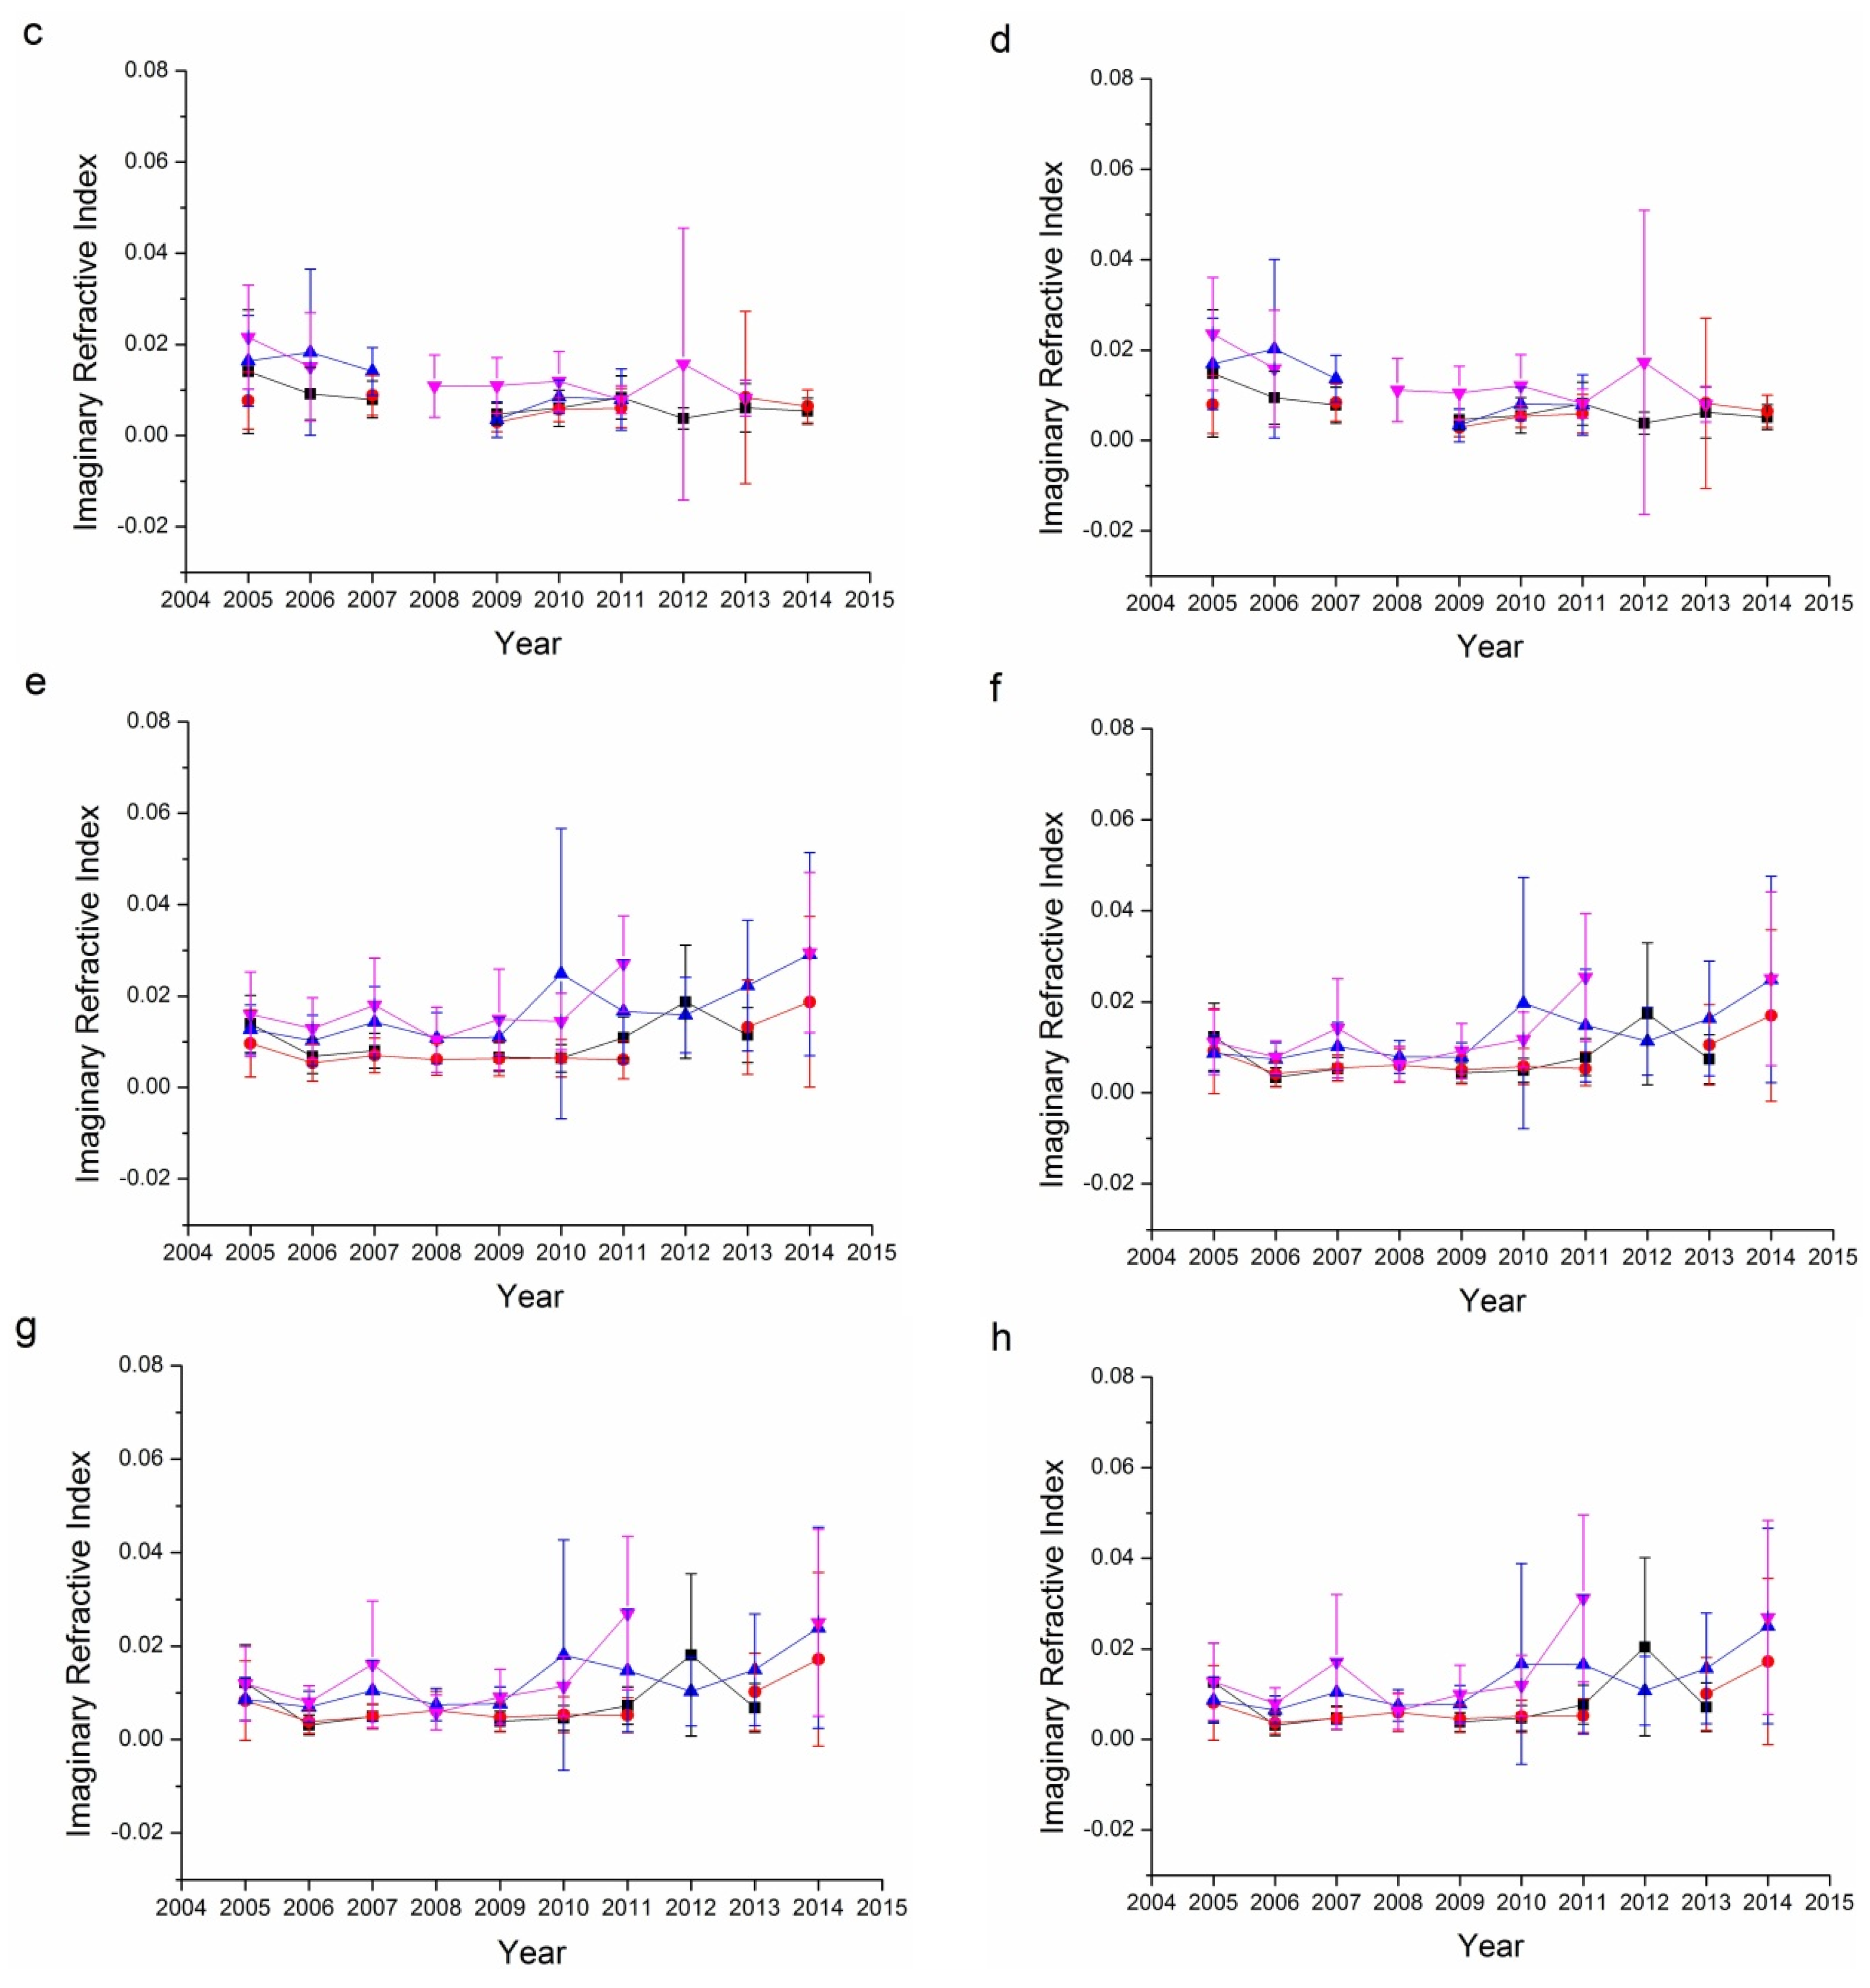
3.5. Refractive Index

Refractive index, containing both real and imaginary parts, is an aerosol property than can be retrieved only for relatively high aerosol loadings (AOD440 > 0.5) [17,41,44,56]. The error in the real parts is on the order of 0.04, while it is 30%–50% for the imaginary parts. For low aerosol loadings, the uncertainty increased as the limited information reflected by aerosol particles. The imaginary parts of the refractive index are strongly related to the absorbing characteristics of aerosol: the larger the imaginary parts, the more absorbing the aerosol particles. Figure 8 and Figure 9 show the real and imaginary parts, respectively, of the refractive indices for the Beijing and Xianghe sites. As suggested in Table 1, data from several seasons were not included as the successfully retrieved results were too few to be analyzed. The average real refractive indices for all four bands (440, 675, 870, and 1020 nm) at both sites ranged from 1.45 to 1.55. Summers have the lowest average real refractive indices, while winters have the highest. Although there were some fluctuations, the real refractive indices were relatively stable from 2005 to 2014.
The imaginary refractive index is another way to describe the absorbing characteristics of aerosol particles. As suggested by Figure 9, the imaginary refractive indices for both sites ranged from 0 to 0.02, suggesting that the aerosols at these two sites were not strongly absorbing but had certain absorbing characteristics. Winter and autumn usually have higher imaginary refractive indices, which suggests that aerosols are more absorbing in these two seasons. For the Beijing sites, the imaginary refractive indices decreased slowly while on the contrary, imaginary refractive indices at the Xianghe sites increased slowly, which suggests that aerosols at the Beijing site have become more scattering while aerosols at the Xianghe site have become more absorbing. This finding is consistent with the results from Figure 7.
Figure 8. Seasonal variations in the real refractive index for the Beijing and Xianghe Sites: (a) 440 nm Beijing; (b) 675 nm Beijing; (c) 870 nm Beijing; (d) 1020 nm Beijing; (e) 440 nm Xianghe; (f) 675 nm Xianghe; (g) 870 nm Xianghe; and (h) 1020 nm Xianghe.
Remotesensing 08 00110 g008aRemotesensing 08 00110 g008b
Figure 9. Seasonal variations in the imaginary refractive index for the Beijing and Xianghe Sites: (a) 440 nm Beijing; (b) 675 nm Beijing; (c) 870 nm Beijing; (d) 1020 nm Beijing; (e) 440 nm Xianghe; (f) 675 nm Xianghe; (g) 870 nm Xianghe; and (h) 1020 nm Xianghe.
Remotesensing 08 00110 g009aRemotesensing 08 00110 g009b

4. Discussion

Long-term variations in AERONET monitoring data present a unique tool for the analysis of the aerosol properties. As shown in Section 3.1, AOD shows great fluctuations in summer, with less fluctuation in the other three seasons. By comparing the particle size characteristics of the two sites, it was found that the Xianghe site had more fine mode aerosol particles. Furthermore, aerosols at the Xianghe site have become more absorbing while aerosols at the Beijing site have become more scattering in the past decade. The fine mode fraction and Ångström exponent are both parameters that describe the size of aerosol particles. Long-term trends in the fine mode fractions and the Ångström exponent for the Beijing and Xianghe sites are shown in Figure 10. The temporal trends for both the fine mode fraction and Ångström exponent have been similar in the past decade, indicating that these two parameters were similar in describing the sizes of aerosol particles. Similarly, SSA and the imaginary refractive index are two parameters describing the absorbing characteristics of aerosol particles. As shown in Figure 11, a high negative correlation exists between these two parameters for the Beijing and Xianghe sites.
However, there are some limitations in the inversion products (refractive index and volume size distribution) of AERONET observations: refractive index is only retrieved when AOD is greater than 0.5, while volume size distribution is effective when AOD is larger than 0.05. These limitations may lead to some errors under low aerosol loading conditions. However, since the aerosol loadings in Beijing are relatively high, in the range of 0.84–1.02 for the 440 nm band, the effect of low aerosol loading is not significant.
Figure 10. Correlation analysis of the fine mode fraction and Ångström Exponent for the Beijing (a) and Xianghe (b) sites.
Remotesensing 08 00110 g010
Figure 11. Correlation analysis of SSA (Single Scattering Albedo) and imaginary refractive index for the Beijing (a) and Xianghe (b) sites.
Remotesensing 08 00110 g011
Haze-fog is a serious environmental problem in areas of Northern China including Beijing, which have heavy aerosol loadings. API is used to describe the air pollution level by considering the PM10, SO2 and NO2 contents in the atmospheric environment from 2000 to 2013. The use of API has stopped and new national ambient air quality standards that take into account PM2.5, PM10, O3, SO2 and NO2 have been released to replace API. Aerosol pollution (PM2.5 and PM10) is the major reason for the deterioration of the air quality in Beijing, especially during winter [36]. With the API publicized by the Ministry of Environmental Protection of People’s Republic of China, the annual API declined from around 110 to 80 by the end of 2012 (the lower the API, the better the air quality) as shown in Figure 12. According to the ambient air quality standard in 1996, a daily average API of less than 100 was considered to meet the air quality standards. Since 2006, the API has been declining steadily, which is not consistent with the results in Figure 1 because the AOD has not shown a comparable decline. Moreover, the API is greatest in the winter or spring seasons, while summer has the lowest API [61], as shown in Figure 13. The median or average seasonal APIs have declined since 2001. The intra-seasonal variations in AOD are different because summer usually has the greatest AOD. This is because the calculation of API takes into account of dry particle density while the retrieval of AOD does not correct for the hygroscopic growth of aerosol particles. Therefore, due to the high humidity in summer, the AOD and dry particle density are the greatest in summer and winter, respectively.
Figure 12. Annual air pollution index from 2000 to 2013.
Remotesensing 08 00110 g012
Figure 13. Seasonal air pollution index from 2001 to 2013. The orange line indicates the line with API = 100. The small squares and lines inside the box indicate the mean and median values, respectively; the top and short lines of the box denote the upper quartile and lower quartile values, respectively; the top and bottom lines outside the boxes represent 1.5 interquartile range values; and the star signs outside the top and bottom lines are maximum and minimum values, respectively.
Remotesensing 08 00110 g013
Several haze-fog events have occurred in Beijing since 2010 [48] that have seriously affected residents’ outdoor activities. The frequent haze-fog events in Beijing can largely be contributed to the heavy aerosol loadings (high AODs). The heavy aerosol loading (AOD440 > 2.0) frequency of each year is shown in Figure 14. As shown in Figure 2 and Figure 3, annual average AODs for the Beijing and Xianghe sites are the lowest in 2009 and 2013, respectively. The trends of heavy aerosol loading occurrence in Beijing and Xianghe are similar to those of average AOD. The Beijing and Xianghe sites had the lowest frequencies of heavy aerosol loading in 2008 and 2009, respectively, while the heavy aerosol loading frequency was nearly double in 2010–2011. Considering the percentage of heavy AOD (the number of days with AOD440 > 2.0 divided by the days with successful AOD retrieval), 2008 has the highest value for the Beijing site. This is because the number of successful retrieval results at the Beijing site is too few (135 in total) compared with other years’ data (more than 200 retrievals). After 2011, the number of heavy aerosol loading days decreased in 2012 but again increased in 2013 and 2014. According to the API monitoring data for Beijing, the frequency of high APIs (API > 150 as PM10 concentrations larger than 250 μg/m3) has declined since 2006, with the lowest value in 2009 shown as Figure 15. The difference between the trends of AOD and API is that there was no obvious increase in 2010 and 2011. This might because the air quality standard released in 1996 did not consider PM2.5 and thus underestimated the role of fine particulate matter [62,63]. Furthermore, as suggested by Figure 5, the fine mode aerosol fraction has increased, which indicates that fine aerosol particles (PM2.5) might play a more important role in the deterioration of the air quality in Beijing.
Figure 14. High AOD occurrence at the Beijing and Xianghe sites.
Remotesensing 08 00110 g014
Figure 15. High API occurrence at Beijing since 2001.
Remotesensing 08 00110 g015
Haze-fog and dust storm events greatly affect human health. Air quality monitoring data and AERONET observations are two ways to measure pollution resulting from atmospheric particulate matter. During the serious haze pollution in 2013, AOD in 500 nm was higher than 1.5 and the fine mode AOD was 20 times of that of coarse mode AOD [64], suggesting that AERONET observations could have different retrievals in haze days and non-haze days. In this paper, we analyze the Ångström exponent when the daily API is greater than 150 from 2005 to 2014 (for 2013 and 2014 API was not available and AQI data were used instead). Through the analysis of the daily Ångström exponent for high API days (shown as Figure 16), it was found that most days with the heaviest pollution had α larger than 0.6. For 2006 and 2009, α on high API days was close to 0.6. However, after 2010, α on high API days gradually increased to more than 1.0. These facts illustrate that, before 2010, the atmospheric aerosol pollutions in Beijing were affected by both fine and coarse mode aerosol particles, while after 2010, fine mode aerosol particles dominated.
By analyzing the daily average PM2.5 and PM10 concentrations in 2013 and 2014 (no public PM2.5 concentrations could be obtained before 2013) for high AQI days, as shown in Figure 17, the average ratio of PM2.5 in PM10 (the percentage of PM2.5 in the PM10 concentrations) for 2013 and 2014 during high AQI days are presented. During 2013, 85.89% of PM10 during high AQI are PM2.5 compared with 74.96% in 2014. These results further demonstrated that fine aerosol particles, especially PM2.5, are the major contributor to the deterioration of air quality in Beijing.
Figure 16. Ångström exponents for high API days.
Remotesensing 08 00110 g016
Figure 17. Ratio of PM2.5 in PM10 and ratio of PM2.5–10 in PM10 for high AQI days in 2013 (a) and 2014 (b).
Remotesensing 08 00110 g017

5. Summary and Conclusions

Based on observations and retrievals at two AREONET sites in Beijing from 2005 to 2014, we present the optical and microphysical properties of aerosol from Beijing, including AOD, Ångström exponent, volume size distribution, SSA and refractive index. Measurements performed over 11 years show obvious intra- and inter-annual variations in the AOD in the Beijing area: summer has the largest AOD while winter has the lowest AOD. This trend seems to be different from the variation in API, which mainly takes into account the dry density of particulate matter: air quality is the worst in winter and the best in summer. This may be caused by the hygroscopic growth of aerosol particles under extreme humid summer seasons [65]. Furthermore, the observed trends suggested a steady improvement in air quality since 2006, while the AOD did not show such a trend. Although both heavy AOD occurrence (AOD440 > 2.0) and high API occurrence (API > 150) suggest that 2009 may be the year with the best air quality year, the following trends in these two indices are different: since 2009, there has been an increase in the heavy AOD occurrence but not in the high API. This suggests that fine aerosol particles may play a more important role in the deterioration of air quality of Beijing area.
Fine mode aerosol fraction, Ångström exponent and volume size distribution are three indices describing the size of aerosol particles. In both Beijing and Xianghe sites, the largest fine mode AOD and fine mode aerosol fraction are observed in summer. The fine mode AOD between autumn and winter are comparable. In the spring seasons, both sites show the largest coarse mode aerosol optic depth. Ångström exponent is an important index that describes the extinction ratio between different bands, with the higher value representing fine mode aerosol and the lower value representing coarse mode aerosol. Since 2005, fine mode aerosol ( α > 0.6) dominates both sites, except in 2006 when coarse mode aerosol occupied a large fraction as α got close to 0.6, which was later suggested by Figure 6, which shows that the volume concentrations of large particles of 2006 were obviously different from that of other years’.
Single scattering albedo is used to describe the absorbing characteristics of aerosol particles. The single scattering albedo in the urban area of Beijing has been increasing slowly since 2005, while the aerosol particles at the Xianghe site has become more absorbing, indicating that the aerosol particles in the urban Beijing area and those in the area southeast to Beijing are different in absorbing characteristics. The large amount of coal combustion and wheat straw burnings in Hebei province may be the major reason for the difference in the absorbing characteristics [66]. Refractive index comprises real part and imaginary part that is related to the absorbing characteristics. The trends in the imaginary refractive indices at the Beijing and Xianghe sites are similar to those for the single scattering albedo.
Considering that aerosol is the major contributor to air quality deterioration, API calculated based on the near surface concentrations of PM10, NO2 and SO2 from 2001 to 2012 are collected to compare the trends in aerosol and API. Following the enforcement of the new national ambient air quality standards of China in January 2013, hourly air pollutant concentration data have been collected in 2013 and 2014. Although aerosol particles are the major contributors to API, the basic trends in the API and AOD have been different since 2005. The API trends suggests that an improvement in the air quality since 2006, while the AOD indicates some fluctuations since 2006, with a certain degree of deterioration in 2010 and 2011. Moreover, the AOD is the largest in summer while the API is the largest in spring and winter. The reason may be that the hygroscopic growth of aerosol particles under humid summer atmosphere has increased the AOD with less dry particles. Humidity correction is necessary to retrieve fine particulate matter concentrations from the column properties of aerosol. Analysis of α during high API days suggests that, in 2006 and 2009, coarse mode aerosol may have made a significant contribution to atmospheric pollution. After 2010, the fine mode aerosol particles have played more important roles in atmospheric pollution, suggesting that a decrease in the dust source of aerosol in Beijing. Analysis of more specific hourly pollutant concentration in 2013 and 2014 has revealed that PM2.5 ratio in particulate matter is as high as 85.89% in 2013 and 74.96% in 2014, suggesting that fine particulate matter is the major contributor to air pollution on heavy polluted days. Finally, although the API suggests that the air quality in Beijing has improved, surface based AERONET observations suggest that there is no obvious improvement in the AOD. Furthermore, the increasing fine mode fraction of aerosol suggests that the API without considering PM2.5 may be the reason for the difference in the trends of AOD and API.

Acknowledgments

This research was supported by the Fundamental Research Funds for the Central Universities under Grant 2014QD02 and the outstanding talent training project of Beijing under Grant 2014000020124G0441. We acknowledge the PIs of the Beijing Site (Hong-Bin Chen and Philippe Goloub) and the Xianghe site (Pucai Wang and Xiangao Xia) for providing AERONET observation data.

Author Contributions

All authors have made significant contribution to the paper. Wei Chen and Hongzhao Tang defined the major working scheme, collected the data and wrote the paper. Lei Yan provided some key air pollution data. Haimeng Zhao processed and analyzed the aerosol data.

Conflicts of Interest

The authors declare no conflict of interest.

References

  1. Zhou, M.G.; Liu, Y.N.; Wang, L.J.; Kuang, X.Y.; Xu, X.H.; Kan, H.D. Particulate air pollution and mortality in a cohort of chinese men. Environ. Pollut. 2014, 186, 1–6. [Google Scholar] [CrossRef] [PubMed]
  2. Langrish, J.P.; Mills, N.L. Air pollution and mortality in europe. Lancet 2014, 383, 758–760. [Google Scholar] [CrossRef]
  3. Schwartz, J.; Neas, L.M. Fine particles are more strongly associated than coarse particles with acute respiratory health effects in schoolchildren. Epidemiology 2000, 11, 6–10. [Google Scholar] [CrossRef] [PubMed]
  4. Sayer, A.M.; Munchak, L.A.; Hsu, N.C.; Levy, R.C.; Bettenhausen, C.; Jeong, M.J. MODIS collection 6 aerosol products: Comparison between aqua’s e-deep blue, dark target, and “merged” data sets, and usage recommendations. J. Geophys. Res. Atmos. 2014, 119, 13965–13989. [Google Scholar] [CrossRef]
  5. Li, Z.Q.; Niu, F.; Fan, J.W.; Liu, Y.G.; Rosenfeld, D.; Ding, Y.N. Long-term impacts of aerosols on the vertical development of clouds and precipitation. Nat. Geosci. 2011, 4, 888–894. [Google Scholar] [CrossRef]
  6. Janssen, N.A.H.; Fischer, P.; Marra, M.; Ameling, C.; Cassee, F.R. Short-term effects of PM2.5, PM10 and PM2.5–10 on daily mortality in the Netherlands. Sci. Total Environ. 2013, 463, 20–26. [Google Scholar] [CrossRef] [PubMed]
  7. Chen, R.; Peng, R.D.; Meng, X.; Zhou, Z.; Chen, B.; Kan, H. Seasonal variation in the acute effect of particulate air pollution on mortality in the China air pollution and health effects study (Capes). Sci. Total Environ. 2013, 450, 259–265. [Google Scholar] [CrossRef] [PubMed]
  8. Bergen, S.; Sheppard, L.; Sampson, P.D.; Kim, S.Y.; Richards, M.; Vedal, S.; Kaufman, J.D.; Szpiro, A.A. A national prediction model for PM2.5 component exposures and measurement error-corrected health effect inference. Environ. Health Perspect. 2013, 121, 1017–1025. [Google Scholar] [CrossRef] [PubMed]
  9. Levy, R.C.; Mattoo, S.; Munchak, L.A.; Remer, L.A.; Sayer, A.M.; Patadia, F.; Hsu, N.C. The collection 6 MODIS aerosol products over land and ocean. Atmos. Meas. Tech. 2013, 6, 2989–3034. [Google Scholar] [CrossRef]
  10. Remer, L.A.; Kaufman, Y.J.; Tanre, D.; Mattoo, S.; Chu, D.A.; Martins, J.V.; Li, R.R.; Ichoku, C.; Levy, R.C.; Kleidman, R.G.; et al. The MODIS aerosol algorithm, products, and validation. J. Atmos. Sci. 2005, 62, 947–973. [Google Scholar] [CrossRef]
  11. Li, Z.Q.; Niu, F.; Lee, K.H.; Xin, J.Y.; Hao, W.M.; Nordgren, B.; Wang, Y.S.; Wang, P.C. Validation and understanding of moderate resolution imaging spectroradiometer aerosol products (C5) using ground-based measurements from the handheld sun photometer network in China. J. Geophys. Res. 2007, 112. [Google Scholar] [CrossRef]
  12. Levy, R.C.; Remer, L.A.; Kaufman, Y.J. Effects of neglecting polarization on the MODIS aerosol retrieval over land. IEEE Trans. Geosci. Remote Sens. 2004, 42, 2576–2583. [Google Scholar] [CrossRef]
  13. Hasekamp, O.P.; Litvinov, P.; Butz, A. Aerosol properties over the ocean from parasol multiangle photopolarimetric measurements. J. Geophys. Res. 2011, 116. [Google Scholar] [CrossRef]
  14. Diner, D.J.; Martonchik, J.V.; Kahn, R.A.; Pinty, B.; Gobron, N.; Nelson, D.L.; Holben, B.N. Using angular and spectral shape similarity constraints to improve misr aerosol and surface retrievals over land. Remote Sens. Environ. 2005, 94, 155–171. [Google Scholar] [CrossRef]
  15. Tao, M.H.; Chen, L.F.; Wang, Z.F.; Tao, J.H.; Che, H.Z.; Wang, X.H.; Wang, Y. Comparison and evaluation of the MODIS collection 6 aerosol data in China. J. Geophys. Res. Atmos. 2015, 120, 6992–7005. [Google Scholar] [CrossRef]
  16. Sayer, A.M.; Hsu, N.C.; Bettenhausen, C.; Jeong, M.J. Validation and uncertainty estimates for MODIS collection 6 “Deep Blue” aerosol data. J. Geophys. Res. Atmos. 2013, 118, 7864–7872. [Google Scholar] [CrossRef]
  17. Dubovik, O.; Smirnov, A.; Holben, B.N.; King, M.D.; Kaufman, Y.J.; Eck, T.F.; Slutsker, I. Accuracy assessments of aerosol optical properties retrieved from aerosol robotic network (AERONET) sun and sky radiance measurements. J. Geophys. Res. Atmos. 2000, 105, 9791–9806. [Google Scholar] [CrossRef]
  18. Che, H.; Shi, G.; Uchiyama, A.; Yamazaki, A.; Chen, H.; Goloub, P.; Zhang, X. Intercomparison between aerosol optical properties by a prede skyradiometer and cimel sunphotometer over Beijing, China. Atmos. Chem. Phys. 2008, 8, 3199–3214. [Google Scholar] [CrossRef]
  19. Eck, T.F.; Holben, B.N.; Dubovik, O.; Smirnov, A.; Goloub, P.; Chen, H.B.; Chatenet, B.; Gomes, L.; Zhang, X.Y.; Tsay, S.C.; et al. Columnar aerosol optical properties at aeronet sites in central Eastern Asia and aerosol transport to the tropical Mid-Pacific. J. Geophys. Res. Atmos. 2005, 110. [Google Scholar] [CrossRef]
  20. Zhu, J.; Xia, X.; Che, H.; Wang, J.; Zhang, J.; Duan, Y. Study of aerosol optical properties at Kunming in southwest China and long-range transport of biomass burning aerosols from North Burma. Atmos. Res. A 2016, 169, 237–247. [Google Scholar] [CrossRef]
  21. Zhang, J.; Chen, J.; Xia, X.; Che, H.; Fan, X.; Xie, Y.; Han, Z.; Chen, H.; Lu, D. Heavy aerosol loading over the Bohai bay as revealed by ground and satellite remote sensing. Atmos. Environ. B 2016, 124, 252–261. [Google Scholar] [CrossRef]
  22. Xin, J.Y.; Wang, Y.S.; Li, Z.Q.; Wang, P.C.; Hao, W.M.; Nordgren, B.L.; Wang, S.G.; Liu, G.R.; Wang, L.L.; Wen, T.X.; et al. Aerosol optical depth (AOD) and angstrom exponent of aerosols observed by the Chinese sun hazemeter network from August 2004 to September 2005. J. Geophys. Res. Atmos. 2007, 112. [Google Scholar] [CrossRef]
  23. O’Neill, N.T.; Ignatov, A.; Holben, B.N.; Eck, T.F. The lognormal distribution as a reference for reporting aerosol optical depth statistics; empirical tests using multi-year, multi-site aeronet sunphotometer data. Geophys. Res. Lett. 2000, 27, 3333–3336. [Google Scholar]
  24. Behnert, I.; Matthias, V.; Doerffer, R. Aerosol climatology from ground-based measurements for the Southern North Sea. Atmos. Res. 2007, 84, 201–220. [Google Scholar] [CrossRef]
  25. Yoon, J.; Pozzer, A.; Chang, D.Y.; Lelieveld, J.; Kim, J.; Kim, M.; Lee, Y.G.; Koo, J.H.; Lee, J.; Moon, K.J. Trend estimates of aeronet-observed and model-simulated AOTS between 1993 and 2013. Atmos. Environ. A 2016, 125, 33–47. [Google Scholar] [CrossRef]
  26. Schuster, G.L.; Vaughan, M.; MacDonnell, D.; Su, W.; Winker, D.; Dubovik, O.; Lapyonok, T.; Trepte, C. Comparison of calipso aerosol optical depth retrievals to aeronet measurements, and a climatology for the lidar ratio of dust. Atmos. Chem. Phys. 2012, 12, 7431–7452. [Google Scholar] [CrossRef]
  27. Garcia, O.E.; Diaz, J.P.; Exposito, F.J.; Diaz, A.M.; Dubovik, O.; Derimian, Y.; Dubuisson, P.; Roger, J.C. Shortwave radiative forcing and efficiency of key aerosol types using aeronet data. Atmos. Chem. Phys. 2012, 12, 5129–5145. [Google Scholar] [CrossRef]
  28. Lee, J.; Kim, J.; Yang, P.; Hsu, N.C. Improvement of aerosol optical depth retrieval from MODIS spectral reflectance over the global ocean using new aerosol models archived from aeronet inversion data and tri-axial ellipsoidal dust database. Atmos. Chem. Phys. 2012, 12, 7087–7102. [Google Scholar] [CrossRef]
  29. Grosso, N.; Paronis, D. Comparison of contrast reduction based MODIS AOT estimates with AERONET measurements. Atmos. Res. 2012, 116, 33–45. [Google Scholar] [CrossRef]
  30. Cheng, T.; Chen, H.; Gu, X.; Yu, T.; Guo, J.; Guo, H. The inter-comparison of MODIS, misr and gocart aerosol products against aeronet data over China. J. Quant. Spectrosc. Radiat. Transf. 2012, 113, 2135–2145. [Google Scholar] [CrossRef]
  31. Mi, W.; Li, Z.; Xia, X.; Holben, B.; Levy, R.; Zhao, F.; Chen, H.; Cribb, M. Evaluation of the moderate resolution imaging spectroradiometer aerosol products at two aerosol robotic network stations in China. J. Geophys. Res. Atmos. 2007, 112. [Google Scholar] [CrossRef]
  32. Che, H.; Xia, X.; Zhu, J.; Li, Z.; Dubovik, O.; Holben, B.; Goloub, P.; Chen, H.; Estelles, V.; Cuevas-Agullo, E.; et al. Column aerosol optical properties and aerosol radiative forcing during a serious haze-fog month over north China plain in 2013 based on ground-based sunphotometer measurements. Atmos. Chem. Phys. 2014, 14, 2125–2138. [Google Scholar] [CrossRef]
  33. Li, Z.; Xia, X.; Cribb, M.; Mi, W.; Holben, B.; Wang, P.; Chen, H.; Tsay, S.-C.; Eck, T.F.; Zhao, F.; et al. Aerosol optical properties and their radiative effects in northern China. J. Geophys. Res. Atmos. 2007, 112. [Google Scholar] [CrossRef]
  34. Xia, X.A.; Chen, H.B.; Wang, P.C.; Zong, X.M.; Qiu, J.H.; Gouloub, P. Aerosol properties and their spatial and temporal variations over north China in Spring 2001. Tellus B Chem. Phys. Meteorol. 2005, 57, 28–39. [Google Scholar]
  35. Zhang, A.; Qi, Q.; Jiang, L.; Zhou, F.; Wang, J. Population exposure to PM2.5 in the urban area of Beijing. PLoS ONE 2013, 8, e63486. [Google Scholar] [CrossRef] [PubMed]
  36. Li, R.; Li, Z.; Gao, W.; Ding, W.; Xu, Q.; Song, X. Diurnal, seasonal, and spatial variation of PM2.5 in Beijing. Sci. Bull. 2015, 60, 387–395. [Google Scholar] [CrossRef]
  37. Guo, Y.; Feng, N.; Christopher, S.A.; Kang, P.; Zhan, F.B.; Hong, S. Satellite remote sensing of fine particulate matter (PM2.5) air quality over Beijing using MODIS. Int. J. Remote Sens. 2014, 35, 6522–6544. [Google Scholar] [CrossRef]
  38. Zhang, R.; Jing, J.; Tao, J.; Hsu, S.C.; Wang, G.; Cao, J.; Lee, C.S.L.; Zhu, L.; Chen, Z.; Zhao, Y.; et al. Chemical characterization and source apportionment of PM2.5 in Beijing: Seasonal perspective. Atmos. Chem. Phys. 2013, 13, 7053–7074. [Google Scholar] [CrossRef]
  39. He, X.; Li, C.C.; Lau, A.K.H.; Deng, Z.Z.; Mao, J.T.; Wang, M.H.; Liu, X.Y. An intensive study of aerosol optical properties in Beijing urban area. Atmos. Chem. Phys. 2009, 9, 8903–8915. [Google Scholar] [CrossRef]
  40. Liu, P.F.; Zhao, C.S.; Zhang, Q.; Deng, Z.Z.; Huang, M.Y.; Ma, X.C.; Tie, X.X. Aircraft study of aerosol vertical distributions over Beijing and their optical properties. Tellus B Chem. Phys. Meteorol. 2009, 61, 756–767. [Google Scholar] [CrossRef]
  41. Li, Z.; Gu, X.; Wang, L.; Li, D.; Xie, Y.; Li, K.; Dubovik, O.; Schuster, G.; Goloub, P.; Zhang, Y.; et al. Aerosol physical and chemical properties retrieved from ground-based remote sensing measurements during heavy haze days in Beijing winter. Atmos. Chem. Phys. 2013, 13, 10171–10183. [Google Scholar] [CrossRef] [Green Version]
  42. Dubovik, O.; Sinyuk, A.; Lapyonok, T.; Holben, B.N.; Mishchenko, M.; Yang, P.; Eck, T.F.; Volten, H.; Munoz, O.; Veihelmann, B.; et al. Application of spheroid models to account for aerosol particle nonsphericity in remote sensing of desert dust. J. Geophys. Res. 2006, 111. [Google Scholar] [CrossRef]
  43. Fan, X.H.; Xia, X.A.; Chen, H.B. Comparison of column-integrated aerosol optical and physical properties in an urban and suburban site on the north China plain. Adv. Atmos. Sci. 2015, 32, 477–486. [Google Scholar] [CrossRef]
  44. Dubovik, O.; King, M.D. A flexible inversion algorithm for retrieval of aerosol optical properties from sun and sky radiance measurements. J. Geophys. Res. 2000, 105, 20673–20696. [Google Scholar] [CrossRef]
  45. Dubovik, O.; Herman, M.; Holdak1, A.; Lapyonok, T.; Tanre, D.; Deuze, J.L.; Ducos, F.; Sinyuk, A.; Lopatin, A. Statistically optimized inversion algorithm for enhanced retrieval of aerosol properties from spectral multi-angle polarimetric satellite observations. Atmos. Meas. Tech. 2011, 4, 975–1018. [Google Scholar] [CrossRef] [Green Version]
  46. Smirnov, A.; Holben, B.N.; Eck, T.F.; Dubovik, O.; Slutsker, I. Cloud-screening and quality control algorithms for the aeronet database. Remote Sens. Environ. 2000, 73, 337–349. [Google Scholar] [CrossRef]
  47. Distribution of Real Time Air Quality of Beijing. Available online: http://www.bjmemc.com.cn/ (accessed on 29 January 2016).
  48. Chen, W.; Wang, F.; Xiao, G.; Wu, K.; Zhang, S. Air quality of Beijing and impacts of the new ambient air quality standard. Atmosphere 2015, 6, 1243–1258. [Google Scholar] [CrossRef]
  49. Distribution of Real Time Air Qulaity of China. Available online: http://113.108.142.147:20035/emcpublish/ (accessed on 29 January 2016).
  50. Xie, Y.; Li, Z.; Li, D.; Xu, H.; Li, K. Aerosol optical and microphysical properties of four typical sites of sonet in China based on remote sensing measurements. Remote Sens. 2015, 7, 9928–9953. [Google Scholar] [CrossRef]
  51. Eck, T.F.; Holben, B.N.; Sinyuk, A.; Pinker, R.T.; Goloub, P.; Chen, H.; Chatenet, B.; Li, Z.; Singh, R.P.; Tripathi, S.N.; et al. Climatological aspects of the optical properties of fine/coarse mode aerosol mixtures. J. Geophys. Res. Atmos. 2010, 115. [Google Scholar] [CrossRef]
  52. He, Q.S.; Li, C.C.; Geng, F.H.; Yang, H.Q.; Li, P.R.; Li, T.T.; Liu, D.W.; Pei, Z. Aerosol optical properties retrieved from sun photometer measurements over Shanghai, China. J. Geophys. Res. Atmos. 2012, 117. [Google Scholar] [CrossRef]
  53. Fan, X.; Chen, H.; Goloub, P.; Xia, X.A.; Zhang, W.; Chatenet, B. Analysis of column-integrated aerosol optical thickness in Beijing from aeronet observations. China Particuol. 2006, 4, 330–335. [Google Scholar] [CrossRef]
  54. Lyapustin, A.; Smirnov, A.; Holben, B.; Chin, M.; Streets, D.G.; Lu, Z.; Kahn, R.; Slutsker, I.; Laszlo, I.; Kondragunta, S.; et al. Reduction of aerosol absorption in Beijing since 2007 from MODIS and aeronet. Geophys. Res. Lett. 2011, 38, 415–421. [Google Scholar] [CrossRef]
  55. Li, J.; Carlson, B.E.; Dubovik, O.; Lacis, A.A. Recent trends in aerosol optical properties derived from aeronet measurements. Atmos. Chem. Phys. 2014, 14, 12271–12289. [Google Scholar] [CrossRef]
  56. Dubovik, O.; Holben, B.; Eck, T.F.; Smirnov, A.; Kaufman, Y.J.; King, M.D.; Tanre, D.; Slutsker, I. Variability of absorption and optical properties of key aerosol types observed in worldwide locations. J. Atmos. Sci. 2002, 59, 590–608. [Google Scholar] [CrossRef]
  57. Xia, X.; Che, H.; Zhu, J.; Chen, H.; Cong, Z.; Deng, X.; Fan, X.; Fu, Y.; Goloub, P.; Jiang, H.; et al. Ground-based remote sensing of aerosol climatology in China: Aerosol optical properties, direct radiative effect and its parameterization. Atmos. Environ. B 2016, 124, 243–251. [Google Scholar] [CrossRef]
  58. Yoon, J.; von Hoyningen-Huene, W.; Kokhanovsky, A.A.; Vountas, M.; Burrows, J.P. Trend analysis of aerosol optical thickness and angstrom exponent derived from the global aeronet spectral observations. Atmos. Meas. Tech. 2012, 5, 1271–1299. [Google Scholar] [CrossRef]
  59. Jiang, X.; Liu, Y.; Yu, B.; Jiang, M. Comparison of misr aerosol optical thickness with aeronet measurements in Beijing metropolitan area. Remote Sens. Environ. 2007, 107, 45–53. [Google Scholar] [CrossRef]
  60. Wang, J.; Zhu, C.; Zhu, Y.; Chen, S. Characterization of aerosol properties in Beijing from long-term aeronet monitoring (2003–2012). J. Indian Soc. Remote Sens. 2015, 43, 825–839. [Google Scholar] [CrossRef]
  61. Chen, W.; Tang, H.; Zhao, H. Diurnal, weekly and monthly spatial variations of air pollutants and air quality of Beijing. Atmos. Environ. 2015, 119, 21–34. [Google Scholar] [CrossRef]
  62. Zhang, H.; Wang, Y.; Hu, J.; Ying, Q.; Hu, X.-M. Relationships between meteorological parameters and criteria air pollutants in three megacities in China. Environ. Res. 2015, 140, 242–254. [Google Scholar] [CrossRef] [PubMed]
  63. San Martini, F.M.; Hasenkopf, C.A.; Roberts, D.C. Statistical analysis of PM2.5 observations from diplomatic facilities in China. Atmos. Environ. 2015, 110, 174–185. [Google Scholar] [CrossRef]
  64. Che, H.Z.; Xia, X.G.; Zhu, J.; Wang, H.; Wang, Y.Q.; Sun, J.Y.; Zhang, X.Y.; Shi, G.Y. Aerosol optical properties under the condition of heavy haze over an urban site of Beijing, China. Environ. Sci. Pollut. Res. 2015, 22, 1043–1053. [Google Scholar] [CrossRef] [PubMed]
  65. Che, H.; Zhang, X.Y.; Xia, X.; Goloub, P.; Holben, B.; Zhao, H.; Wang, Y.; Zhang, X.C.; Wang, H.; Blarel, L.; et al. Ground-based aerosol climatology of China: Aerosol optical depths from the China aerosol remote sensing network (CARSNET) 2002–2013. Atmos. Chem. Phys. 2015, 15, 7619–7652. [Google Scholar] [CrossRef]
  66. Li, L.J.; Wang, Y.; Zhang, Q.; Li, J.X.; Yang, X.G.; Jin, J. Wheat straw burning and its associated impacts on Beijing air quality. Sci. China Ser. D 2008, 51, 403–414. [Google Scholar] [CrossRef]

