1. Introduction
Catastrophic events such as floods, landslides, and tsunamis have a significant impact on our lives as these events cause major losses to life and properties. Flooding events are the most frequently occurring worldwide natural disasters and may become a major area of concern in the future as a result of climate change [
1,
2]. The circumstances have forced the policy makers to include flood monitoring as issues of national importance. Flood monitoring requires rapid access to essential information about flood extents and changes in land cover. Change detection techniques using remotely sensed data, which are the information about an object or phenomenon acquired without direct physical contact, can be used to estimate the information in a quick time frame for the flood monitoring [
3]. Change detection is a process of identifying differences in the state of an object or phenomenon by observing it at different times. Timely and accurate change detection of flood-related disasters provides the foundation for better understanding of disaster situation, after which it helps to make the disaster recovery plan.
With increased availability and improved quality of multi-temporal remote sensing data, there has been a growing interest in the development of change detection techniques for the flood monitoring using multi-temporal satellite imagery over the past few years. As an advantage of rapid revisit time and of widely available spectral wavelengths, multi-temporal images acquired from sensors having low spatial resolution but high spectral resolution, such as Landsat and MODIS sensors, have been generally used for flood monitoring [
4,
5,
6,
7]. SAR images have also been employed due to their strength that can acquire the data regardless of the weather condition [
8,
9,
10]. In spite of the advantages of those sensors, exploiting very high-resolution (VHR) multi-temporal images is still attractive to detect flood extent for more detail analysis with precise performance [
11].
Several contributions can be found in the recent literature for automatic change detection. Several methods, including principle component analysis (PCA), change vector analysis (CVA), support vector machine (SVM), multivariate alteration detection (MAD), have proven to be effective in various applications [
12,
13,
14,
15,
16,
17,
18]. The CVA is a binary change detection method that identifies the changes using the magnitude between two spectral vectors. A threshold for indicating changed areas needs to be determined on the magnitude of the change vector. This method performed better in a comparative evaluation of some change detection techniques for detecting flood extent using Landsat TM data [
19]. The MAD method works based on canonical correlation analysis (CCA) between two groups of variables, in order to find their linear combinations that give a set of mutually orthogonal difference images. The method can concentrate all spectral variations associated with land cover changes between two acquisition times into a few resulting MAD components. They provide an optimal change indicator for multi-temporal remotely sensed images in theory [
20]. The SVM-based change detection method, which is a supervised method known for showing a good performance, is applied to the multispectral difference image generated by the difference of spectral feature vectors associated with pairs of corresponding pixels in bi-temporal images [
13].
In 2009–2010, there was a Data Fusion Contest organized by the IEEE Geoscience and Remote Sensing Society. It was focused on the evaluation of existing algorithms for flood mapping through change detection [
21]. A new change detection technique based on image differencing has been introduced to enable the automated and reliable flood extent extraction from VHR TerraSAR-X images [
22]. Moreover, the change detection and thresholding (CDAT) method has been developed to delineate the extent of flooding for the Chobe floodplain in the Caprivi region of Namibia [
23].
Among all above-mentioned approaches, the simple difference image, which is made by subtracting the pixel values of one image from those in another, is one of the main sources of potential change information as it contains clues about spectral changes. The pixels of the difference image having significantly large values are associated with the regions that show high probability of being changed. Changes are then identified by thresholding the difference image according to empirical strategies or statistical methods. Obtaining the difference information and selecting the appropriate threshold to extract the change information are the key steps in change detection from multi-temporal remote sensing images. However, the critical limitation of the change detection method based on the difference image is that the result from the method is heavily reliant on the spectral features [
24]. It only considers the spectral values of pixels to obtain the difference information so that large noises occur due to radiometric and geometric differences between images [
25]. Since the pixels are not spatially independent and the noise pixels have a great impact on change detection, differences based on spectral feature may fail to reveal the changes in VHR bi-temporal satellite images.
The main objective of this study is to develop a new change detection approach for the detection of flooded areas and the generation of flood hazard map using VHR bi-temporal satellite images. To do this, we take advantages of spectral distortion that occurs during the image fusion process to detect changed areas caused by flood. This concept is based on the fact that changed areas show a spectral distortion after image fusion due to the spectral and spatial differences between bi-temporal images. A candidate change image is extracted from the fused image generated with bi-temporal images using the universal image quality index (UIQI) index, which can be used locally in order to evaluate the spectral distortion. Finally, the flood extent region is detected by an automated thresholding method.
The remainder of the paper is as follows. The experiment data in this study is presented in
Section 2. The major methodology of our study is described in
Section 3. In
Section 4, we apply our algorithm on the Kompsat-2 bi-temporal images and compare our result with those generated using the existing CVA-, MAD-, and SVM-based analysis. A conclusion is presented in
Section 5.
2. Image Preparation
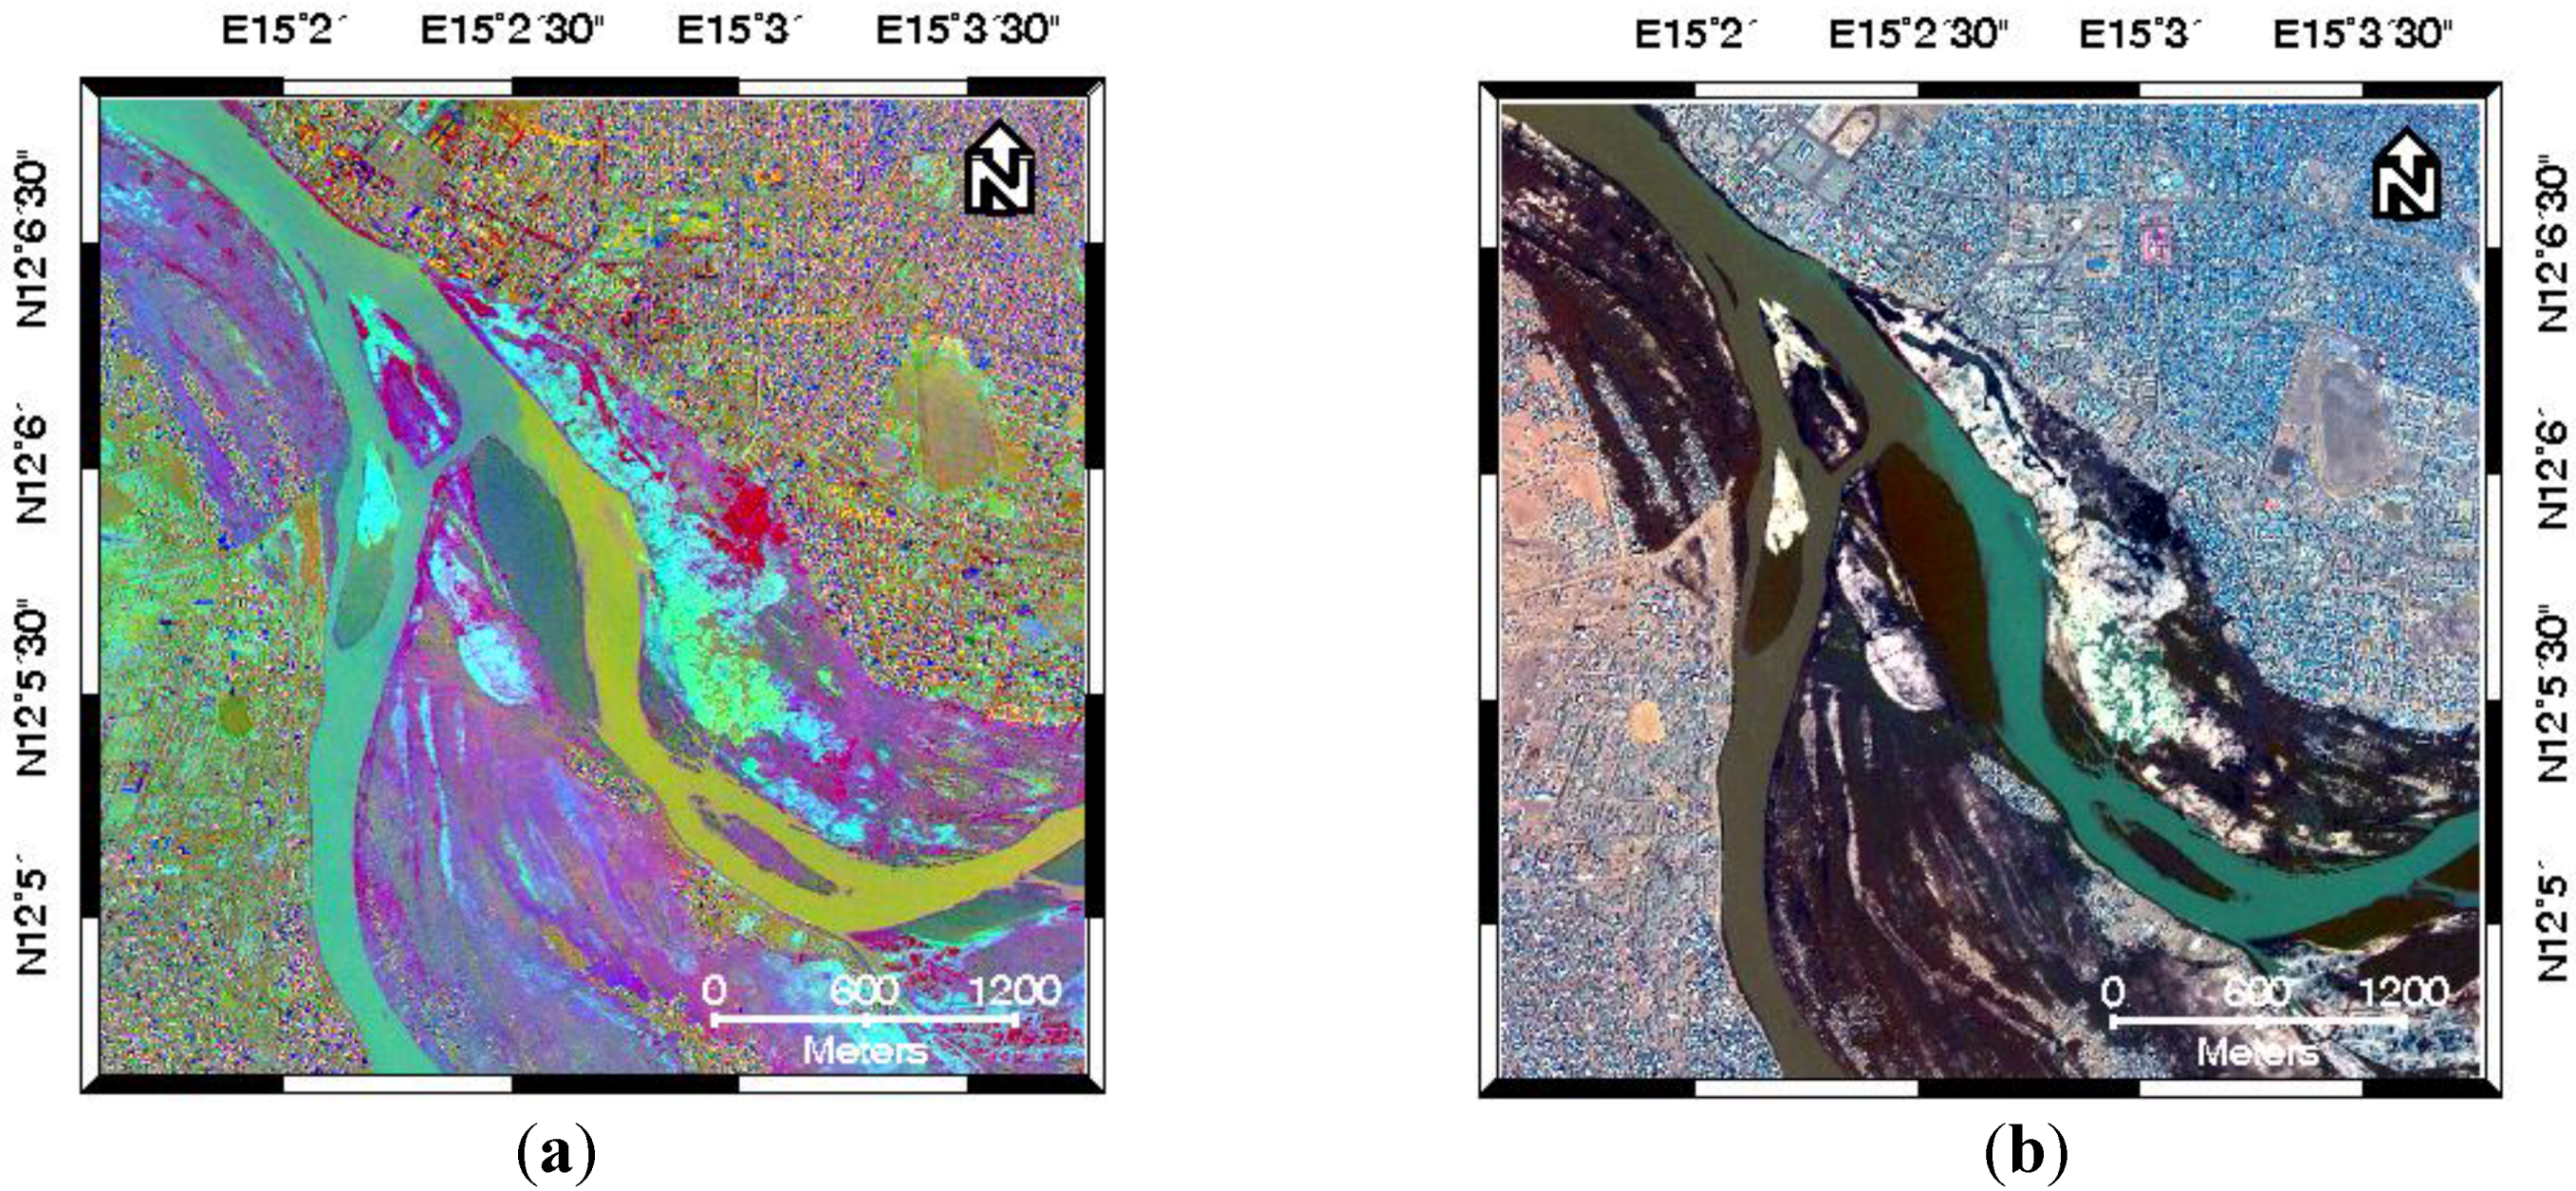
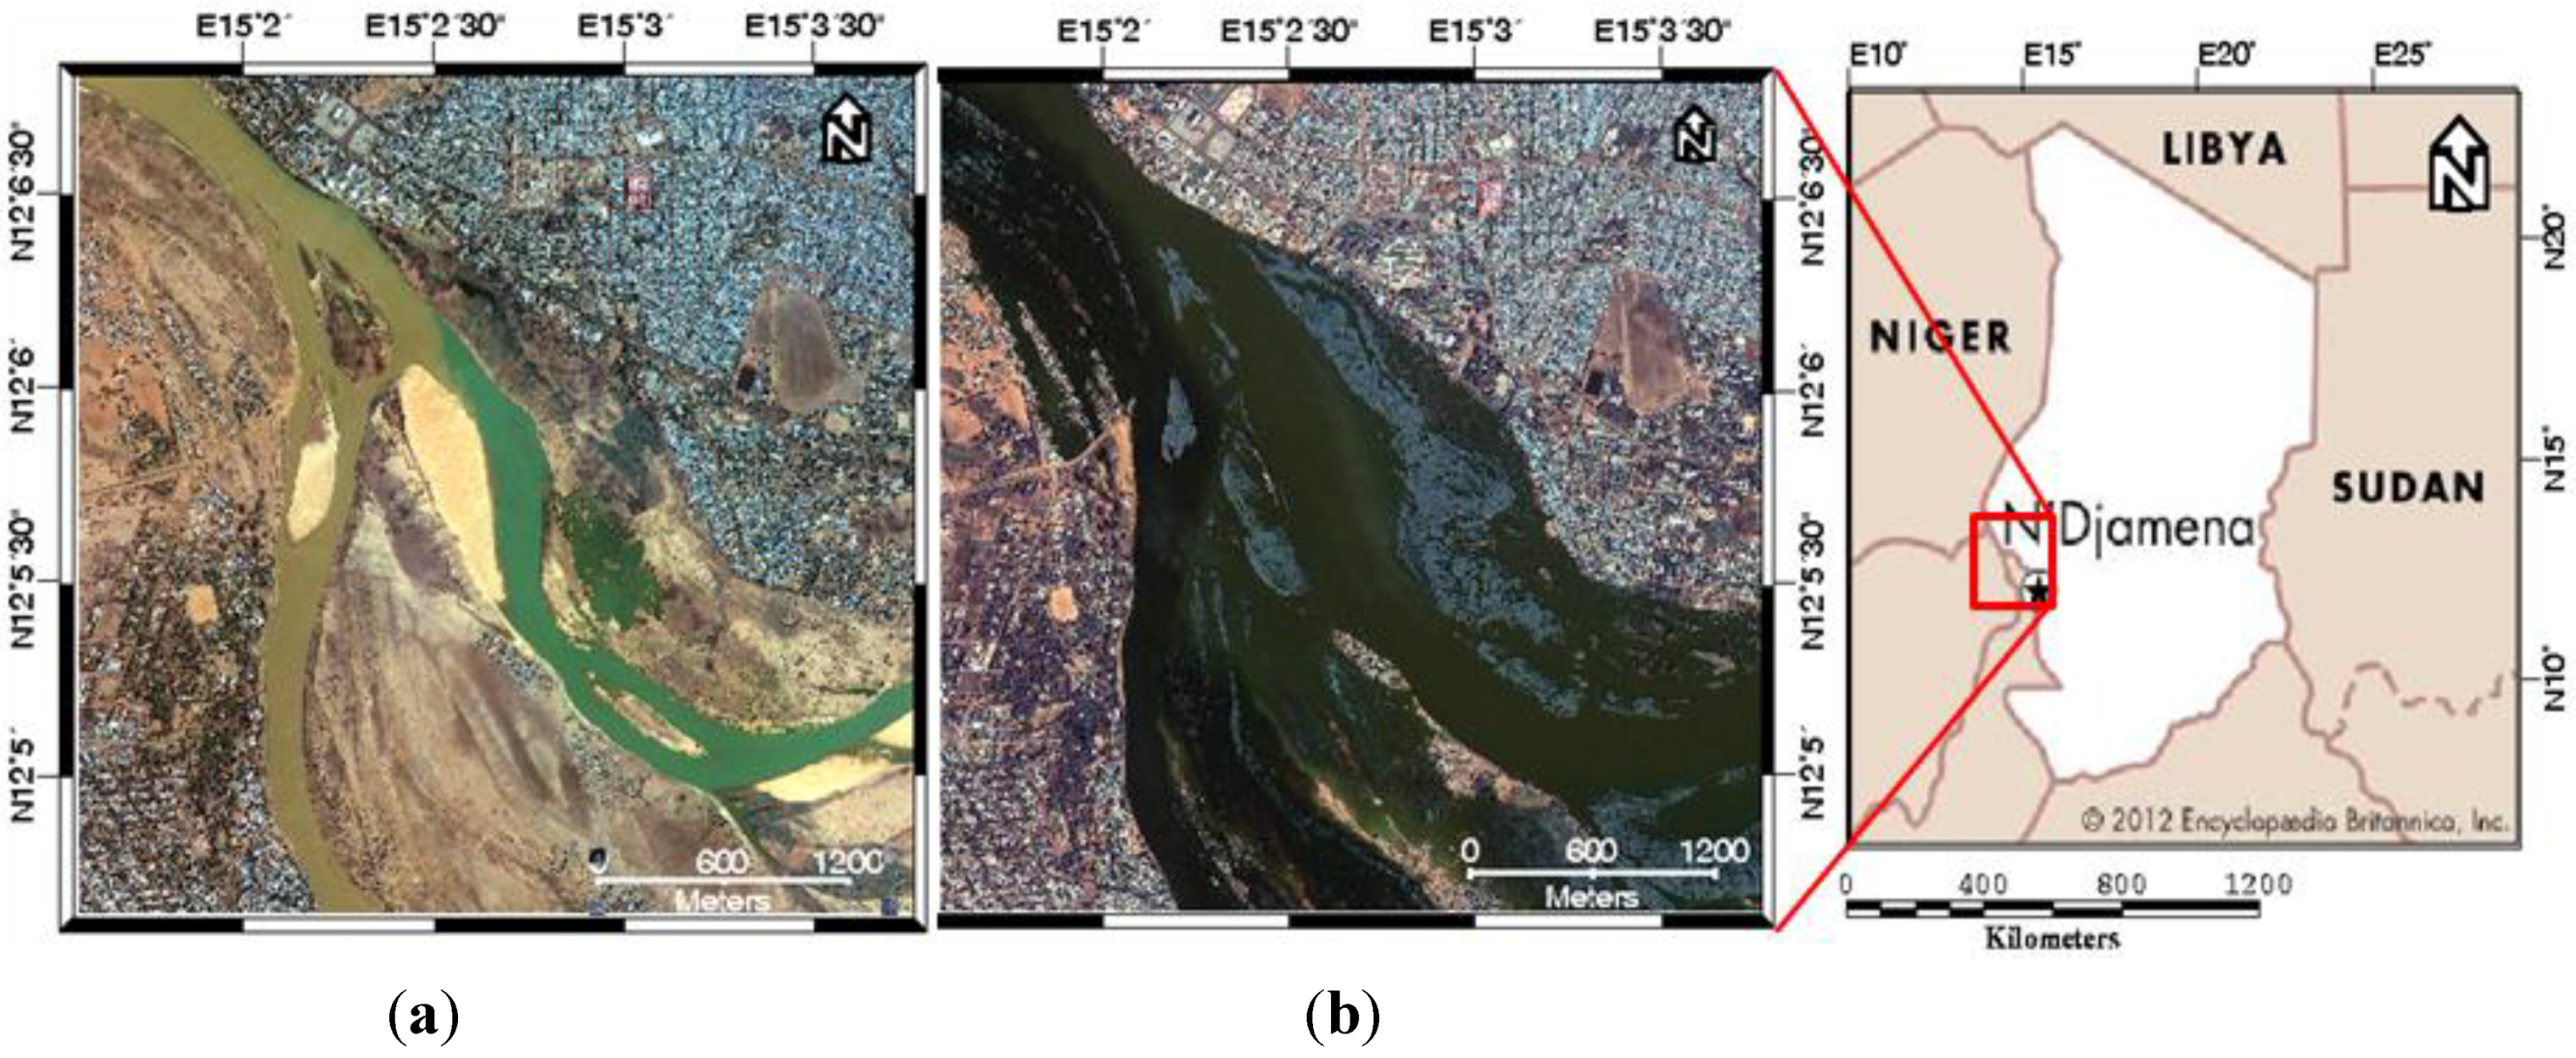
In this study, a bi-temporal dataset acquired by KOMPSAT-2 satellite over the city of N′djamena in Chad is used to evaluate the performance and feasibility of our methodology. The N′djamena is the largest city of Chad and the topography of this region is relatively flat. In this region, flooding along the river is a frequent consequence of heavy rainfall caused by tropical cyclones. The images were acquired on 22 June 2010 and 14 October 2012, respectively. The specifications of the data are described in
Table 1. Even though two images in the scene were acquired with a two-year gap, the scene mutually exhibits a high proportion of changes due to the significant flooding event as shown in
Figure 1. Since the images were taken with different off-nadir angles, they show geometric dissimilarity. In order to solve this problem, it is necessary to geo-reference the dataset to common coordinate system using image registration technique. We manually co-registered the images implemented by ENVI image processing software, with a result of root mean square error (RMSE) around 0.5 pixels.
Figure 1.
The fused images using GSA image fusion method: (a) the F1 GSA-fused image generated from the KOMPSAT-2 satellite images collected before the flood event and (b) the F2 GSA-fused image generated from the KOMPSAT-2 satellite images collected after the flood event.
Figure 1.
The fused images using GSA image fusion method: (a) the F1 GSA-fused image generated from the KOMPSAT-2 satellite images collected before the flood event and (b) the F2 GSA-fused image generated from the KOMPSAT-2 satellite images collected after the flood event.
Table 1.
KOMPSAT-2 satellite data characteristics.
Table 1.
KOMPSAT-2 satellite data characteristics.
| | Before Flood Event | After Flood Event |
|---|
| Acquisition date | 22/06/2010 | 14/10/2012 |
| Image size (pixels) | PAN: 4000 × 4000 | MS: 1000 × 1000 |
| MS: 1000 × 1000 | MS: 1000 × 1000 |
| Spatial resolution | PAN: 1 m | PAN: 1 m |
| MS: 4 m | MS: 4 m |
| Radiometric resolution | 10 bit | 10 bit |
| off-nadir angle | 2° | 24° |
| Processing level | Level 1R | Level 1R |
3. Change Detection Approach Based on Cross-Fused Image
Unlike classical unsupervised change detection methods, which are generally fulfilled based on the difference images, our approach is based on analysis of spectral distortion that occurs during image fusion process. Image fusion is defined as the process of combining relevant information from two or more images into a single image [
26]. When the fused image is generated from the images acquired at different times, it is inevitable to occur the spatial and spectral distortions within the image due to the dissimilarity between the multi-temporal images. In this case, the spectral-distorted area of the fused image can be considered as a candidate of the changed area. Within this framework, we focus on the discrimination between two opposite classes associated with changed and unchanged pixels caused by flooding from the fused image. Let us consider that two VHR satellite datasets
and
are consist of a panchromatic (PAN) and four-band multispectral (MS) images. The
and
datasets are acquired in the same geographical area at different times
and
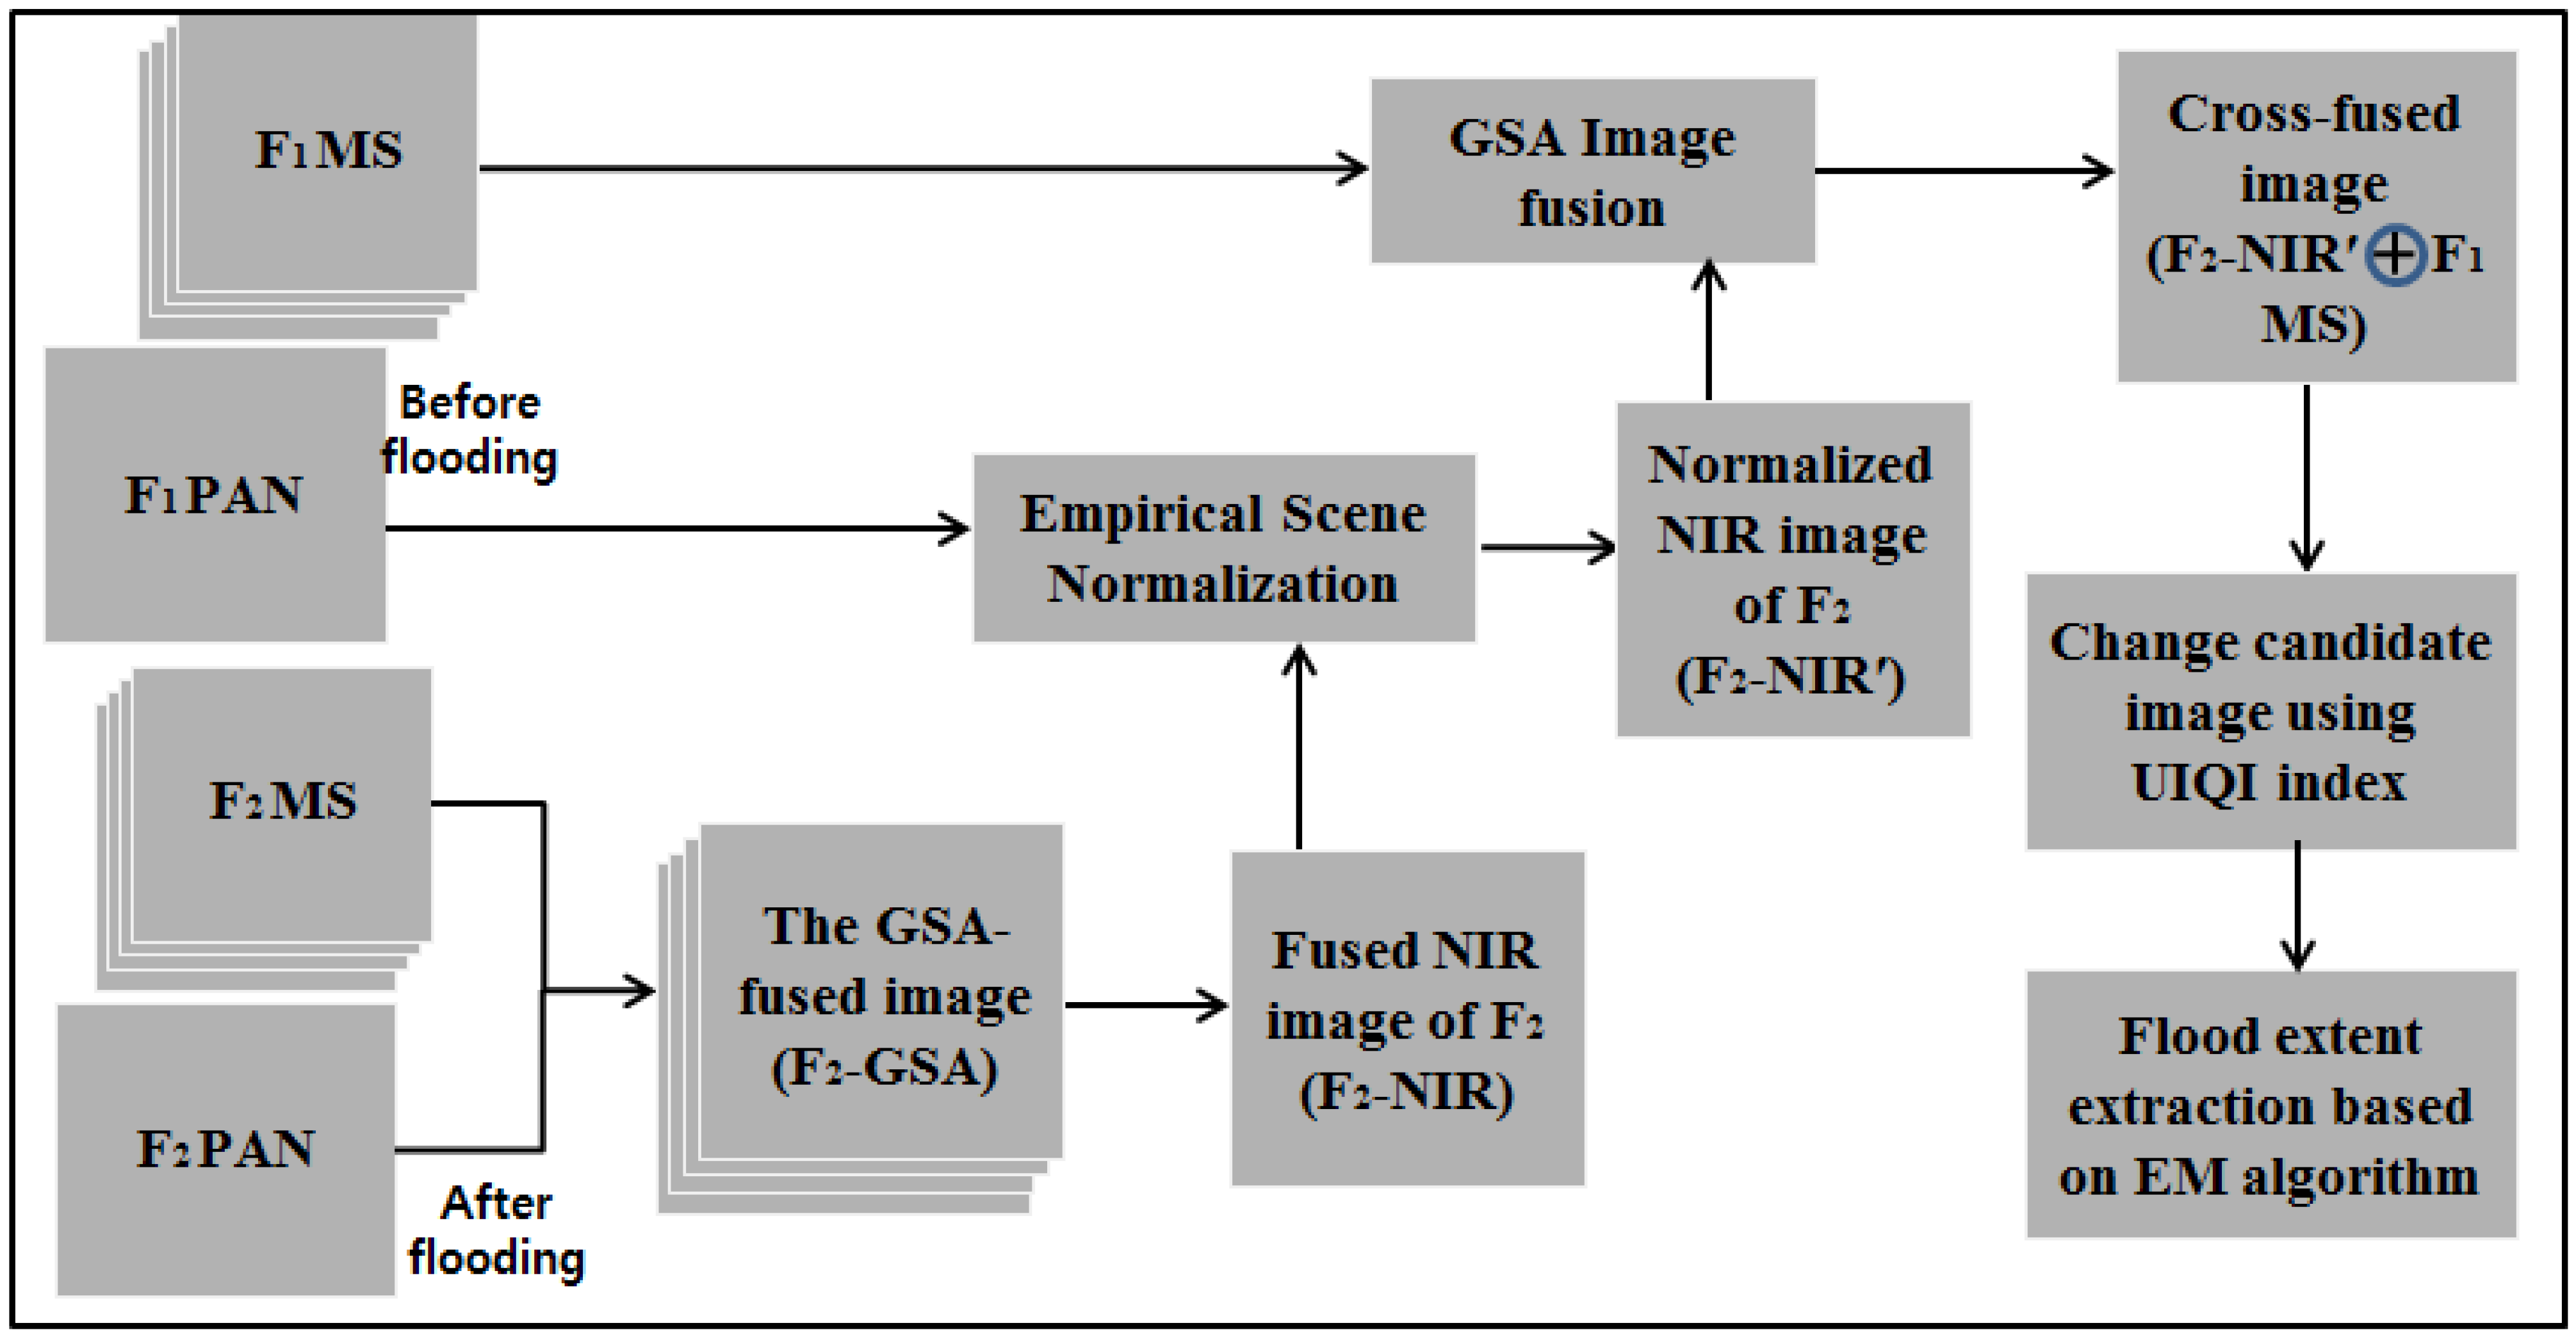
, before and after flooding. To better understand the concept and procedure of the proposed change detection technique, a schematic diagram is given in
Figure 2. Each step of the procedure is explained in detail as follows.
Figure 2.
Conceptual workflow of the proposed methodology for flood extent extraction using bi-temporal VHR satellite images.
Figure 2.
Conceptual workflow of the proposed methodology for flood extent extraction using bi-temporal VHR satellite images.
3.1. Gram-Schmidt Adaptive (GSA) Image Fusion
Spatial resolution of MS images is usually slightly lower than that of PAN image captured by the same satellite. Generally, image fusion methods aim to improve the spatial information of the original MS images by using the spatial details of the VHR PAN image in situations where we cannot obtain ideal VHR MS images due to the technical limitations of certain satellite sensor [
26]. Most of image fusion methods are based on a general protocol, which can be broadly summarized in two steps: (1) extraction of high-frequency spatial information from the PAN image; and (2) injection of such spatial details into the resized MS images by exploiting different models [
27]. A general fusion framework protocol can be defined as [
28]
where
is the fused image of the
nth band,
is the resized MS image of the
nth band that is resampled to the same spatial resolution of PAN.
is the PAN image,
is the synthetic image having an equivalent spatial resolution with
, and
determines the amount of spatial detail that is added to the resized MS bands.
A GSA is a representative component substitution (CS)-based fusion algorithm. It denotes a case in which
is determined by performing multivariate linear regression procedure between the resized MS data set and the PAN image, while
is determined as proportional to the covariance value between the
and the resized MS bands [
29]. According to the concept of GSA image fusion method, we generate the fused image for
satellite (
-GSA) dataset taken after the flood event.
3.2. Empirical Scene Normalization
The near infrared (NIR) image band is a useful information source for detecting flooded areas. The flooded area generally appears very dark in this NIR band in which water has strong absorption characteristic. The idea of this paper is based on the assumption that if the MS image is fused with the NIR band of , it may produce serious spectral distortion in the flooded areas in the fused image. The NIR band is directly extracted from the GSA-fused image of for the generation of a cross-fused image.
Before the generation of the cross-fused image, the
NIR image band is required to minimize the radiometric difference with
dataset (
i.e., images acquired before the flood event) caused due to the different atmospheric conditions, solar illumination, and view angles. In this paper, we used the empirical line calibration (ELC) method [
30] for the radiometric normalization between the
NIR image band and
PAN image. This method involves the selection of pseudo-invariant features (PIFs) whose reflectance values are nearly invariant over time. The 10 PIFs were manually selected throughout the study area. The
NIR image band was radiometrically normalized to
PAN image using the derived regression from the selected PIFs, and the normalized
NIR′ image band was finally used to generate the cross-fused image.
3.3. Cross-Fused Image Generation
The GSA is a well-known CS-based fusion method that can effectively inject the spatial details into the fused image. The major drawback of CS-based fusion method is spectral distortion, also called the color (or radiometric) distortion. It is characterized by a trend to present a predominance of a color on the others. This spectral distortion is caused by the mismatch between the spectral responses of the MS and PAN bands according to the different bandwidth [
31]. In this paper, we aim to enhance the flood change detection performance by intentionally increasing this spectral distortion in the flooded regions. To this end, as aforementioned in
Section 3.2, we use the
NIR′ image band instead of
PAN image in order to generate the cross-fused image. The fused image brings the effect of significant spectral distortion in the flooded areas while maintaining the radiometric characteristic of the permanent water body. This is because the level of mismatch of spectral response is very severe outside of the NIR spectral range; the bandwidth of NIR band is much narrower compared to that of the PAN image. This characteristic helps to distinguish permanent water bodies from flooded areas in the process of the flood change detection.
3.4. Generation of Change Candidate Image Using UIQI Index
We consider spectral distortion in the cross-fused image as an indication of changed area. A certain amount of undesirable spectral distortion additionally occurs when the cross-fused image is generated from the two images acquired at different times. The distortion occurs mainly due to some spatial inconsistency and shape disagreement between two images taken from different geometric viewpoints. This may result in substantial false alarms of change in the regions having a high degree of spatial inconsistency, such as densely populated urban area.
To alleviate this problem and quantify the change candidate area, we use the UIQI index, which is the representative window-based spectral distortion measure. It considers context characteristics of local regions, instead of using simple pixel difference-based measures such as mean square error (MSE) and signal-to-noise ratio (SNR). The UIQI index is easy to calculate and has robust characteristic against several types of image noise such as white Gaussian, salt and pepper, mean shift, and multiplicative noises [
32]. Generally, the pixel-based and statistic-oriented change detection measures are sensitive to image noise, because they focus mainly on the spectral value and mostly ignore the spatial context [
33].
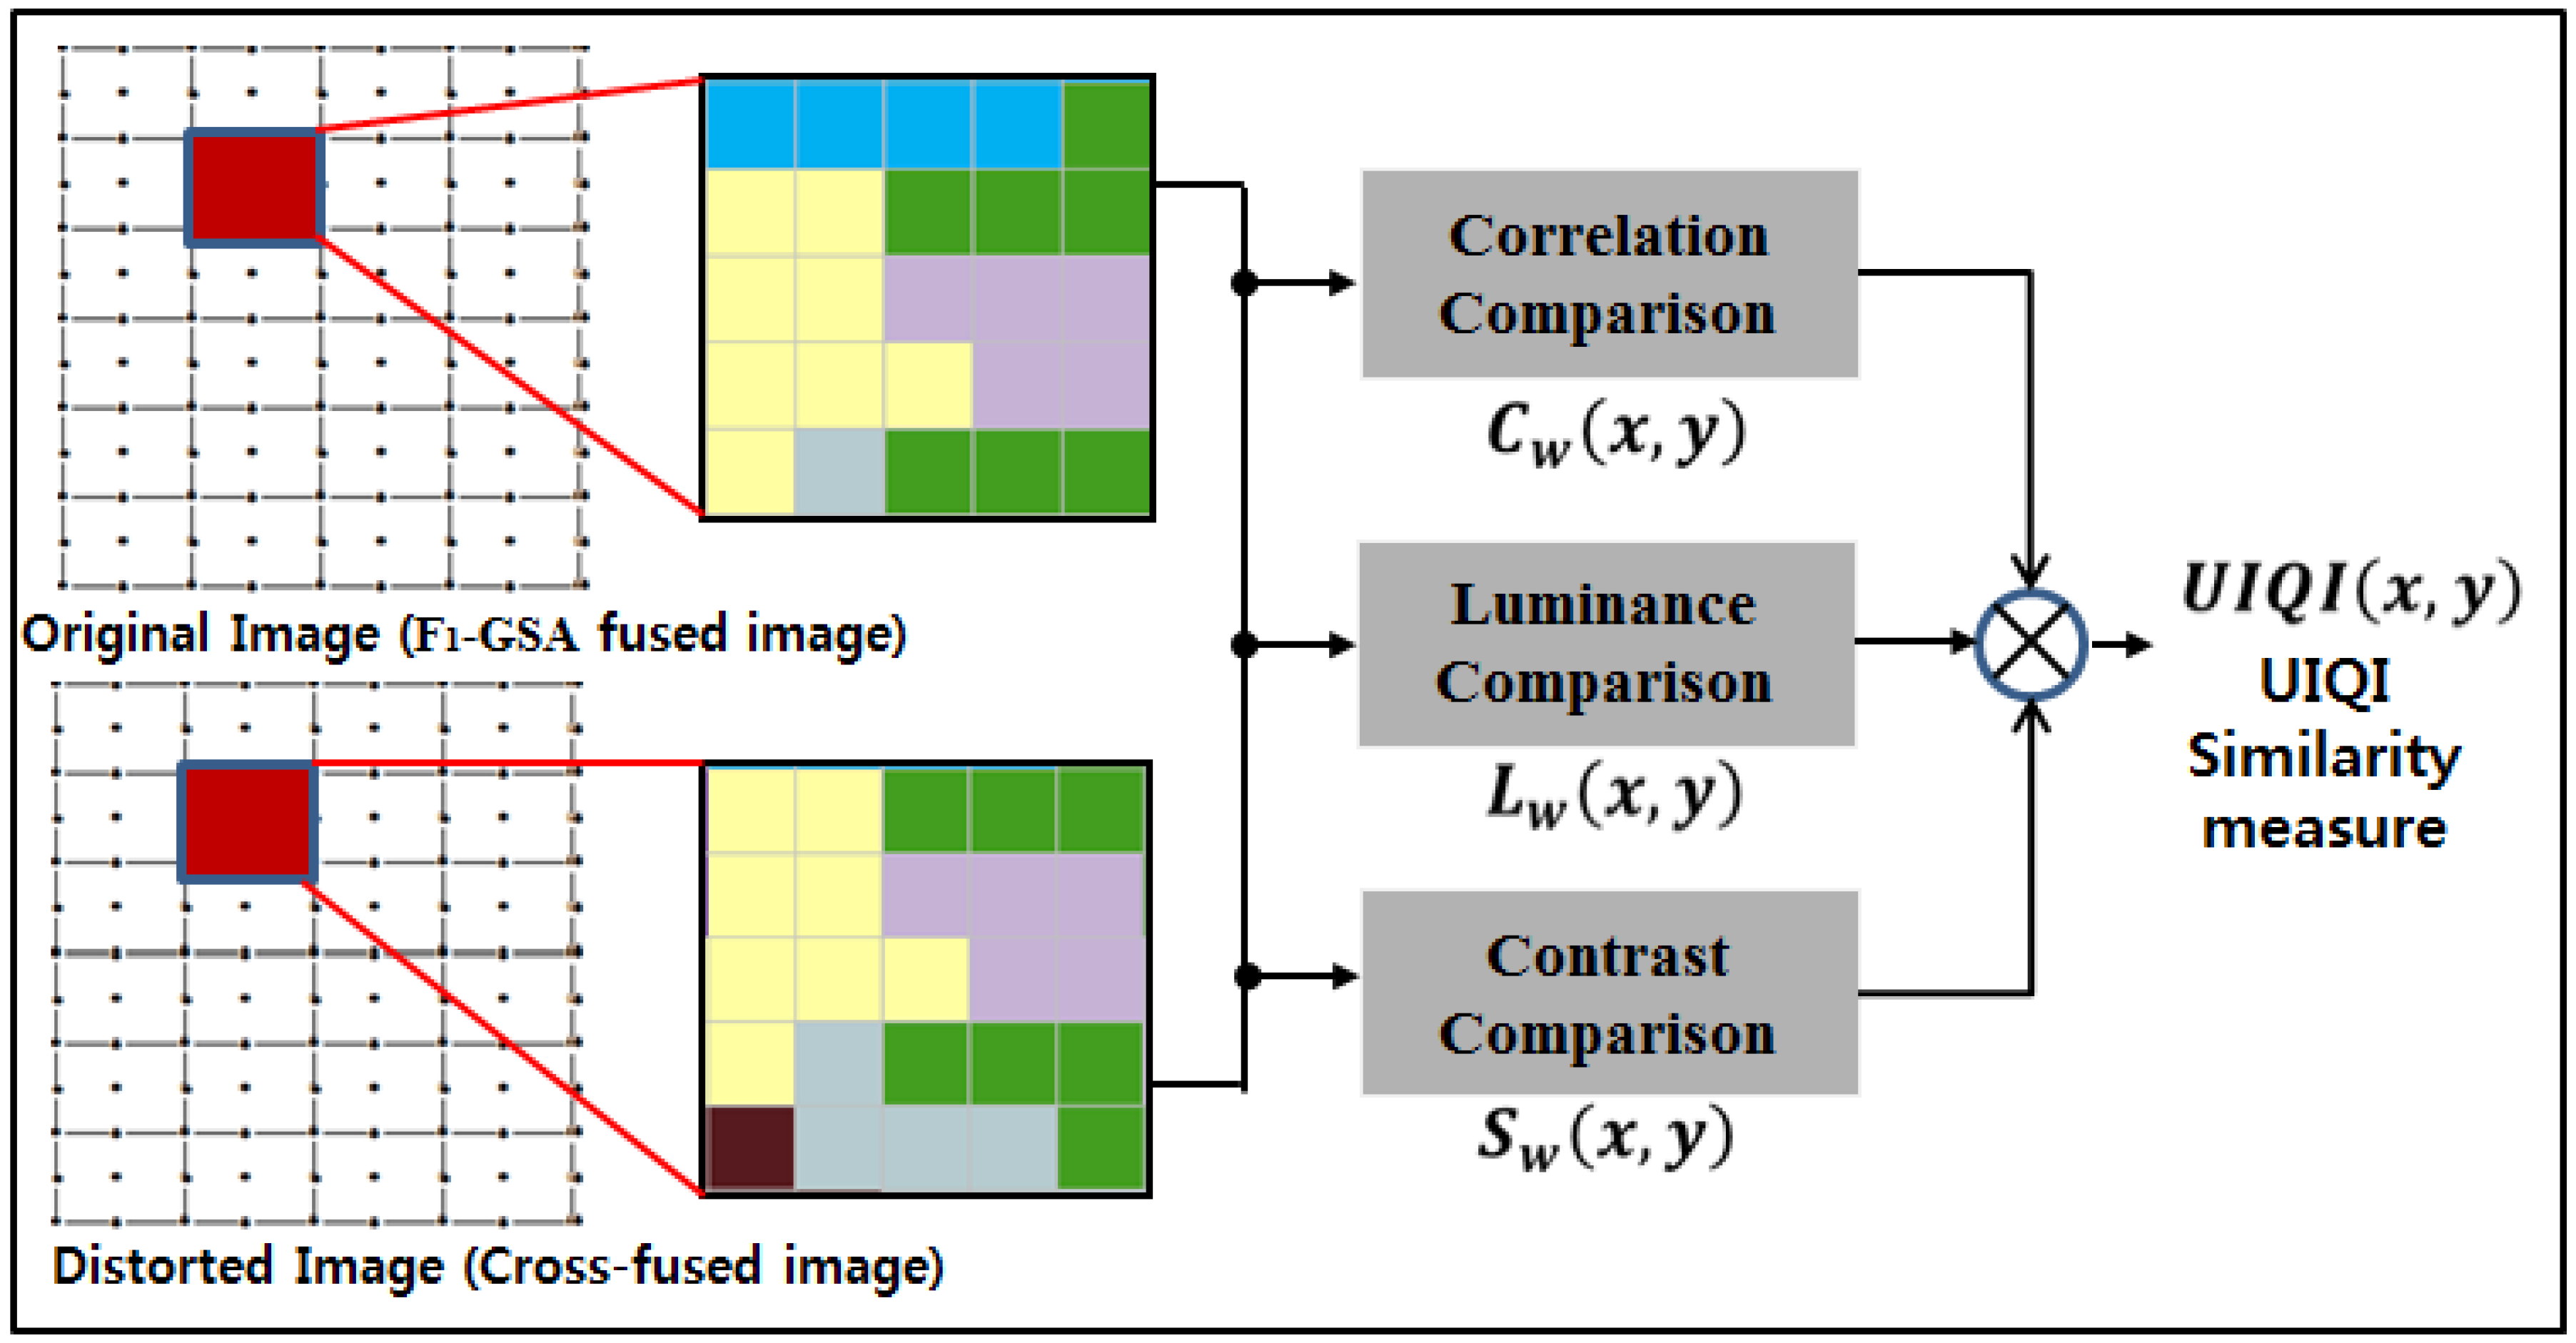
We employed the UIQI index to measure the distortion between original and distorted images with a combination of three factors: loss of correlation
, luminance distortion
, and contrast distortion
[
32]. The first component
is the correlation coefficient between the original and distorted images in the window mask, which is the measure of linear correlation. Its range extends from −1 to 1, and the best value is obtained when the distorted image is equal to the original image. The second component
measures the mean luminance between the two images, and its range is [0 1]. This component has the maximum value when the means of the images are the same. The variance of the signal can be viewed as an estimation of contrast. Thus the third component
measures how similar the contrasts of the two images are. Its range of values is also [0 1], and the best value is achieved when the variances are equal.
The UIQI index is applied using local moving window of size
. It moves over the entire image, pixel by pixel along the horizontal and vertical directions. The UIQI value at a generic position
of individual bands is calculated as:
where
and
denote the mean values of original and distorted images within the window mask, and
and
are the variance values of original and distorted images within the window mask, respectively.
is the covariance between two images within the mask.
According to the property of three factors, the UIQI value takes high values in undistorted areas and low values in distorted ones within the range [−1, 1]. This index has an advantage by taking into account local spatial properties,
i.e., luminance, contrast, and correlation information, whereas traditional pixel-based similarity measures focus solely on the spectral signature of each pixel. Therefore, this index is worth to be considered for detecting the flood change in VHR bi-temporal images. The UIQI index is computed between the
GSA-fused image (
i.e., fused image by the dataset acquired before the flood event) and the cross-fused image. The illustration of the UIQI measurement is shown in
Figure 3.
Figure 3.
Illustration of the universal image quality index (UIQI) measurement system.
Figure 3.
Illustration of the universal image quality index (UIQI) measurement system.
3.5. Determination of the Final Flooded Area
We applied a thresholding method into the UIQI image in order to assign each image pixel to one of the two opposite classes, namely flooded and un-flooded area. These two classes can be separated as a binary classification problem, where the probability density function
of the image is a mixture of two parametric density functions associated with the flooded and un-flooded classes,
i.e.,
where
and
are the prior probabilities of the flooded and un-flooded classes, and
and
are the class-conditional densities associated with the flooded and un-flooded classes, respectively.
and
are the vectors of parameters on which two parametric class-conditional densities depend. The expectation maximization (EM) algorithm, assuming that the class-conditional densities follow a Gaussian distribution, is an iterative method for finding maximum likelihood or maximum a posteriori (MAP) estimates of parameters in statistical models [
34]. The EM iteration alternates between performing an expectation step and a maximization step; the expectation step creates a function for the expectation of the log-likelihood evaluated using the current estimate for the parameter
and
; the maximization step computes parameters maximizing the expected log-likelihood found on the expectation step. These estimated parameters are then used to determine the given Gaussian variable distribution in the next expectation step. The EM algorithm is sensitive to select initial value of the parameters to be estimated because of the possibility of finding the local maxima for the total likelihood in the parameter space. If these initial values are inappropriately selected, the EM algorithm may lead to an unsatisfactory estimation of the class distribution. To address this issue, several methods are reported in the literature [
35]. In this paper, the EM algorithm is initialized by the result of Otsu’s method [
36]. The final change detection image is generated by exploiting the estimated parameters. The Bayes rule that minimizes the overall error of probability is applied in order to select the decision threshold in the change-detection process.
4. Experimental Result and Accuracy Assessment
In this paper, two experiments were conducted to evaluate the performance and feasibility of our algorithm. In order to check whether the cross-fused image is effective for the extraction of the flood inundation area, we first compared our method with one based on the GSA-fused images of each dataset (
Figure 1), which is now called the MFI method. The MFI method is developed based on the following steps: (1) generate the GSA-fused images in
and
dataset, respectively; (2) calculate the UIQI between the
GSA- and the
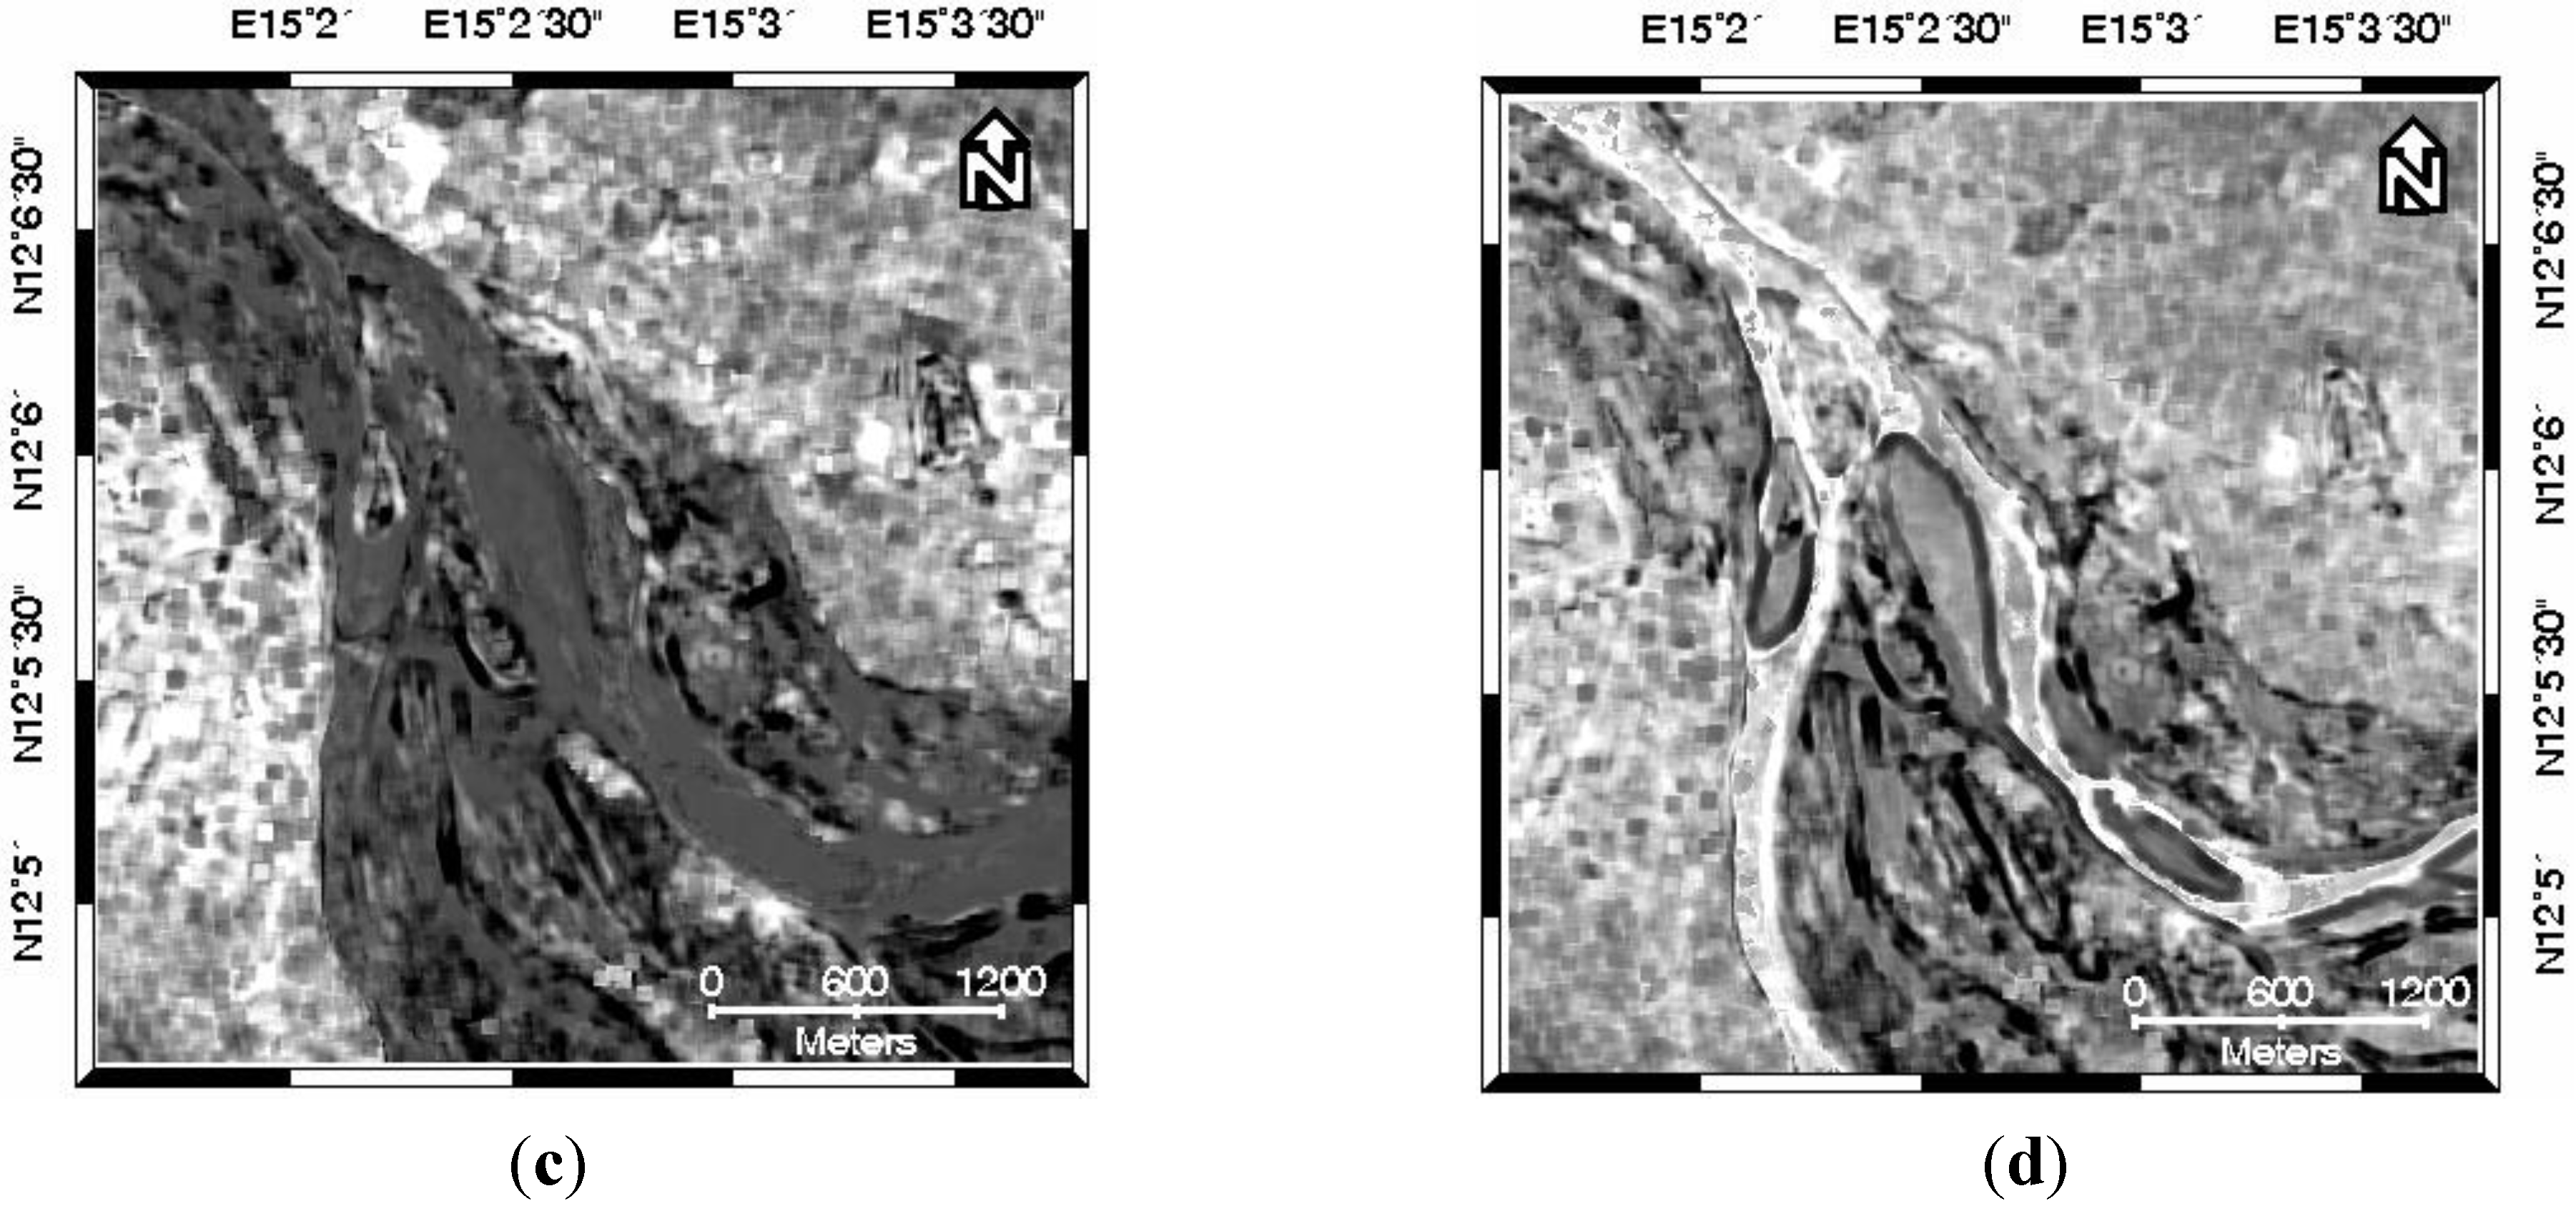
GSA-fused images; (3) determine the changed area using the EM algorithm. The window size for measuring UIQI of both the proposed and the MFI methods was set to 64, and the threshold was automatically selected by applying the EM algorithm to a mean image obtained by averaging UIQI images of individual bands (
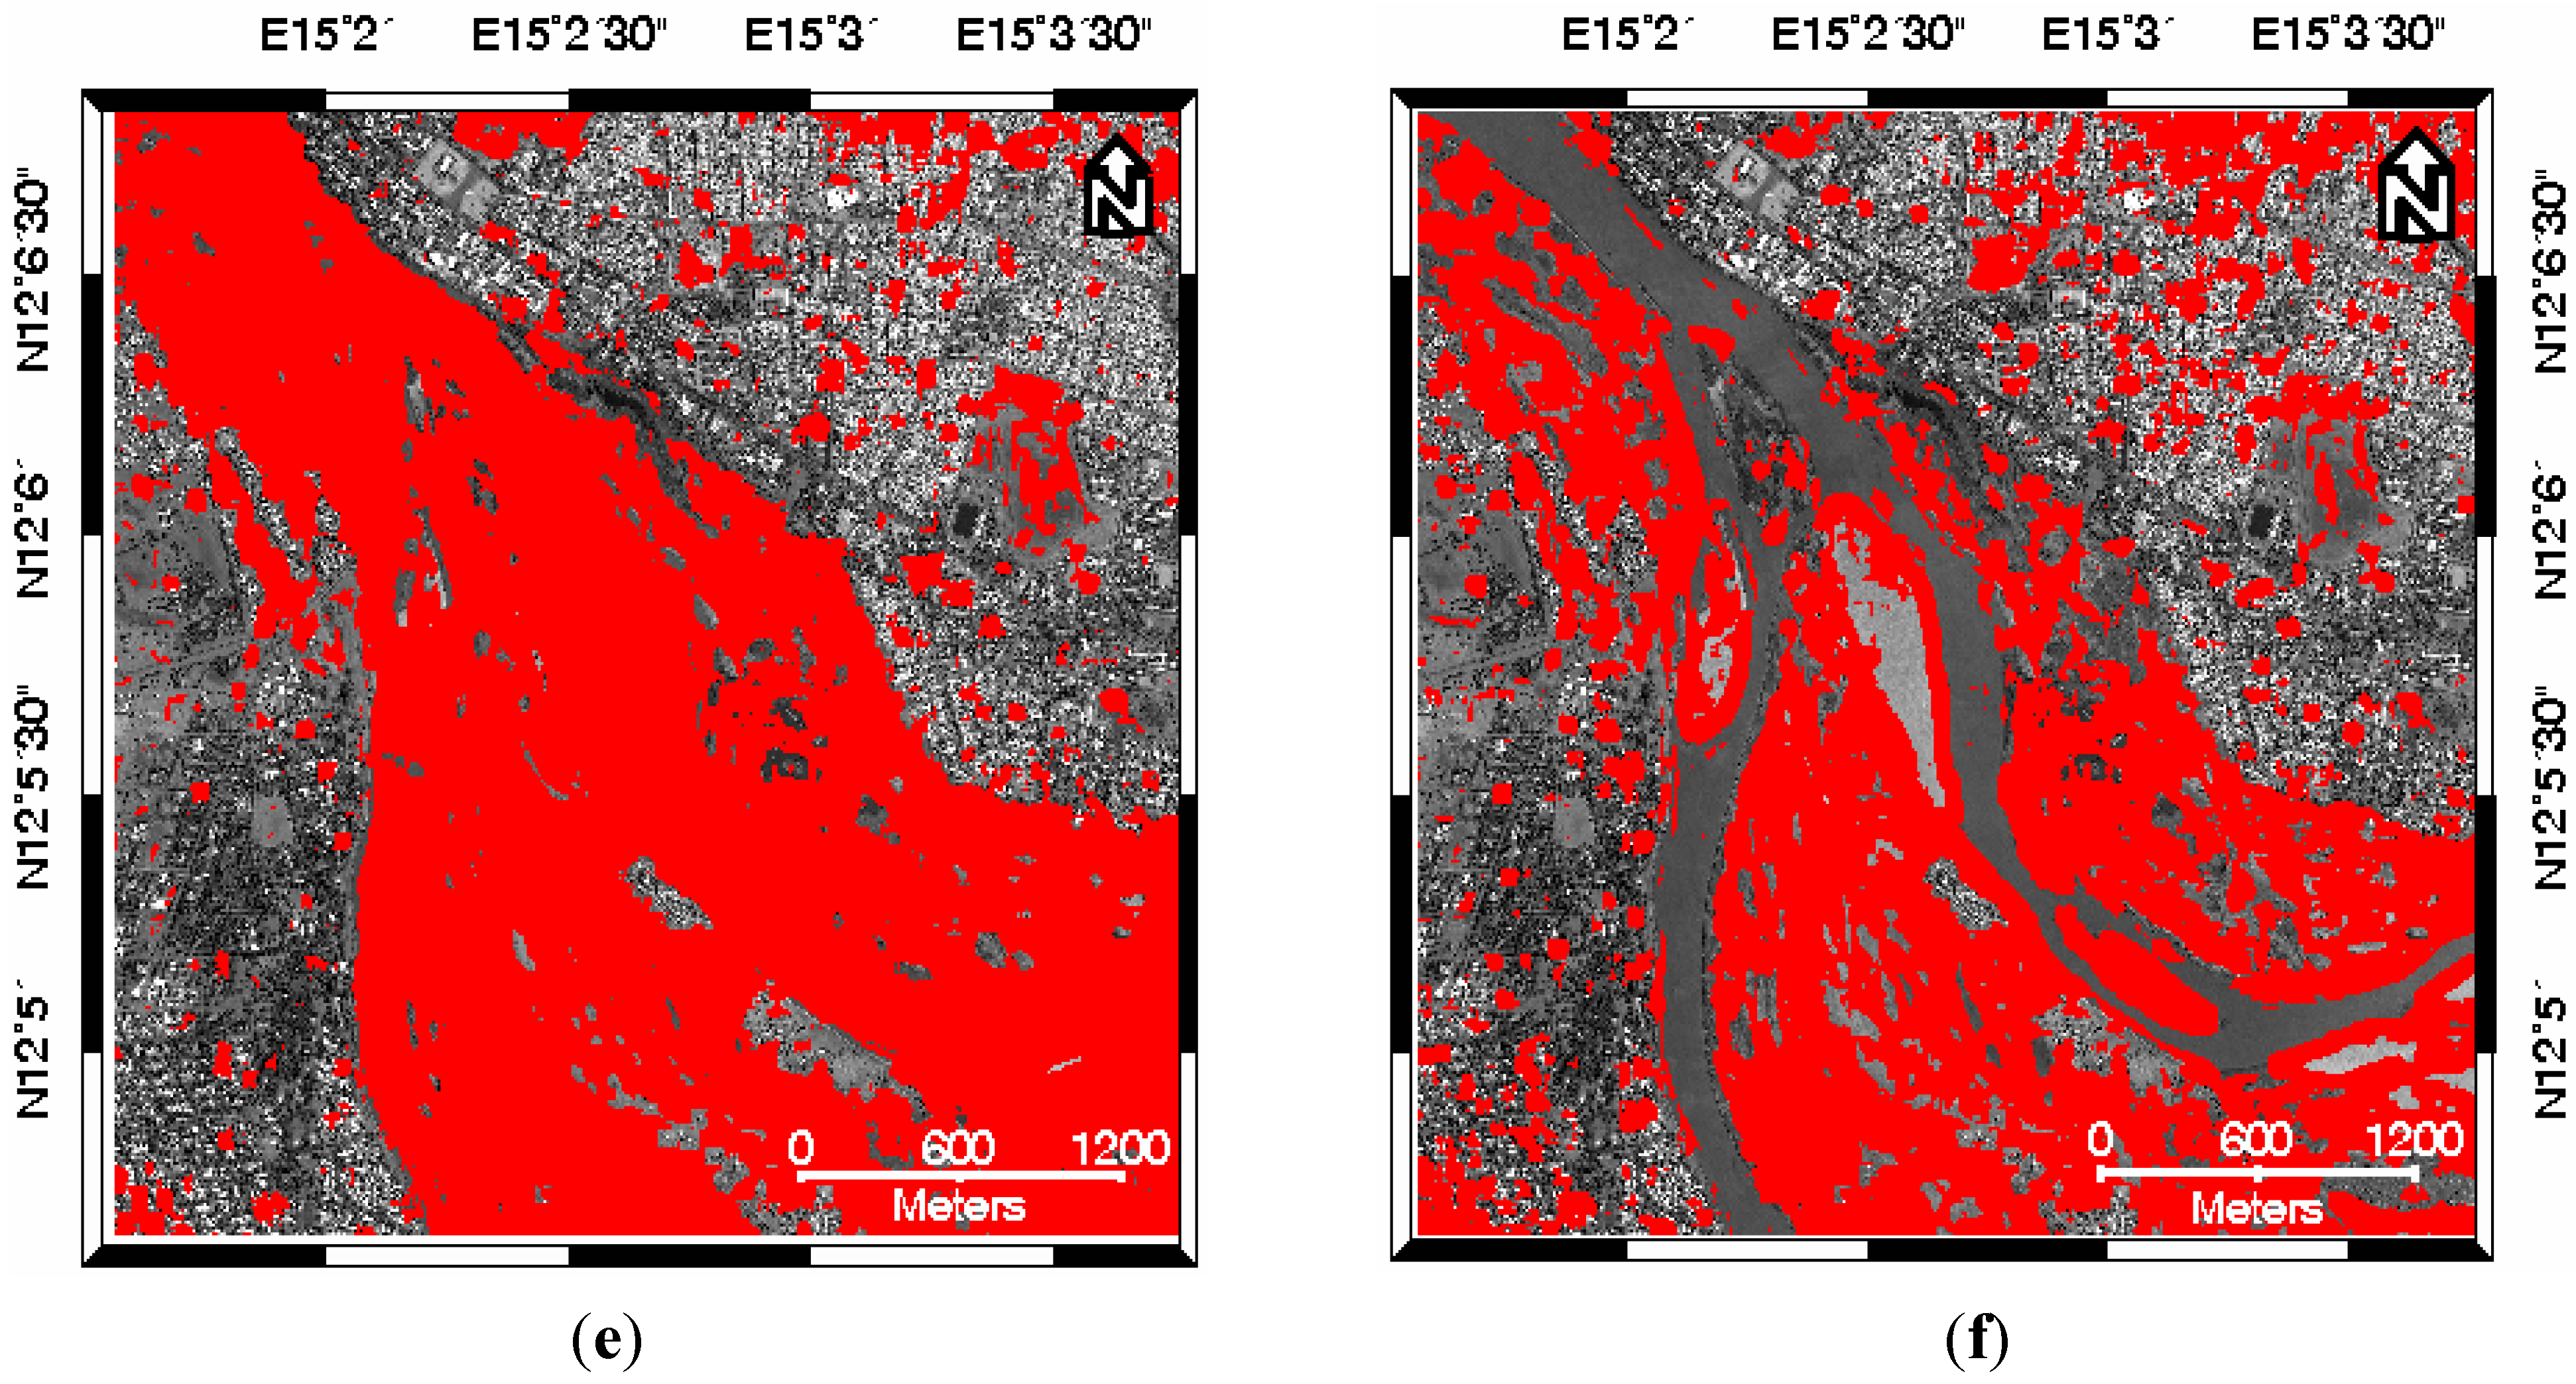
Figure 4). The results of the flood extent extraction obtained by both methods are shown in
Figure 5e,f.
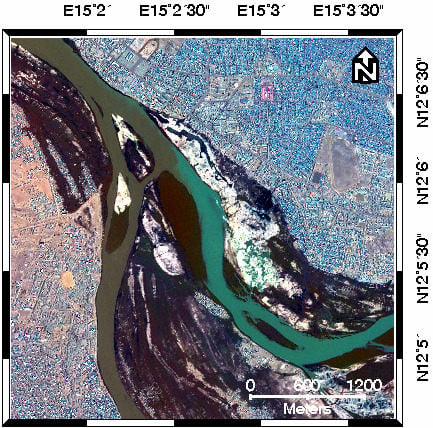
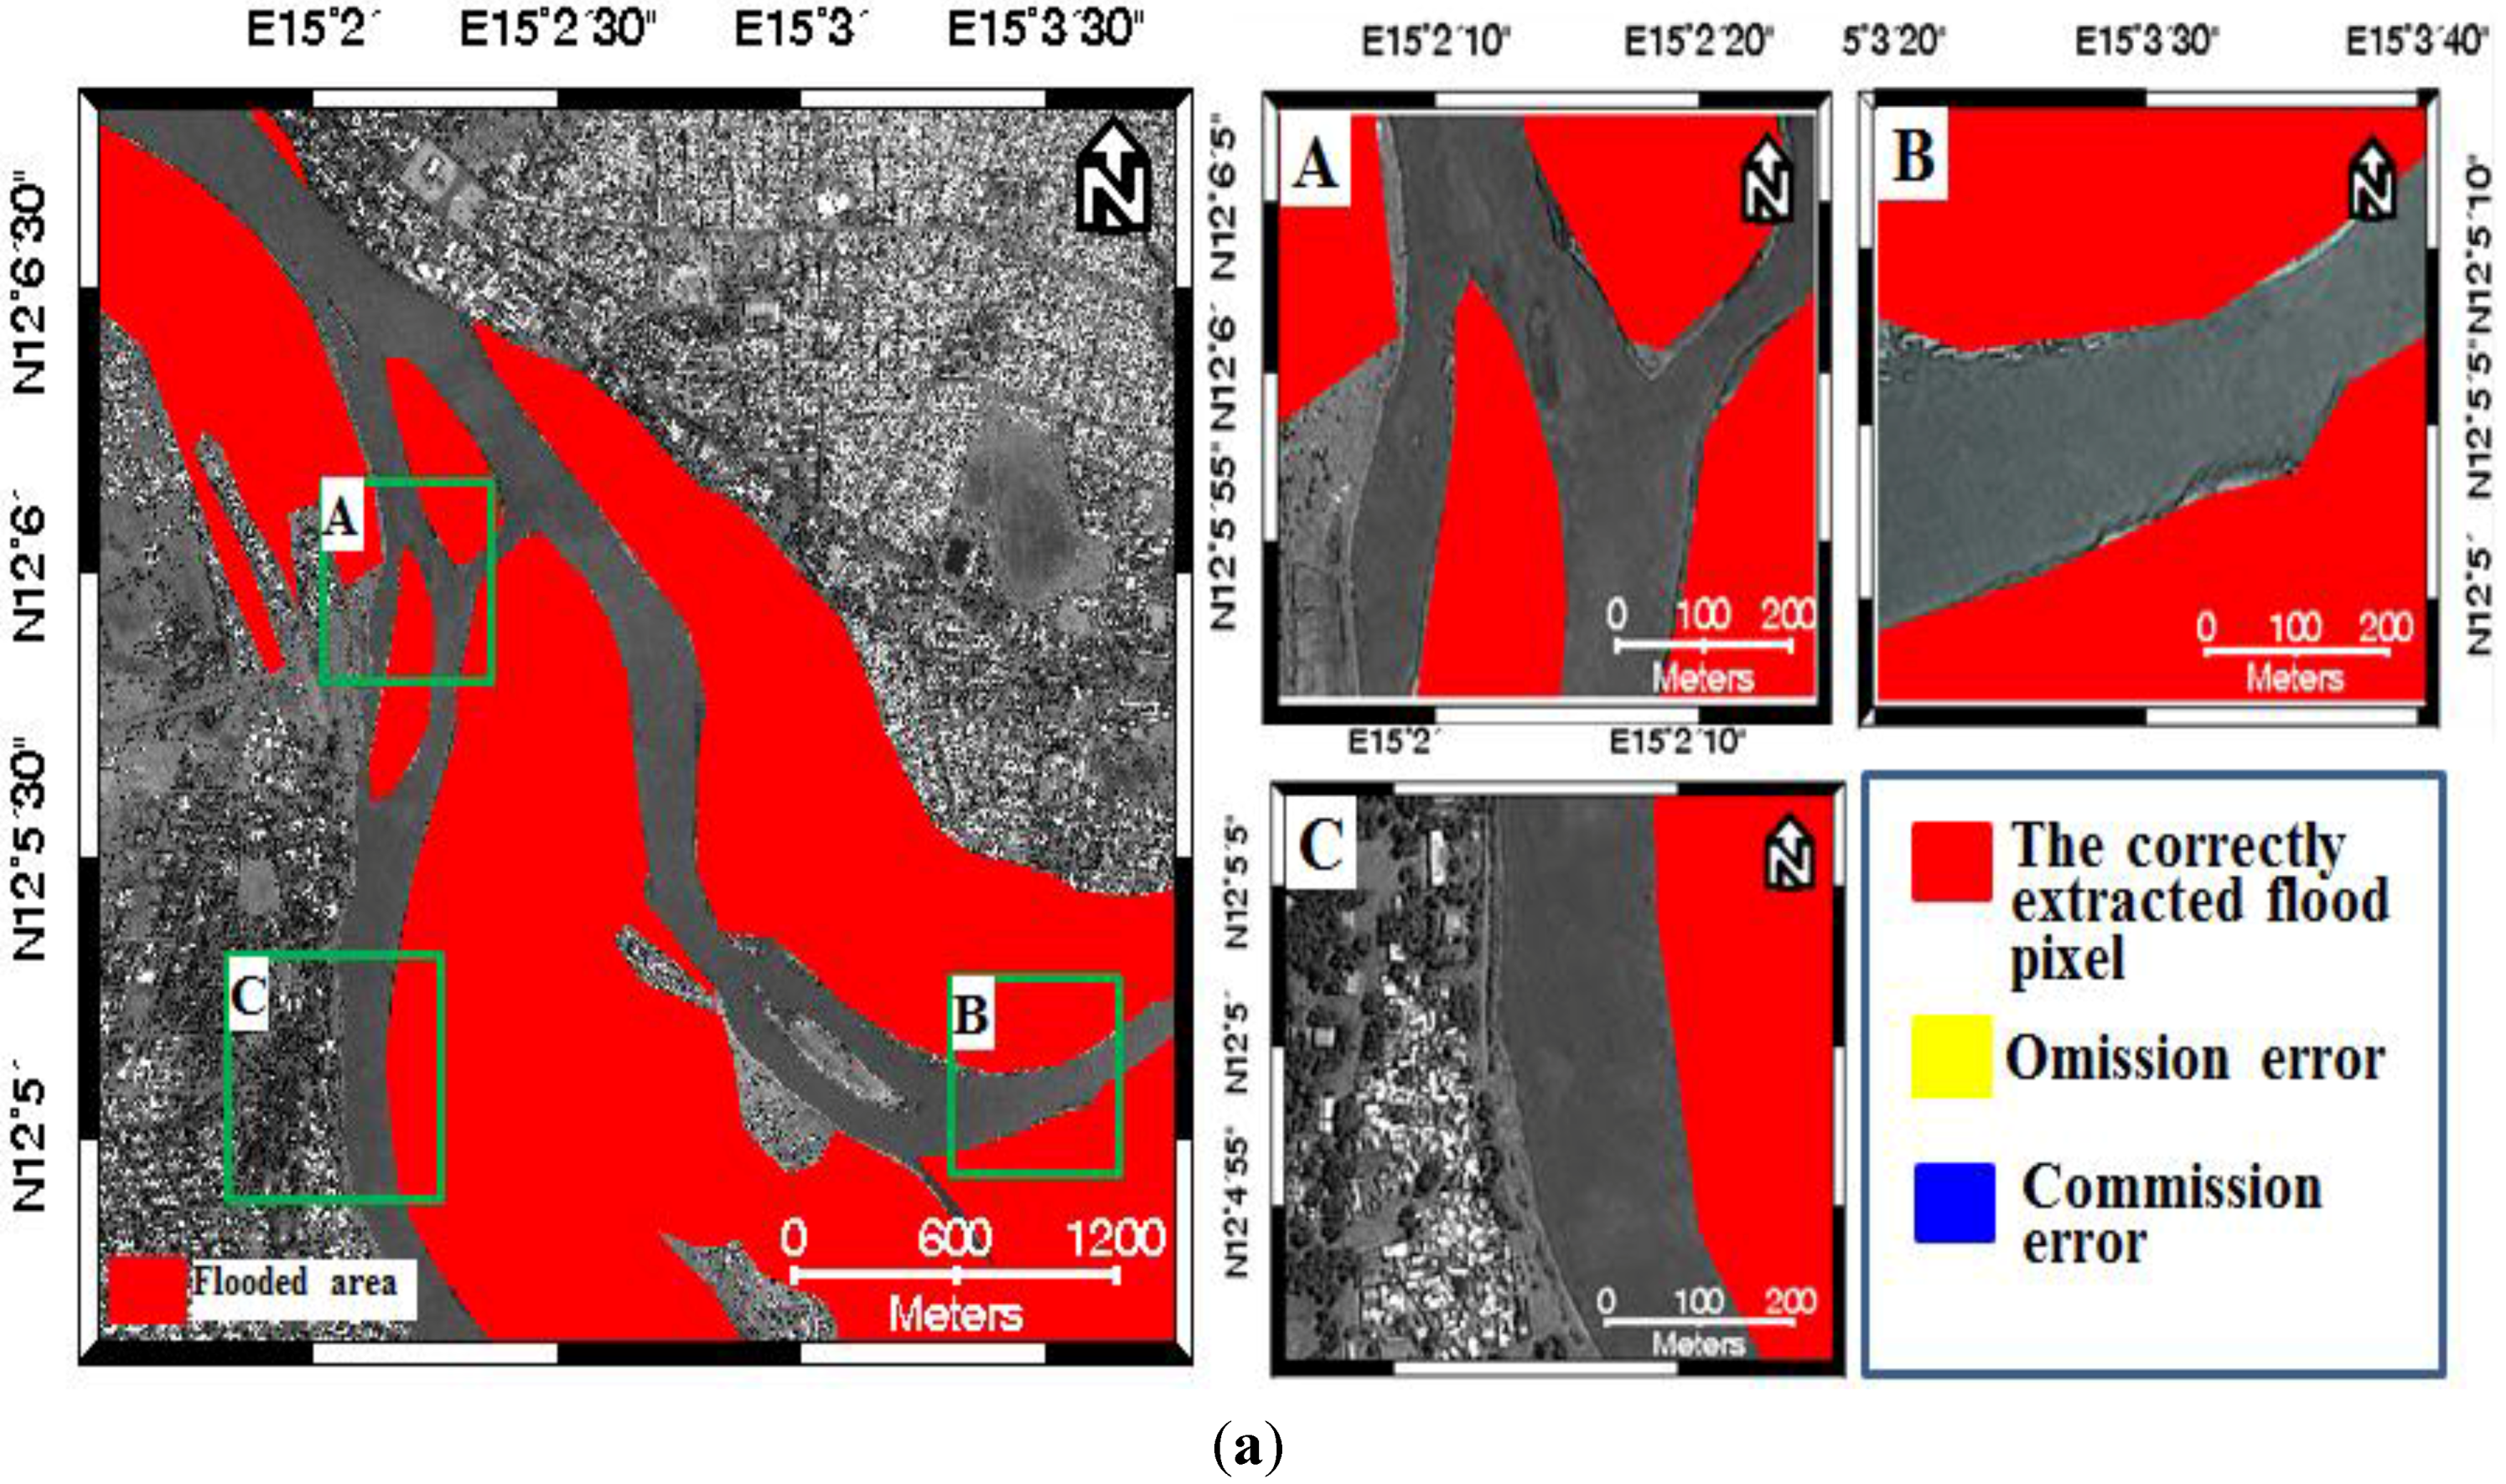
In an effort to evaluate the results with a numerical manner, a ground-truth map was produced from the original image by manually digitizing the flooded area as shown in
Figure 5a. In the construction of the ground-truth map, we only considered the visually flood-affected areas along the river, as not only it is hard to track down all the changes in urban residential district, but also we focus on changes caused by flood. By comparing the ground-truth image with the results of the flood extraction, we can obtain change detection accuracies. In order to evaluate the proposed algorithm, the error matrix method was applied for the accuracy assessment of the tested methodologies. From the error matrices of each tested methodology, the commission error (CE), the omission error (OE), and the overall accuracy (OA) were calculated [
37].
Per the results of the quantitative analysis shown in
Table 2, the MFI method showed the highest OA value, but it is difficult to confirm that this method is better than the proposed method. This is because the result of the MFI method has given too much false detection in the region of the permanent water body compared with the ground-truth image. In other words, the MFI method cannot separate between the permanent water body and the flooded area. From the
Figure 5f, we can see that the use of the cross-fused image allowed a more precise identification of the flooded area and gave a good performance in differentiating the flooded area and the permanent water body.
Figure 4.
The component images generated from the experiment: (a) MAD components (RGB color composite: 4 3 2); (b) the cross-fused image (RGB color composite: 3 2 1); (c) the mean UIQI generated from the MFI method; (d) the mean UIQI generated from the proposed method.
Figure 4.
The component images generated from the experiment: (a) MAD components (RGB color composite: 4 3 2); (b) the cross-fused image (RGB color composite: 3 2 1); (c) the mean UIQI generated from the MFI method; (d) the mean UIQI generated from the proposed method.
As another way to examine the performance of our algorithm, we compared our result to the ones generated from the CVA- , MAD- and SVM-based change detection methods. The original bi-temporal GSA-fused images (
Figure 1) were used as input dataset for the methods. The EM algorithm was applied to the magnitude image for the automatic determination of an optimal decision threshold in the CVA-based change detection method. In the MAD-based change detection method, a multi-level thresholding based on the EM algorithm was applied to the mean of the MAD components for the optimal selection of two thresholds; the pixel value greater than the upper threshold or less than the lower threshold was determined as the final flooded pixel [
38]. To apply the SVM-based method, training pixels for the classes of both flooded and un-flooded pixels should be selected on the multispectral difference image. This has been done through a visual inspection. When using the SVM-based method, the user faces many possible choices of kernel functions commonly yielding different results. In this paper, we used Radial Basis Function (RBF), which handles the case in which the relationships between class labels and attributes were nonlinear. A gamma value to determine the RBF kernel width and a penalty parameter to control the margin error were set at 0.333 and 100, respectively.
Figure 5 and
Figure 6 show the results of change detection with different methods, and the detailed quantitative results are given in
Table 2.
Figure 5 includes the whole study area, allowing an initial visual assessment of the results of flood extent extraction.
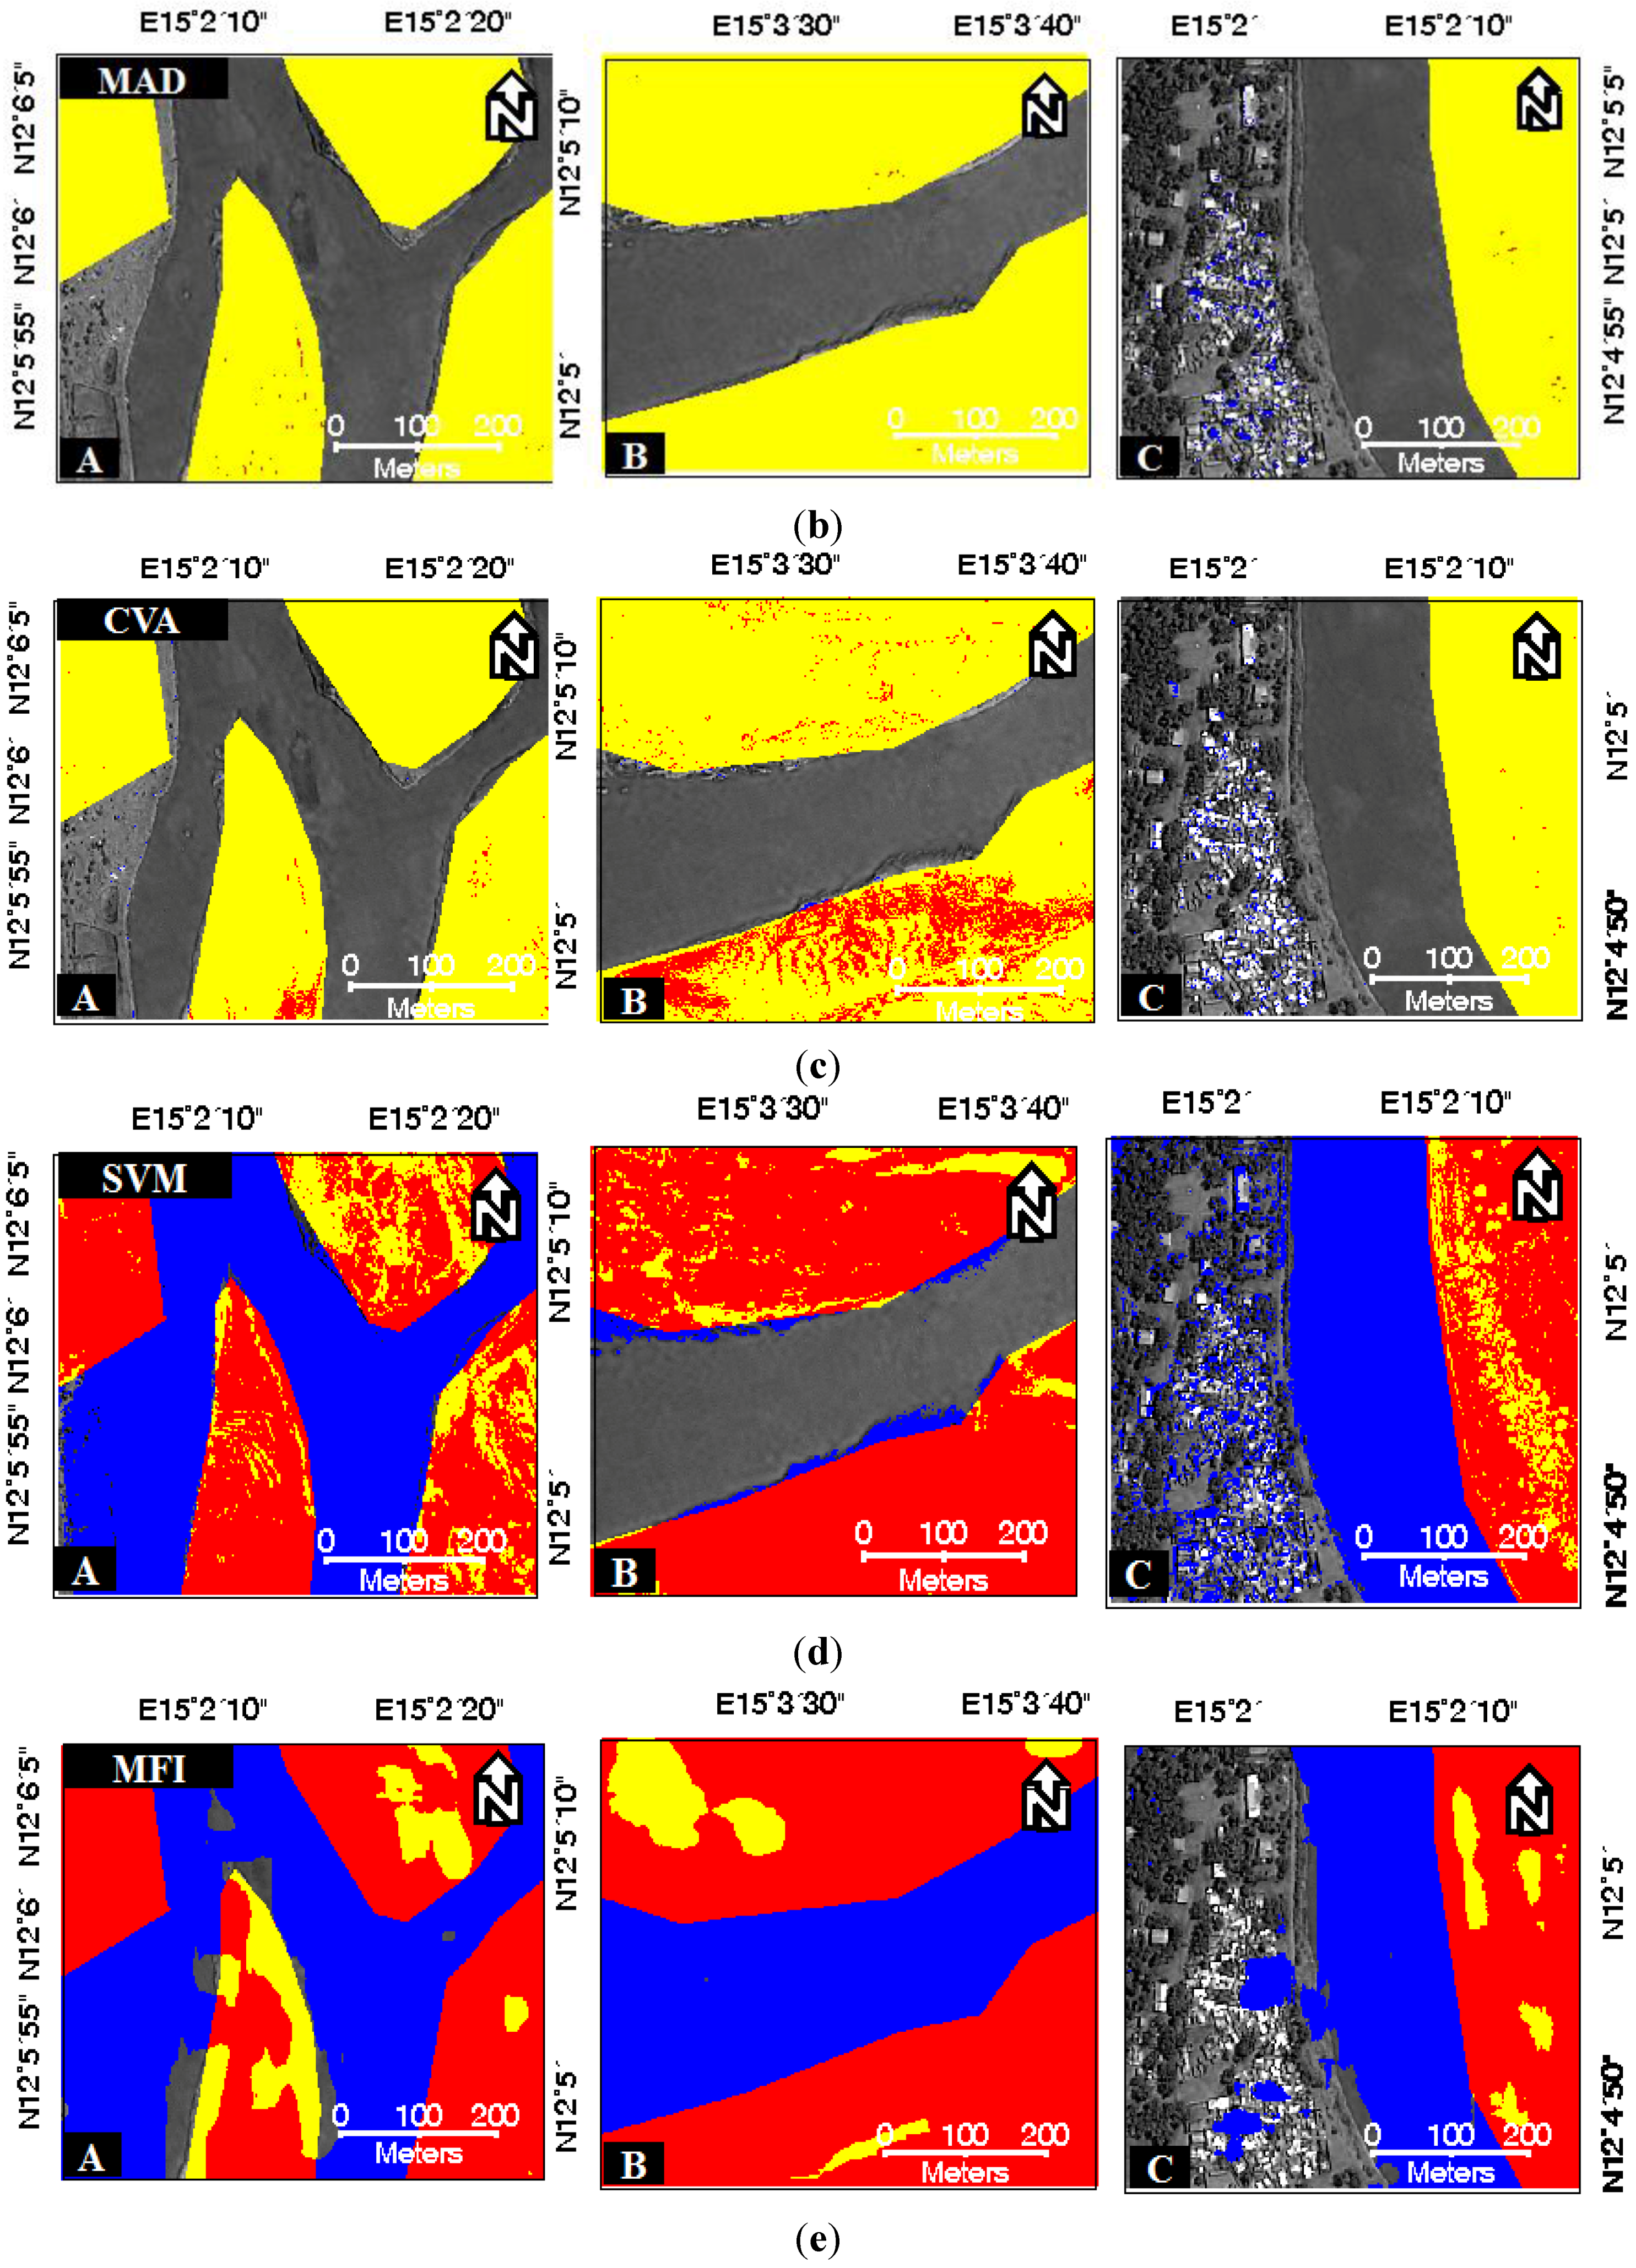
Figure 6 shows the sub-images extracted from different regions of
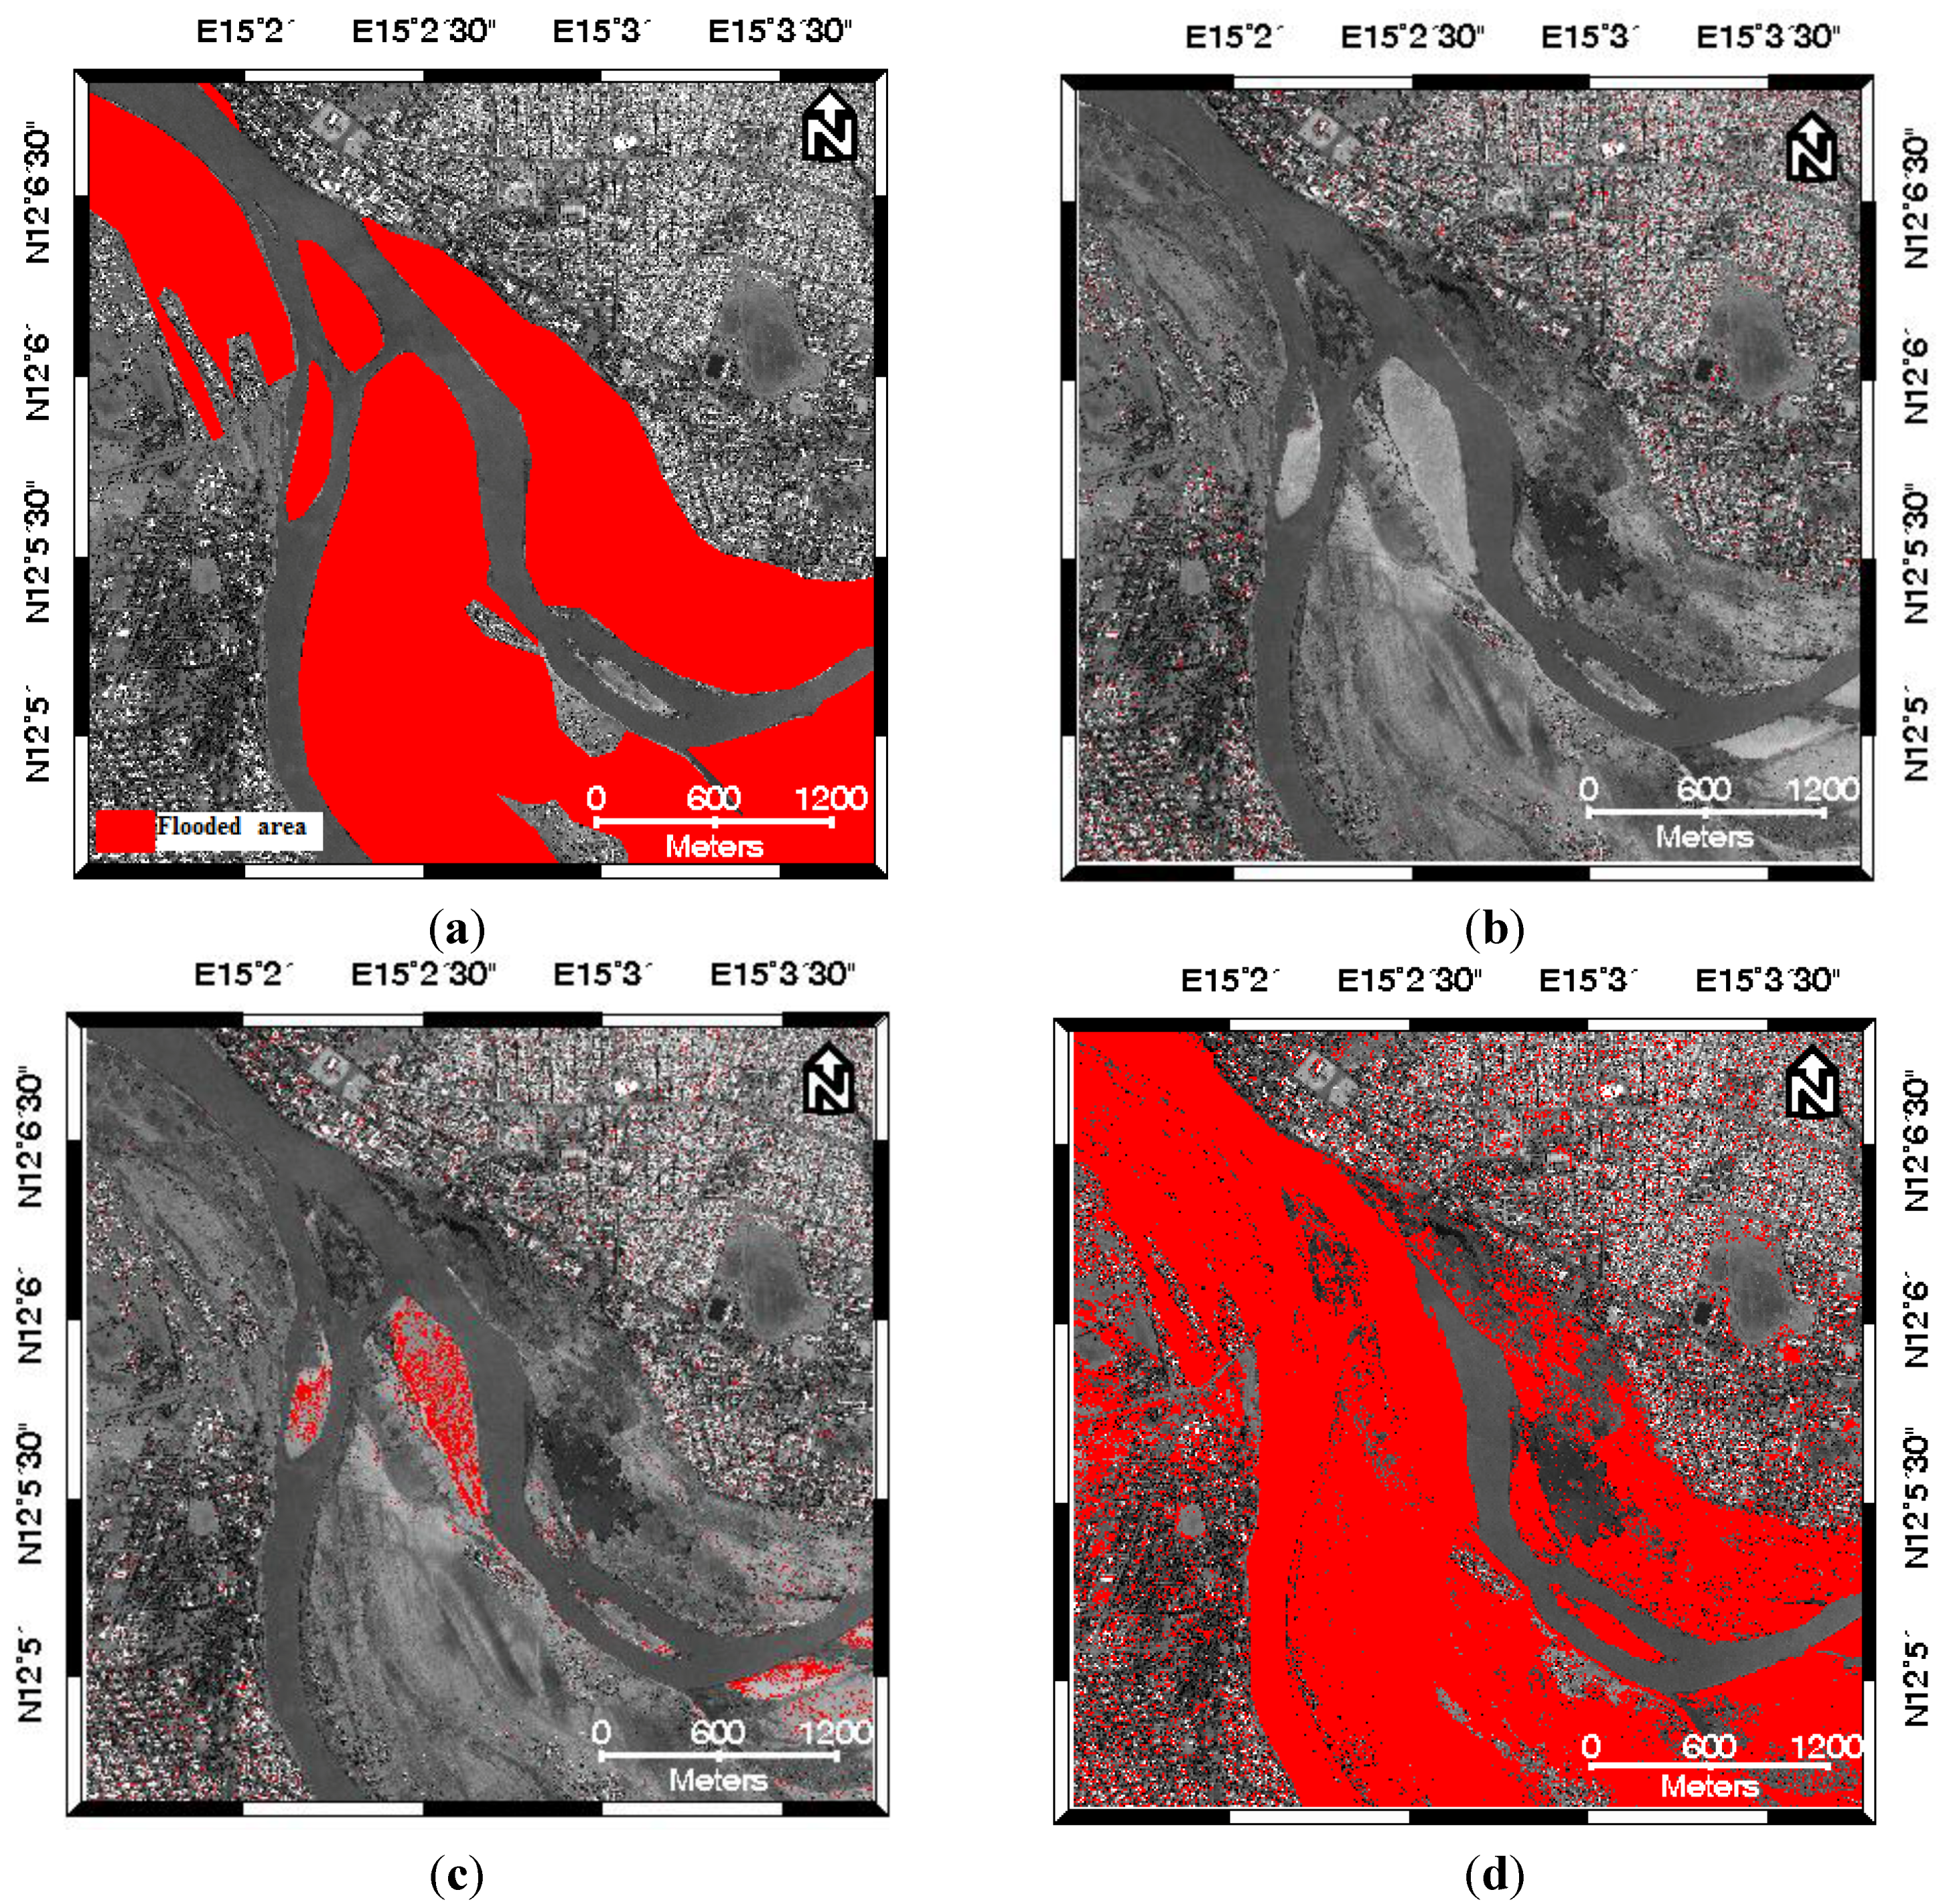
Figure 5: The red color represents the correctly extracted flood pixels, whereas the blue and yellow colors represent the commission and omission errors, respectively. The results are overlaid over the original PAN image collected before the flood event. At first glance, one can observe that the masks obtained with the SVM and the proposed methods showed consistent results to actual changes in comparison with the CVA- and the MAD-based methods. Upon close inspection of the change detection results using the ground-truth image (
Figure 5a), it seems that the flood extent extracted by the SVM method was over-estimated compared to the results of the proposed method. The permanent water body was even incorrectly classified as the flooded area by the SVM method (
Figure 5d). As shown in
Table 2, the OA of the proposed method was 75.04%. The SVM-based change detection method produced a slightly better result, showing 1.13% higher OA than the proposed method. However, obvious CE exits throughout the permanent water body area compared with the original image taken before the flood event as shown in
Figure 1a. Moreover, the SVM method needs training pixels for a given two classes, meaning that it needs additional manual intervention. Although the proposed method appears to be satisfactory in the flood extent extraction, it produces false positives in some regions far from the central flooded region, such as in the upper right part of
Figure 5f. This is because the spectral distortion occurred by the remnant atmospheric effects after radiometric correction and the spatial inconsistency occurred by different look angles of bi-temporal VHR imagery. To remove these false positives, it would seem preferable to consider the pixels that are only close to the largest central water regions. To increase the accuracy of the proposed change detection method, therefore, we will further study about the rule that can maintain the flooded areas and disregard the false positive far from the river.
Figure 5.
Result images of flooded area extraction using the tested methods: (a) Ground-truth image (b) MAD result; (c) CVA result; (d) SVM result; (e) MFI result; (f) result of the proposed method. The extracted flood pixels according to each method are represented in red color.
Figure 5.
Result images of flooded area extraction using the tested methods: (a) Ground-truth image (b) MAD result; (c) CVA result; (d) SVM result; (e) MFI result; (f) result of the proposed method. The extracted flood pixels according to each method are represented in red color.
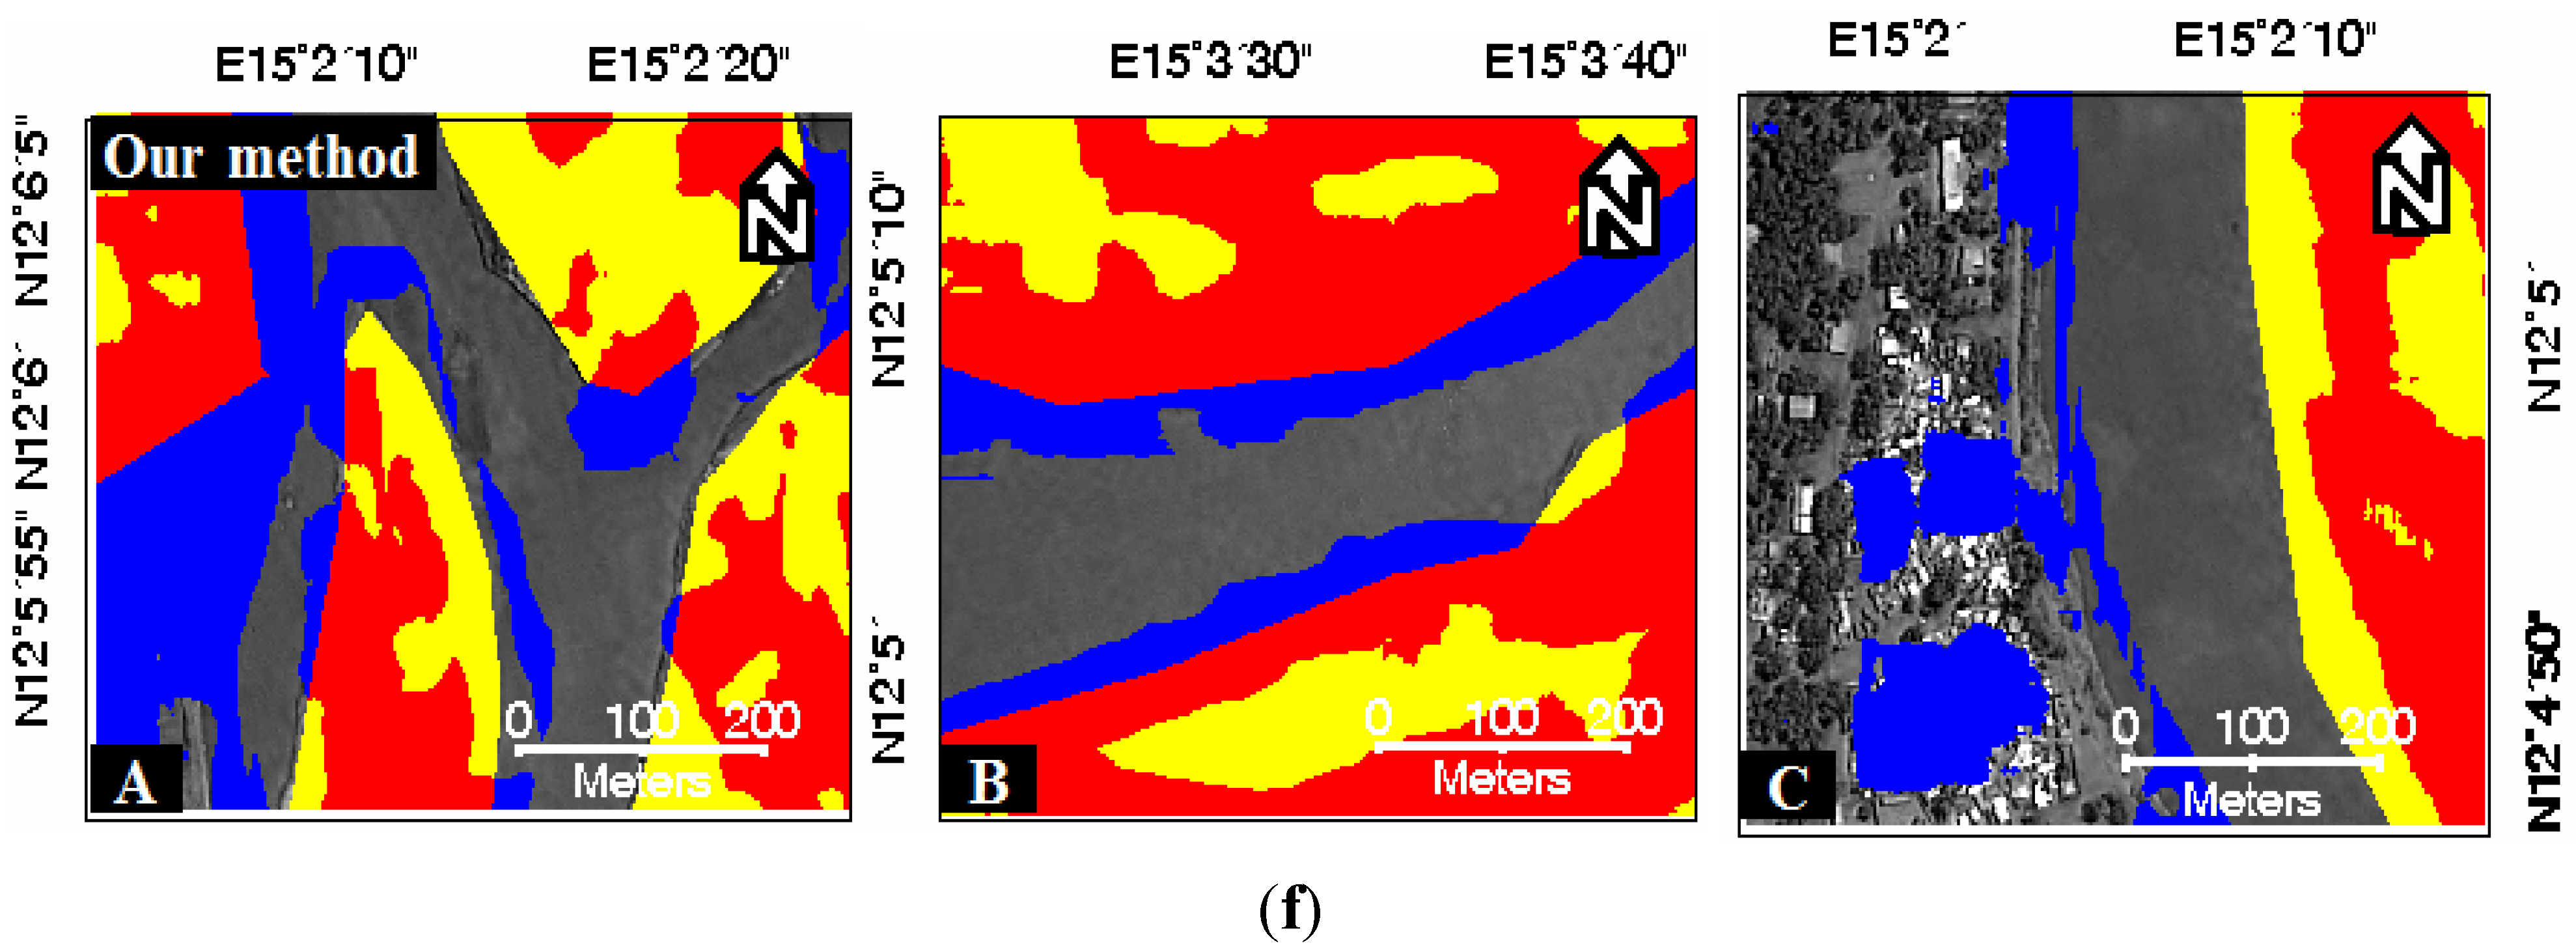
Figure 6.
Sub-images extracted from different regions of
Figure 5: (
a) a location map of each sub-image; (
b) MAD result; (
c) CVA result; (
d) SVM result; (
e) MFI result; (
f) result of the proposed method. The red color represents the correctly extracted flood pixels, the blue color shows the commission error, and the yellow color shows the omission error.
Table 2.
Accuracy assessment of the tested change detection methods: (F) Flood, (NF) No Flood, (OE) Omission error, (CE) Commission error, (OA) Overall accuracy.
Table 2.
Accuracy assessment of the tested change detection methods: (F) Flood, (NF) No Flood, (OE) Omission error, (CE) Commission error, (OA) Overall accuracy.
| | Reference Change | F (Pixels) | NF (Pixels) | OE (%) | CE (%) | OA (%) |
|---|
| Classified Change | |
|---|
| MAD | F (pixels) | 2496 | 144,629 | 99.96 | 98.30 | 60.03 |
| NF (pixels) | 6,249,234 | 9,603,641 |
| CVA | F (pixels) | 230,216 | 140,919 | 96.32 | 37.97 | 61.48 |
| NF (pixels) | 6,021,514 | 9,607,351 |
| SVM | F (pixels) | 5,091,425 | 2,653,158 | 18.56 | 34.26 | 76.17 |
| NF (pixels) | 1,160,305 | 7,095,112 |
| MFI | F (pixels) | 5,742,451 | 3,180,925 | 8.14 | 35.65 | 76.94 |
| NF (pixels) | 509,279 | 6,567,345 |
| Proposed Method | F (pixels) | 4,567,422 | 2,307,765 | 26.94 | 33.56 | 75.04 |
| NF (pixels) | 1,684,308 | 7,440,505 |
5. Conclusions
In this paper, we proposed a novel unsupervised change detection methodology based on a combination of image fusion and spectral distortion measure for the flood extent extraction. The experimental results from bi-temporal KOMPSAT-2 VHR images showed that the proposed approach could visually produce a good result for the flooded areas compared with the traditional CVA-, MAD-, SVM-based change detection methods. The OA obtained by the proposed method was 75.04%, which is close to that of SVM-based supervised change detection method. The proposed method is insensitive to image noise due to the use of context information based on the UIQI index. In contrast, the traditional pixel-based change detection techniques focus on the spectral value only. Therefore, the proposed method can achieve a lower rate of false alarms compared with the conventional methods. The cross-fused image was also found to be able to extract a more precise identification of the flooded area and gave a good performance in differentiating the flooded area and the permanent water body. The separation allows us to predict the damaged scale by flooding and make the decision to recover accordingly.
It is worth noting that the proposed method is designed based only on the NIR band of the post-flood image for the flood change detection. It means that we are focusing on flooding-related areas, which are sensitive to the NIR band. This is the reason why the proposed method produced some false positives in regions that are not related to water. Nevertheless, the proposed method has a strong advantage for flood extent extraction due to the possibility on separation between the flooded area and the permanent water body. It will be obvious that the proposed method improves CE over the other methods when the site is constructed mainly on the flood-related area.
In order to increase the accuracy of flood extent extraction, our future research will focus on making more precise framework to suppress false positives in the urban areas. We will apply the proposed approach to different sites affected by floods to confirm the robustness of the method. The effects according to different data fusion algorithms will also be investigated.


