Article

Development and Evaluation of a River-Basin-Scale High Spatio-Temporal Precipitation Data Set Using the WRF Model: A Case Study of the Heihe River Basin

1
Key Laboratory of Remote Sensing of Gansu Province, Cold and Arid Regions Environmental and Engineering Research Institute, Chinese Academy of Sciences, Lanzhou 730000, China
2
Heihe Remote Sensing Experimental Research Station, Cold and Arid Regions Environmental and Engineering Research Institute, Chinese Academy of Sciences, Lanzhou 730000, China
*
Author to whom correspondence should be addressed.
Remote Sens. 2015, 7(7), 9230-9252; https://doi.org/10.3390/rs70709230
Submission received: 25 March 2015 / Revised: 13 July 2015 / Accepted: 13 July 2015 / Published: 20 July 2015

Abstract

:
To obtain long term accurate high resolution precipitation for the Heihe River Basin (HRB), Weather Research and Forecasting (WRF) model simulations were performed using two different initial boundary conditions, with nine microphysical processes for different analysis parameterization schemes. High spatial-temporal precipitation was simulated from 2000 to 2013 and a suitable set of initial, boundary, and micro parameters for the HRB was evaluated from the Heihe Watershed Allied Telemetry Experimental Research project and Chinese Meteorological Administration data at hourly, daily, monthly, and annual time scales using various statistical indicators. It was found that annual precipitation has gradually increased over the HRB since 2000. Precipitation mostly occurs in summer and is higher in monsoon-influenced areas. High elevations experience winter snowfall. Precipitation is higher in the eastern upstream area than in the western upstream, area; however, the converse occurs in winter. Precipitation gradually increases with elevation from 1000 m to 4000 m, and the maximum precipitation occurs at the height of 3500–4000 m, then the precipitation slowly decreases with elevation from 4000 m to the top over the Qilian Mountains. Precipitation is scare and has a high temporal variation in the downstream area. Results are systematically validated using the in situ observations in this region and it was found that precipitation simulated by the WRF model using suitable physical configuration agrees well with the observation over the HRB at hourly, daily, monthly and yearly scales, as well as at spatial pattern. We also conclude that the dynamic downscaling using the WRF model is capable of producing high-resolution and reliable precipitation over complex mountainous areas and extremely arid environments. The downscaled data can meet the requirement of river basin scale hydrological modeling and water balance analysis.

Graphical Abstract

1. Introduction

Precipitation plays an important role in meteorology, climatology, and hydrology, and is a crucial link between the atmosphere, hydrosphere, and biosphere [1,2]. The spatial-temporal distribution pattern of precipitation has a large effect on the land surface hydrological flux [3,4]. Precipitation is the most important variable affecting the exchange of moisture and heat between the atmosphere and the land surface, and is of primary importance for the study of regional hydrological processes and water resources management [3,4,5,6,7]. However, obtaining high resolution and reliable precipitation forcing in complex terrain, particularly mountainous regions, to drive land surface model is still a challenging work [8]. General Circulation Models (GCMs) have the ability to treat the complex interactions of atmospheric physics and planetary-scale dynamics fairly well, but coarse horizontal resolution in GCMs restricts realistic simulation of climatic details on spatial variability [9]. The application of GCMs over the arid and semi-arid regions of Northwestern China shows that GCM could only reproduce climatic properties over the large scale but failed in simulating the mesoscale systems [10]. The emerging of Regional Climate Models (RCMs) as a dynamical downscaling technique has been considered to bridge the gap between regional scale estimates and the current limited resolution in GCMs. Compared to GCMs, RCMs have a finer spatial-temporal resolution and can describe the complex underlying surface in detail, subject to the available computer resources [11].
With the development of super computers, RCMs are likely to better account for the fine-scale characteristics that are known to affect atmospheric simulations, such as land use or vegetation, soil texture, and topographical features [12], and to yield high-resolution simulations of precipitation, which is essentially local and unevenly distributed. However, precipitation is the most difficult variable to simulate in numerical models because of our limited understanding of precipitation phenomena, its high spatial and temporal variability, and its nonlinear nature, especially over complex terrain at small spatial scales [13]. Precipitation is also difficult to evaluate because rain gauges are often unevenly and sparsely distributed. Most inland river basins are located in regions far from the sea and surrounded by mountains, which prevents the maritime air stream from entering the inland basin, thus creating an extremely dry continental climate that is characterized by scarce precipitation, high potential evaporation, wide temperature fluctuations, and strong winds. Good water resource management, including a knowledge of precipitation distribution over different sub-streams, is important for inland river basins. The hydro-ecosystem of the arid and semi-arid inland region is vulnerable and relies heavily on the precipitation at fine gridded and timely resolution [14]. However, precipitation in inland river basins is unevenly distributed at spatial and temporal scales, with mountains producing the highest levels of precipitation in the summer season. Therefore it is difficult to simulate precipitation in numerical weather prediction (NWP) over inland river basins. The difficulties result from the simulating uncertainty of RCMs, which relies heavily on the boundary and initial conditions and microphysical processes [15,16]. These boundary and initial conditions, and microphysical processes have a significant effect on precipitation simulation in numerical weather prediction [17,18,19]. The microphysical process parameterization for the interactive and dynamic processes, radiation, and aerosol / chemical reactions, play a key role in cloud, climate, and weather patterns in inland regions [20,21,22,23,24]. Sensitive analyses over the HRB are seldom and indicated that precipitation yielded better by a combination of various parameterized schemes rather than by a single parameterized scheme in the HRB [25]. Daily precipitation simulated with the Grell cumulus convective parameterized scheme was closer to the rain gauge data than that with other schemes [26]. However, the sensitivity of the cumulus convection parameterized scheme has little effect on the center of rainfall area and the intensity of the precipitation center over Qilian Mountain [17], and was less sensitive than that of other schemes in the HRB [25]. Based on the above arguments, we found that the sensitive analyses have no consistent conclusions over the HRB. The initial and boundary conditions from GCMs being nested into RCMs also play an important role in precipitation simulation, with small differences in the initial field potentially leading to different model simulation results [27]. However, there is almost no such comparison analysis of different initial and boundary conditions nested into RCMs over the HRB.
To obtain accurate high spatio-temporal resolution precipitation records for the HRB, WRF simulation results for two different initial and boundary conditions—the Global Forecast System (GFS) and Climate Forecast System (CFS)—with nine microphysical processes for parameterization schemes were compared using the “Heihe Watershed Allied Telemetry Experimental Research (HiWATER)” project [28,29] station data and Chinese Meteorological Administration (CMA) observation data. The most suitable set of initial and boundary conditions and micro parameters were used to simulate high spatio-temporal precipitation from 2000 to 2013 for HRB. This precipitation product was evaluated using observation data from the HiWATER project [29] and the CMA, at hourly, daily, monthly, and annual time scales.
This paper is organized as follows. The research region and validation data are described in Section 2, along with a brief introduction of the high spatio-temporal precipitation simulated using the WRF model in Section 3. The analysis of the spatial and temporal patterns of precipitation in the HRB from 2000 to 2013 is presented in Section 4. A discussion and conclusions are presented in Section 5 and Section 6.

2. Research Region and Validation Data

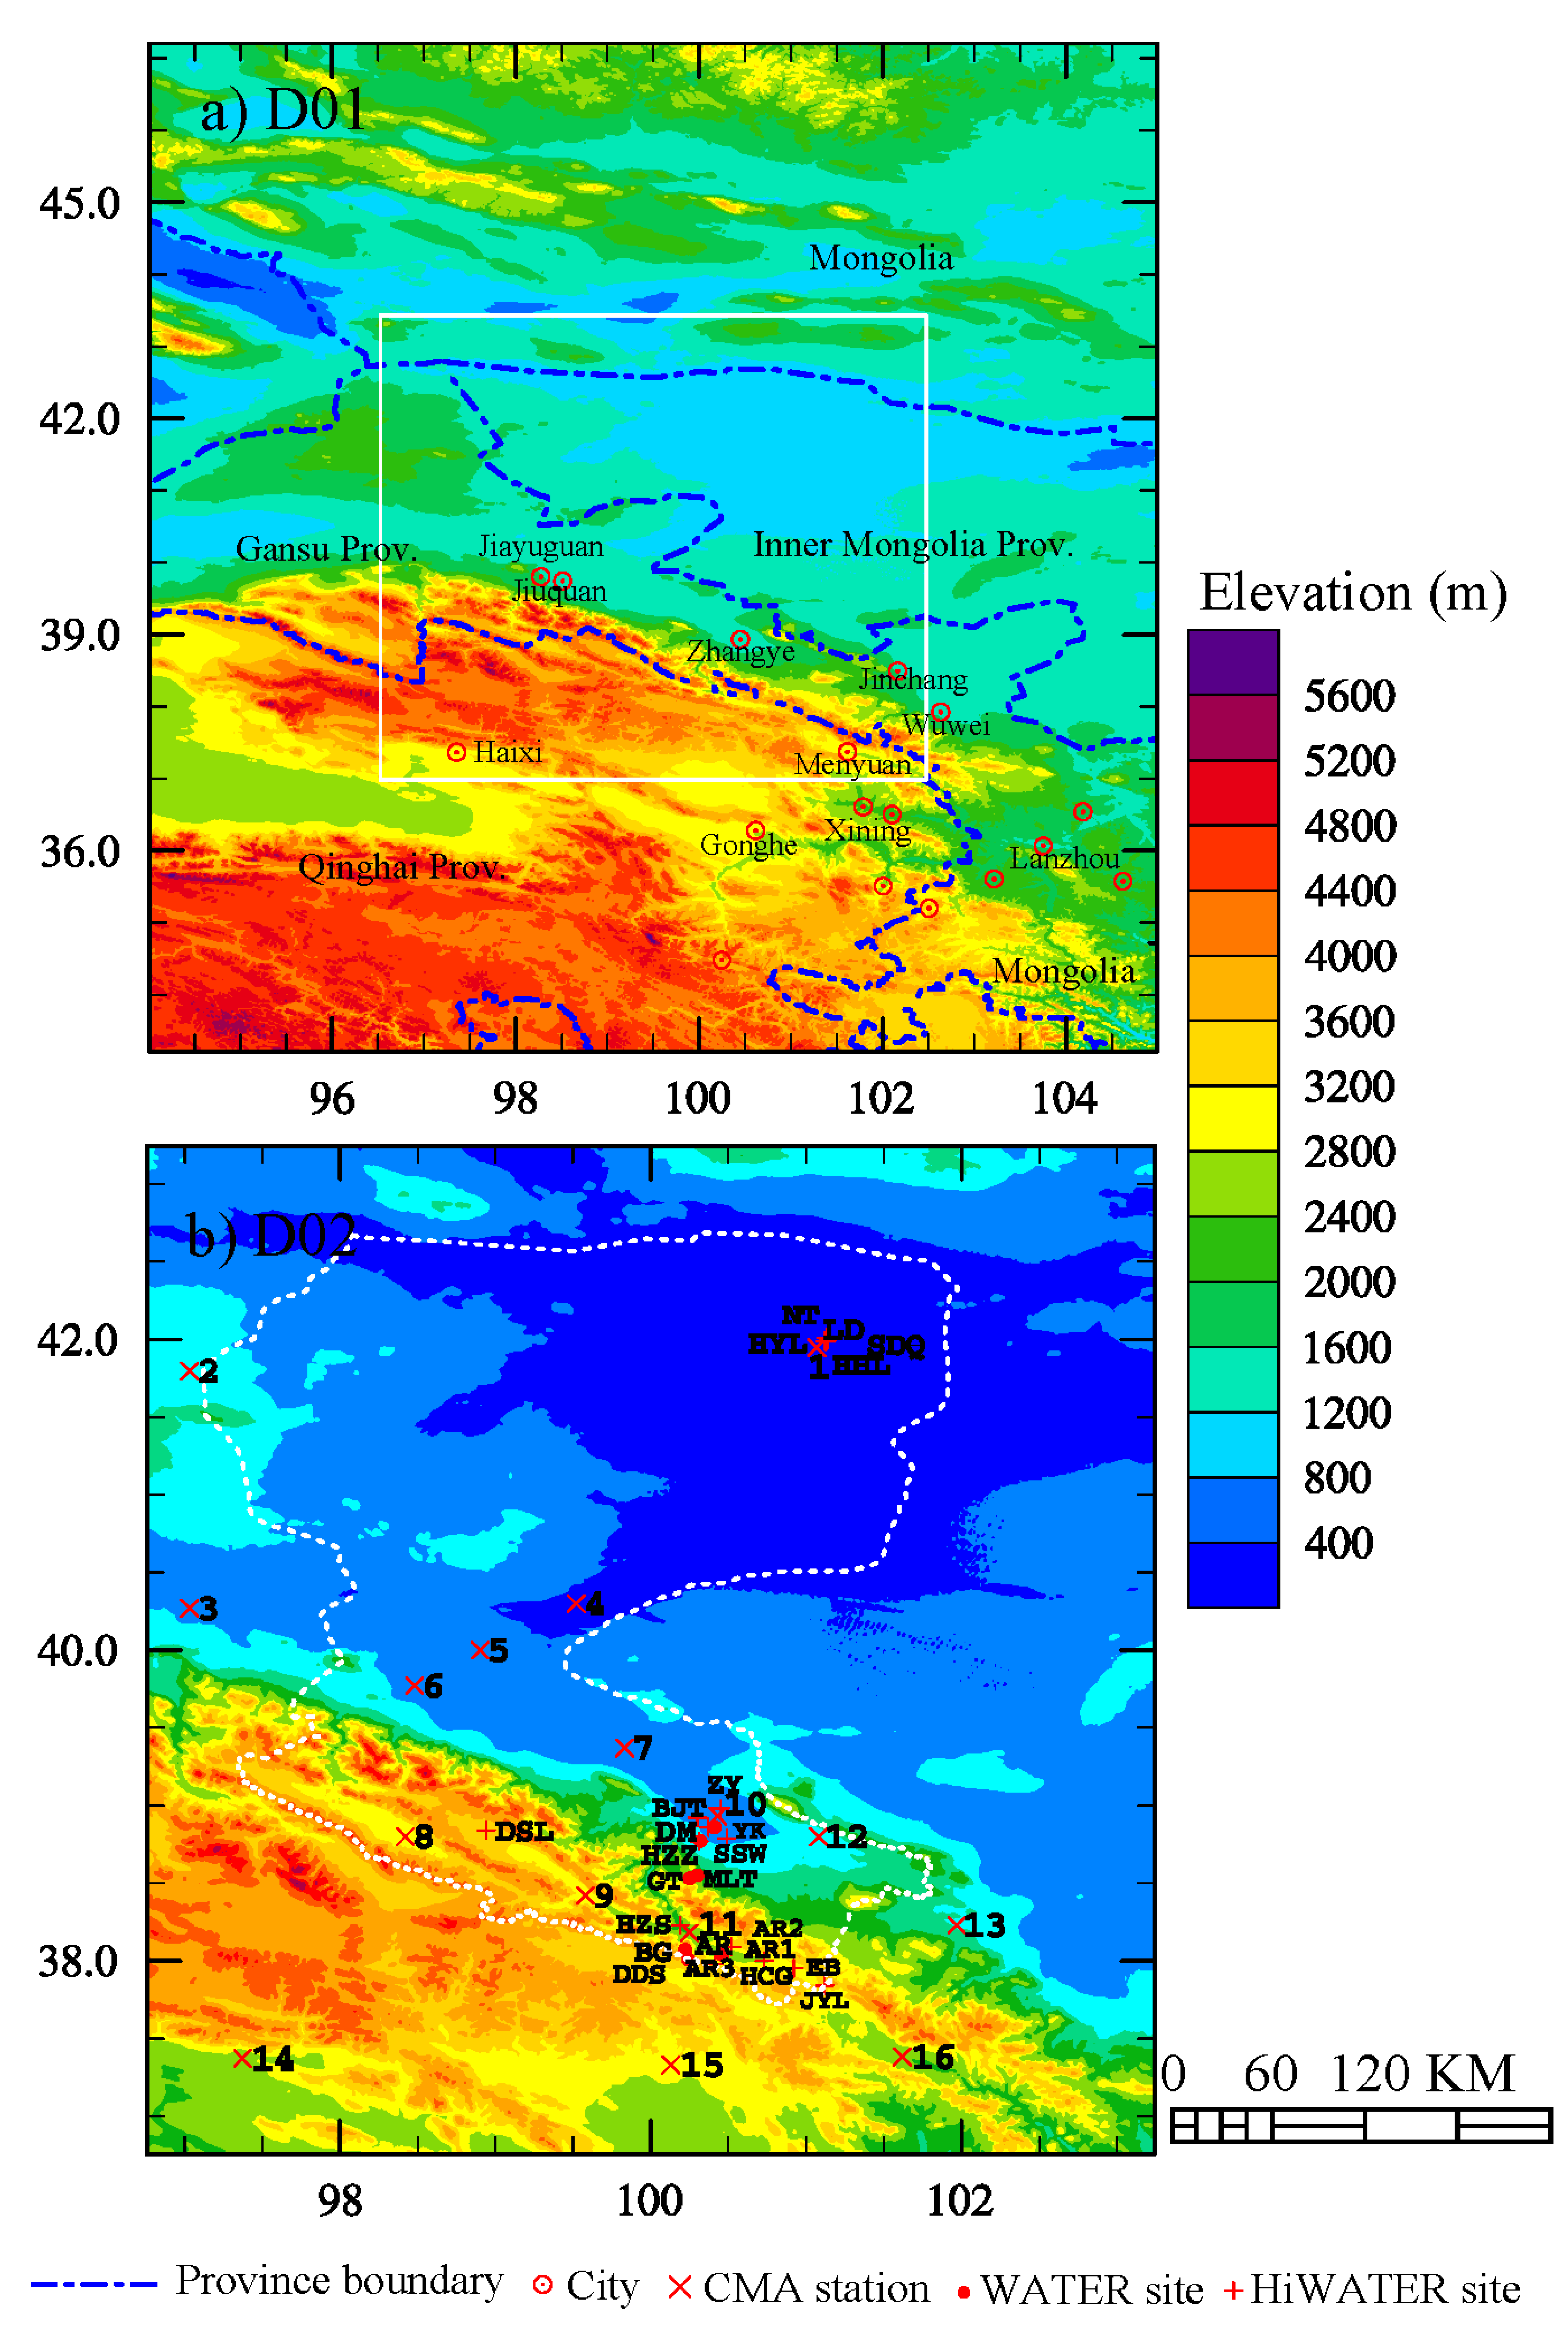
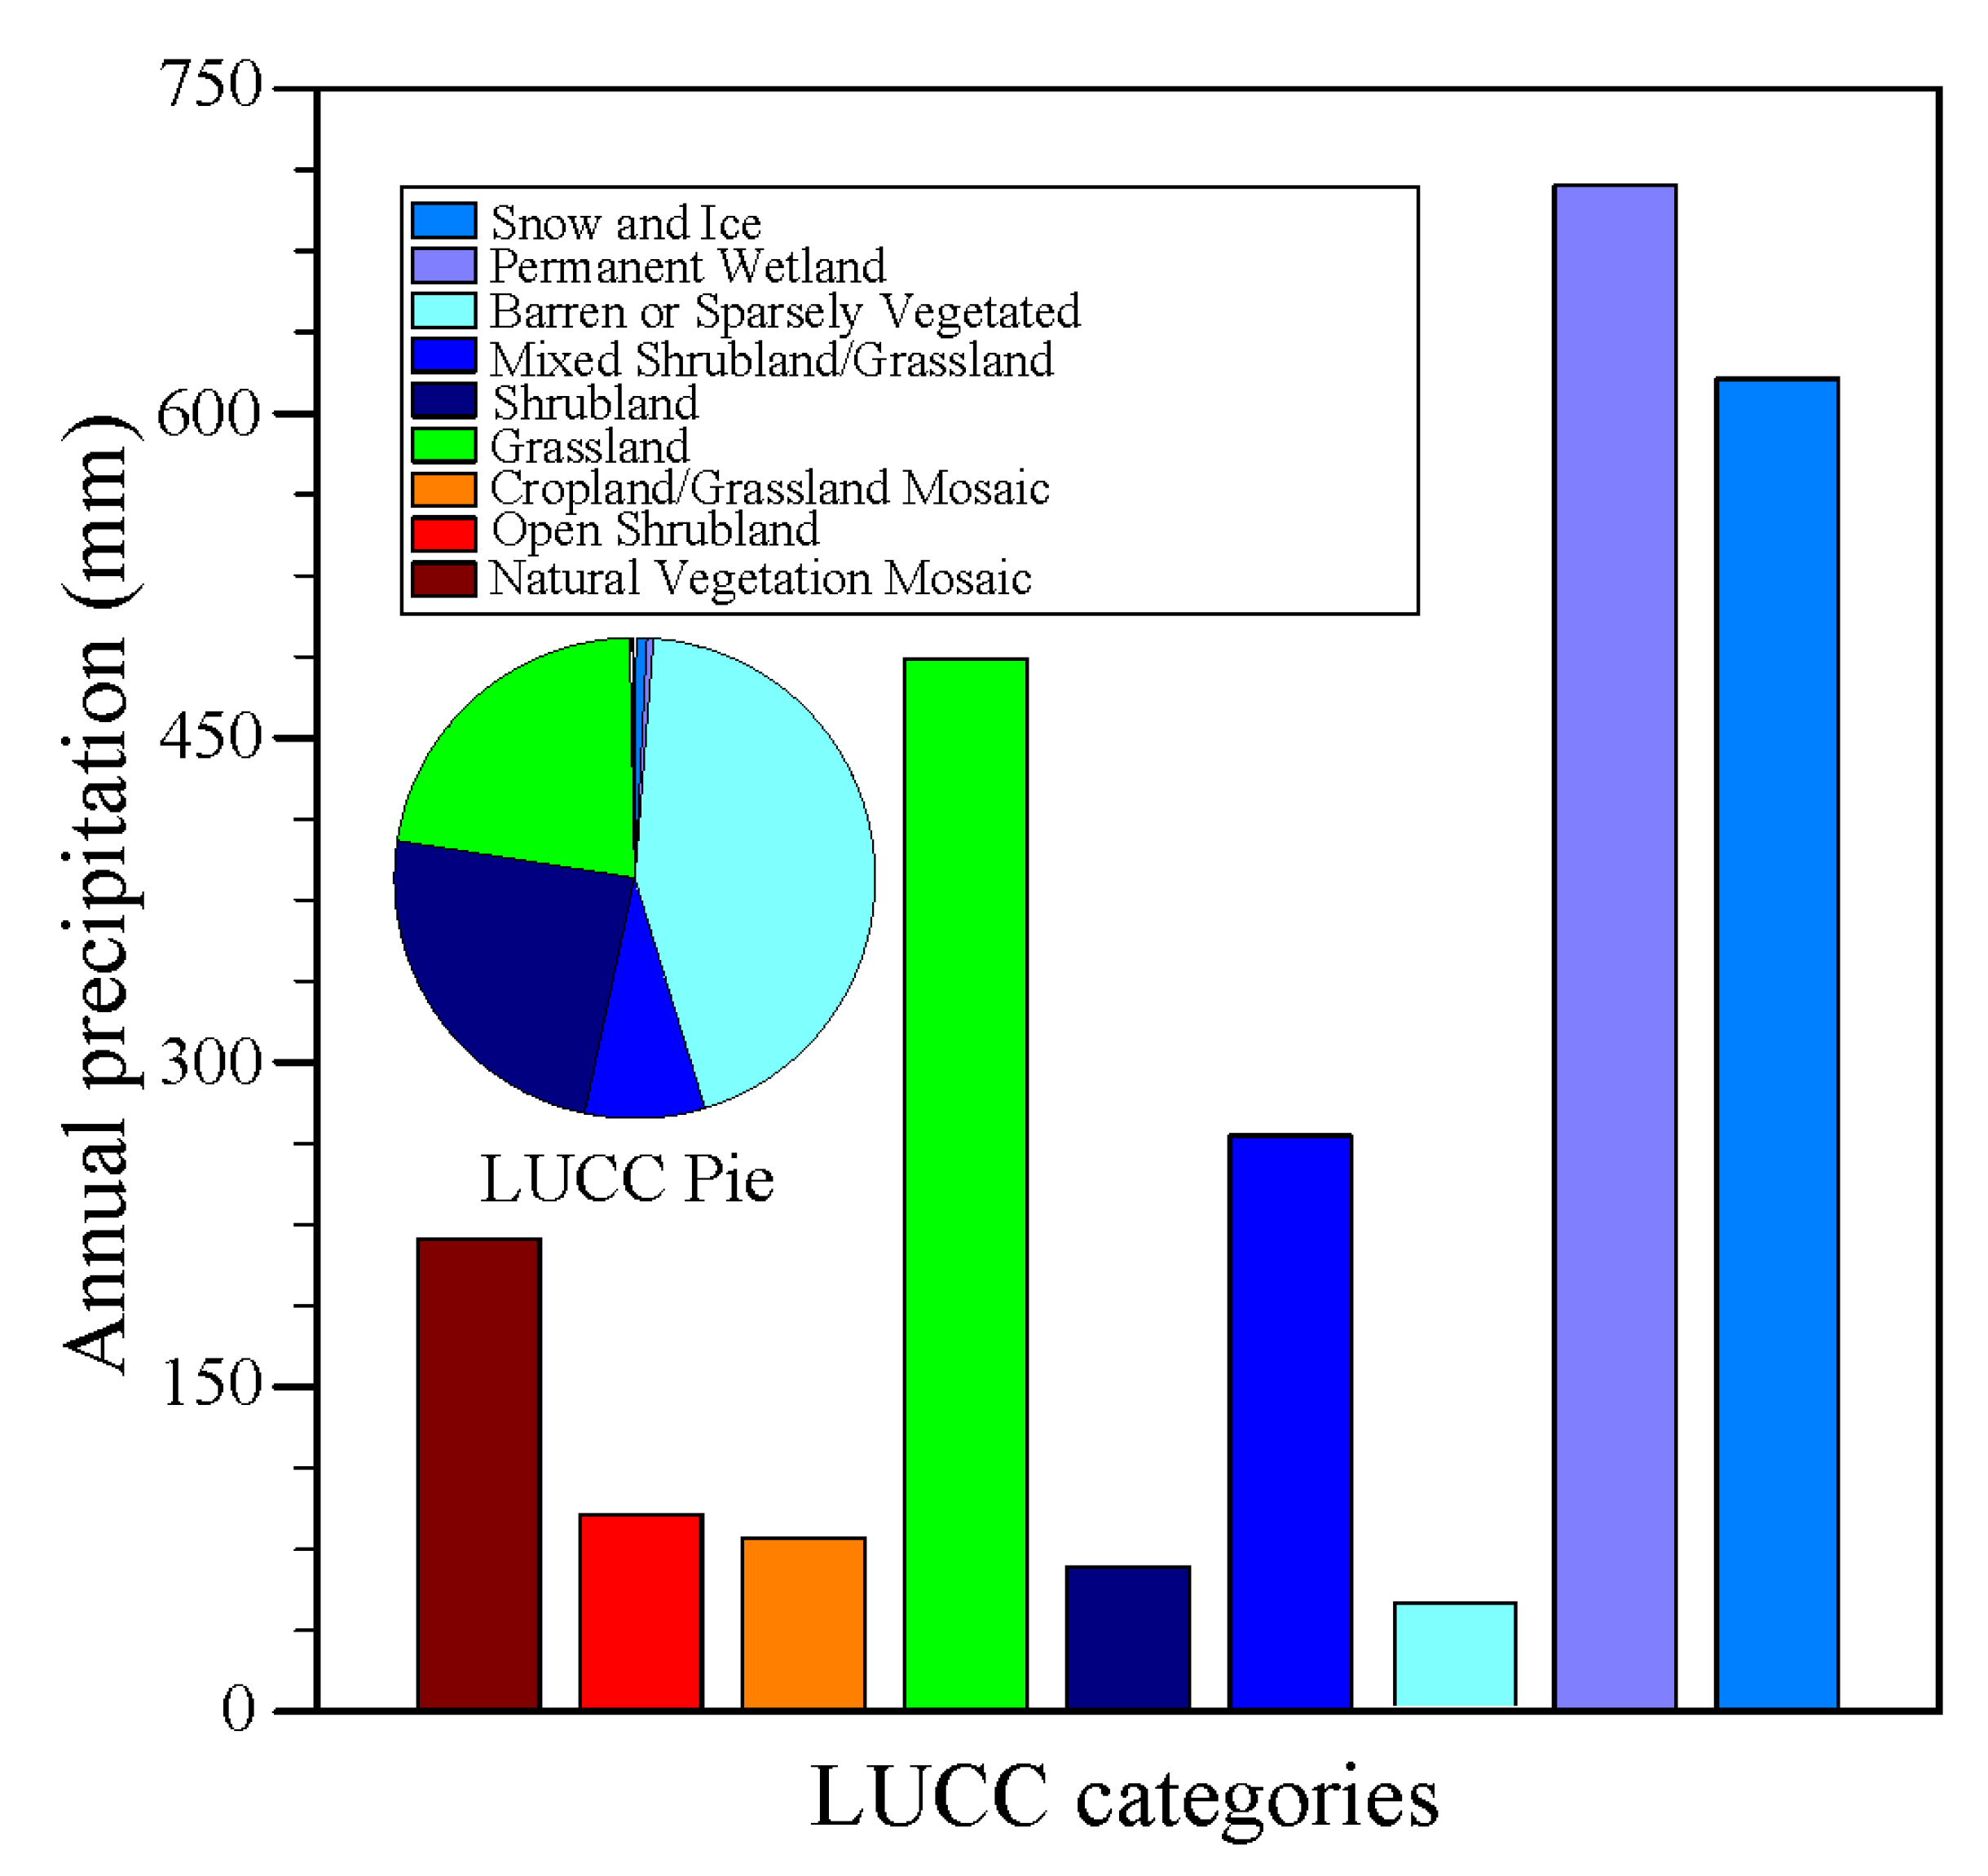
2.1. Research Region and Validation Data

The HRB is a typical inland river basin, and was selected as the experimental watershed in the HiWATER project [28,29]. The reliable areal estimation of total precipitation and the associated spatiotemporal variation requires careful calibration for the different types of precipitation and a specifically designed ground observation network [30,31]. The HiWATER project provides sufficient rain gauge data to estimate the high spatio-temporal precipitation data developed by the Weather Research and Forecasting (WRF) model for the HRB.
The HRB is the second largest inland river in China. It is located in the middle part of the Hexi Corridor in the arid regions of northwest China between 97°24′~102°10′E and 37°41′~42°42′N, and covers an area of approximately 140,000 km2 [29]. The HRB extends from the Qilian Mountain glaciers, passing through alpine meadows and forest areas (precipitation recharge area), through an arid region, piedmont plains, and a vast desert oasis before finally reaching the Juyanhai (last recharge area) located in Ejin of the Inner Mongolia Autonomous Region. Elevation is higher in the western HRB than in the eastern HRB. Precipitation ranges between 550 and 50 mm from upstream to downstream, and is around 100–200 mm in the midstream, according to in situ observations. The Qilian Mountains, located in the upstream of the HRB, is a National Natural Reserve, and is also an important water conservation forest zone. The Hexi Corridor, in the midstream of the HRB, is an important commodity grain base. Ejin, in the downstream of the HRB, is an important ecological barrier against the expansion of desert. With a rapidly increasing population and rapid economic development occurring in the up and midstream areas, the consumption of water has increased dramatically, which in turn has diminished the water available for ecological processes. Water shortages are threatening the sustainable development of the hydro-ecological system over the downstream of the HRB [32,33]. It is necessary to achieve effective water management that accounts for variations in water levels. To achieve this, the first step is to determine the spatial and temporal patterns of precipitation over the HRB. However, precipitation over HRB is the comprehensive results of the western water vapor, the East Asian Monsoon and the South Asian Monsoon, with a different spatial-temporal pattern at different seasons. The aim of this study is to develop high spatio-temporal precipitation to satisfy the urgently need of integrated studies of the water–ecosystem–economy relationship in the HRB. The results of the study of Pan et al [34] show that there were large errors over the upper stream of the HRB. Therefore, in this study, we make an effort to get better precipitation simulation than that of Pan et al [34]. Though these two precipitation data have some common characteristics—such as research region, similar spatial resolution and time step, the physical configuration, time span, evaluation data and the precision of precipitation simulation over complex mountainous region are totally different.
To evaluate the precipitation simulated by the WRF model, 18 rain gauges were set up to obtain the precipitation volume at 10 min intervals during the HiWATER project [29]. Eight gauges were placed upstream, five were placed midstream, and five were placed downstream. These rain gauges were representative of the different land covers that characterize the HRB. The characteristics of these rain gauges are summarized in Table 1. The observation data obtained during the HiWATER project were used to evaluate the high spatio-temporal precipitation simulations at an hourly scale.
In addition to this data, 16 conventional meteorological stations maintained by the CMA were used to evaluate WRF simulations at a daily scale. The detailed location of HiWATER and CMA stations in HRB is shown in Figure 1.
Figure 1. Nesting domain configuration for the numerical experiment (a) for the first domain; (b) for the second domain (a red cross is a CMA (Chinese Meteorological Administration) station, with the numbers 1–16 being 1 Ejin, 2 Mazongshan, 3 Yumen, 4 Dingxin, 5 Jinta, 6 Jiuquan, 7 Gaotai, 8 Tuole, 9 Yeniugou, 10 Zhangye, 11 Qilian, 12 Shandan, 13 Yongchang, 14 Delingha, 15 Gangcha, and 16 Menyuan, respectively).
Remotesensing 07 09230 g001
Table 1. Charateristics of HiWATER (Heihe Watershed Allied Telemetry Experimental Research) meteorological stations over HRB (Heihe River Basin).
Sub-StreamStation NameStation IDAltitude (m)Latitude (°N)Longitude (°E)Land Use
UpstreamArou1 super station *AR13033100.4638.05Alpine grassland
Arou2AR23529100.5238.09Same as Arou1 Sunny slope
Arou3AR33536100.4137.98Same as Arou1 Shady slope
DashalongDSL373998.9438.84Swamp meadow
EbaoEB3294100.9237.95Alpine grassland
HuangzangsiHZS3529100.1938.23Farmland
HuangcaogouHCG3137100.7338.00Alpine grassland
JingyanglingJYL3750101.1237.84Alpine meadow
MidstreamBajitanBJT1562100.3038.92Gobi
Daman super station *DM1556100.3738.86Farmland
HuaizhaiziHZZ1731100.3238.77Desert
ShenshawoSSW1594100.4938.79Desert
ZhangyeZY1460100.4538.98Wetland
DownstreamSidaoqiao super station *SDQ873101.1442.00Sparsely vegetated
HunhelinHHL876101.1241.99Mixture forest
HuyanglinHYL876101.1241.99Open Shrubland
LuodiLD878101.1341.99Barren land
NongtianNT875101.1342.01Farmland
* In super stations there are more radiation observation layers in the station, but the rain gauge is the same as in a normal station.
Although rain gauges are considered to be the most simple and direct way of measuring the amount and rate of rainfall, they are subject to several uncertainties and errors. The largest source of error is the effect of wind, i.e., the wind-induced gauge under-catch, and is considered to be the most common and serious source of rainfall-measurement error. The precipitation observation data from the HiWATER project used in this study were obtained by weighing rain gauges with no wind-shields to minimize the wind-induced error. According to He et al. [35] and Yang et al. [36], the original rainfall measurement was corrected using the following equations:
C E s n o w = exp ( 0.056 W s ) × 100 % ,  when T < 2   ° C
C E r a i n = exp ( 0.040 W s ) × 100 % ,  when T  >   2   ° C
C E m i x e d = C E s n o w ( C E s n o w C E r a i n ) × T + 2 4 , when   2   ° < T < 2   ° C
P = P 0 / C E
Where C E s n o w , C E r a i n , and C E m i x e d are the catch ratios for solid, liquid, and mixed precipitation. T is the temperature at the time of precipitation. P is the corrected volume of precipitation and P0 is the original data from the rain gauge.
Another source of uncertainty was the elevation difference between the WRF model grid and the observation station. The HRB precipitation gradient is 10 mm/100 m–17 mm/100 m [36] from east to west, and therefore data from each observational station were corrected according to their location and elevation.

2.2. Evaluation Methods

In this study, evaluation indicators including the correlation coefficient (CC), the root mean square error (RMSE), the mean error (ME), the mean absolute error (MAE), and the relative bias (BIAS) were adopted for error analysis at annual, monthly, daily, and hourly scales. The detection indicators including the probability of detection (POD), the false alarm ratio (FAR), and the frequency bias (FBI) were also used at the daily and hourly scales. CC, RMSE, ME, MAE, and BIAS indicated the degree of linear correlation, the average difference, the average magnitude of the error, and the systematic bias, respectively, between WRF simulation and observation. POD, FAR, and FBI were calculated based on a contingency table approach [7], and indicated the fraction of occasions when an event occurred that was also forecast, the proportion of forecast events that failed to materialize, and the unbiased forecast where the event was forecast exactly as often as it was observed, respectively. The POD and the FAR range from 0 to 1, with a higher value indicating a better simulation, whereas the FAR is the converse. The FBI ranges from 0 to ∞, but the ideal value is 1, indicating an unbiased forecast where the event is forecast exactly as often as it is observed. Detailed information regarding the use of POD, FAR and FBI is provided in Pan et al. [34]. The CMA data were used for annual, monthly, and daily evaluation, with HiWATER project data used for hourly evaluation. The analyses based on the precipitation yielded by WRF model over the HRB include spatial and temporal patterns, the relationships between the precipitation and elevation ranges as well as land use categories, and daily and hourly proportion of precipitation events.

3. High Spatial-Temporal Precipitation Simulated by the WRF Model

The WRF model [37,38,39,40] is a new generation mesoscale numerical weather prediction system that serves both the operational and research communities. The model uses a terrain-following hydrostatic pressure coordinate system with permitted vertical grid stretching [41]. Arakawa C grid staggering [42] is used for horizontal discretization.
Based on studies of the impact of underlying surface information on WRF modeling in the HRB [43], the land use category developed by Ran et al. [44] and the soil texture developed by Shuangguan et al. [45] were used rather than data provided by NCAR/CISL (http://rda.ucar.edu/). The impact of these static surface data on WRF modeling over the HRB has been demonstrated in Pan et al [43]. Based on studies involving a sensitive analysis of the parameterized physical processes of the WRF model on the simulation of precipitation in the HRB [25], the Mellor Yamada Janjic (MYJ) scheme for the planetary boundary layer and the Noah scheme for the land surface model were set. The model spinup time is 24 hours. The precipitation from 2000 to 2013 was simulated month by month.
In addition to the physical configurations mentioned above, a sensitive analysis of the initial and boundary conditions, and microphysical schemes in the WRF model, was also undertaken. WRF simulation results using two different initial boundary conditions: Global Forecast System—Final Operational Global Analysis [46] and Climate Forecast System [47], with nine microphysical processes for parameterization schemes were compared using HiWATER [29] station data and CMA observation data. The parameterization schemes used were: Kessler, Purdue Lin, WRF Single-Moment 3-class, WRF Single-Moment 5-class, Eta Ferrier, WRF Single-Moment 6-class, Goddard Cumulus Ensemble Model, Thompson et al., and Morrison double-moment. The GFS and Kessler scheme were set for the initial and boundary conditions, and the microphysics.
In this study, two-way nested computational domains of 44 × 56 × 27 and 120 × 130 × 27 grid points and horizontal resolutions of 0.25° and 0.05°, respectively, were set. The first domain covered most of Gansu Province, part of Qinghai Province and part of Inner Mongolia Province, ranging from 33°N to 47°N in latitude and 94°E to 105°E in longitude. The second domain covered the HRB ranging from 37.5°N to 47°N in latitude and 96.5°E to 102.5°E in longitude (Figure 1). The set of configurations for the WRF model adopted in our study is given in Table 2. Based on the comparison analysis of results from two initial and boundary condition and nine microphysical schemes and sensitive analysis [25], precipitation yielded by the WRF model over the HRB was configured using the Kessler scheme for microphysics, MYJ scheme for the planetary boundary layer, and the Noah scheme for the land surface model. User specified terrain information has less bias than information yielded by the WRF model configured using the physical parameters in Pan et al. [34] and using the model default terrain information.
Table 2. WRF (Weather Research and Forecasting) physical configuration (microphysics) adopted in this study.
ItemsFirst Domain (0.25°)Second Domain (0.05°)
Horizontal44 × 56120 × 130
Time interval150 s30 s
MicrophysicsKesslerKessler
Cumulus ParameterizationKain-FritschKain-Fritsch
Planetary Boundary LayerMYJMYJ
Longwave RadiationRRTMRRTM
Shortwave RadiationDudhiaDudhia
Land surface modelNoah LSMNoah LSM
ProjectionLat-lonLat-lon
BoundaryNCEP/FNL analysisDomain 1

4. Results and Discussion
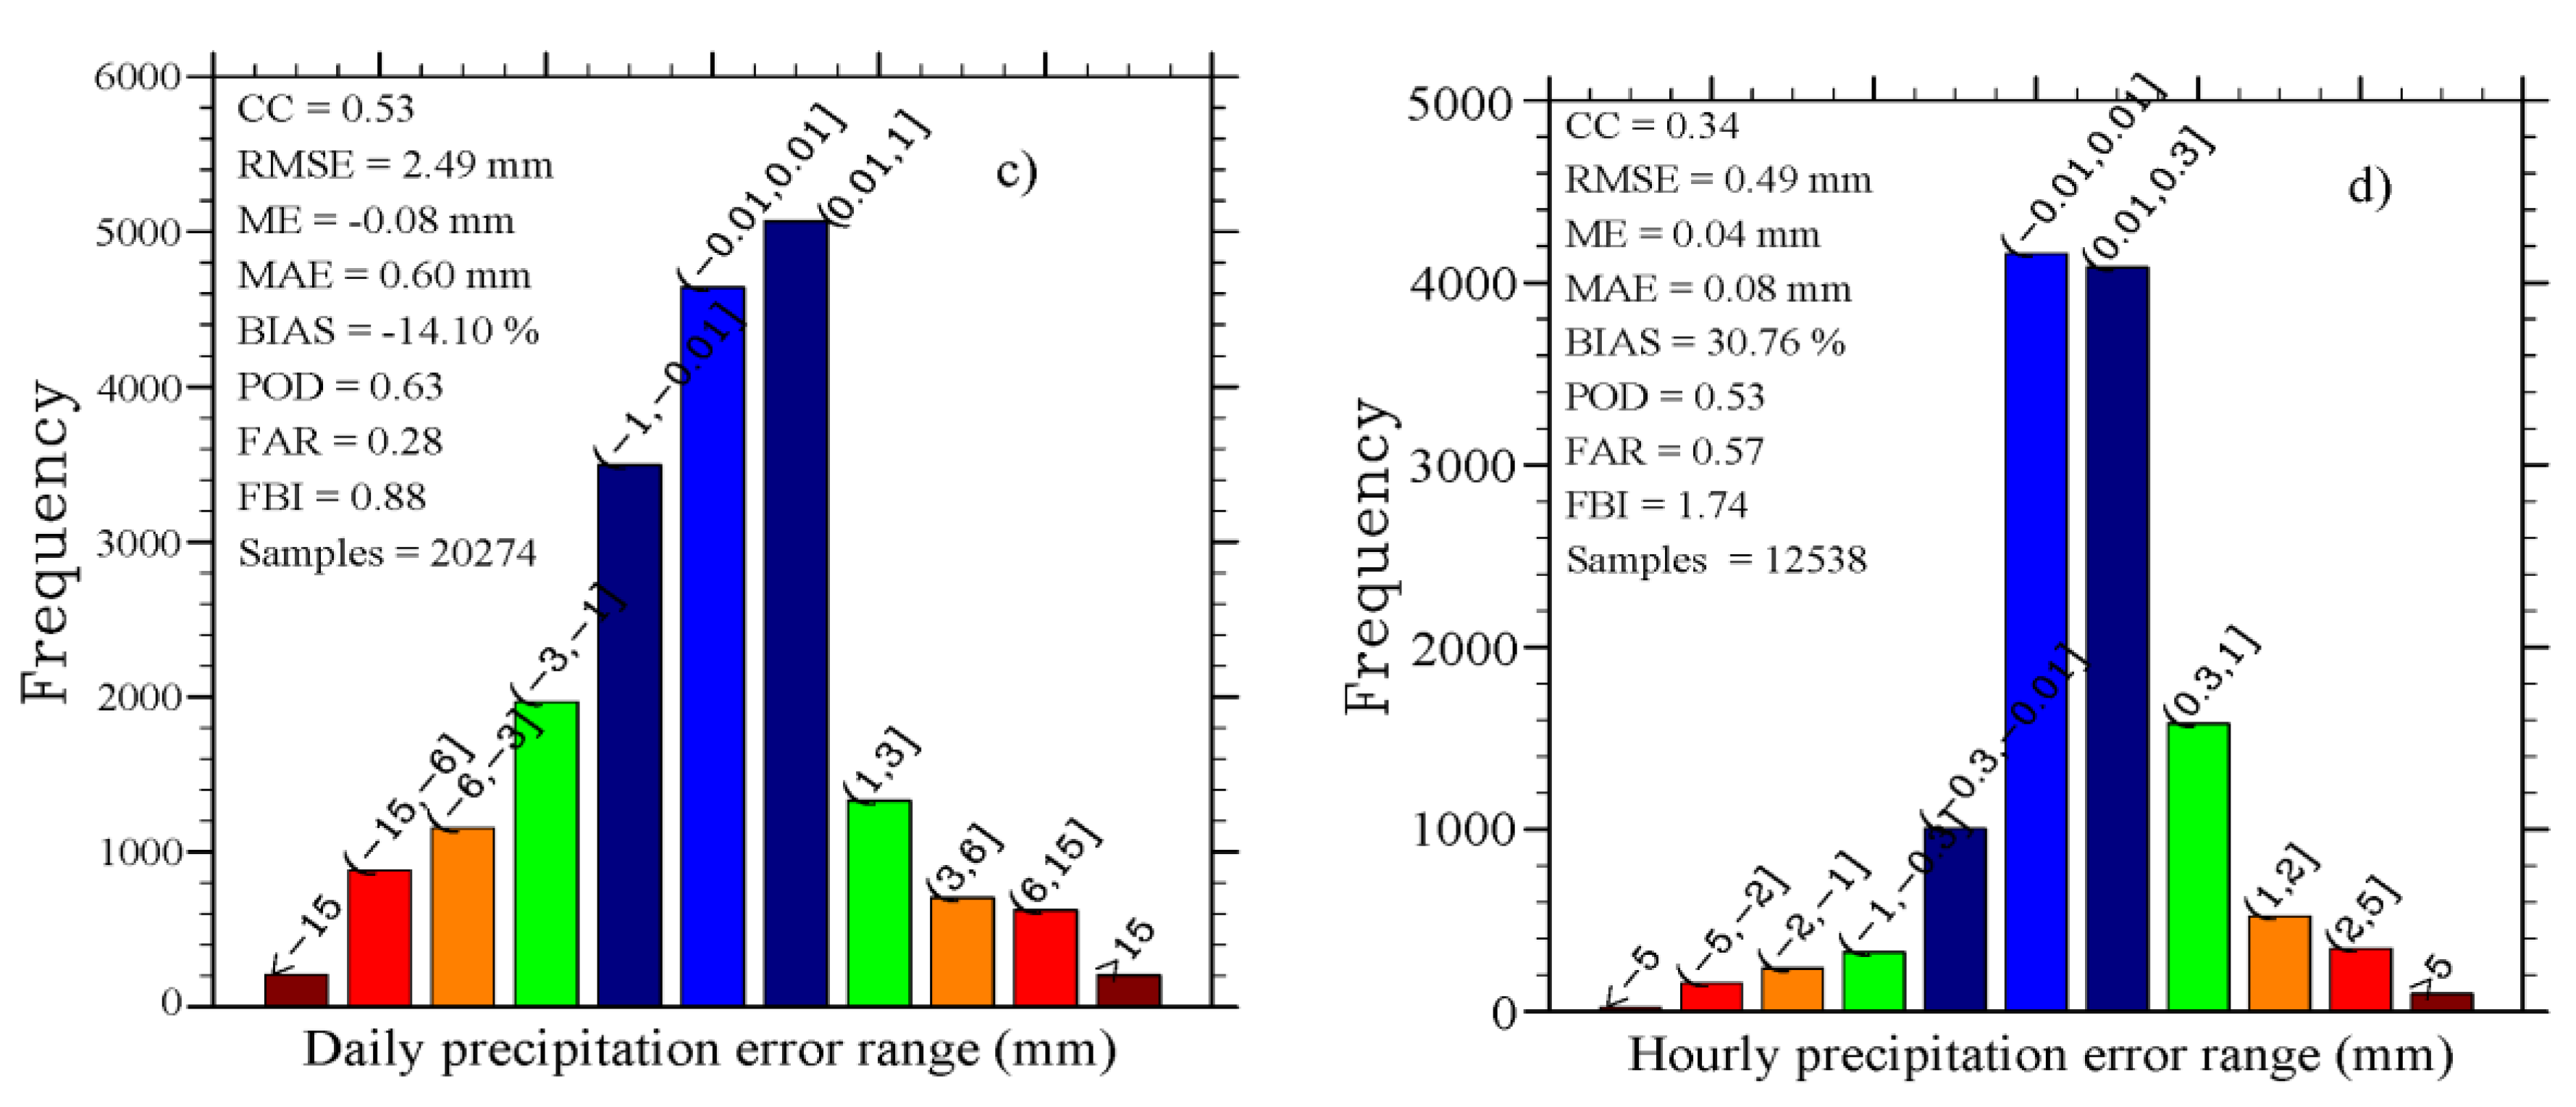
4.1. Error Analysis

Figure 2a,b are scatterplots showing the WRF simulation and observed precipitation at annual and monthly scales from 2000 to 2013. Figure 2c,d are charts showing the error range of precipitation yielded by the WRF model at a daily scale from 2000 to 2013, and at an hourly scale in 2013. To show the error ranges clearly, the number of samples excluded the occasion that precipitation was 0 mm in both the simulation and observation, although it was the largest class accounting for around two-thirds of all events. The negative error range means the precipitation simulated by the WRF model is less than that observed. The positive error range is on the contrary and is dominant in Figure 2c,d. The number of positive errors is far larger than that of negative errors, which means the precipitation being simulated is higher than that being observed. The absolute values of errors are less than 1 mm/day and 0.1 mm/hr at daily and hourly scales respectively. The CC values decreased from 0.940.34 at the annual and hourly scales. The RMSE was 73.78, 51.05, 2.49, and 0.49 mm at the annual, monthly, daily, and hourly scales, respectively. The BIASs were low at the annual, monthly, and daily scales. The BIAS was 30.76% at the hourly scale, but was negative at the daily scale. The daily POD was higher than the hourly value, whereas the converse was found for the FAR. The daily FBI was close to 1, but the hourly FBI was further from 1. The comparison of errors resulted from different physical configurations between this study and in Pan et al [34] is shown in Table 3. Our main aim of this study is to provide more precise precipitation simulated by the WRF model with a more suitable set of physical configuration than that in Pan et al. [34], in which large errors existed over the upstream stations in complex terrain, and that the error analysis between simulation and observation over downstream and midstream are small and similar in both this study and the last study [34], thus avoiding repeated analysis, so only the stations over upstream are employed again to fulfill the comparison analysis between this study and the last study in Table 3. It can be seen from Table 3 that there was a clear improvement in the precipitation simulation in the WRF model in this study compared with Pan et al. [34] and the average error bias was reduced using the physical parameterization adopted in this study, and therefore high spatio-temporal precipitation from 2000 to 2013 was yielded by the WRF model using the most suitable set of the two initial and boundary conditions with nine different physical parameterizations.
Figure 3 shows the accumulated hourly precipitation in 2013 at the AR HiWATER situ and indicates that the trends of these two trend lines are consistent especially from April to August. There is an obvious difference between the WRF simulation and observation at the tail of these two lines during December, it means that more snow has been simulated than the observed—the possible reason is that the adopted set of physical configurations is not suitable to simulate snowfall during winter in the WRF model over the HRB.
Figure 2. Error analysis for the precipitation between the WRF model and observations: (a) and (b) are scatterplots of the precipitation between the WRF simulation and observations at annual and monthly scales; (c) and (d) are charts showing the error range of precipitation yielded by WRF model at daily and hourly scales.
Remotesensing 07 09230 g002aRemotesensing 07 09230 g002b
Table 3. Error bias analysis between two physical parameterization sets evaluated using 2008 annual precipitation.
StationPrecipitation flux (mm)Error (mm)
Observation *WRF-P1 *WRF-P2 *WRF-P1WRF-P2
UpperTuole373.27311.50395.80−61.7722.53
Yeniugou615.09356.50631.83−258.5916.74
Qilian575.69192.60535.84−383.09−39.85
* Compared with the results in Pan et al. [33], the observation data has been modified according to Section 2.1; WRF-P1 is a WRF simulation using the physical parameterization in Pan et al. [33]; WRF-P2 is a WRF simulation using the physical parameterization adopted in this study.
Figure 3. Comparison of time series of accumulated hourly precipitation between WRF simulation and observation at the AR HiWATER site in 2013.
Remotesensing 07 09230 g003

4.2. Spatial Precipitation Pattern

The average annual precipitation values are approximately 79.7 mm, 582.8 mm, 185.8 mm, and 37.1 mm over the whole basin, upstream, midstream, and downstream areas from 2000 to 2013, respectively.
The elevation of the HRB was divided into nine classes over the second domain. From Figure 4, it can be seen that the highest annual precipitation occurred at an elevation from 3500 to 4000 m. The average annual precipitation gradually increased as the elevation increased, with a peak (701.1 mm) at an elevation from 3500 to 4000 m. The dominant elevation for the HRB is from 1000 to 1500 m, which accounts for most of the downstream area and part of the midstream, and the average annual precipitation is around 48.5 mm. The coefficient is approximately 25 mm/100 m (R2 = 0.93, p = 0.25 h − 283.96, where p is precipitation, h is elevation) between the elevation (1000–4000 m) and precipitation, and approximately −15 mm /100 m (R2 = 0.99, p = −0.15 h + 1264.40) between the elevation (4000–5500 m) and precipitation.
Nine dominant land use types were used to calculate the average annual precipitation for different land use and cover change (LUCC) categories in the HRB from 2000 to 2013. From Figure 5, it can be seen that the average annual precipitation was highest (738.6 mm) for permanent wetland. The lowest average annual precipitation was only 42.3 mm in the barren or sparsely vegetated region, which accounts for the largest percentage cover in the HRB. The second largest percentage cover is shrubland, where precipitation is 75.3 mm. The third largest is grassland, with an average precipitation of 436.0 mm.
Figure 4. The average annual precipitation at different elevations in the HRB from 2000 to 2013.
Remotesensing 07 09230 g004
Figure 5. The average annual precipitation for different land use and cover change (LUCC) categories in the HRB from 2000 to 2013
Remotesensing 07 09230 g005

4.3. Temporal Precipitation Pattern

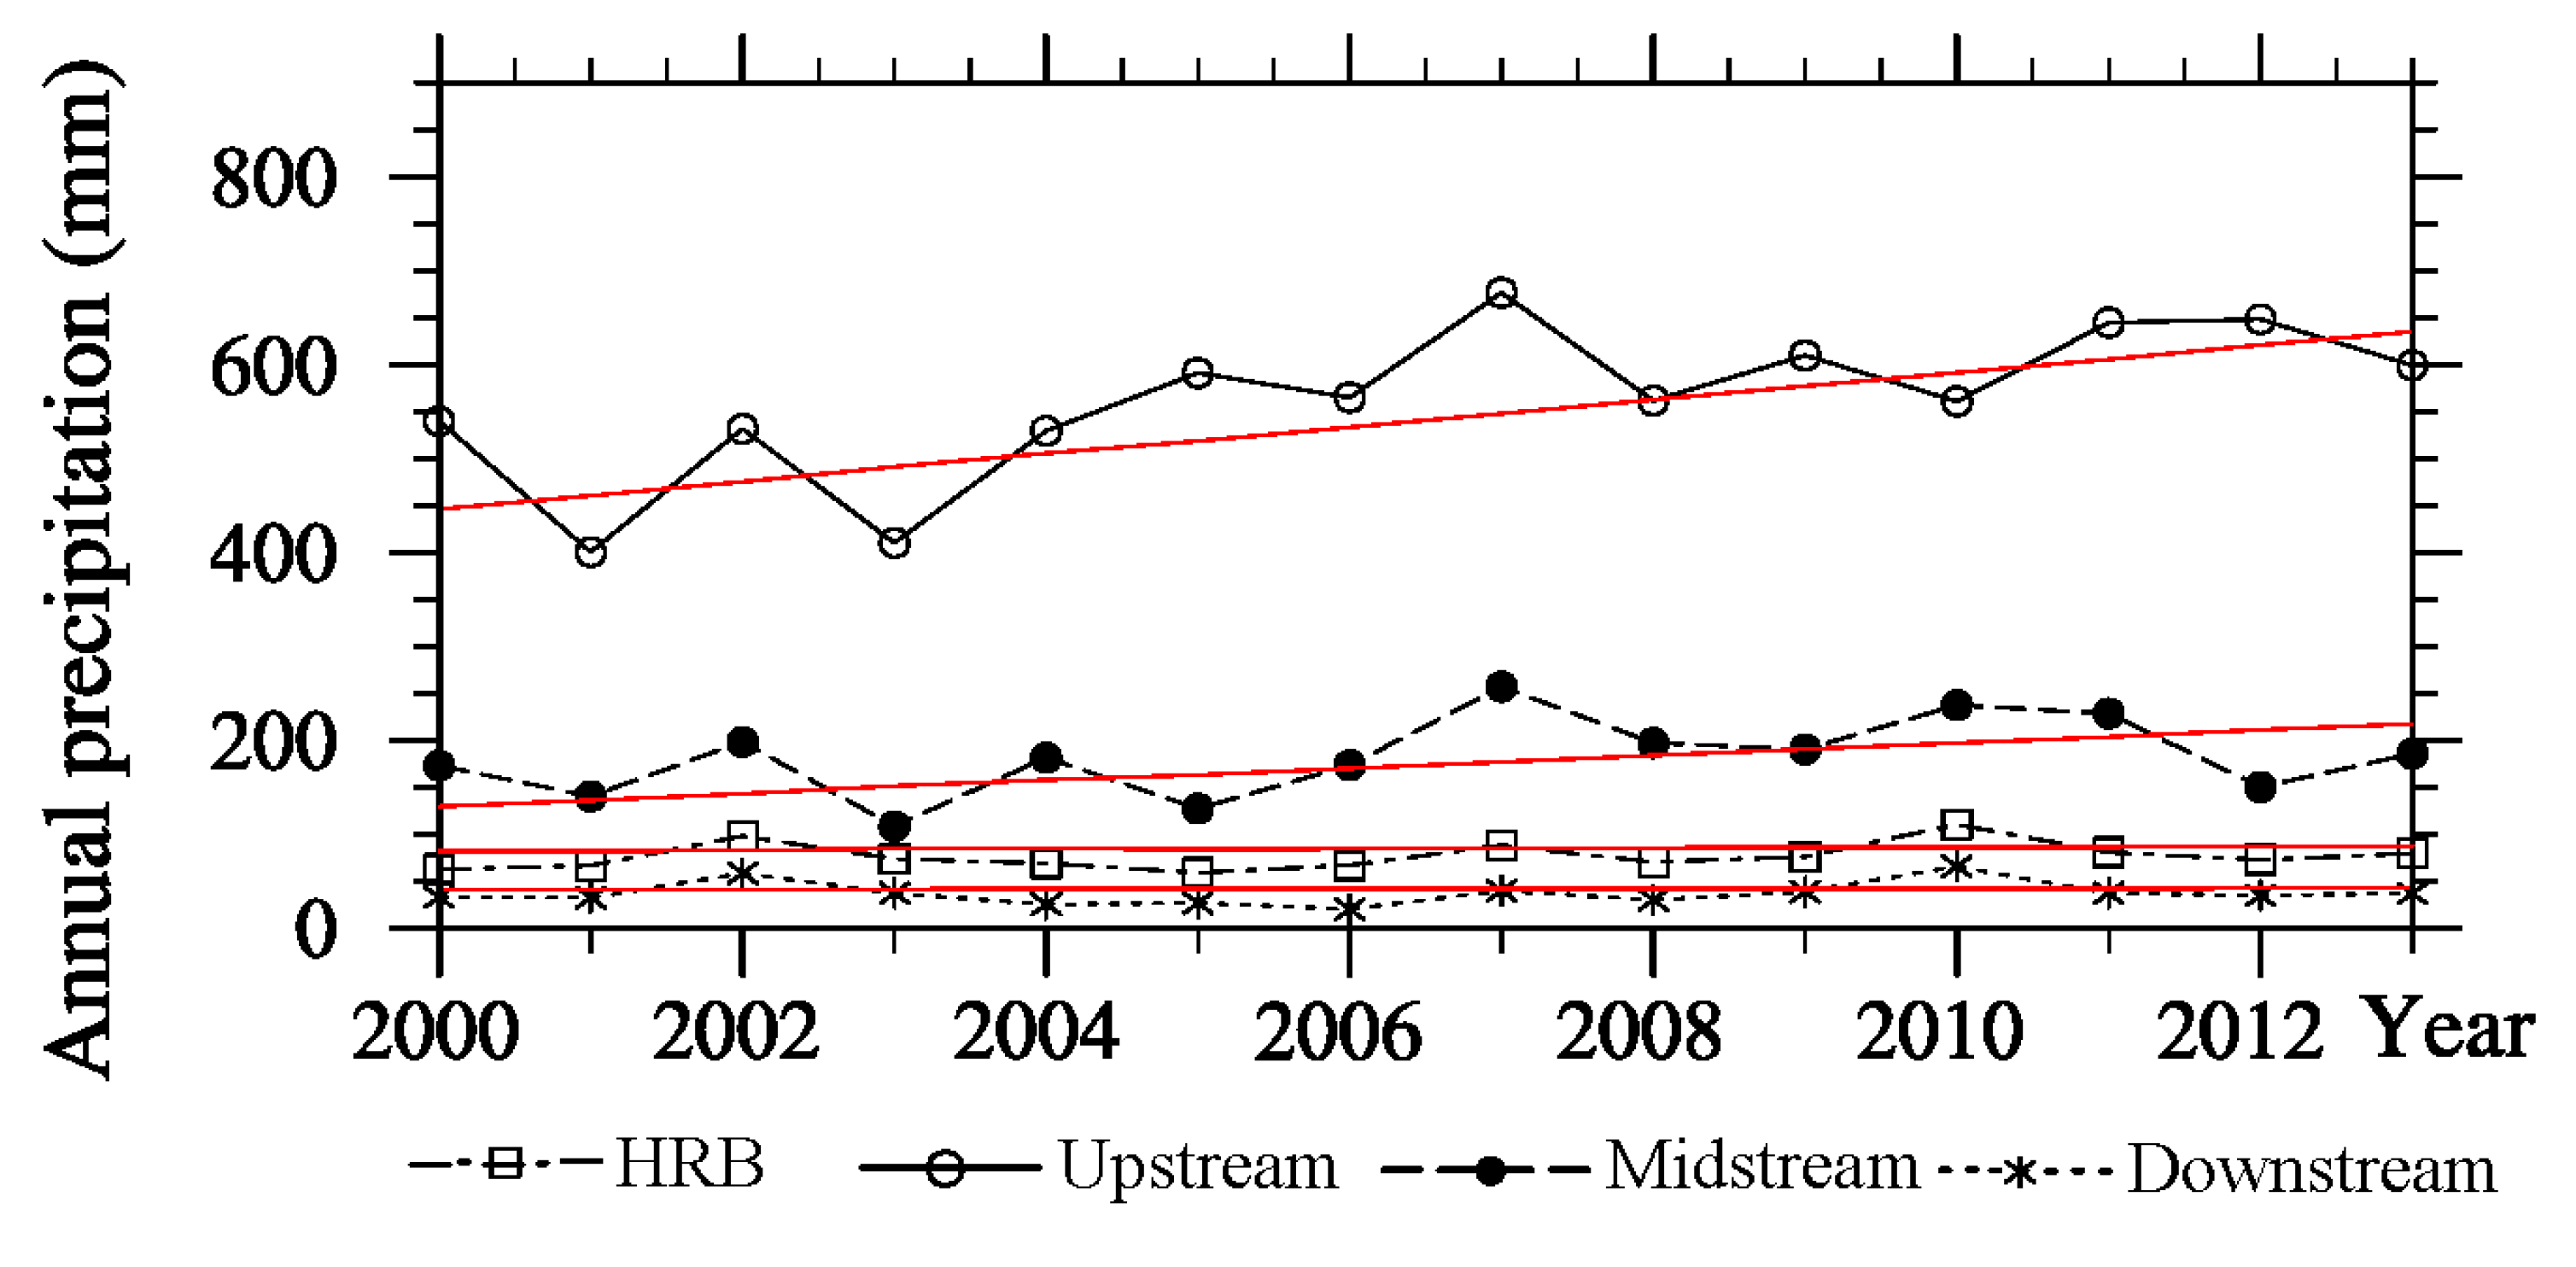
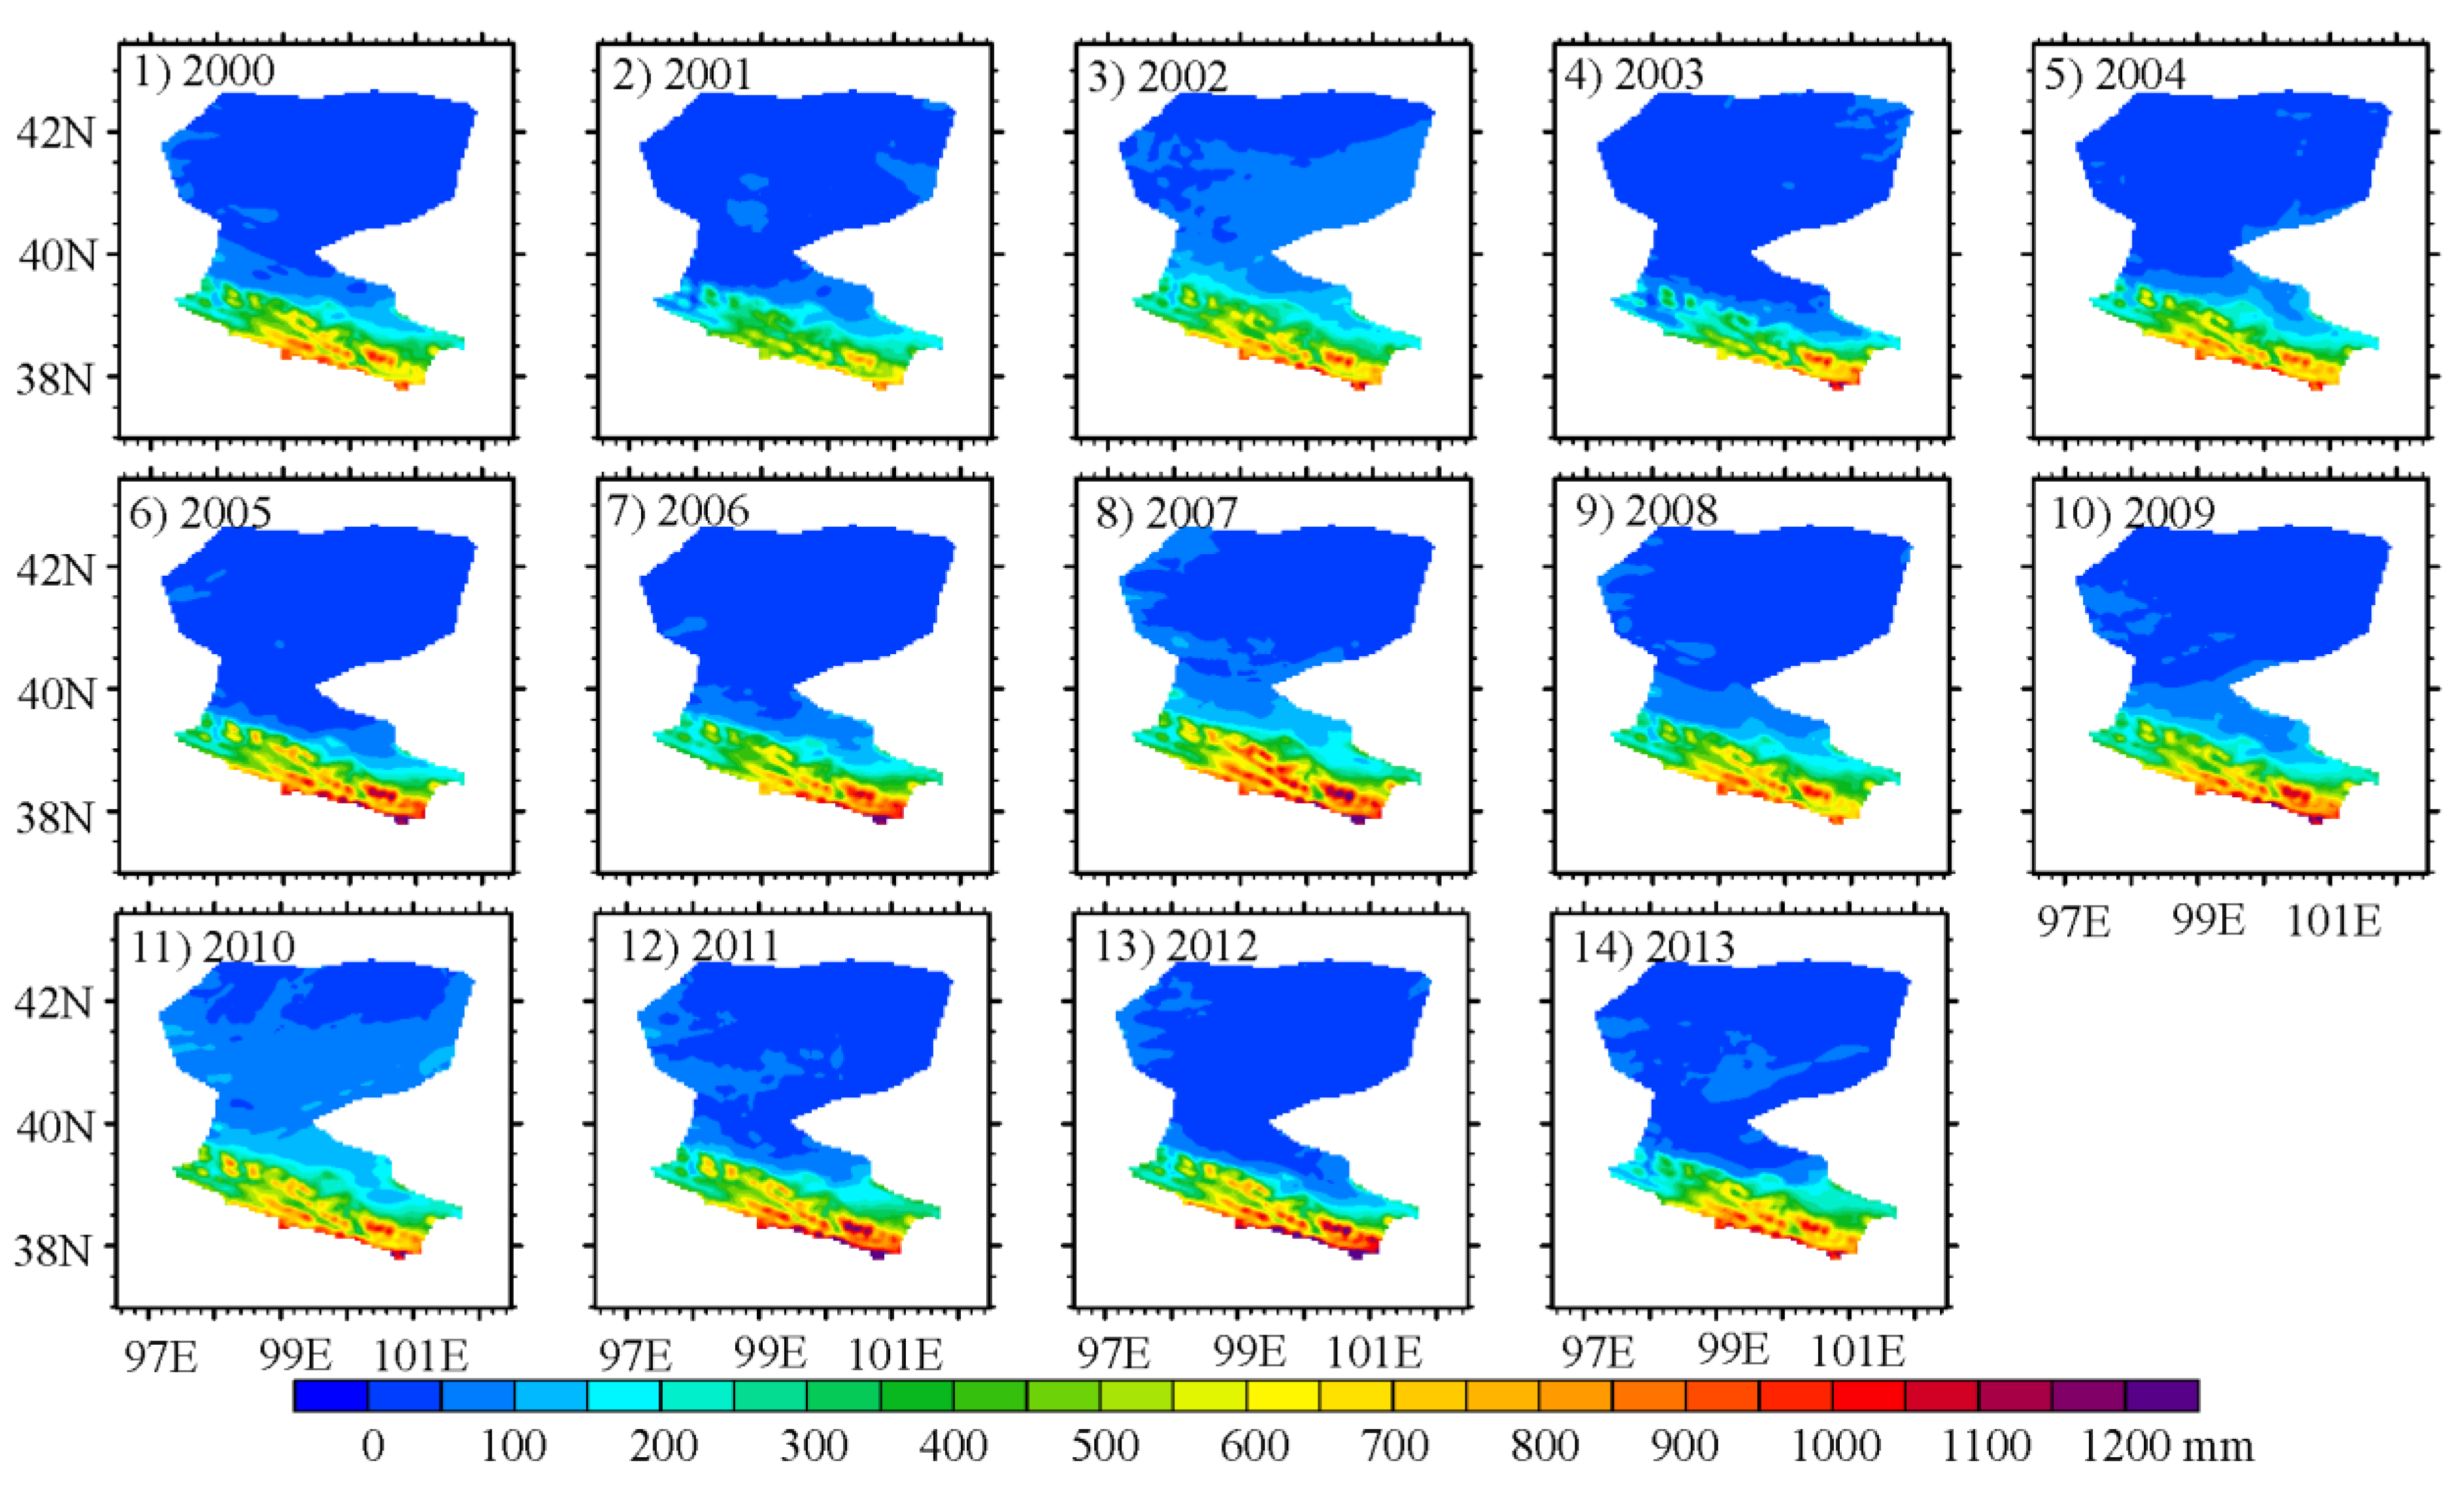
4.3.1. Annual Precipitation

Figure 6. Annual precipitation over the HRB from 2000 to 2013.
Remotesensing 07 09230 g006
Figure 7. Accumulated annual precipitation curves over the HRB and in up-, mid-, and downstream areas from 2000 to 2013.
Remotesensing 07 09230 g007
Figure 8. Annual runoff curve at the Yingluo Valley from 2000 to 2012.
Remotesensing 07 09230 g008
Figure 6 and Figure 7 show the accumulated annual precipitation over the HRB from 2000 to 2013. During the 14-year period the peak precipitation occurred in 2007 and reached 681.0 mm over the upstream area and in this year the stream flow from the upstream area also reached its maximum value in the past 14 years. There were clear rising trends from 2000 to 2013 over the upstream and midstream areas, with trend coefficients of 12.9 mm and 5.7 mm per year, respectively. The rising trend and peak of precipitation over the upper stream is also similar to that of runoff at the Yingluo Valley from 2000 to 2012 (Figure 8). We compare these two sets of data because the runoff of Yingluo Valley is thought to originate from the upstream of the HRB. So Figure 8 indicates that the trend and peak of precipitation simulated by the WRF model at a yearly scale is reasonable over the upstream of the HRB, the most complex terrain the whole region.

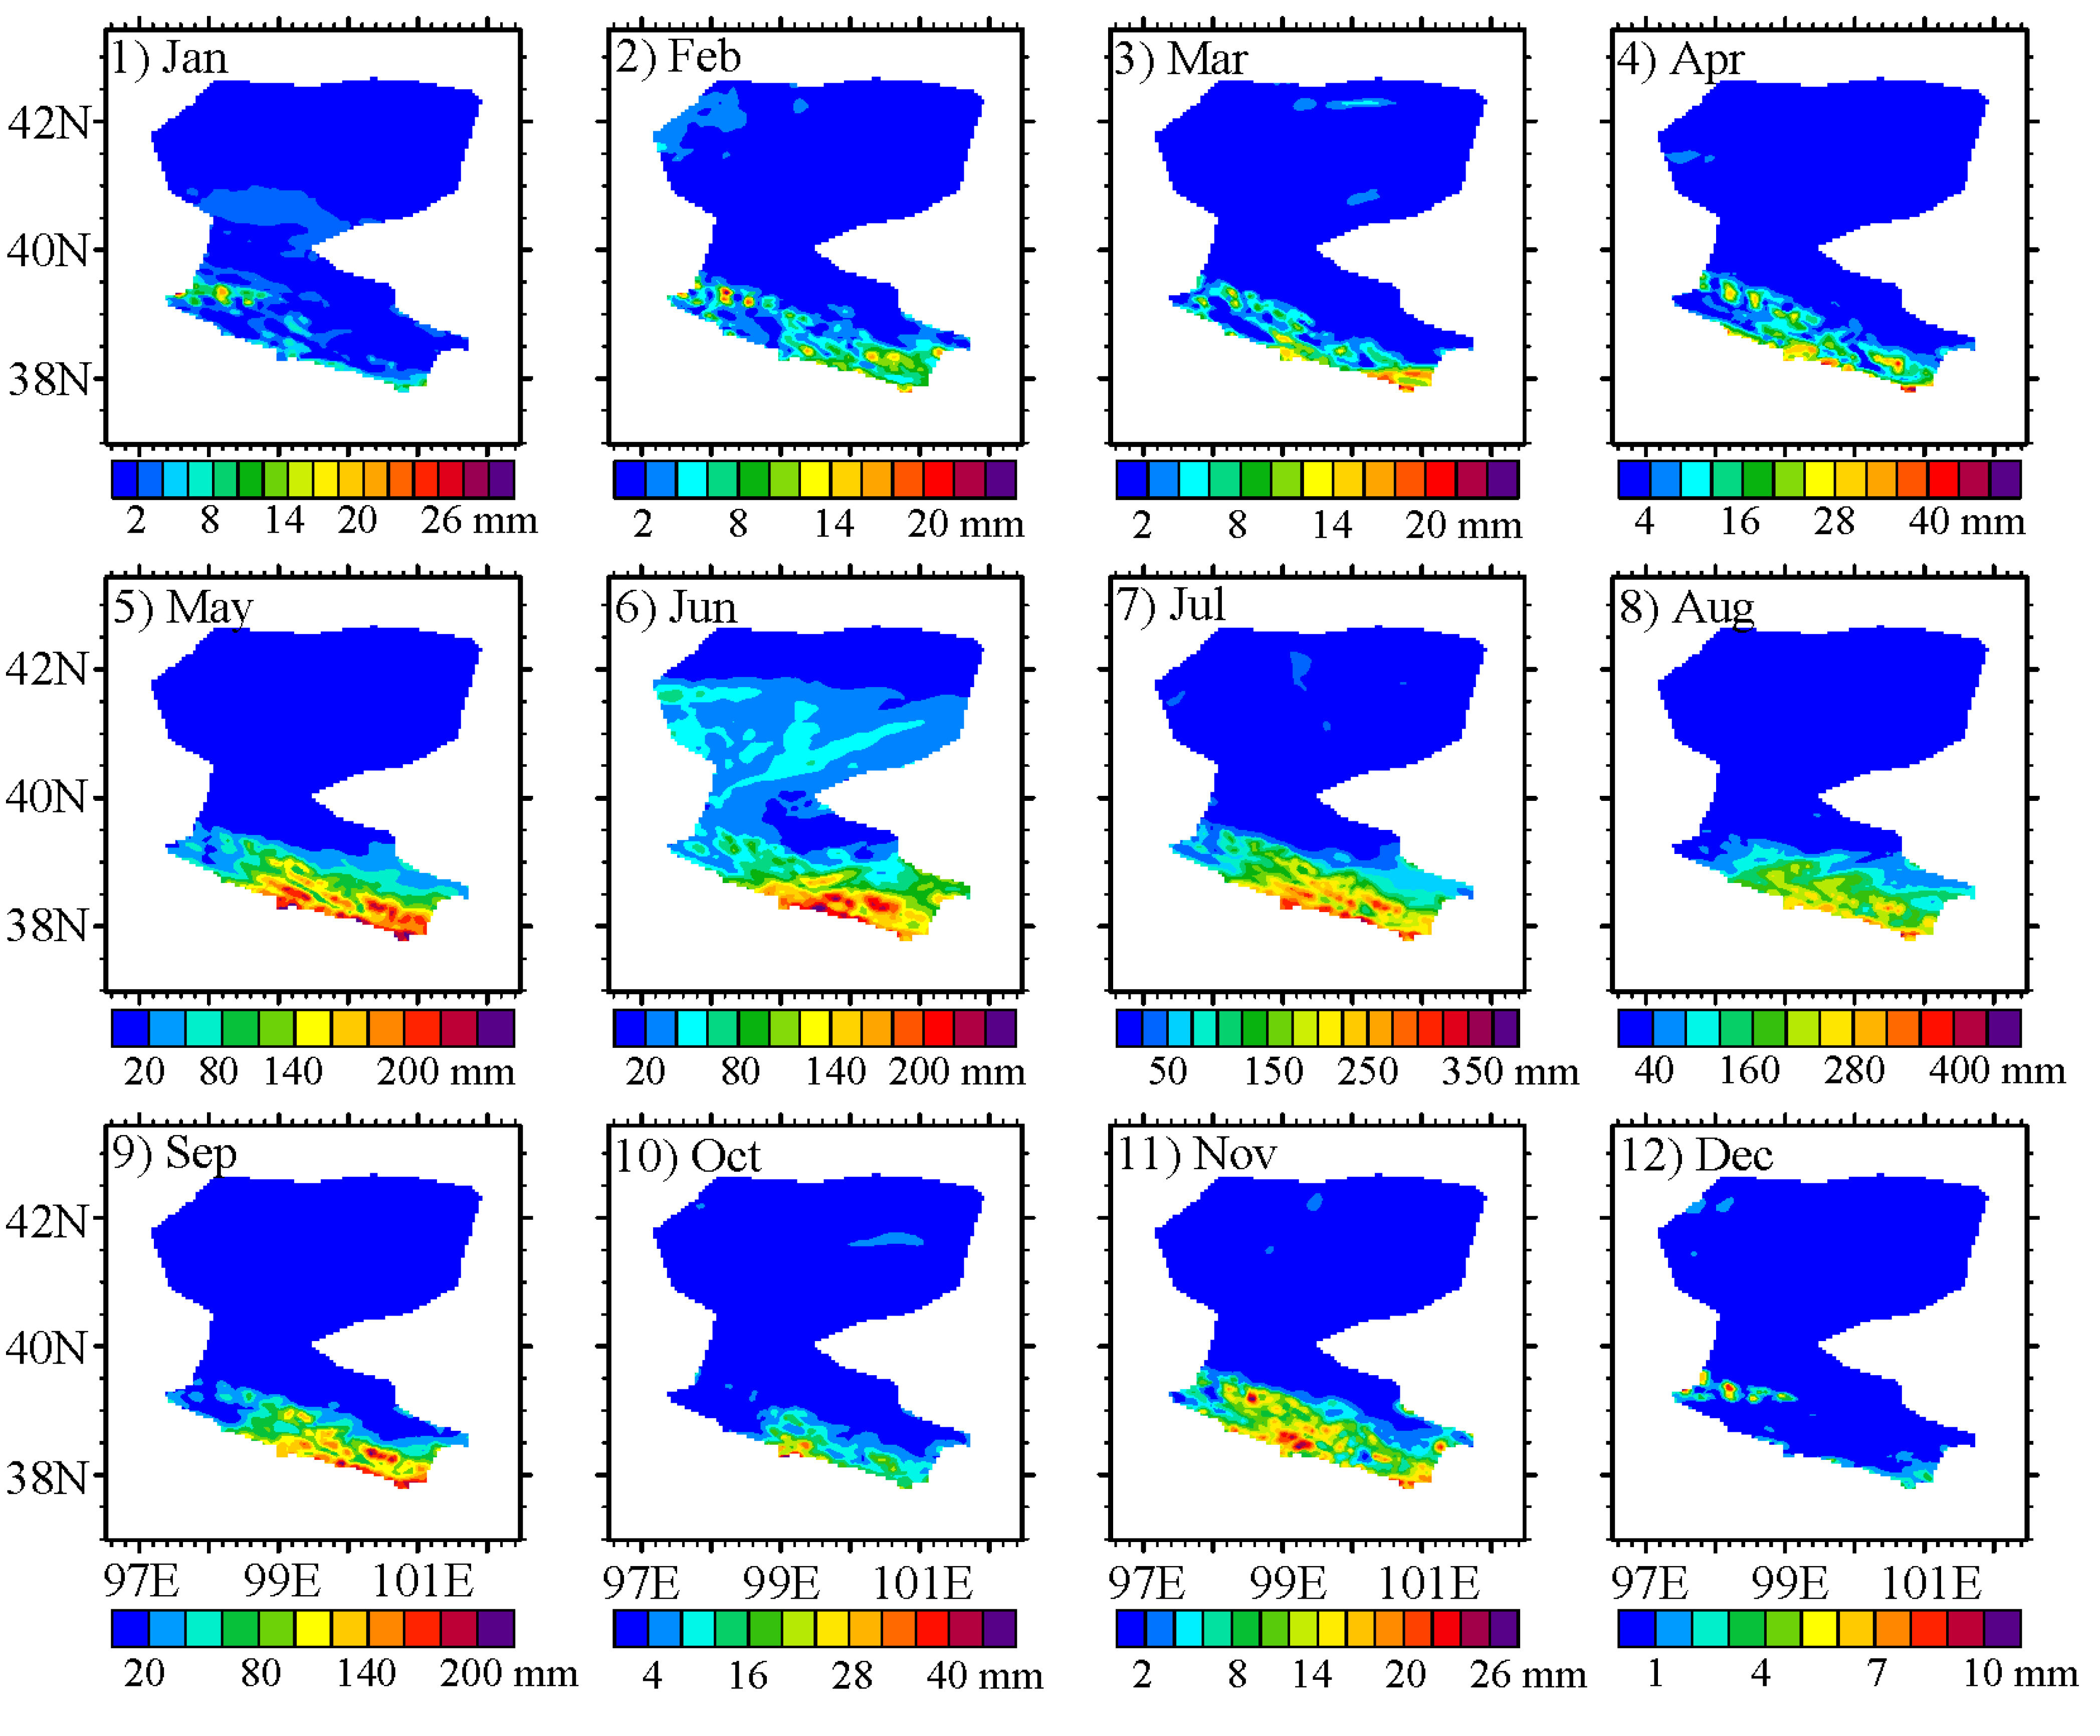
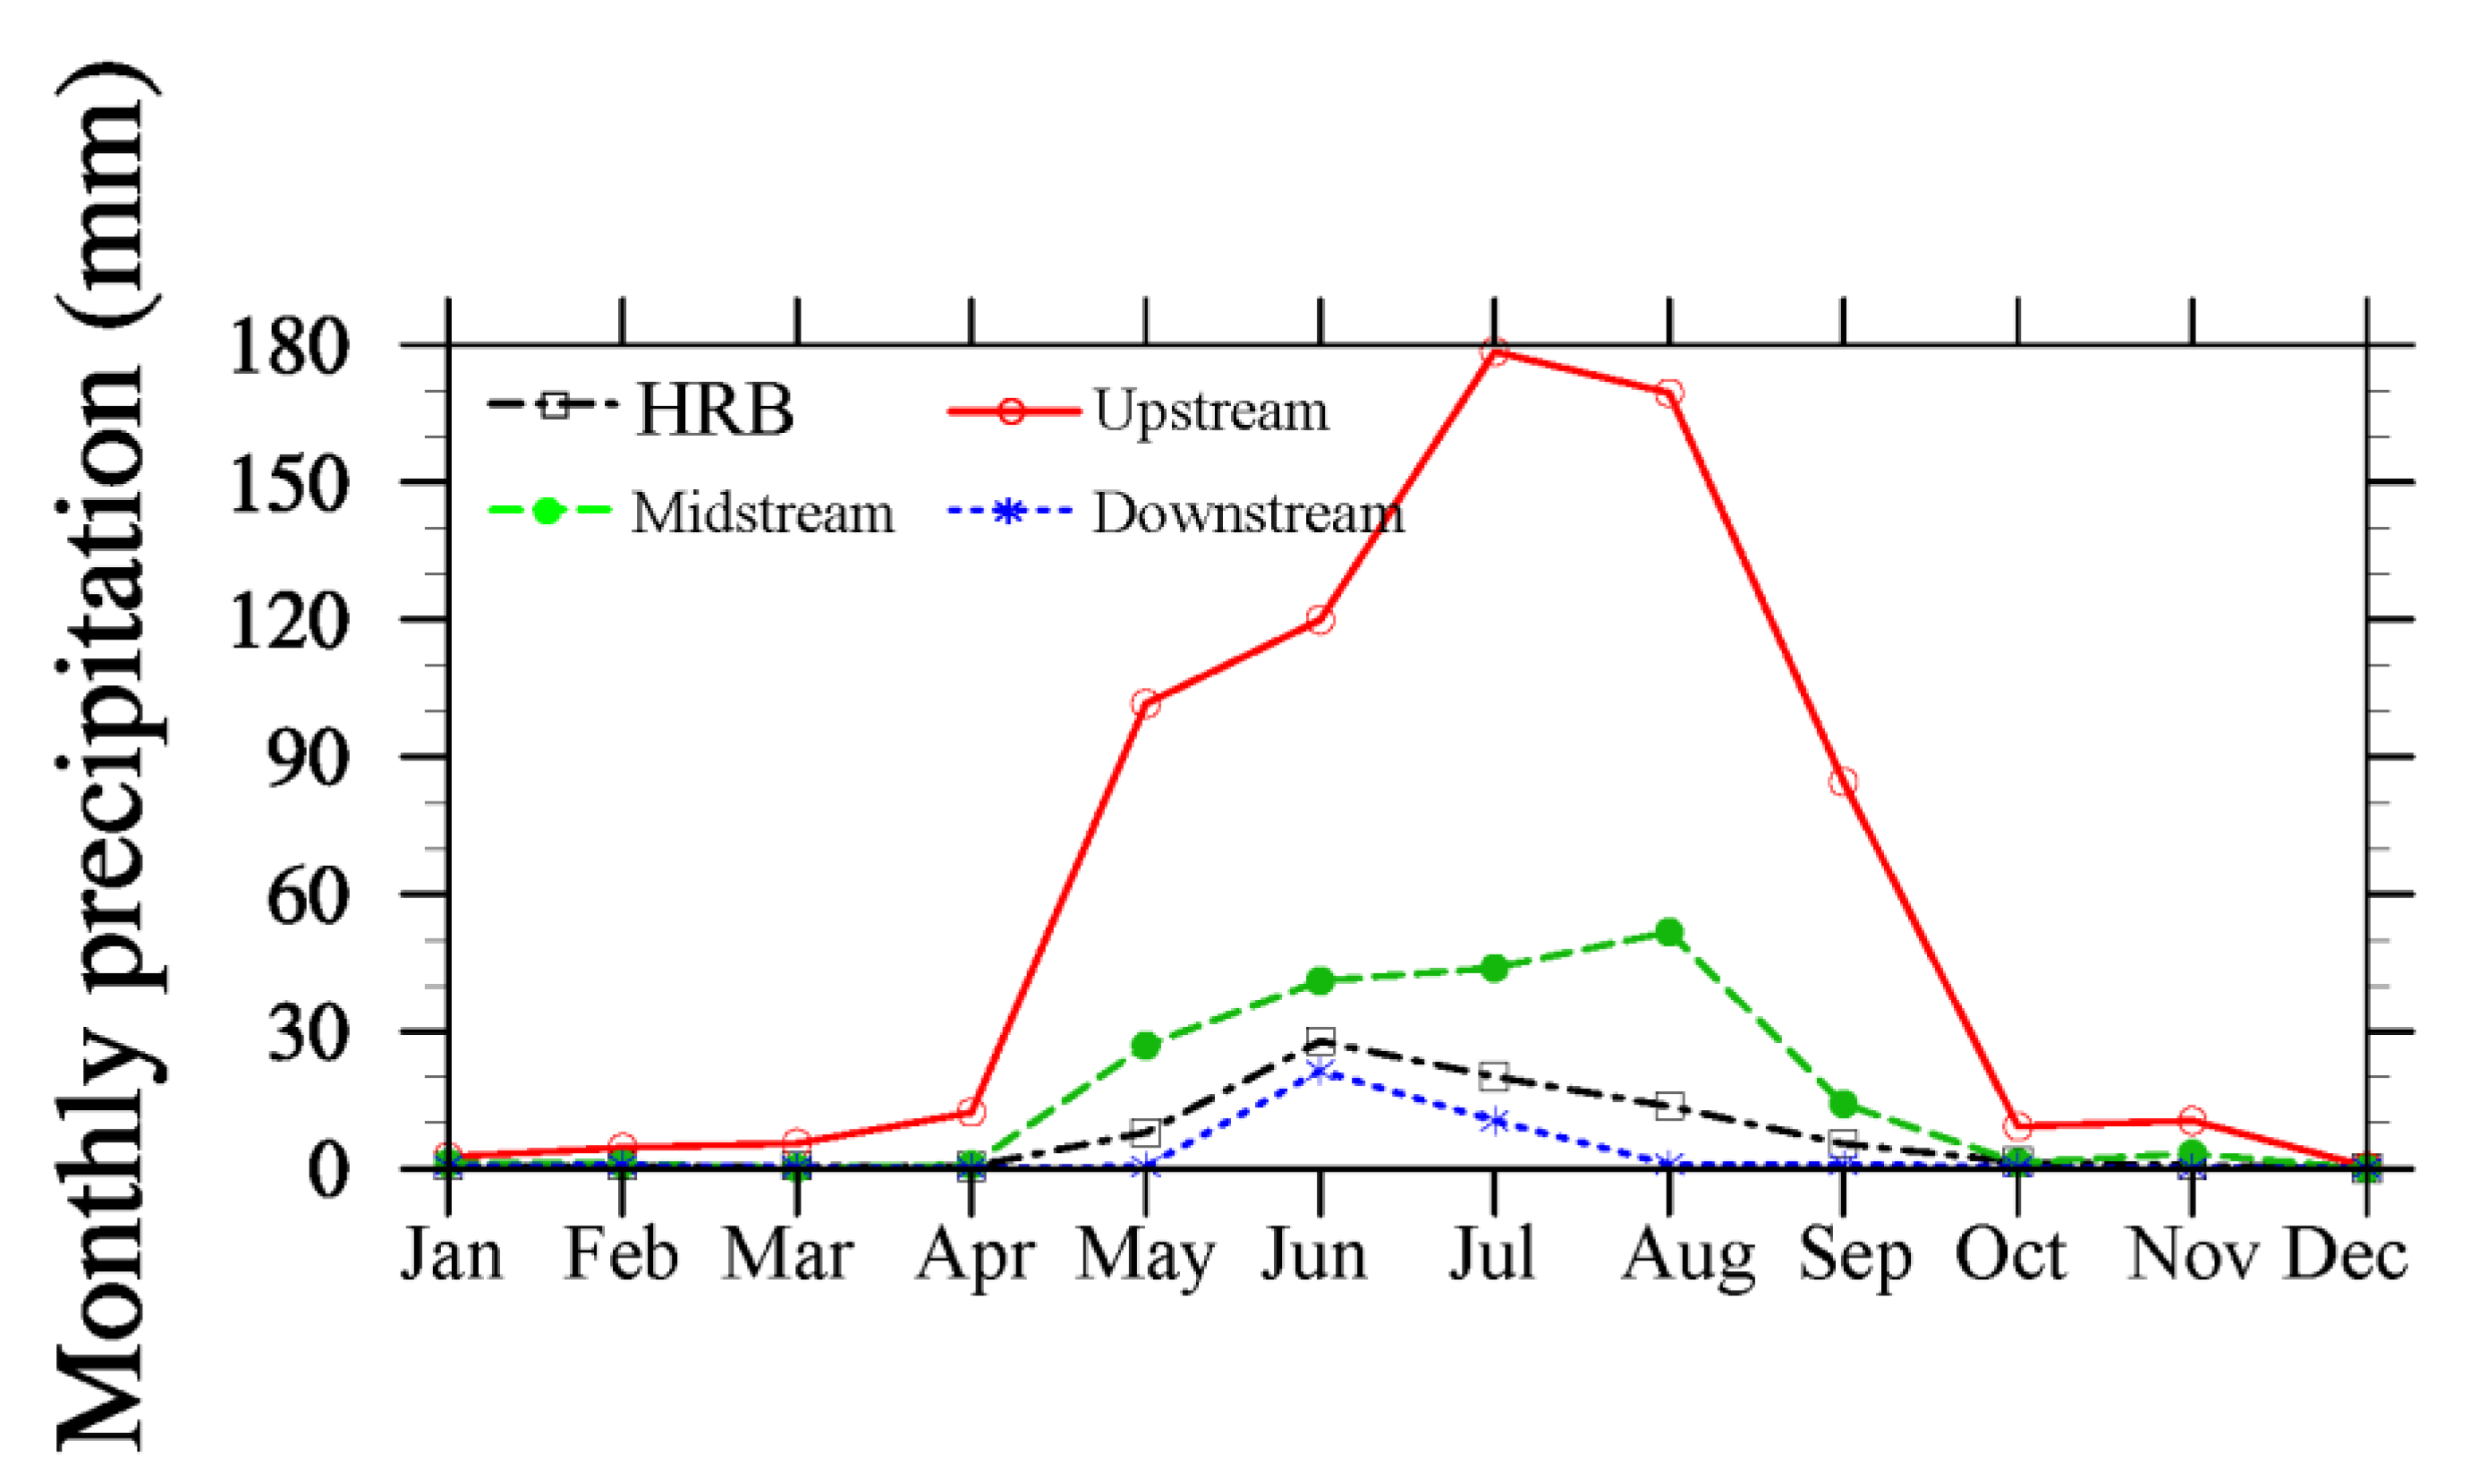
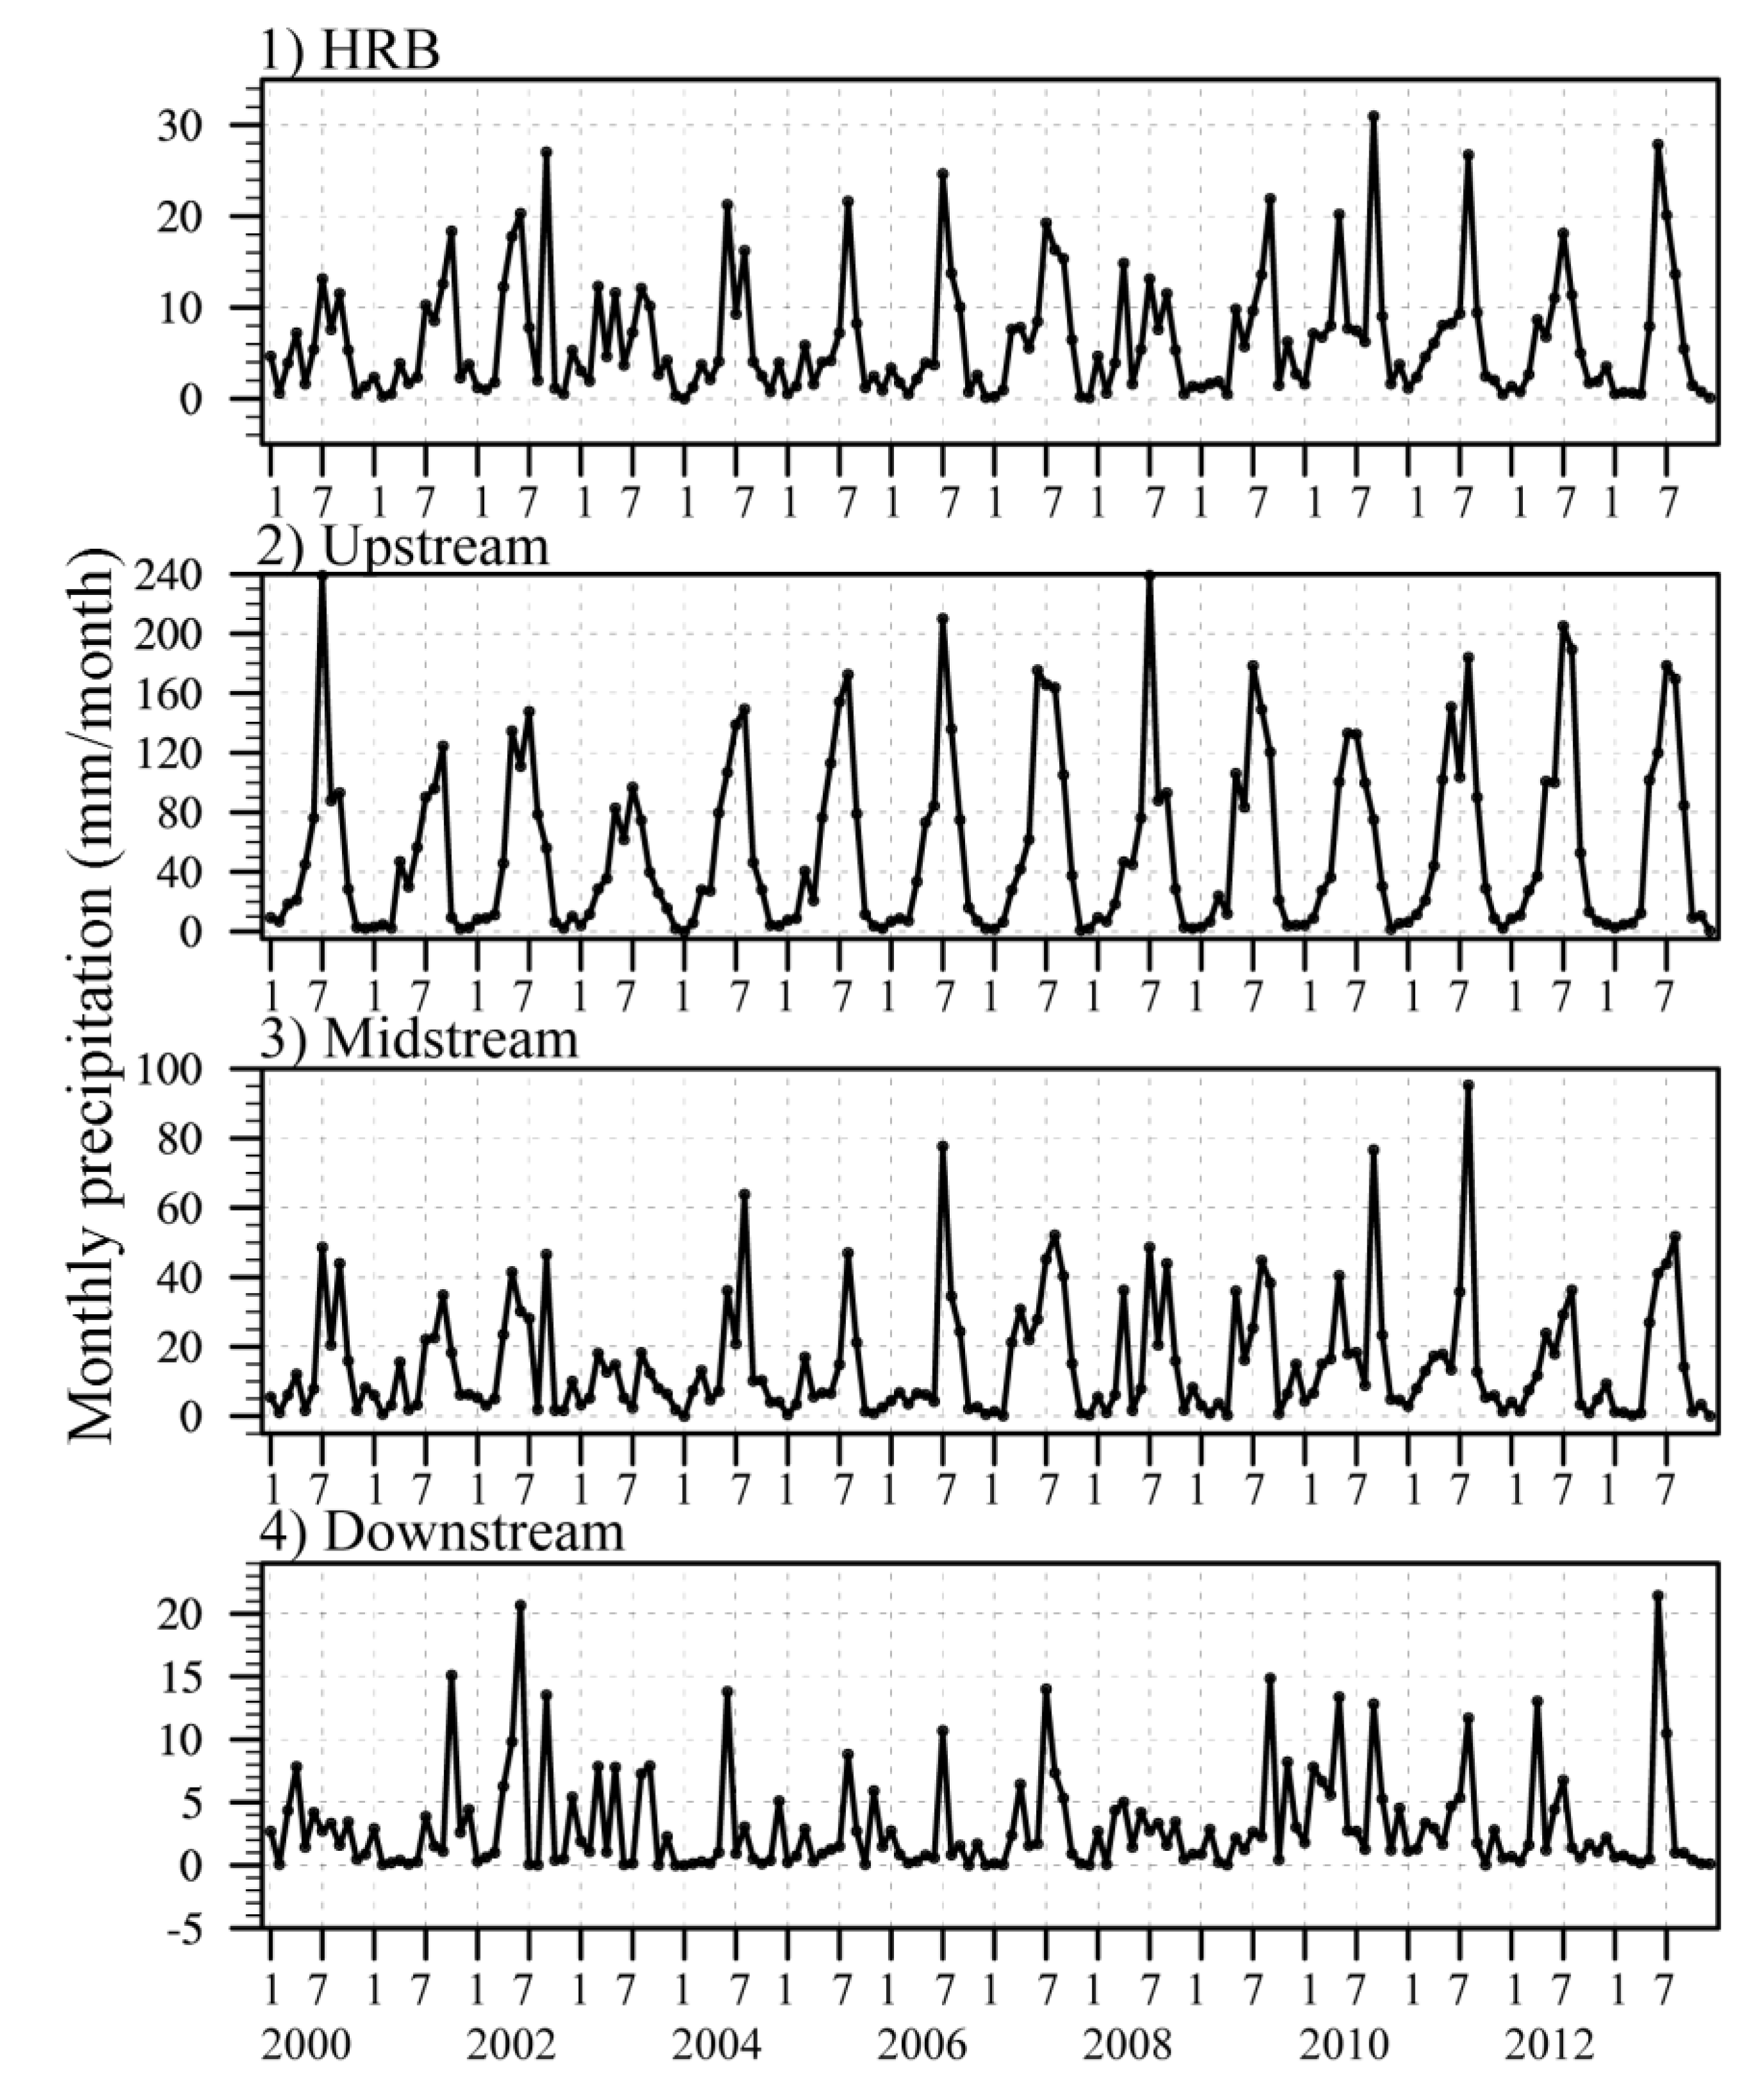
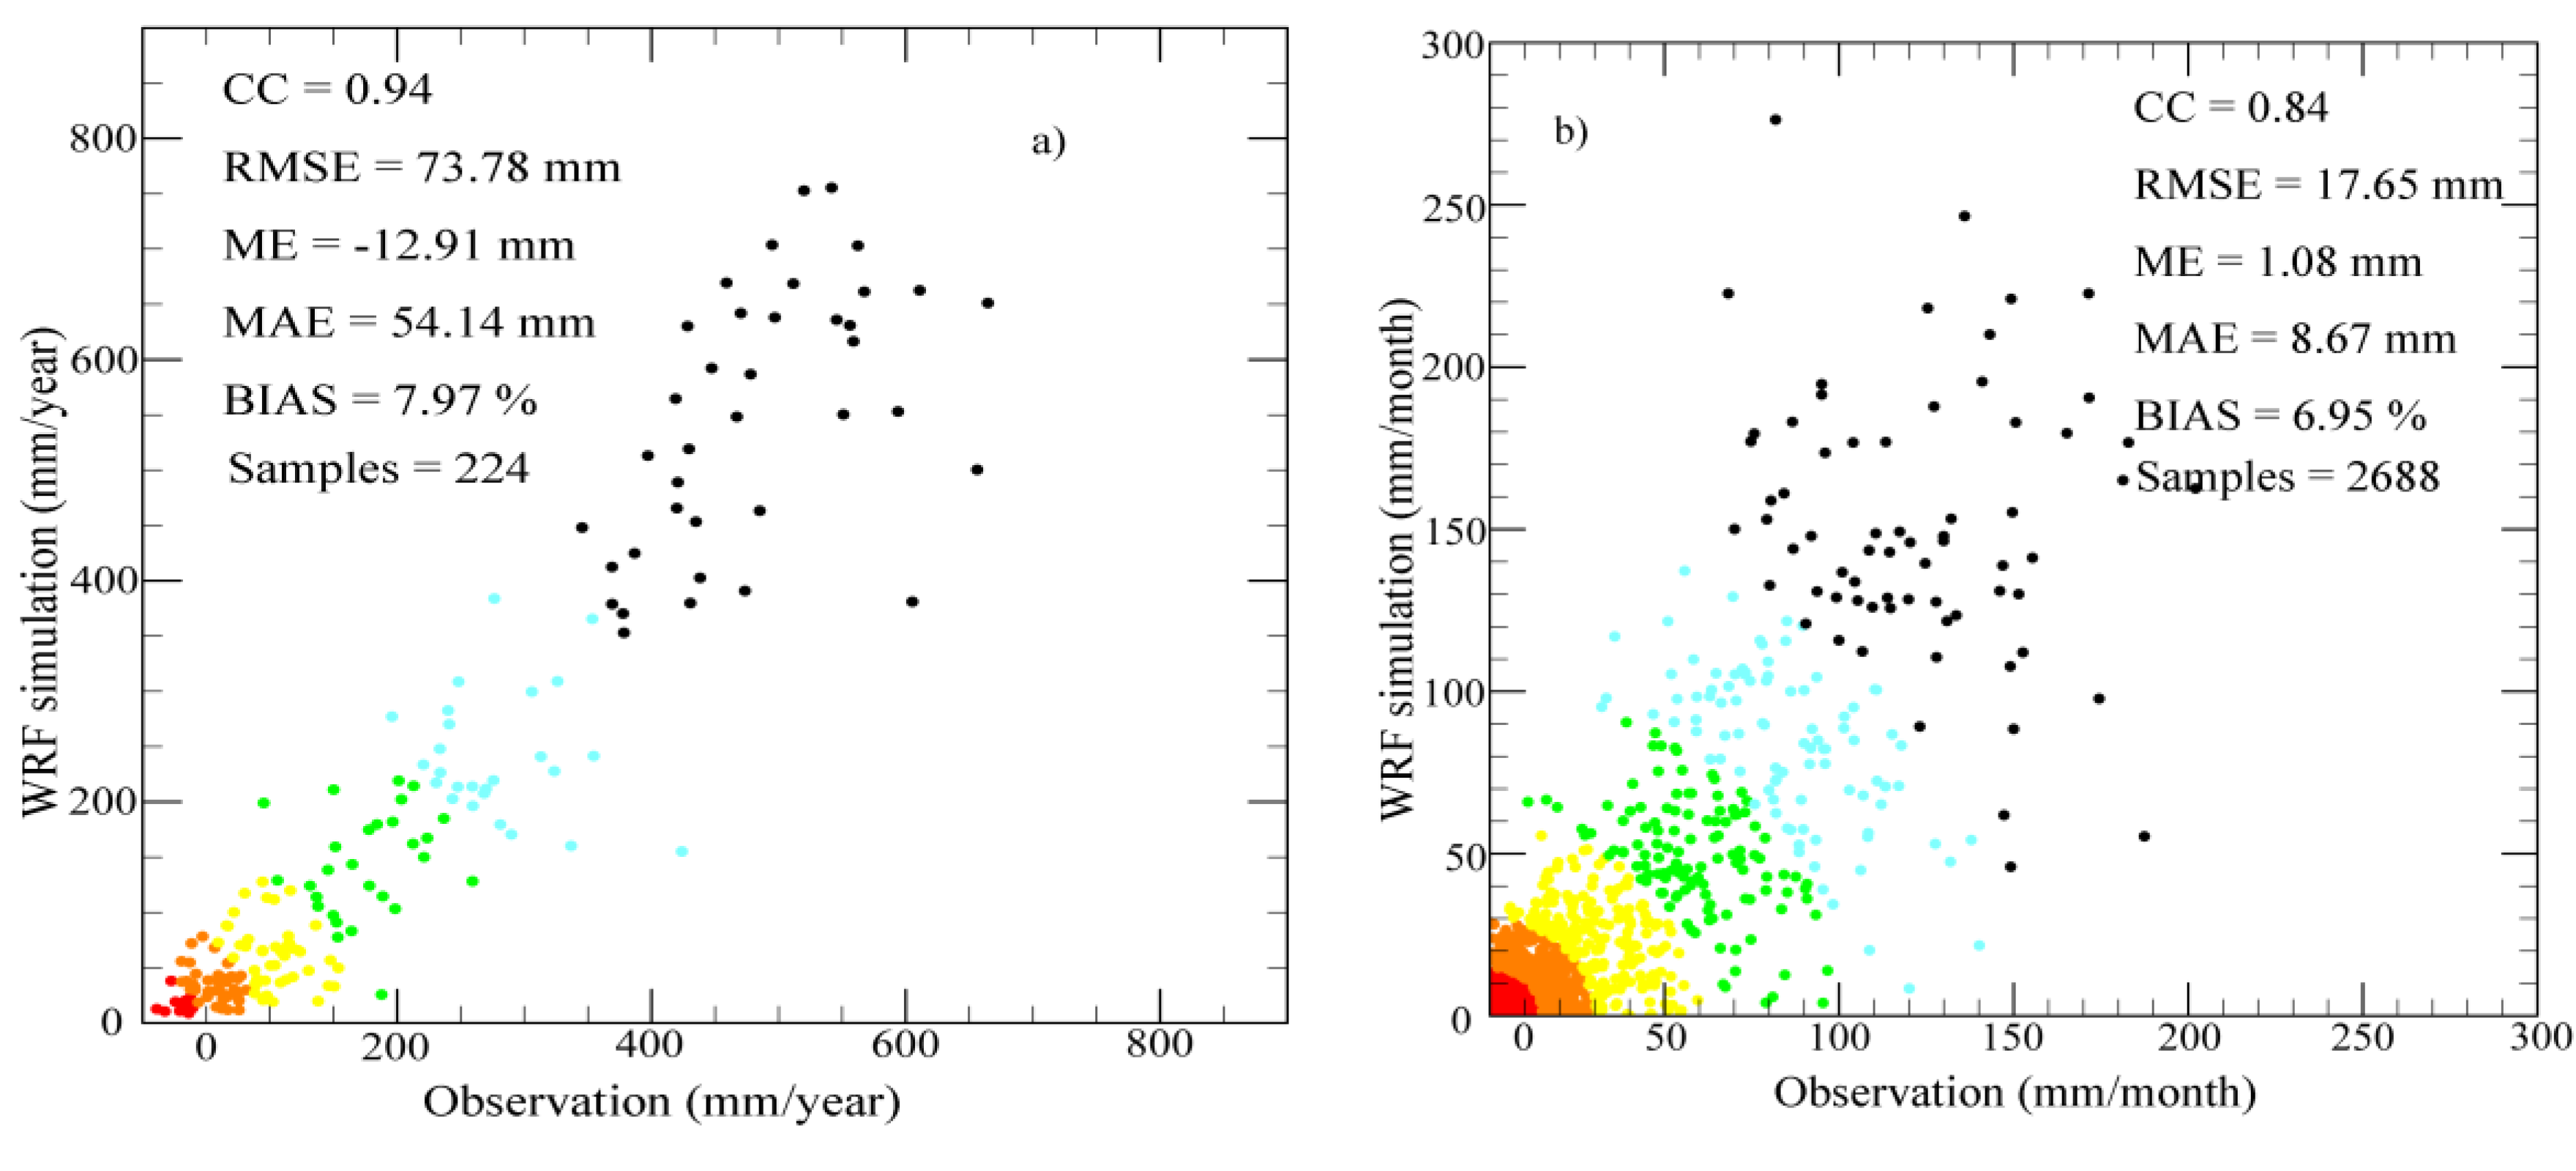
4.3.2. Monthly Precipitation

Figure 9 and Figure 10 show the average monthly precipitation over the HRB from 2000 to 2013. Approximately 94% of the precipitation occurred from May to September, with the highest values of 190 mm in the upstream area in July, 55 mm in the midstream area in August, and 19 mm in the downstream area in June. The average JJA precipitation from 2000 to 2013 was around 61.7 mm (77.4% of the annual total) in the HRB. It was approximately 390.00 mm (66.9% of the annual total) in the upstream area. In the midstream area it was around 136.7 mm (73.6% of the annual total), while it was around 32.9 mm (88.8% of the annual total) in the downstream area. Figure 11 shows a time series of monthly precipitation for 2000–2013 in the HRB and its sub-streams.
Figure 9. Mean monthly precipitation over the HRB from 2000 to 2013.
Remotesensing 07 09230 g009
Figure 10. Mean monthly precipitation curves over the HRB and in up-, mid- and downstream areas from 2000 to 2013.
Remotesensing 07 09230 g010
Figure 11. Time series of monthly precipitation for the HRB, and its upstream, midstream, and downstream areas from 2000 to 2013.
Remotesensing 07 09230 g011

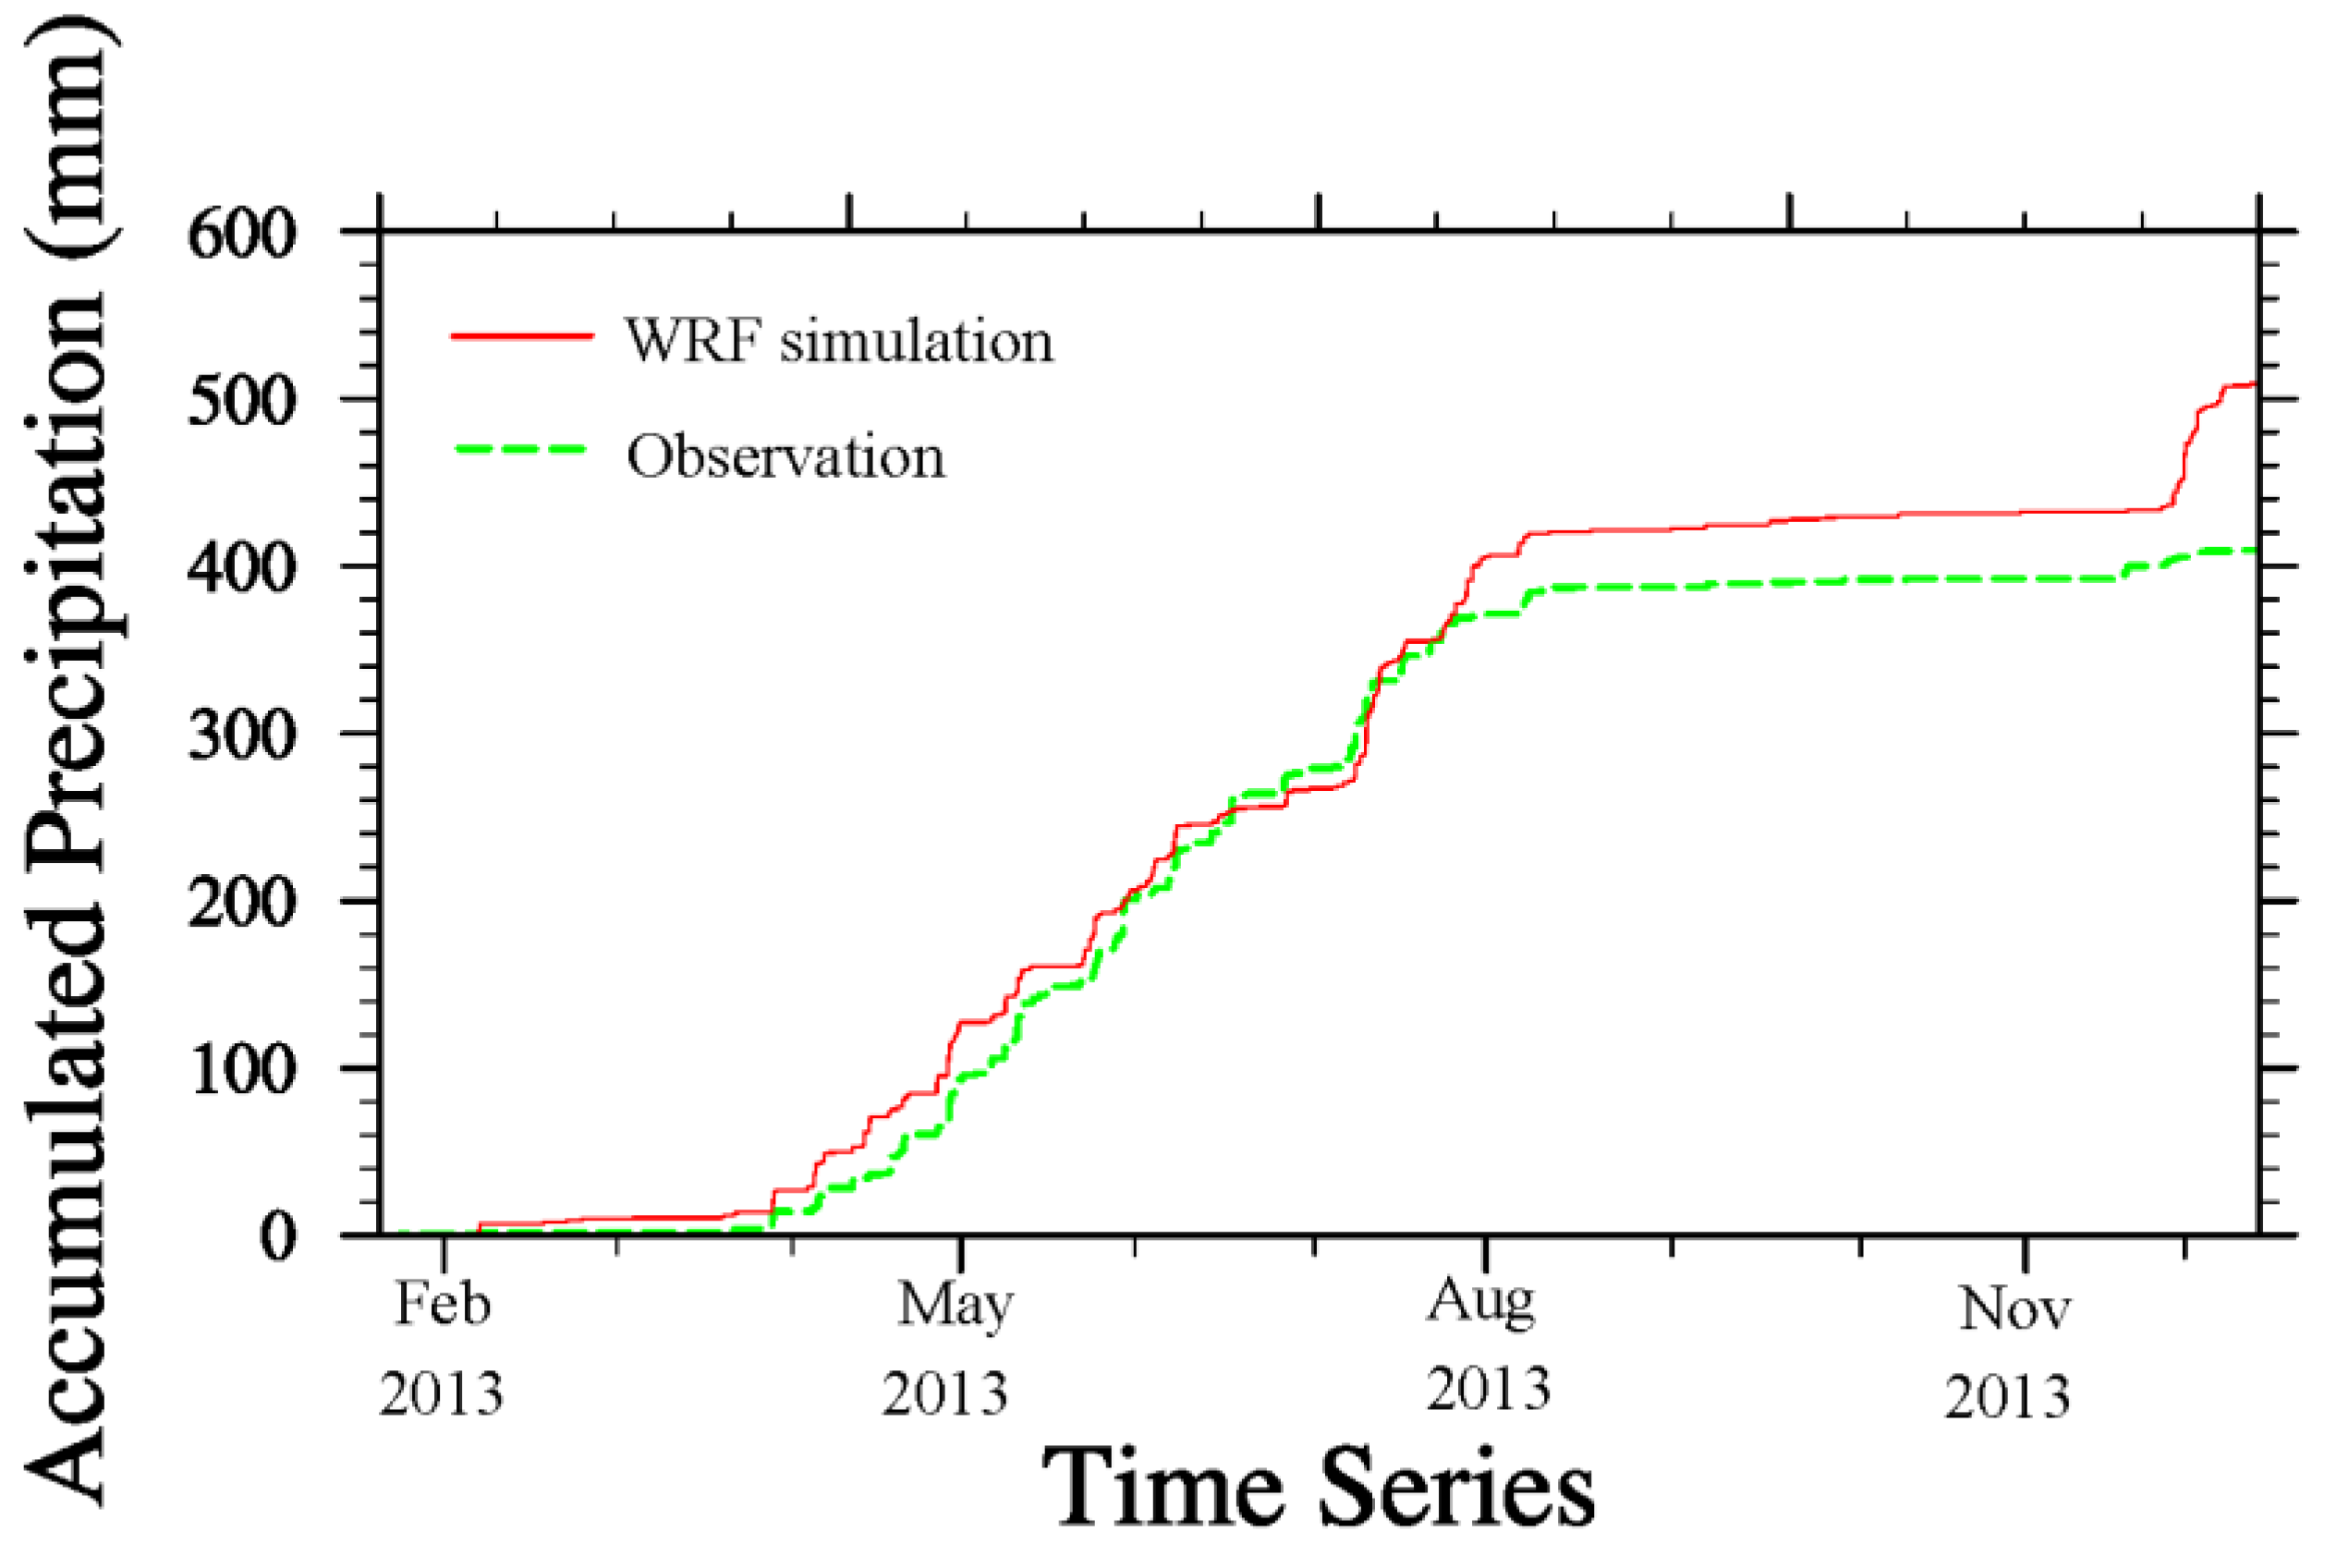
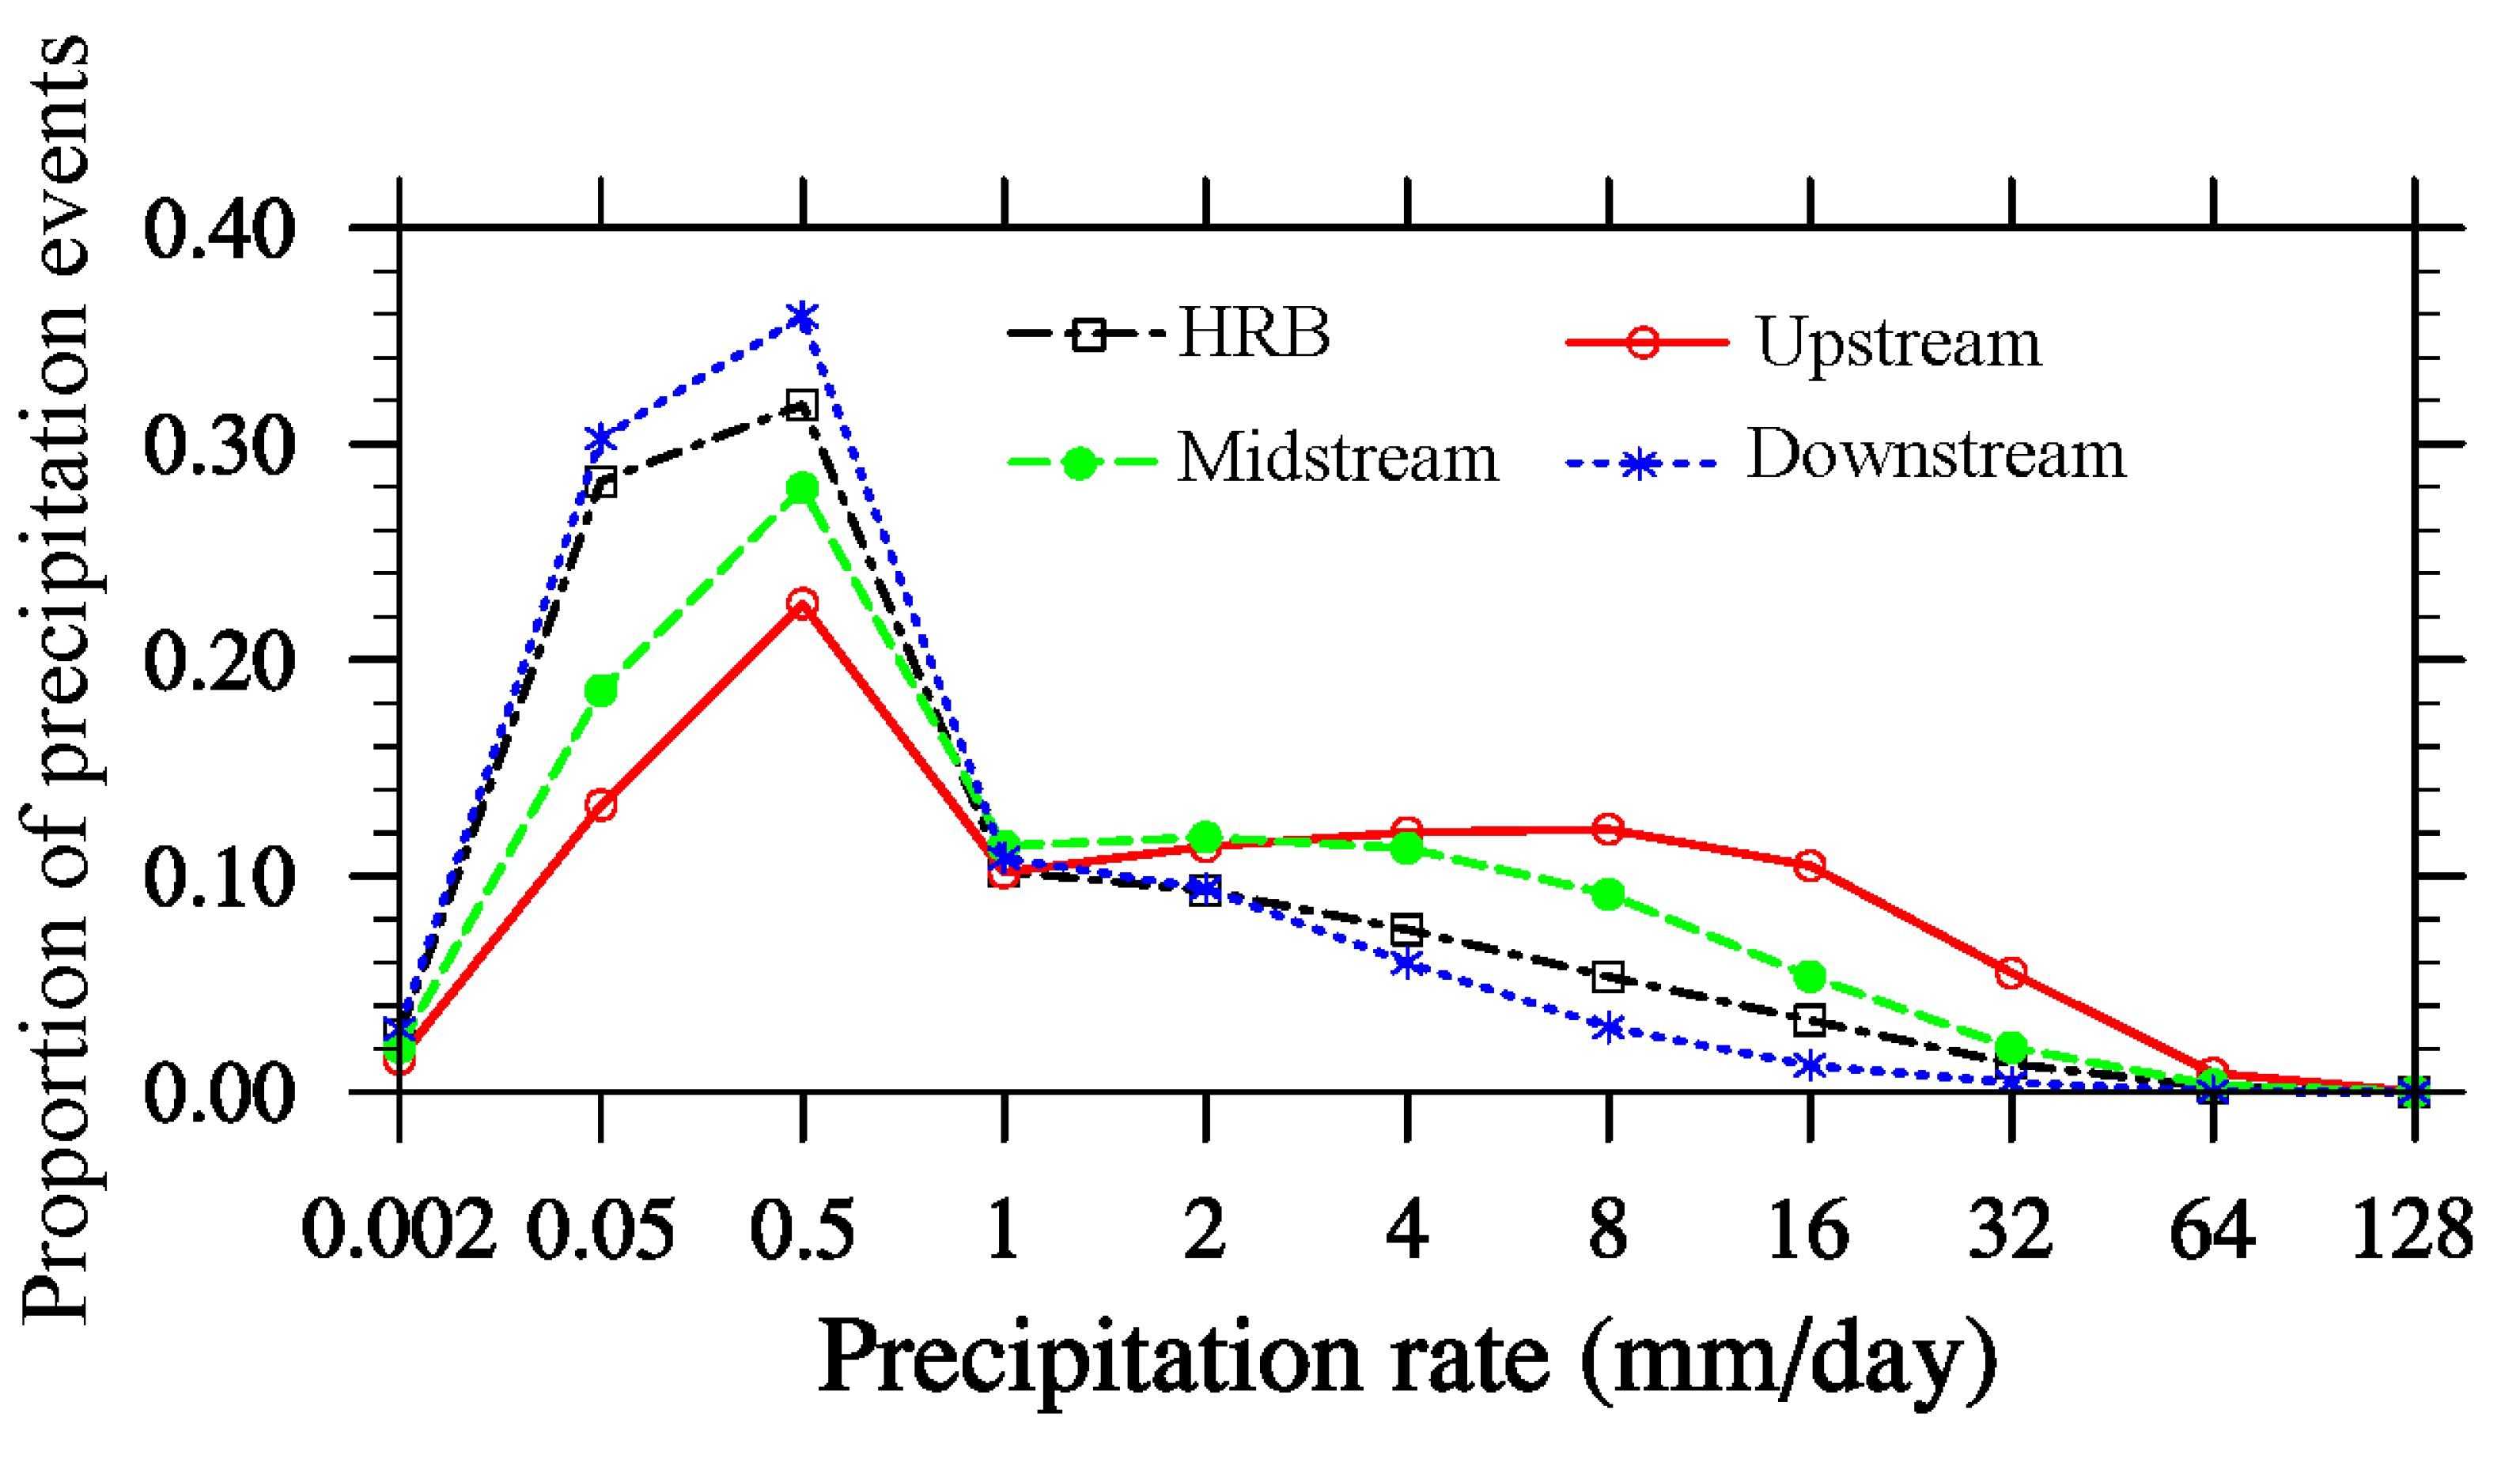
4.3.3. Daily Precipitation

Figure 12 indicates the proportion of all precipitation events with a particular daily precipitation rate in the HRB and its sub-streams. In all of the sub-streams, most precipitation events were less than 0.5 mm/day. The maximum precipitation rate experienced was 0.5 mm/day, with the proportion of all days where this rate was experienced being lowest in upstream areas and highest in downstream areas. The proportion of all days where the maximum rate was experienced was 0.36, 0.32, 0.28, and 0.22 for downstream, the HRB, midstream, and upstream, respectively.
Figure 12. The proportion of all precipitation events with a particular daily precipitation rate in the HRB, and the upstream, midstream and downstream areas from 2000 to 2013.
Remotesensing 07 09230 g012
Figure 13. The proportion of all precipitation events with a particular hourly precipitation rate in the HRB, and the upstream, midstream and downstream areas from 2000 to 2013
Remotesensing 07 09230 g013

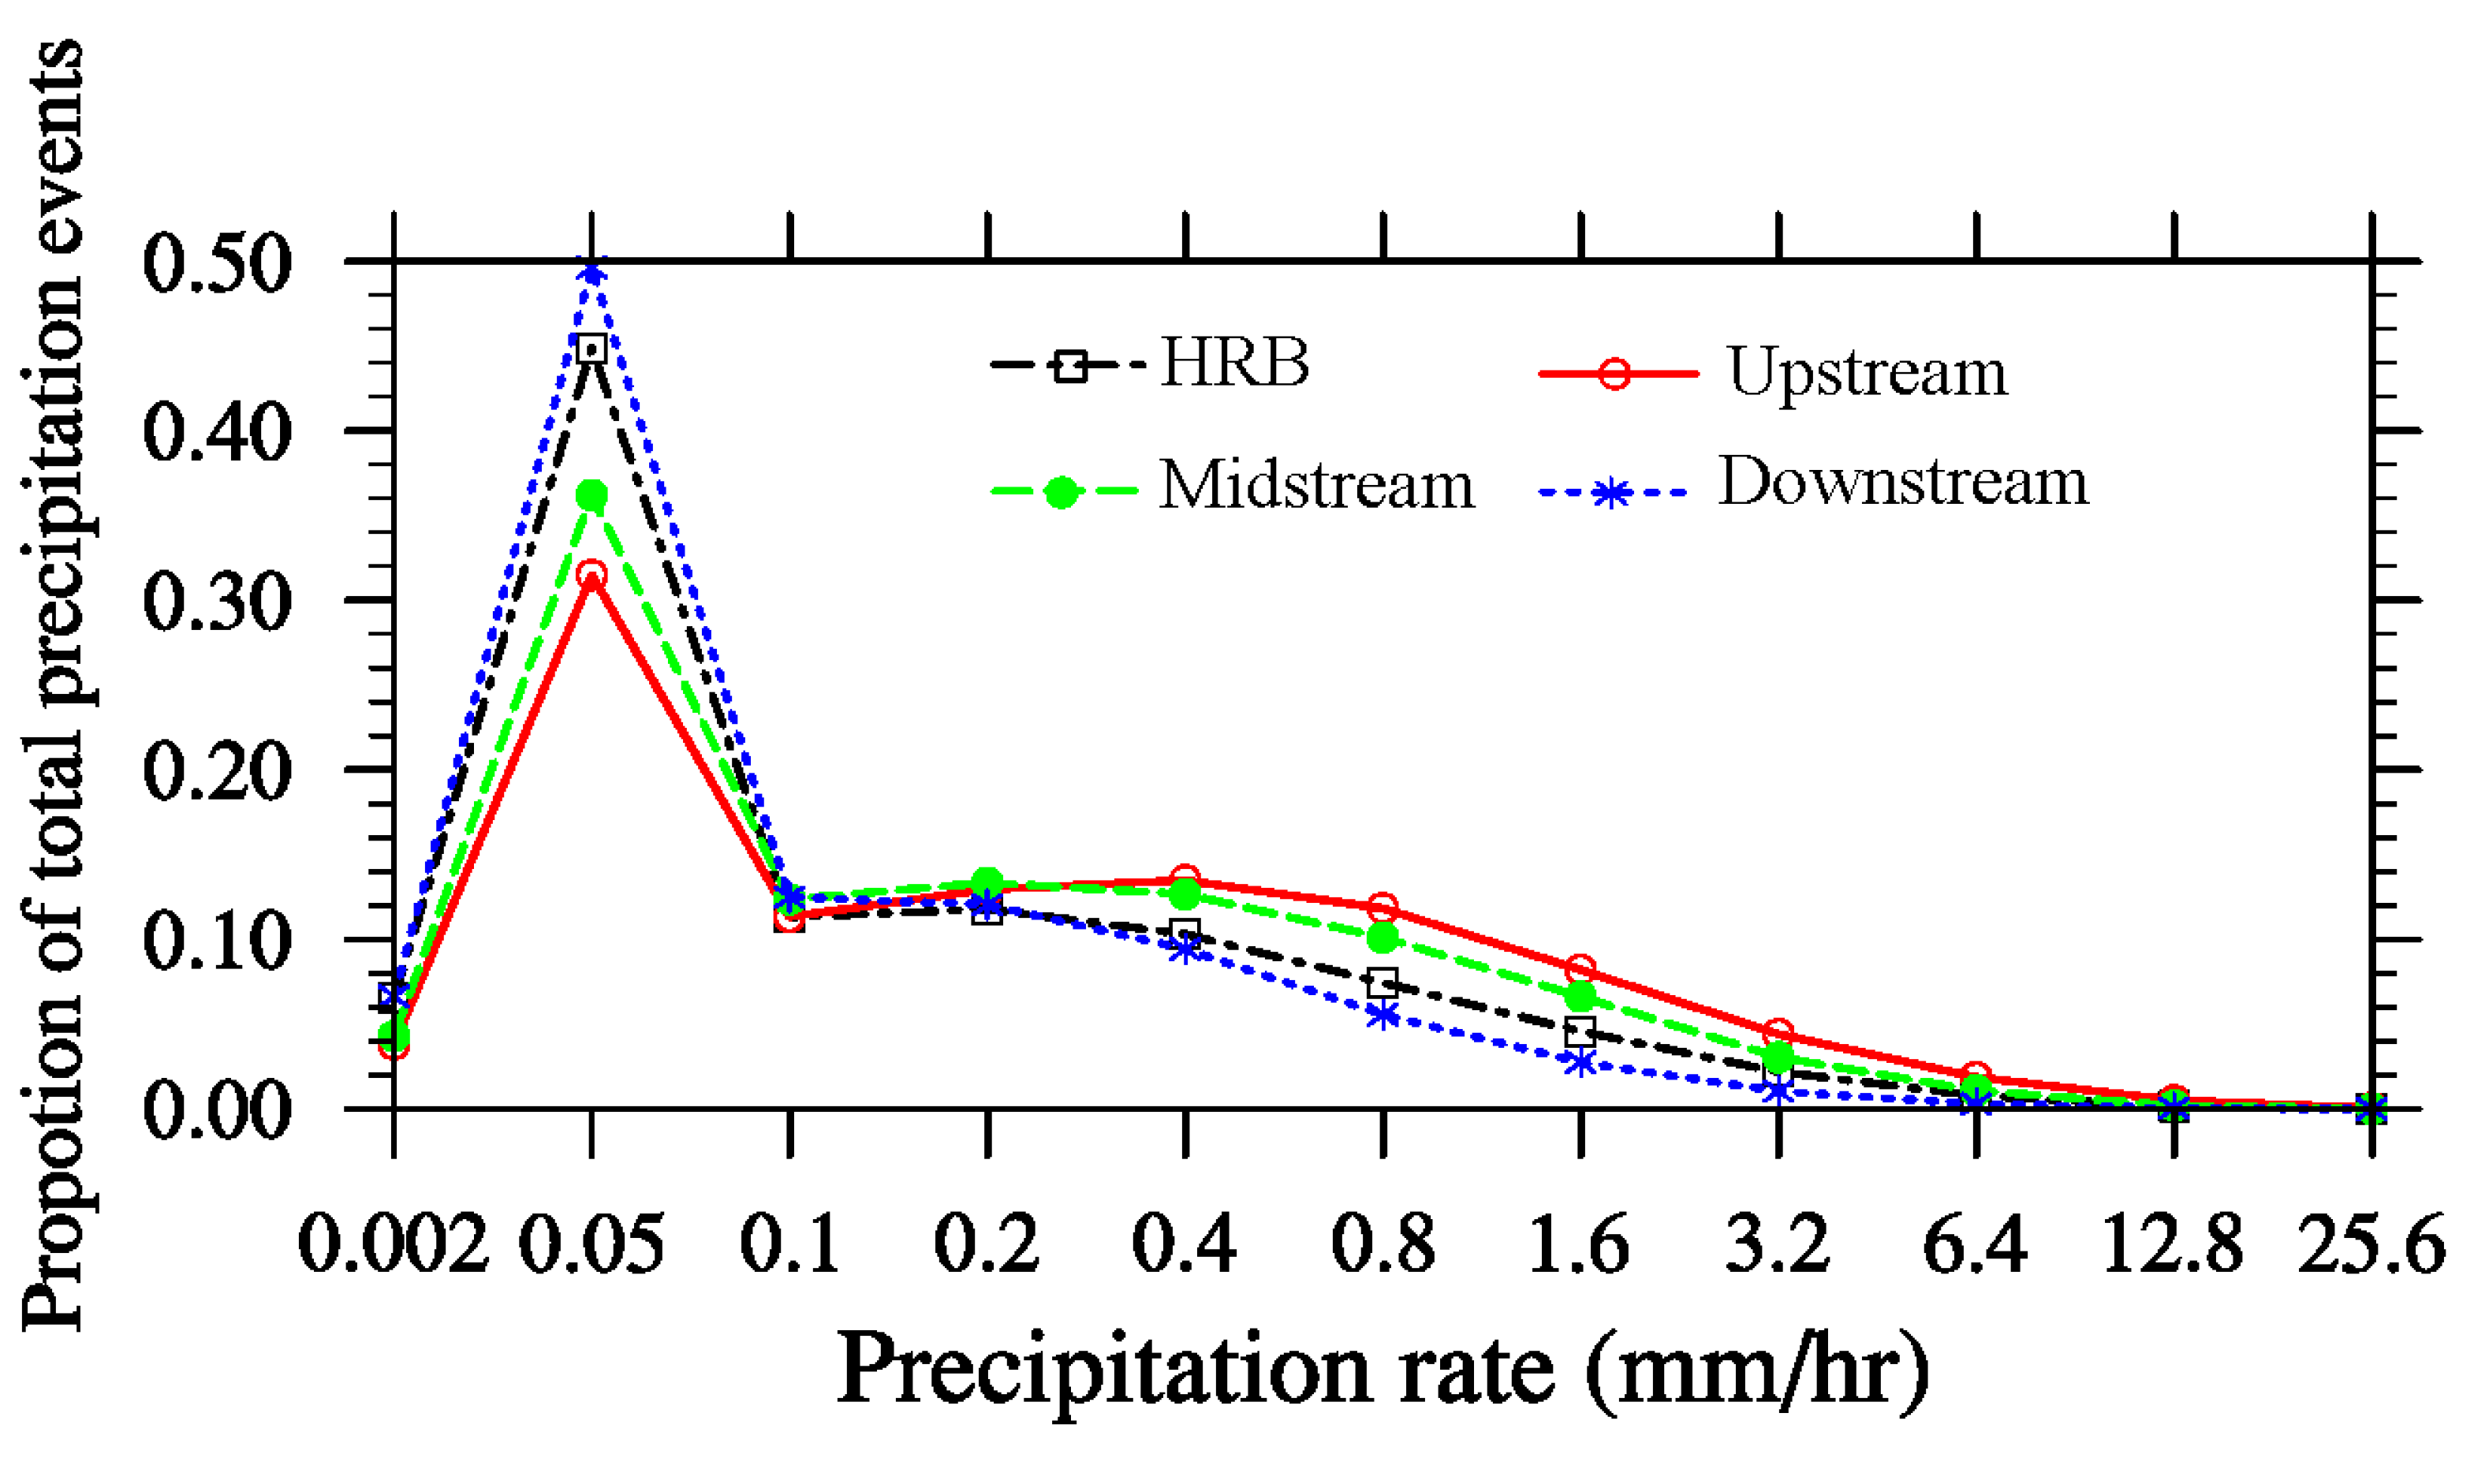
4.3.4. Hourly Precipitation

As with Figure 12 and Figure 13 indicates the proportion of all precipitation events with a particular hourly precipitation rate in the HRB and its sub-streams. In all of the sub-streams, most precipitation events were less than 0.05 mm/h. The maximum precipitation rate experienced was 0.5 mm/h, with the proportion of all days where this rate was experienced being lowest in upstream areas and highest in downstream areas. The proportion of all days where the maximum rate experienced was 0.49, 0.45, 0.38, and 0.32 for downstream, the HRB, midstream, and upstream, respectively.

5. Discussion

5.1. Physical Configuration and Atmospheric-Hydrometeorological Condition over the HRB

The errors of precipitation at the station over upstream have been lessened enormously by our suitable set of physical configuration, compared with the result in Pan et al. [34], which showed a simulating defection in the WRF model with the Lin scheme of microphysics and the Yonsei University Scheme of Planetary Boundary Layer over the upstream of the HRB. The main differences in physical configuration between these two researches lie in the microphysical scheme and the Planetary Boundary Layer (PBL) scheme. The MYJ option was selected as the PBL scheme according to Zhu et al. [25]. With this fixed option, we found the Kessler option of microphysical scheme is the most reasonable one among the nine microphysical schemes to simulate precipitation over the HRB. But the dominant positive error ranges show that the precipitation yielded in this paper is a little larger at the observation at a daily scale as well as at an hourly scale. Furthermore, one set of physical configurations is difficult to perform well through the whole year. It is strongly recommended to use different physical schemes for simulating precipitation in summer and winter respectively. The study also shows that it is better to consider a combination of various parameterized schemes of performance in the WRF model than a single parameterized scheme, even more, it is better to use different set of physical configurations to simulate precipitation in the WRF over the complex region for different seasons.
The rainfall is higher over the eastern HRB than the western HRB, however, snowfall is higher in the west (Figure 6). Tang [48] explained the characteristics of this region, with a west wind dominant in winter, while in summer precipitation over the HRB is mainly influenced by the southeastern monsoon. The vapor originating from the Pacific passes through the Loess Plateau and reaches the Qilian Mountains, where it reforms as rainfall [49]. The highest precipitation occurs at elevations from 3500 to 4000 m (Figure 4), and falls on the brow of the mountains rather than the tops. This was also reported by Tang [48], Ding et al. [50], and Wang et al. [51], but the elevation range considered in this study was higher than the range studied by Tang [48] and Ding et al. [50] (around 3000 m) and lower than the range considered by Wang et al. [51] (around 4500 m). Tang [48] and Ding et al. [50] found the highest precipitation using data from the traditional CMA meteorological stations, which are all distributed below 3500 m. Wang et al. [51] used observations made from July 2007 to September 2008, which is too short a period to confirm the precipitation range, because random precipitation events occur over temporal and spatial scales. Precipitation gradually increases from east to west over the mountainous regions [50,51,52,53], and sharply decreases from the south of the mountainous region to the northern desert region.

5.2. Evaluation for the HRB

Annual precipitation yielded by the WRF model increased gradually from 2000 to 2013 over the upstream area of the HRB. This increasing trend was also found in the CMA stations, including Tuole, Yeniugou, and Qilian stations in this region (refer to Figure 4a of Pan et al. [34]). Annual precipitation over the midstream area of the HRB also displayed an increasing trend from 2000 to 2013; the CMA stations in the midstream area also displayed an increasing trend. There was almost no obvious trend over the downstream area. Zhang and Guo [54] analyzed the data from the CMA stations and found an increasing trend in the precipitation over the Qilian Mountains in the last 40 years (1961–2000). The upstream area of the HRB is part of the Qilian Mountains, and its precipitation simulated by the WRF model from 2000 to 2013 increased gradually. Lan et al. [55] found that the precipitation increased with the rise in temperature in the last 50 years (1957–2006) over the mountainous region of the HRB. Cao and Dou [56] used an empirical orthogonal function (EOF) analysis to show that annual precipitation increased over the whole HRB in the last 40 years (1960–2000), with a particularly large increase over the upstream area. Ding et al. [50] also concluded that precipitation gradually increased from the 1950s to 1990s by analyzing data from 53 CMA meteorological and hydrological stations.
Monthly precipitation yielded by the WRF model indicated that most precipitation occurs from May to September, which agrees well with the results of several other studies [55,56,57,58]. In general, the monthly precipitation in the eastern upstream area was higher than in the western upstream area; however, the converse pattern was observed for snow. The maximum snowfall is in the west part over the period from November to March. More rainfall was recorded in July over the upstream area, in August over the midstream area, and in June over the downstream area. The lowest precipitation in the whole year was recorded in December, with only a small amount of snow falling in the western upstream area. The monthly CC, RMSE, ME, and BIAS values derived from the precipitation simulation yielded by the WRF model in the HRB were better than or at least comparable to the results of TRMM products in mountainous areas, for example, the results are better than those derived from TRMM 3B42 RT in the Laohahe Basin and were similar to those derived from TRMM 3B42V6 in the Laohahe Basin [59]. However, the resolution of TRMM 3B42V6 is 0.25°, which is considered to be too coarse to be used for hydrological analysis in the complex HRB [34]. The daily POD and FAR values derived from the precipitation simulation yielded by the WRF model in the HRB were also similar to those derived from TRMM 3B42V6 in the Laohahe Basin.
Daily precipitation was mostly less than 8 mm. The proportion of all precipitation events with a daily precipitation rate less than 8 mm was 0.95, 0.83, 0.92, and 0.98 over the HRB, and in the upstream, midstream, and downstream areas, respectively. Zhang and Zhao [60] reported a similar result using daily CMA observation data from 1950 to 2000, with the proportion of all precipitation events having a daily precipitation rate of less than 5 mm being 0.83. In the upstream area, the daily precipitation events mostly had a rainfall rate from 8 to 16 mm, which agreed well with the results reported by Xiong [26], who used a different convective parameterization to simulate precipitation in the HRB. Due to the limited amount of observation data at the hourly scale, there are few studies based on hourly precipitation events in the HRB. However, for hydrological analysis decision support systems, hourly precipitation data are urgently needed.

6. Conclusions

Based on the sensitive analyses of the parameterized physical processes and our previous studies over the HRB, a suitable set of physical configuration has been extracted to generate a high spatio-temporal precipitation product from 2000 to 2013 for the HRB with 0.05° spatial and hourly resolutions. This precipitation was evaluated by CMA and HiWATER observation data at annual, monthly, daily, and hourly scales using CC, RMSE, ME, BIAS, POD, FAR, and FBI indicators for the sub-basins. The relationships between precipitation and different elevation ranges, as well as different land use categories were analyzed. The following conclusions were made for the spatiotemporal pattern of precipitation in the HRB from 2000 to 2013.
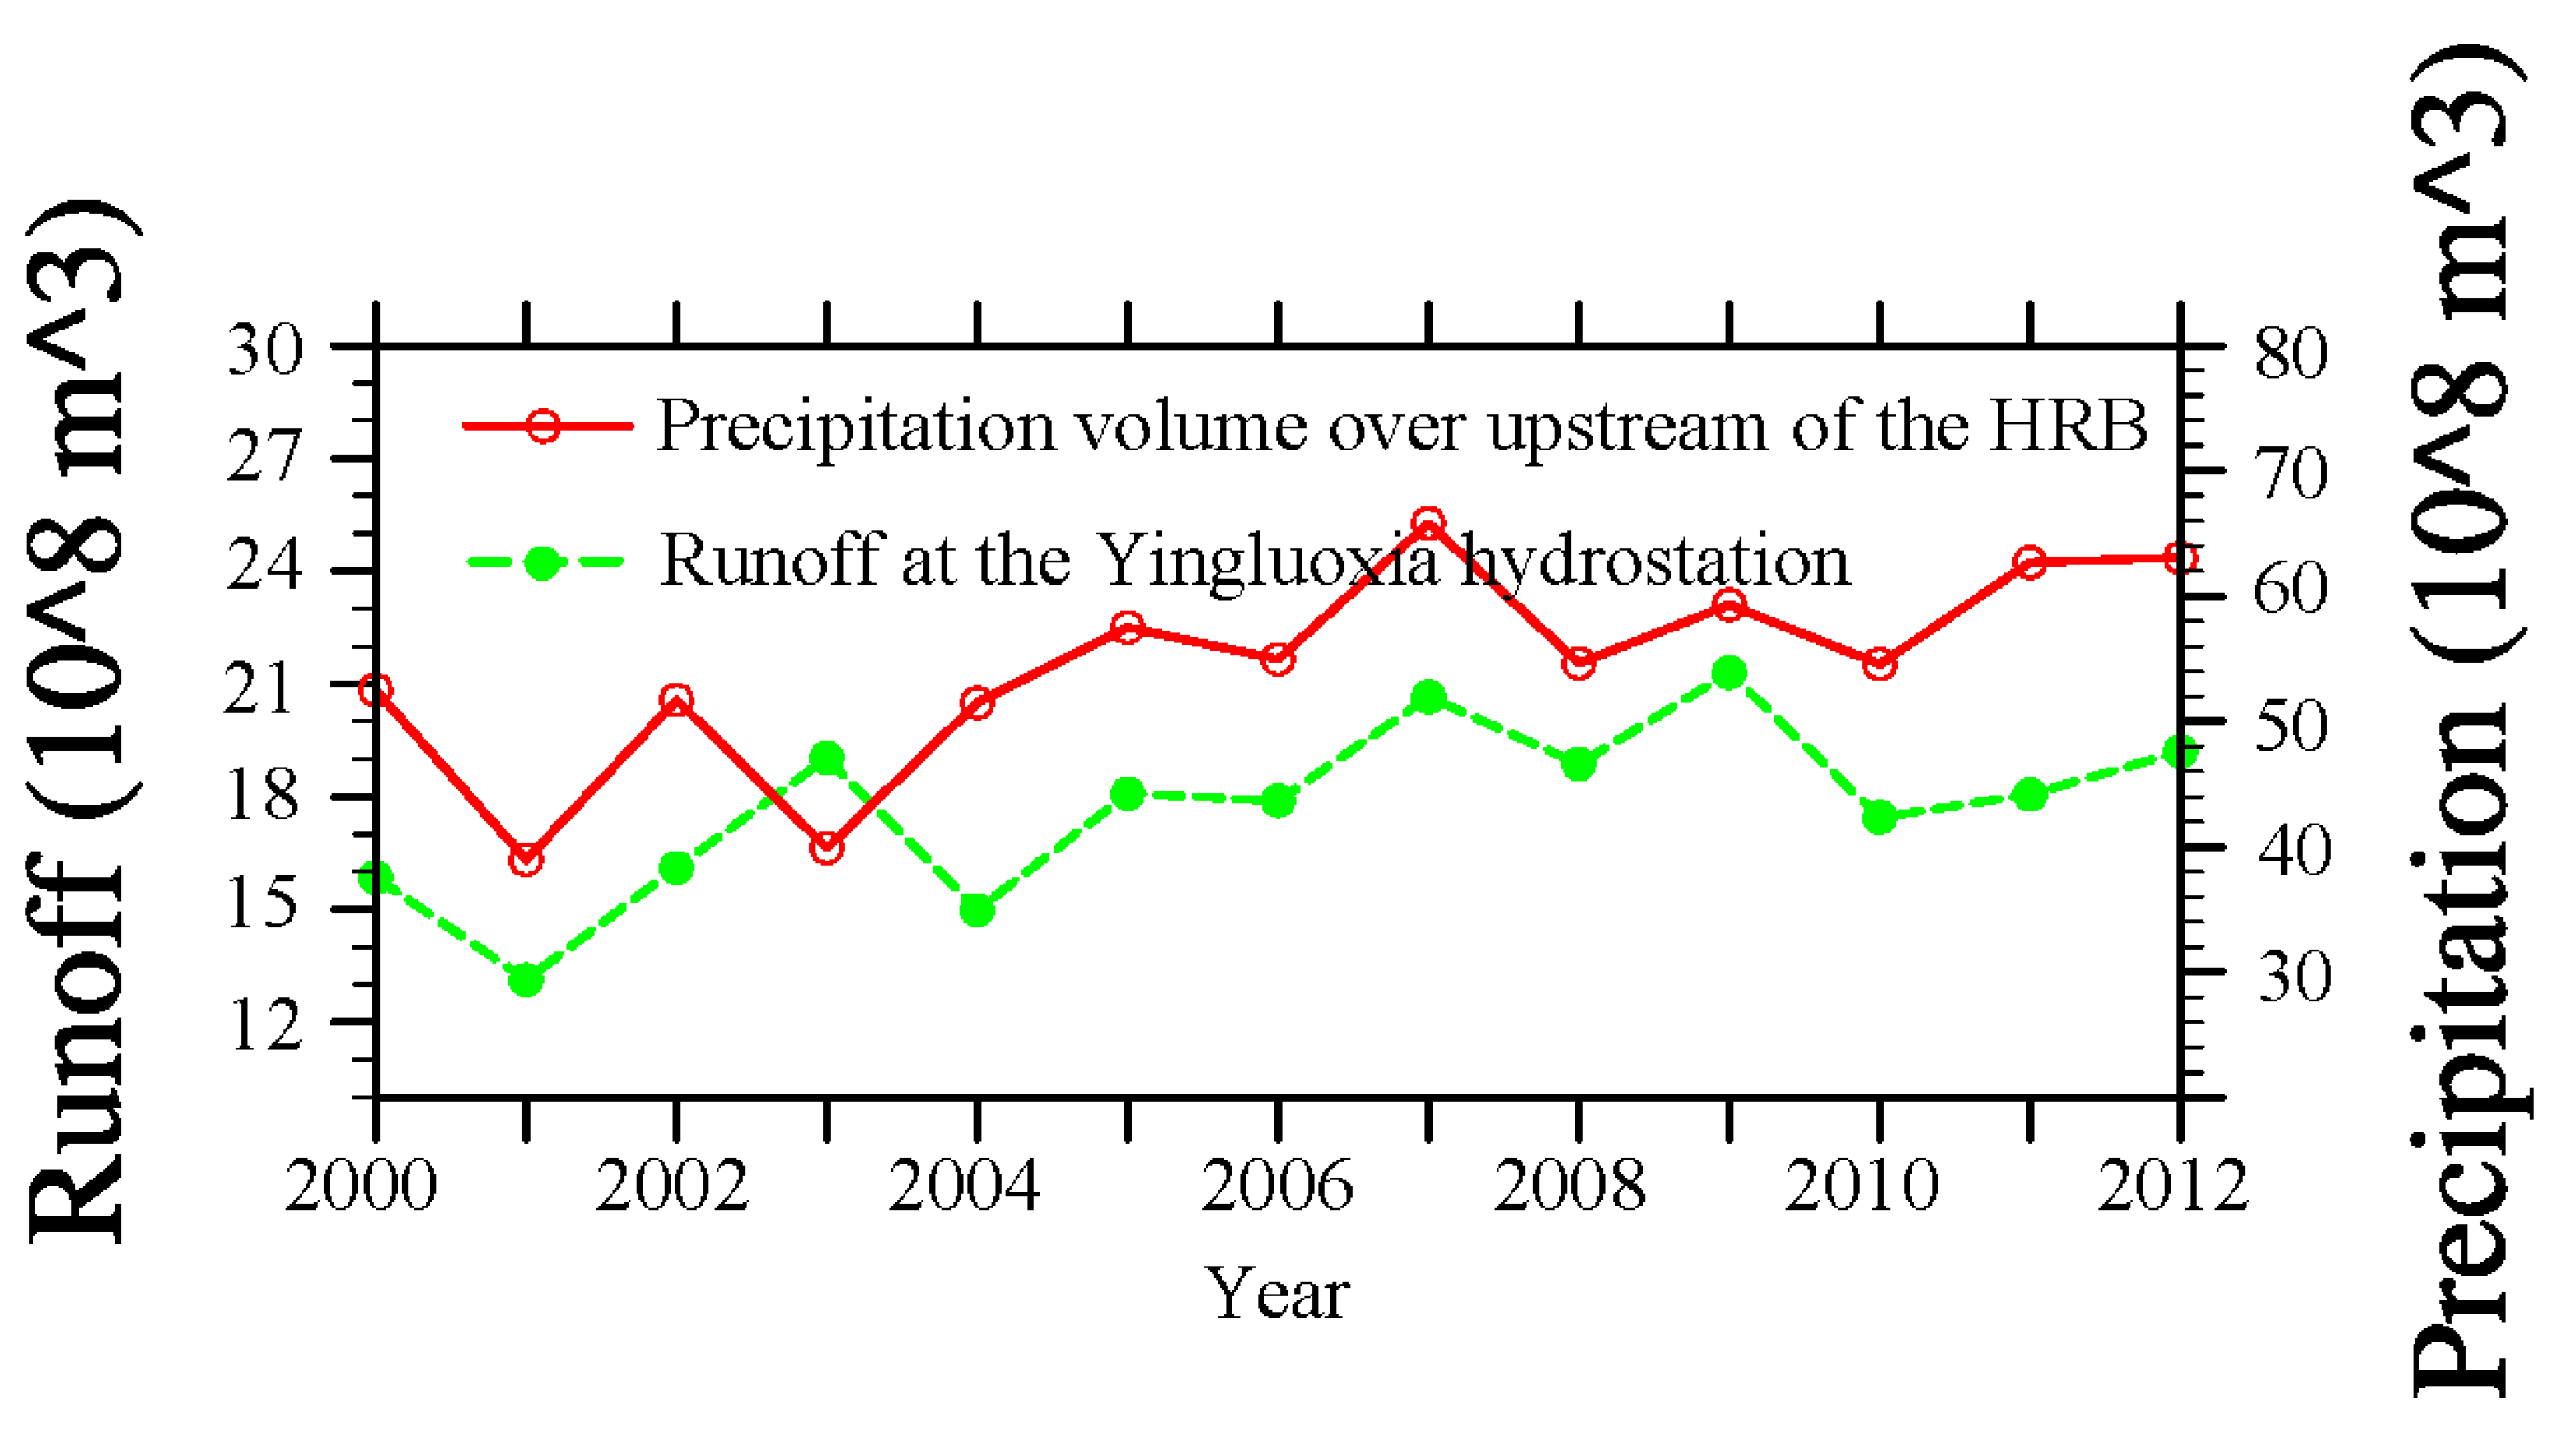
  • Since the year 2000 annual precipitation has gradually increased over the HRB, especially over the upstream and downstream regions;
  • Precipitation mostly occurs in summer over the HRB, and is higher in the area influenced by the monsoon, with winter snowfall being distinct at high elevations. Precipitation is higher in the eastern upstream area than in the western upstream area; however, in winter the converse pattern occurs;
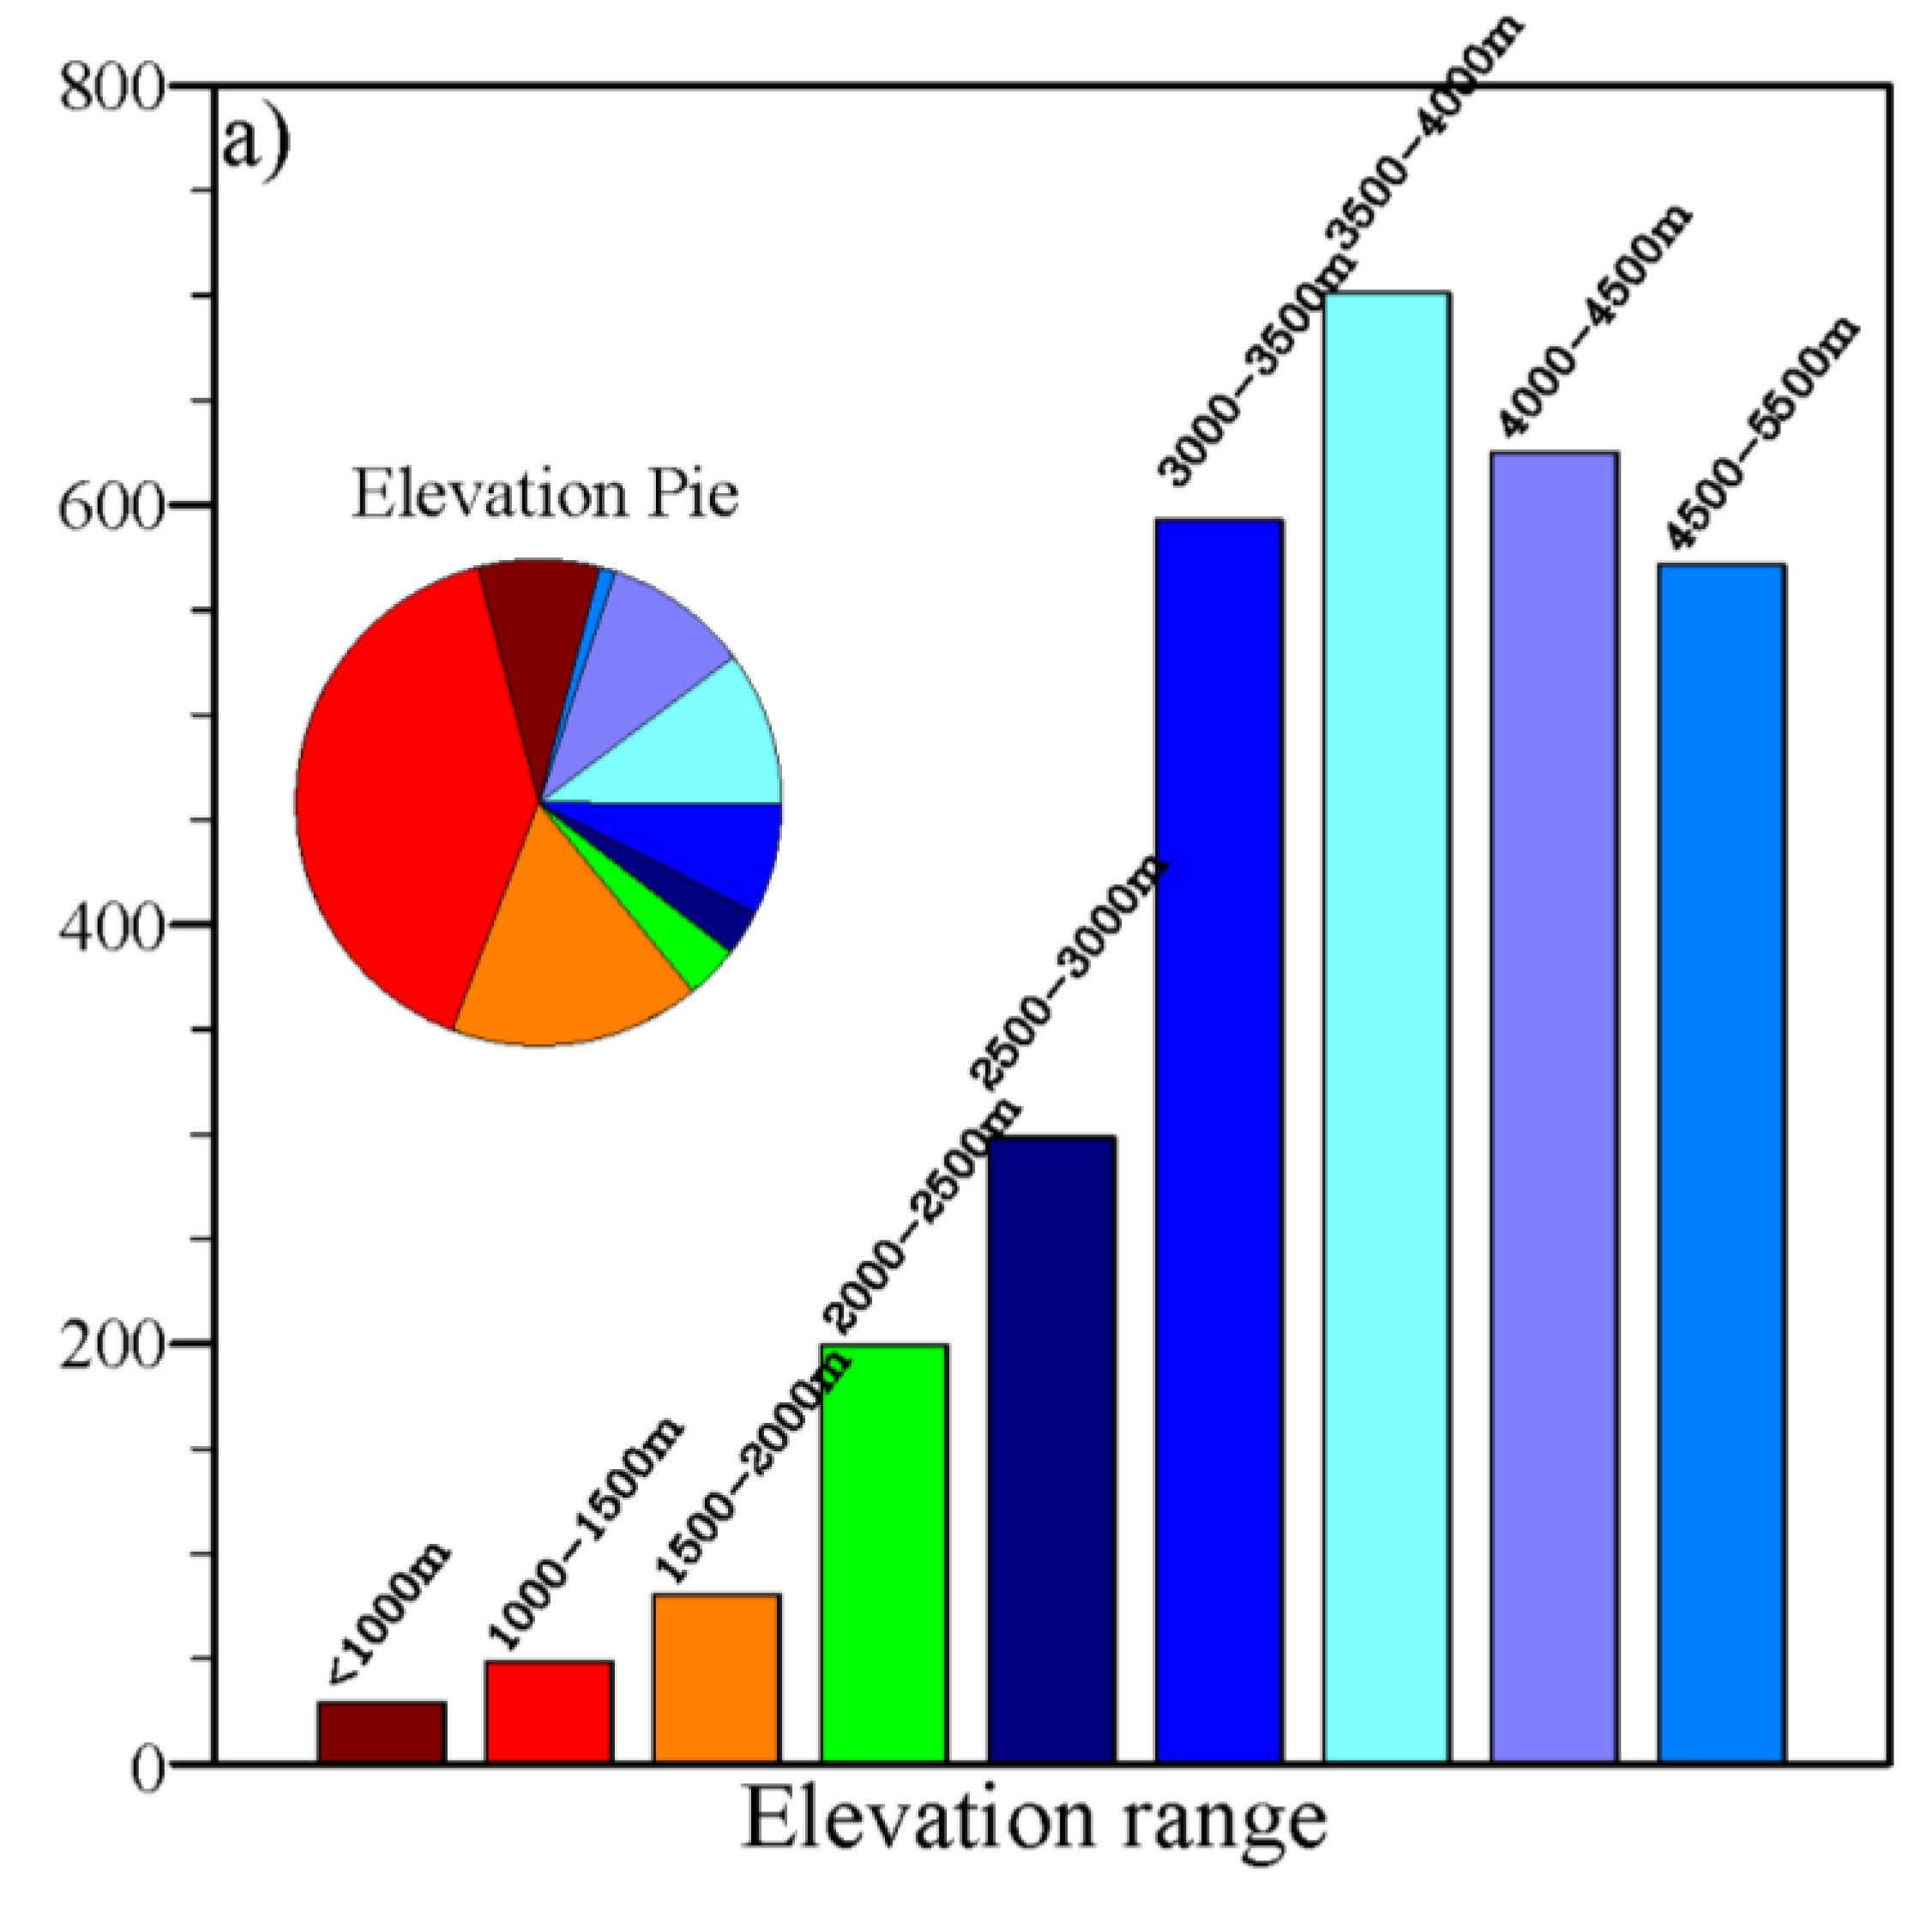
  • Over the HRB, annual precipitation increases with elevation when elevation is less than 4000 m; the highest precipitation occurs at an altitude of 3500–4000 m. And precipitation on the northern slopes of the Qilian Mountains is higher than on the southern slopes;
  • Precipitation over downstream areas is low and unstable
Methodologically, we also conclude that the dynamic downscaling using the WRF model can produce high-resolution and reliable precipitation in complex mountainous areas and extremely arid environments. The data downscaled can meet the requirement of river basin scale hydrological modeling study and water resource balance analysis. This study is also an example of the development and evaluation of a long time series precipitation data set using a WRF model in an inland river basin.

Acknowledgments

This work was supported by grants from the National Natural Science Foundation of China (41471292, 911225302, and 91125016) and the CAS Action Plan for West Development Program (Grant KZCX2-XB3-15). The input data for the WRF model were obtained from the Research Data Archive (RDA), which is maintained by the Computational and Information Systems Laboratory (CISL) at the National Center for Atmospheric Research (NCAR). The original data are available from the RDA (http://dss.ucar.edu) in dataset number ds083.2. CMA station data were downloaded from the China Meteorological Data Sharing Service System (http://cdc.cma.gov.cn). WATER and HiWATER data were provided by the Cold and Arid Regions Science Data Center at Lanzhou (http://westdc.westgis.ac.cn). The NCAR Command Language (NCL) (Version 6.1.2) [Software] (2013) is available from the UCAR/NCAR/CISL/VETS (http://dx.doi.org/10.5065/D6WD3XH5), Boulder, Colorado. NCL was used for the data analysis and graphs in this paper. We acknowledge the computing resources and time spent at the Supercomputing Center of the Cold and Arid Region Environment and Engineering Research Institute of the Chinese Academy of Sciences. The authors thank four anonymous reviewers and the editor for their very helpful comments.

Author Contributions

Xin Li designed the study and revised the manuscript. Xiaoduo Pan simulated the high spatio-temporal precipitation product, performed the spatial and temporal analysis, and wrote the manuscript. Guodong Cheng, Hongyi Li and Xiaobo He contributed to discussions and revisions.

Conflicts of Interest

The authors declare no conflict of interest.

References

  1. Chen, L.; Frauenfeld, O.W. A comprehensive evaluation of precipitation simulations over China based on CMIP5 multimodel ensemble projections. J. Geophys. Res. 2014, 119, 5767–5786. [Google Scholar] [CrossRef]
  2. Liu, Y.B.; Fu, Q.N.; Zhao, X.S.; Dou, C.C. Satellite retrieval of precipitation: An overview. Adv. Earth. Sci. 2011, 26, 1162–1172. [Google Scholar]
  3. Gottschalck, J.; Meng, J.; Rodell, M.; Houser, P. Analysis of multiple precipitation products and preliminary assessment of their impact on global land data assimilation system land surface states. J. Hydrometeorol. 2005, 6, 573–598. [Google Scholar] [CrossRef]
  4. Tian, Y.; Peter-Lidard, C.D.; Choudhury, B.J.; Garcia, M. Multitemporal analysis of TRMM-based satellite precipitation products for land data assimilation applications. J. Hydrometeorol. 2007, 8, 1165–1183. [Google Scholar] [CrossRef]
  5. Sorooshian, S.; AghaKouchak, A.; Arkin, P.; Eylander, J.; Foufoula-Georgiou, E.; Harmon, R.S. Advancing the remote sensing of precipitation. Bull. Amer. Meteor. Soc. 2011, 92, 1271–1272. [Google Scholar] [CrossRef]
  6. Fekete, B.M.; Vorosmarty, C.J.; Roads, J.O.; Willmott, C.J. Uncertainties in precipitation and their impact on runoff estimates. J. Climate. 2004, 17, 294–304. [Google Scholar] [CrossRef]
  7. Wilk, J.; Kniveton, D.; Andersson, L.; Layberry, R.; Todd, M.C.; Hughes, D.; Ringrose, S.; Vanderpost, C. Estimating rainfall and water balance over the Okavango River basin for hydrological applications. J. Hydrol. 2006, 331, 18–29. [Google Scholar] [CrossRef]
  8. Gottardi, F.; Obled, C.; Gailhard, J.; Paquet, E. Statistical reanalysis of precipitation fields based on ground network data and weather patterns: Application over French mountains. J. Hydrol. 2012, 432–433, 154–167. [Google Scholar] [CrossRef]
  9. McCarthy, J.J.; Canziani, O.F.; Leary, N.A.; Dokken, D.J.; White, K.S. Impacts, Adaptation and Vulnerability, Contribution of Working Group II to the Third Assessment Report of the Intergovernmental Panel on Climate Change; Cambridge University Press: Cambridge, UK, 2001. [Google Scholar]
  10. Liu, L.; Qian, Y.; Wu, A. Comparison of simulated results of regional climate and GCM in summer over Qinghai-Xizhang Plateau and northwest China. Plateau Meteor. 2000, 19, 313–322. [Google Scholar]
  11. Liang, X.Z.; Xu, M.; Yuan, X.; Ling, T.; Choi, H.I.; Zhang, F.; Chen, L.; Liu, S.; Su, S.; Qiao, F.; et al. Regional climate-weather research and forecasting model. Bull. Am. Meteor. Soc. 2011, 93, 1363–1387. [Google Scholar] [CrossRef]
  12. Argüeso, D.; Hidalgo-Muñoz, J.M.; Gámiz-Fortis, S.R.; Esteban-Parra, M.J.; Castro-Díez, Y. High-resolution projections of mean and extreme precipitation over Spain using the WRF model (2070–2099 vs. 1970–1999). J. Geophys. Res. 2012, 117, D12108. [Google Scholar]
  13. Johnson, G.L.; Hanson, C.L. Topographic and atmospheric influences on precipitation variability over a mountainous watershed. J. Appl. Meteorol. 1995, 34, 68–87. [Google Scholar] [CrossRef]
  14. Wang, C.; Zhao, C. A study of the spatio-temporal distribution of precipitation in upper researches of Heihe River of China using TRMM data. J. Nat. Resour. 2013, 28, 862–872. [Google Scholar]
  15. Giorgi, F.; Bates, G.T. The climatological skill of regional model over complex terrain. Mon. Weather Rev. 1989, 117, 2325–2347. [Google Scholar] [CrossRef]
  16. Dickinson, R.E.; Errico, M.; Giorgi, F.; Bates, G.T. A regional climate model for the western United States. Clim. Change 1989, 15, 383–412. [Google Scholar] [CrossRef]
  17. Duan, H.X.; Liu, X.W.; Pu, Z.X. Cloud microphysical processes on simulation of precipitation in Qilian Mountains. Trans. Atmos. Sci. 2013, 36, 367–378. [Google Scholar]
  18. Wang, J.J.; Zhou, B.; Guo, X.R. Numerical study on characteristic of condensational heating rates and their impacts on mesoscale structures of torrential rain simulations. Acta Meteor. Sin. 2005, 63, 405–417. [Google Scholar]
  19. Lin, W.S.; Li, J.N.; Fan, Q.; Wu, C.S.; Gu, Z.M.; Meng, J.P.; Bueh, C. Numerical simulation of impact of the microphysical parameterization on snowfall over north China. Plateau Meteor. 2007, 26, 107–114. [Google Scholar]
  20. Xue, G.Y.; Zhang, J.H.; Chen, H.M.; Zhu, X.M. The comparisons of different convective parameterization schemes applying precipitation’s forecast of typhoon landing on Zhejiang and Fujian provinces. Plateau Meteor. 2007, 26, 765–773. [Google Scholar]
  21. Xu, G.Q.; Liang, X.D.; Yu, H.; Huang, L.P.; Xue, J.S. Precipitation simulation using different cloud-precipitation schemes for a landfall typhoon. Plateau Meteor. 2007, 26, 891–900. [Google Scholar]
  22. Zhang, D.L. Roles of various diabatic physical processes in mesoscale models. Chin. J. Meteor. Sci. 1998, 22, 548–561. [Google Scholar]
  23. Liu, W.G.; Liu, Q.J. The numerical simulation of orographic cloud structure and cloud microphysical processes in Qilian Mountains in summer. Part (I): Cloud microphysical scheme and orographic cloud structure. Plateau Meteor. 2007, 26, 1–15. [Google Scholar]
  24. Liu, W.G.; Liu, Q.J. The numerical simulation of orographic cloud structure and cloud microphysical processes in Qilian Mountains in summer. Part (II): Cloud microphysical processes and orographic influence. Plateau Meteor. 2007, 26, 16–29. [Google Scholar]
  25. Zhu, Q.L.; Jiang, H.; Wang, K.L.; Luo, X.P. WRF model parameterization of physical processes on Precipitation in the Heihe River Basin simulation influence. Arid Zone Res. 2013, 30, 462–469. [Google Scholar]
  26. Xiong, Z. Impact of different convective parameterization on simulation of precipitation for the Heihe River Basin. Adv. Earth. Sci. 2014, 29, 590–597. [Google Scholar]
  27. Ma, S.H.; Zhai, P.M. Effects of initial fields and lateral boundaries on numerical predictions of typhoon track. J. Trop. Meteor. 2004, 20, 737–742. [Google Scholar]
  28. Li, X.; Li, X.W.; Li, Z.Y.; Ma, M.G.; Wang, J.; Xiao, Q.; Liu, Q.; Che, T.; Chen, E.X.; Yan, G.J.; et al. Watershed allied telemetry experimental research. J. Geophys. Res. 2009, 114. [Google Scholar] [CrossRef]
  29. Li, X.; Cheng, G.D.; Liu, S.M.; Xiao, Q.; Ma, M.G.; Jin, R.; Che, T.; Liu, Q.H.; Wang, W.Z.; Qi, Y.; et al. Heihe Watershed Allied Telemetry Experimental Research (HiWATER): Scientific objectives and experimental design. Bull. Amer. Meteor. Soc. 2013, 9, 1145–1160. [Google Scholar] [CrossRef]
  30. Yang, D.; Wang, N.; Ye, B.; Ma, L.J. 2009: Recent advances in precipitation-bias correction and application. Sci. Cold Arid Reg. 2009, 1, 193–198. [Google Scholar]
  31. Xu, Z.W.; Liu, S.M.; Li, X.; Shi, S.J.; Wang, J.M.; Zhu, Z.L.; Xu, T.R.; Wang, W.Z.; Ma, M.G. Intercomparison of surface energy flux measurement systems used during the HiWATER-MUSOEXE. J. Geophys. Res. 2013, 118, 13140–13157. [Google Scholar] [CrossRef]
  32. Cheng, G.D.; Li, X.; Zhao, W.Z.; Xu, Z.M.; Feng, Q.; Xiao, S.C.; Xiao, H.L. Integrated study of the water-ecosystem-economy in the Heihe River Basin. Natl. Sci. Rev. 2014, 1, 413–428. [Google Scholar] [CrossRef]
  33. Cheng, G.D.; Li, X. Integrated research methods in watershed science. Sci. China Earth Sci. 2015, 58, 1159–1168. [Google Scholar] [CrossRef]
  34. Pan, X.D.; Li, X.; Yang, K.; He, J.; Zhang, Y.L.; Han, X.J. Comparison of downscaled precipitation data over a mountainous watershed: A case study in the Heihe River Basin. J. Hydrometeorol. 2014, 15, 1560–1574. [Google Scholar] [CrossRef]
  35. He, X.B.; Ye, B.S.; Ding, Y.J. Bias correction for precipitation measurement in Tanggula Moutain Tibetan Plateau. Adv. Water Resour. 2009, 20, 403–408. [Google Scholar]
  36. Yang, D.Q.; Jiang, T.; Zhang, Y.S.; Kang, E.S. Analysis and correction of errors in precipitation measurement at the head of Urumqi River, Tianshan. J. Glaci. Geocry. 1988, 10, 384–399. [Google Scholar]
  37. Michalakes, J.; Chen, S.; Dudhia, J.; Hart, L.; Klemp, J.B. Development of a next generation regional weather research and forecast model. In Developments in Teracomputing, Proceedings of the Ninth ECMWF Workshop on the Use of High Performance Computing in Meteorology; World Scientific Publishing: Toh Tuck Link, Singapore, 2001; pp. 269–276. [Google Scholar]
  38. Michalakes, J.; Dudhia, J.; Gill, D. Design of a next-generation regional weather research and forecast model. In Towards Teracomputing; World Scientific Publishing: Toh Tuck Link, Singapore, 1999; pp. 117–124. [Google Scholar]
  39. Michalakes, J.; Dudhia, J.; Gill, D. The weather research and forecast model: Software architecture and performance. In Proceedings of the 11th ECMWF Workshop on the Use of High Performance Computing in Meteorology, Reading, UK, 25–29 October 2004.
  40. Michalakes, J.; Hacker, J.; Loft, R.; McCracken, M.O.; Snavely, A.; Wright, N.J.; Spelce, T.; Gorda, B.; Walkup, R. WRF nature run. J. Phys. Conf. Ser. 2008, 125, 12–22. [Google Scholar] [CrossRef]
  41. Laprise, R. The Euler equation of motion with hydrostatic pressure as independent coordinate. Mon. Weather Rev. 1992, 120, 197–207. [Google Scholar] [CrossRef]
  42. Arakawa, A.; Lamb, V.R. Computational design of the basic dynamical processes of the University of California Los Angeles general circulation model. In Methods of Computational Physics; Academic Press: New York, NY, USA, 1977; pp. 173–265. [Google Scholar]
  43. Pan, X.D.; Li, X.; Ran, Y.H.; Liu, C. Impact of underlying surface information on WRF modeling in Heihe River Basin. Plateau Meteor. 2012, 31, 657–667. [Google Scholar]
  44. Ran, Y.H.; Li, X.; Lu, L.; Li, Z.Y. Large-scale land cover mapping with the integration of multi-source information based on the Dempster-Shafer theory. Int. J. Geogr. Inf. Sci. 2012, 26, 169–191. [Google Scholar] [CrossRef]
  45. Shuangguan, W.; Dai, Y.J.; Liu, B.Y.; Ye, A.Z.; Yuan, H. A soil particle-size distribution dataset for regional land and climate modeling in China. Geodema 2012, 171–172, 85–91. [Google Scholar] [CrossRef]
  46. University Corporation for Atmospheric Research, National Center for Atmospheric Research. 2009. Available online: http://dss.ucar.edu/datasets/ds083.2/ (accessed on 25 March 2015).
  47. Saha, S.; Moorthi, S.; Pan, H.L.; Wu, X; Wang, J.; Nadiga, S.; Tripp, P.; Kistler, R.; Woollen, J.; Behringer, D.; et al. The NCEP climate forecast system reanalysis. Bull. Amer. Meteor. Soc. 2010, 91. [Google Scholar] [CrossRef]
  48. Tang, M.C. The distribution of precipitation in mountain Qilian. Acta Geogr. Sin 1985, 40, 323–332. [Google Scholar]
  49. Zhang, X.C.; Yang, Z.N. The primary analysis of water-balance in Binggou basin of Qilian Mountains. J. Glaci. Geocry. 1991, 13, 35–42. [Google Scholar]
  50. Ding, Y.J.; Ye, B.S.; Zhou, W.J. Temporal and spatial precipitation distribution in the Heihe catchment, Northwest China, during the past 40a. J. Glaci. Geocry. 1999, 21, 42–48. [Google Scholar]
  51. Wang, N.L.; He, J.Q.; Jiang, X.; Song, G.J.; Pu, J.C.; Wu, X.B.; Chen, L. Study on the zone of maximum precipitation in the north slopes of the central Qilian Mountains. J. Glaci. Geocry. 2009, 31, 395–403. [Google Scholar]
  52. Fu, Y.Z.; Cao, L. The area rainfall analysis and climate feature of Heihe River drainage. Gansu Meteor. 2002, 20, 8–10. [Google Scholar]
  53. Zhang, J.; Li, D.L. Analysis on distribution character of rainfall over Qilian Mountain and Heihe Valley. Plateau Meteor. 2004, 23, 81–88. [Google Scholar]
  54. Zhang, C.J.; Guo, N. Climatic variation characteristics over Qilian Mountain area during the last 40 years. Meteor. Mon. 2002, 28, 33–40. [Google Scholar]
  55. Lan, Y.C.; Kang, E.S.; Zhang, J.S.; Hu, X.L. Relationship between ENSO circle and air temperature, precipitation and runoff in the Qilian Mountain region in the past 50 years. Adv. Water Resour. 2002, 13, 141–145. [Google Scholar]
  56. Cao, L.; Dou, Y.X. The spatial and temporal characteristics and forecasting method of precipitation in Heihe Field. Arid Meteor. 2005, 23, 35–39. [Google Scholar]
  57. Li, G.C.; Zhang, J.L.; Chen, T.Y. Synoptic analysis of precipitation process in summer of 2006 over Qilian Mountains. Arid Meteor. 2008, 26, 22–28. [Google Scholar]
  58. Zhang, Q.; Yu, Y.X.; Zhang, J. Characteristics of water cycle in the Qilian Mountains and the oases in Hexi inland river basins. J. Glaci. Geocry. 2008, 30, 907–913. [Google Scholar]
  59. Yong, B.; Ren, L.L.; Hong, Y.; Wang, J.H.; Gourley, J.J.; Jiang, S.H.; Chen, X.; Wang, W. Hydrologic evaluation of multisatellite precipitation analysis standard precipitation products in basins beyond its inclined latitude band: A case study in Laohahe basin, China. Water Resour. Res. 2010, 46. [Google Scholar] [CrossRef]
  60. Zhang, J.; Zhao, W.Z. Daily precipitation pattern and its temporal variability in Heihe River Basin. J. Desert Res. 2008, 28, 741–747. [Google Scholar]

