
Combination of Well-Logging Temperature and Thermal Remote Sensing for Characterization of Geothermal Resources in Hokkaido, Northern Japan


Abstract
: Geothermal resources have become an increasingly important source of renewable energy for electrical power generation worldwide. Combined Three Dimension (3D) Subsurface Temperature (SST) and Land Surface Temperature (LST) measurements are essential for accurate assessment of geothermal resources. In this study, subsurface and surface temperature distributions were combined using a dataset comprised of well logs and Thermal Infrared Remote sensing (TIR) images from Hokkaido island, northern Japan. Using 28,476 temperature data points from 433 boreholes sites and a method of Kriging with External Drift or trend (KED), SST distribution model from depths of 100 to 1500 m was produced. Regional LST was estimated from 13 scenes of Landsat 8 images. Resultant SST ranged from around 50 °C to 300 °C at a depth of 1500 m. Most of western and part of the eastern Hokkaido are characterized by high temperature gradients, while low temperatures were found in the central region. Higher temperatures in shallower crust imply the western region and part of the eastern region have high geothermal potential. Moreover, several LST zones considered to have high geothermal potential were identified upon clarification of the underground heat distribution according to 3D SST. LST in these zones showed the anomalies, 3 to 9 °C higher than the surrounding areas. These results demonstrate that our combination of TIR and 3D temperature modeling using well logging and geostatistics is an efficient and promising approach to geothermal resource exploration.1. Introduction
After the serious nuclear power plant accident caused by the 11th March 2011 Great East Japan Earthquake and Tsunami, all nuclear power plant operations in Japan were suspended. Thus, identification of renewable energy resources for electrical power generation has become increasingly important in Japan. Geothermal, solar, wind and biomass are typical renewable energy resources. Geothermal resources are characterized by small CO2 emissions during power generation, vast reserves in the shallow crust (< 3 km), and much higher capacity utilization ratios (over 70%) than other energy resources [1]. In addition to the use of high temperature geothermal resources for power generation, low temperature geothermal activity has been exploited for space heating, agriculture and industrial heating processes [2]. Japan is part of the Pacific Ring of Fire, and contains more than 450 Quaternary volcanoes, 110 of which are currently active. As a result, Japan has abundant geothermal resources, and the eighth highest geothermal electrical power capacity in the world [3].
Accurate assessment of geothermal systems including geological structures, fluid flow, and temperature distribution from the ground surface to great depths (3–10 km) is essential to enhance the use and development of geothermal resources. However, such assessments are difficult owing to the deep-seated and heterogeneous distributions of geothermal resources. Data obtained from drilling investigations (i.e., cores, geological columns, and well logs describing physical and chemical rock properties) are the most reliable and accurate sources for characterization of geothermal systems [4,5]. Drilling is the most expensive type of exploration and the amount and depth coverage of available drilling data tend to be limited. Moreover, drilling sites are generally irregularly distributed throughout the study area. Thermal Infrared Remote sensing (TIR) is an effective technique to overcome these limitations in data distributions because active geothermal fields accompany surface manifestations of the transport of heat and mass through the crust such as volcanoes, hot springs, mud pots and fumaroles, which can be distinguished as thermal high anomalies in the Land Surface Temperature (LST). TIR has great potential for cost-effective geothermal resource exploration. Therefore, a combination of Three Dimension (3D) modeling of Subsurface Temperature (SST) using datasets composed of well-logging temperatures and LST (from TIR) is essential for a comprehensive understanding of geothermal systems and resource exploration.
The aim of the study was to develop and assess two methods suitable for 3D temperature modeling and regional LST mapping, and to identify potential areas of geothermal resources using a combination of the developed methods. Hokkaido, Japan was selected for a case study owing to the relatively abundant temperature data for the island region (Figure 1). Kriging, a spatial interpolator and simulator, may be the most promising method for the 3D modeling of SST using a well-logging dataset with the above limitations [6]. Among several types of kriging, Kriging with External Drift or trend (KED) was selected for this study because it can incorporate essential trends such as monotonous increases of temperature with depth.
TIR has been successfully applied to detection and quantification of LST anomalies and heat discharges in geothermal fields since the 1960s [7–10]. Recently, TIR was applied to detection of hot springs using thermal infrared data from Advanced Spaceborne Thermal Emission and Reflection radiometer (ASTER) and Airborne Visible/Infrared Imaging Spectrometer (AVIRIS) [11]. Landsat band 6 imagery from Thematic Mapper (TM) onboard Landsat 4, 5, and Enhanced Thematic Mapper Plus (ETM+) sensor onboard Landsat 7 has also been widely applied for LST studies [12–16]. Sobrino [17] compared three methods of retrieving LST from band 6 imagery. The latest Landsat 8 launched in February 2013 ensures the continuous use of Landsat series imagery for LST retrieval [18,19]. In this study, the Landsat 8 Thermal InfraRed Sensor (TIRS) band 10 imagery was used for the LST analysis. Understanding the surface energy balance and underground heat transfer will contribute to identification of geothermal resource areas in the study area as well as in other regions worldwide.
2. Study Area and Data
2.1. Geological Structure
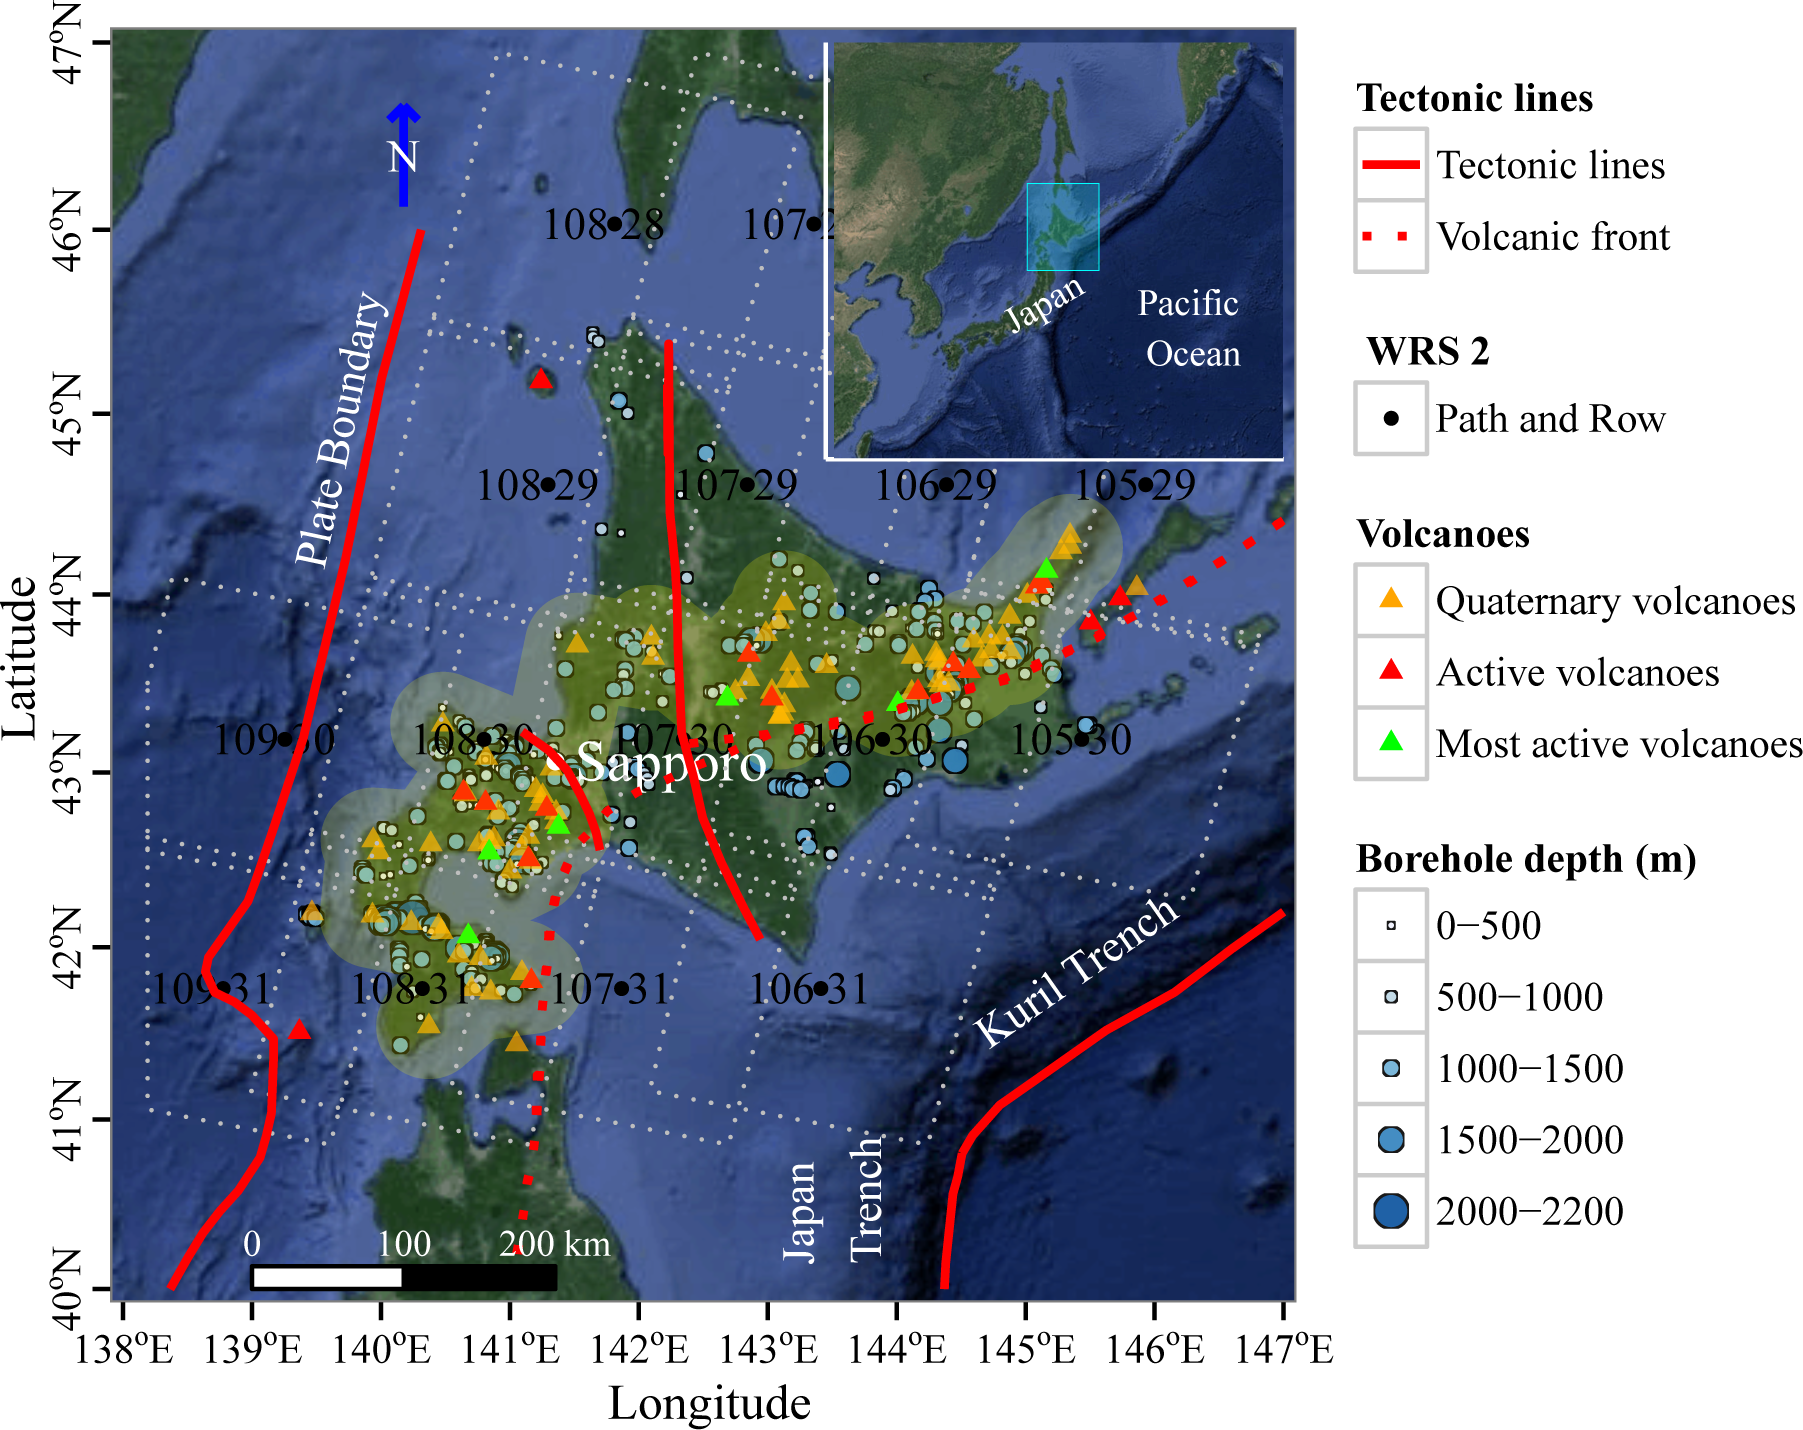
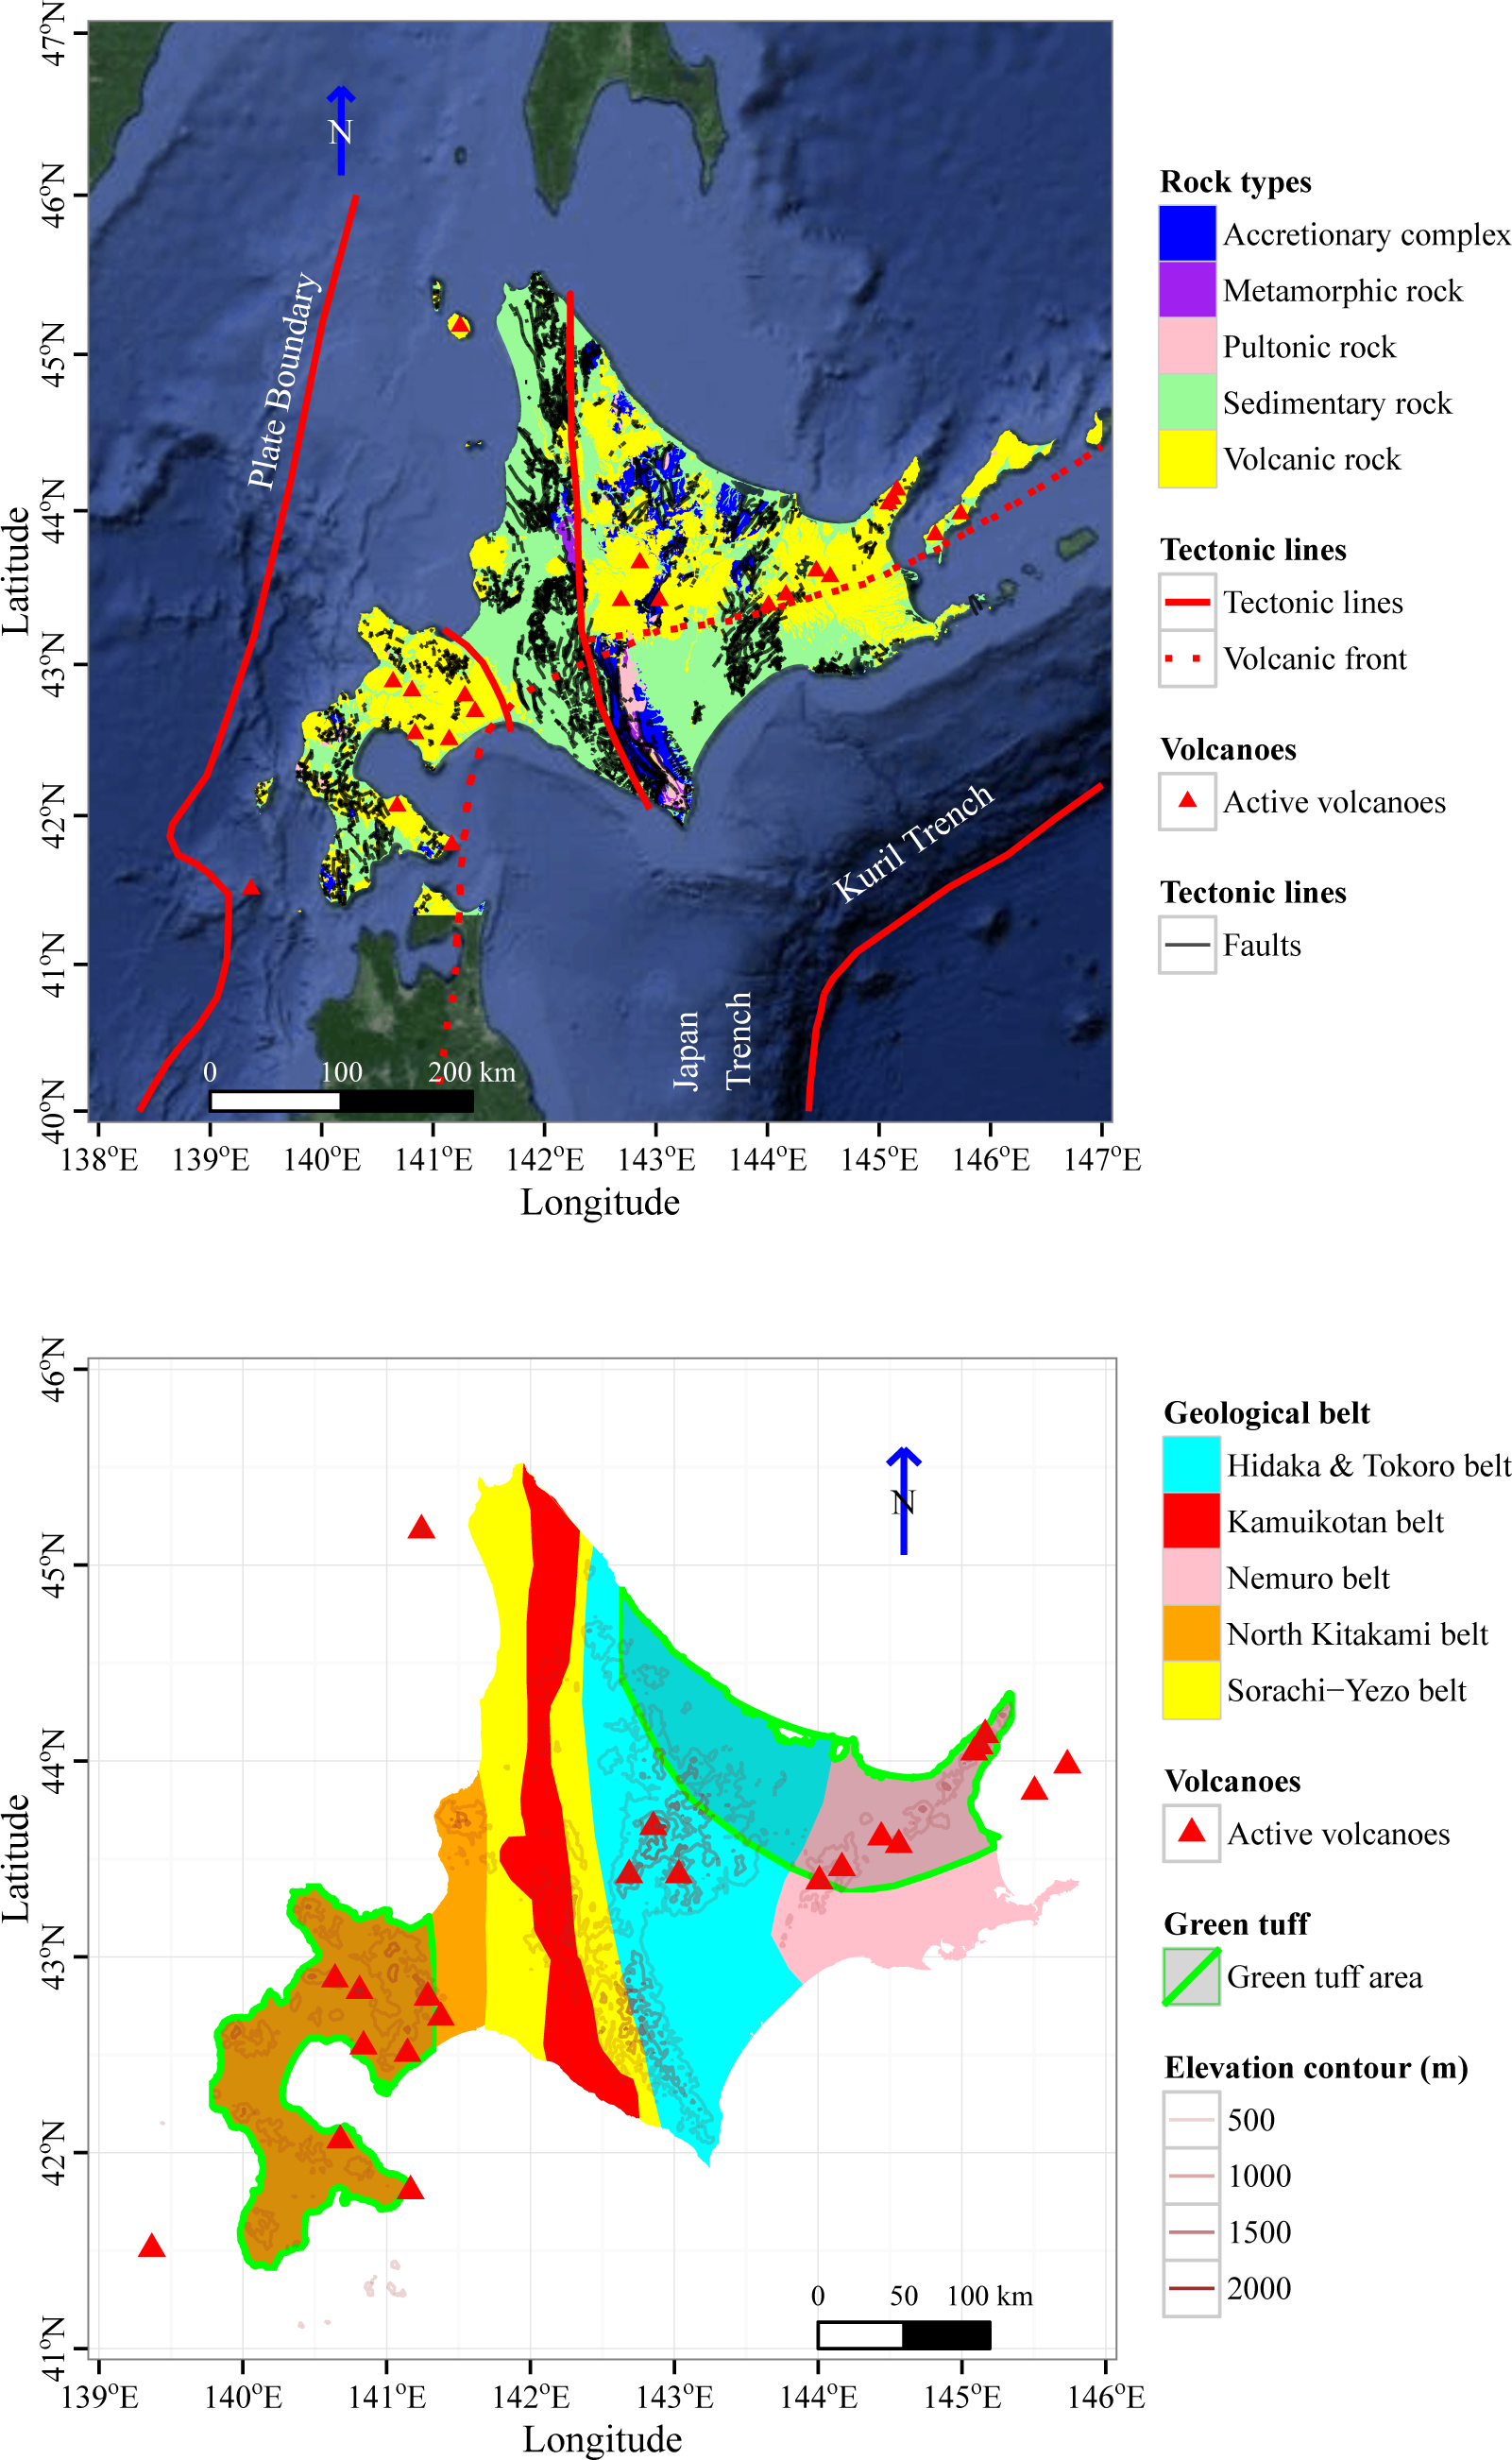
Hokkaido in its current form was structured after the middle Miocene by the collision of Kuril Arc and the Northeast Japan Arc at the middle of Hokkaido [20]. As a result, Hokkaido consists of three main parts, an eastern region (part of the Kuril Arc), central region (the arc-arc collision zone), and a western region (part of the Northeast Japan Arc) (Figure 2). The volcanic front runs nearly east-west from the eastern region through the central region, then turns to the south in the western region (Figure 2). This front is parallel to the Kuril Trench and the Japan Trench. The mountains in Hokkaido generally have gentle slopes in the northern part and steep slopes in the southern part. Similar to other areas in Japan, Hokkaido is seismically active, with six most active volcanoes, Mt. Shiretoko io-zan, Mt. Meakan-dake, and Mt. Tokachi-dake located in the eastern part of the Hokkaido island, and Mt. Tarumae-san and Fuppushi-dake, Mt. Usu-zan and Mt. Hokkaido-Komagatake (Figure 1) [21].
The main portion of Hokkaido contains 80 Quaternary volcanoes that were active during the Quaternary Period (ca. 2.6 Ma to present), including 20 that have erupted within the past 10,000 years or are under vigorous fumarolic activity. The distribution of Quaternary volcanoes and active volcanoes (Figure 1) were obtained from the websites of Geological Survey of Japan (GSJ), The National Institute of Advanced Industrial Science and Technology (AIST) [24].
2.2. Dataset of Well-Logging Temperature
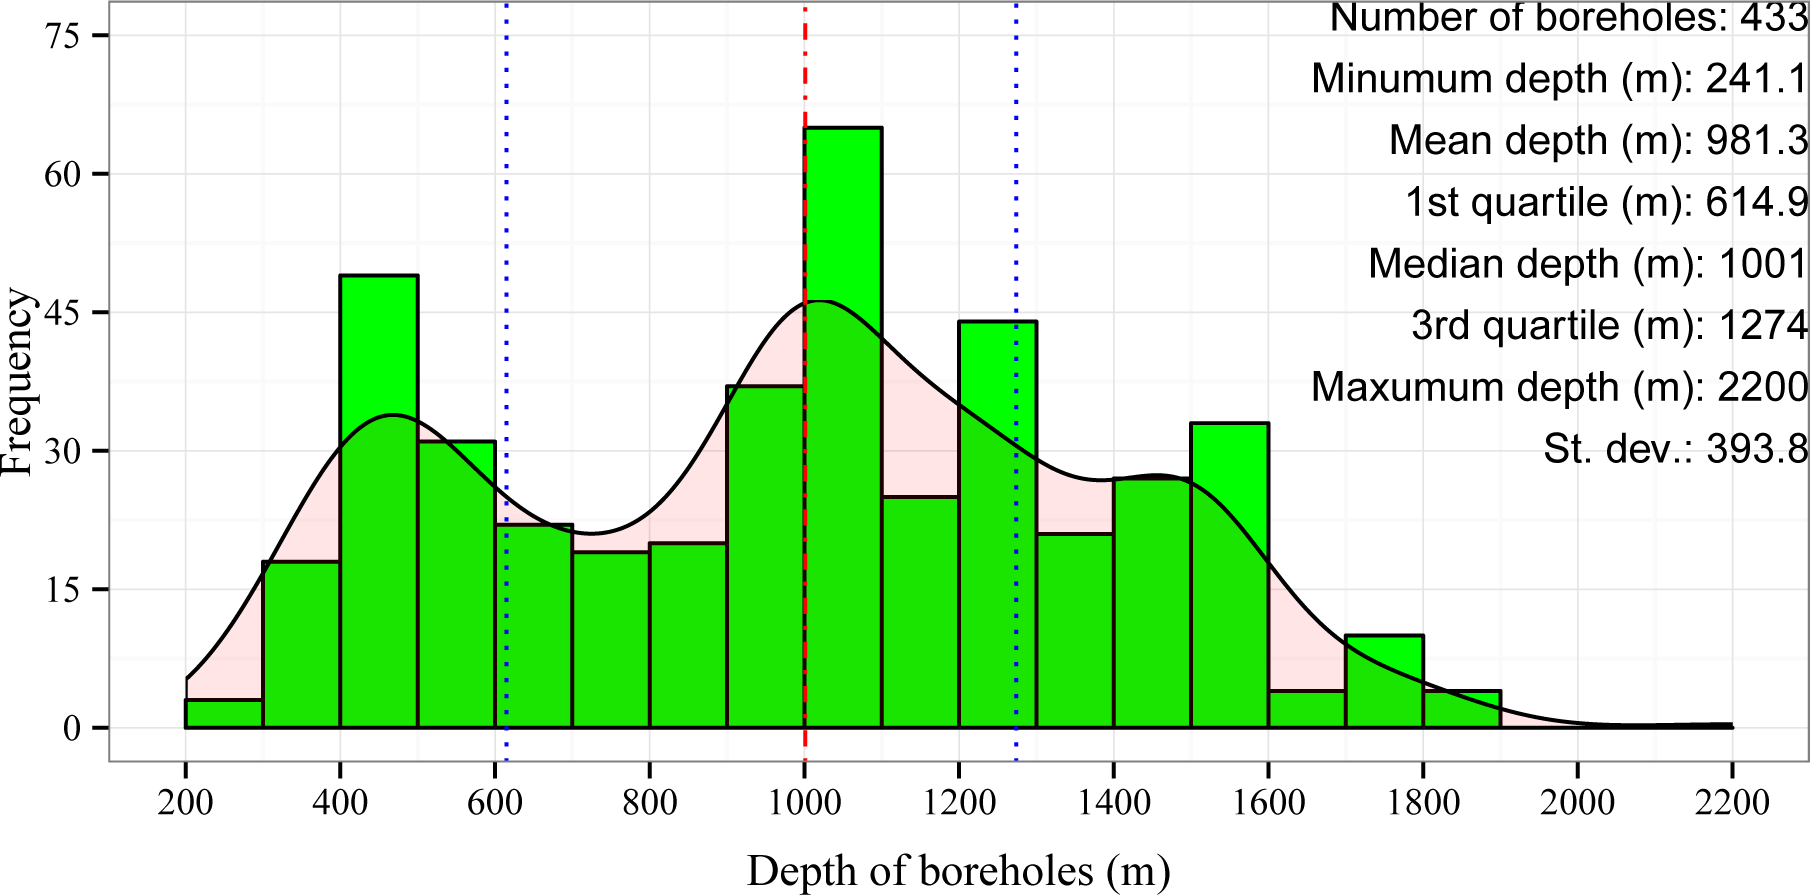
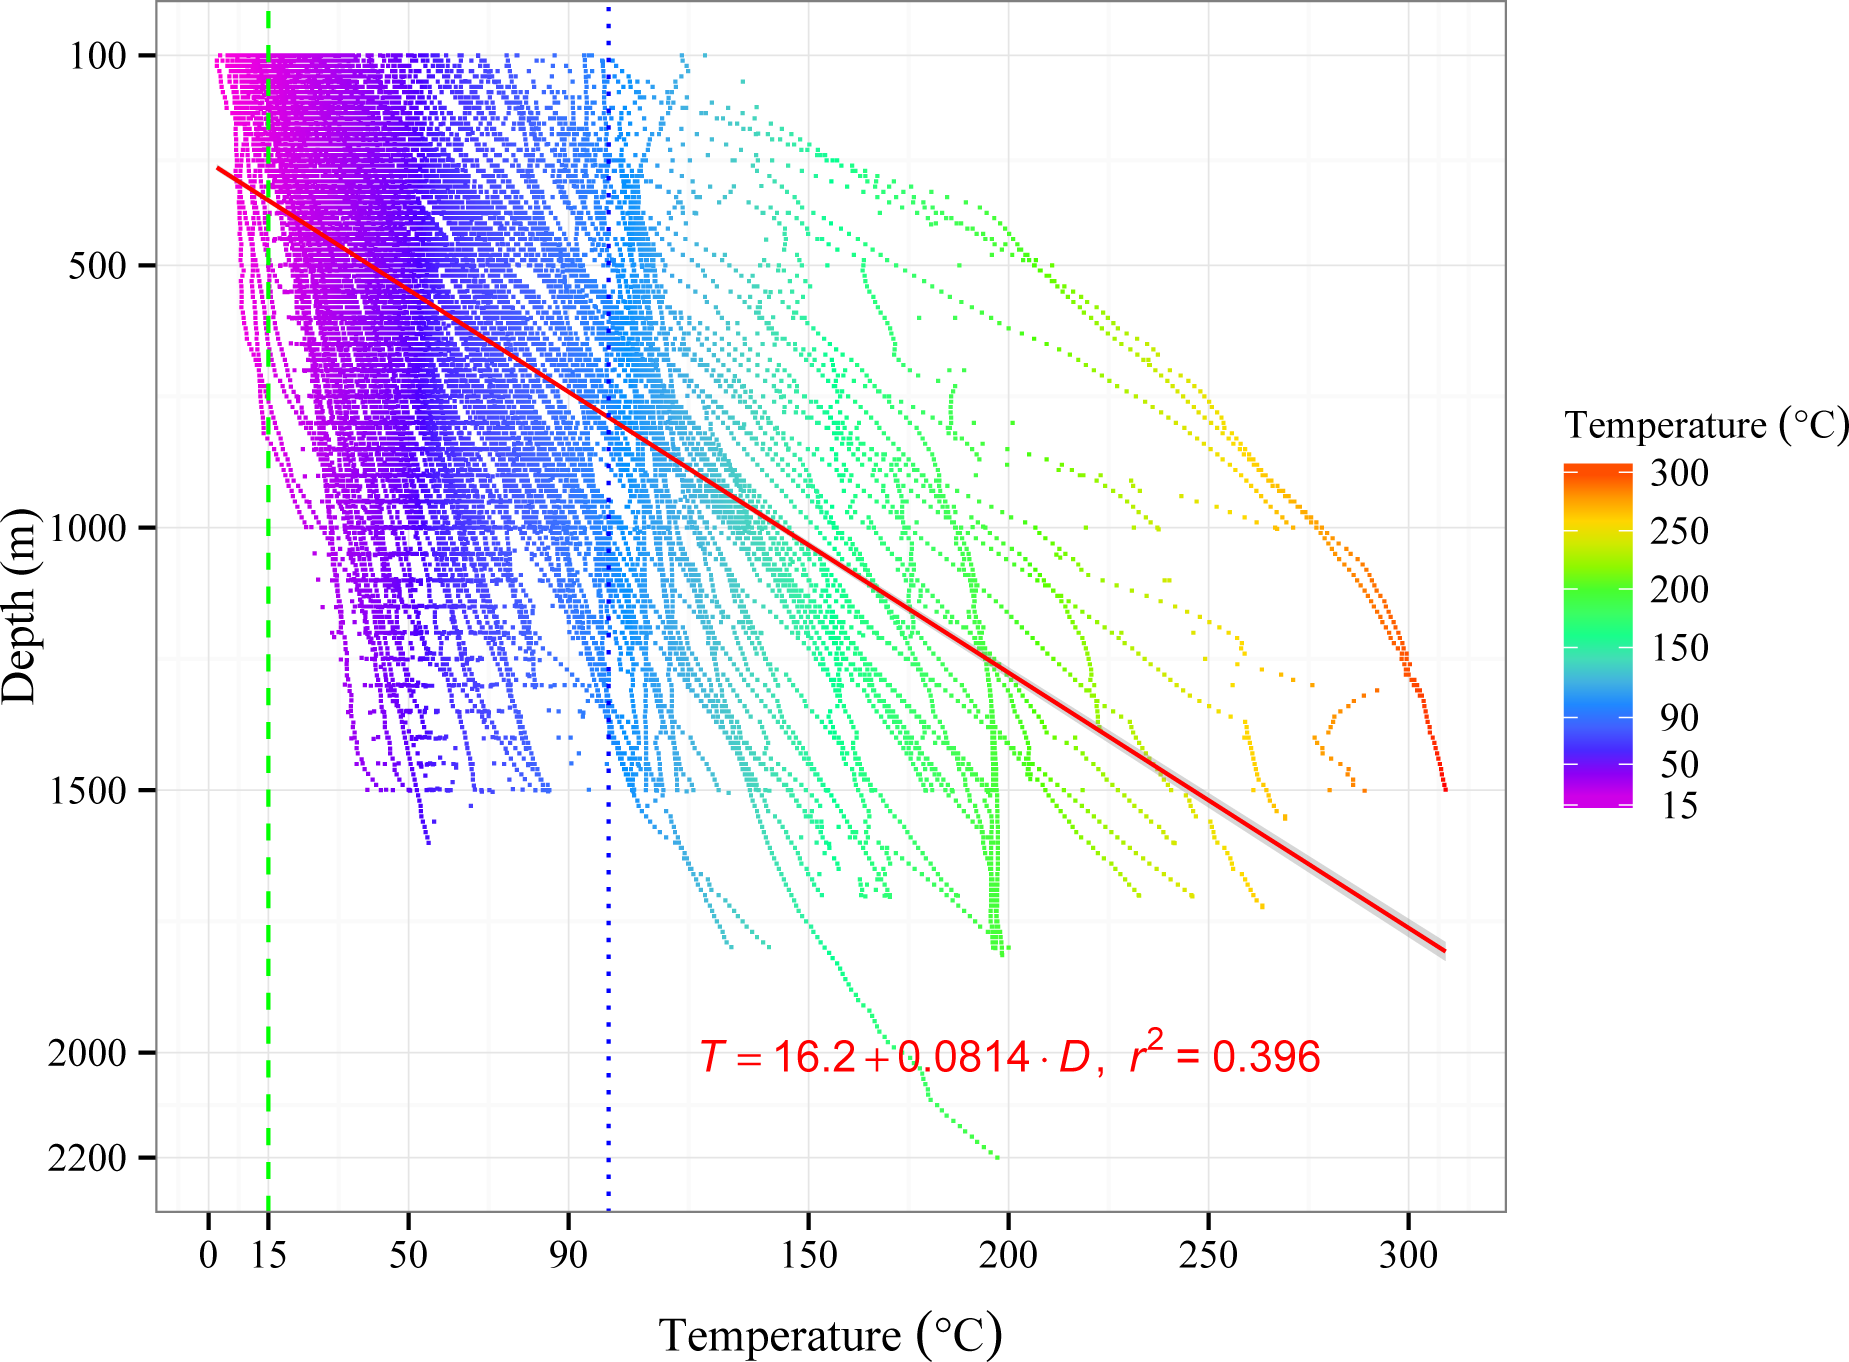
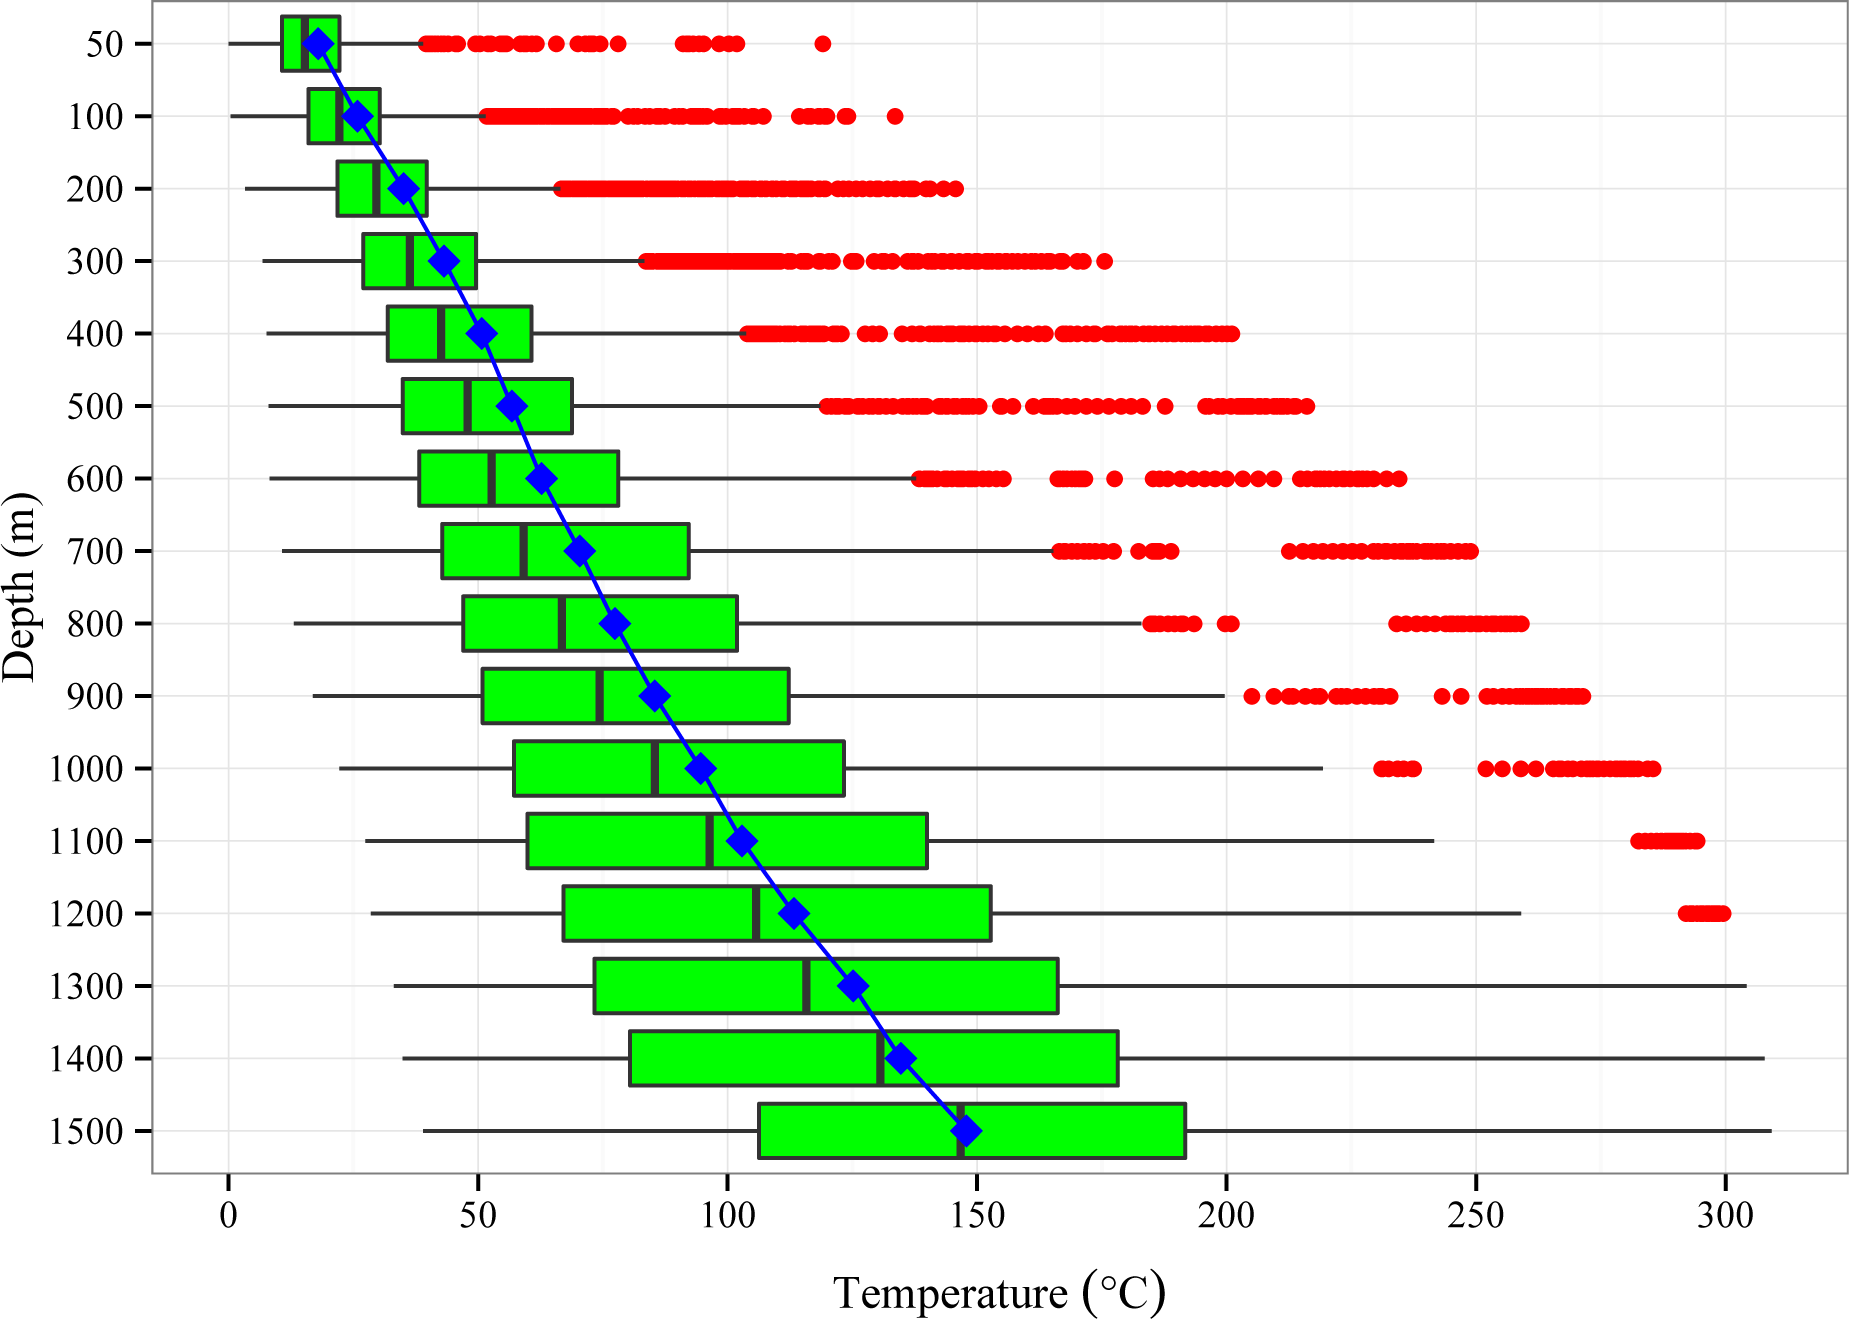
The present dataset of temperature logging originates from the temperatures profiles in Japan database compiled by the Japan Atomic Energy Agency (JAEA) in 2004 [25]. The borehole temperature logging data used in this study is a subset of the above datasets. After checking all temperature data and removing 67 outliers that showed extremely low temperatures at deep depths [26], 28,476 datapoints from 433 drilling sites within an area of 83,453.57 km2 were selected. The lengths (i.e., depths from the ground surface to the bottom of boreholes) ranged from 241 m to 2200 m, with 70 boreholes less than 500 m in length, 129 between 500 and 1000 m, 182 between 1000 and 1500 m, 51 between 1500 and 2000 m, and 1 longer than 2000 m (Figures 1, 3, 4). The first quartile, mean, median, and third quartile of the total length are 615 m, 980 m, 1001 m, 1270 m, respectively (Figure 3). As shown in all temperature profiles (Figure 4), the temperatures increased with increasing depth, but the gradients varied greatly with borehole location. 3 increasing trends were observed forming a linear, logarithmic, and exponential curve. Linear increases signify that thermal conduction governs the temperature change, while convection occurs at discharge areas showing logarithmic increases. The exponential curve reflects low temperatures in shallow depths owing to descending fluid flow in a recharge area. The average temperature gradient is 81 °C/km (Figure 4), which is about three times larger than the average gradient of shallow crust (25–30 °C/km) [27]. In addition, the mean and median temperatures increase with increasing depth intervals, and the range of temperature varies with drill depth (Figure 5). The increase in the range indicates that temperature differences among sites become greater with depth.
2.3. TIR Data
Two sensors, Operational Land Imager (OLI) and TIRS, are onboard the Landsat 8 satellite, which was launched and operated by National Aeronautics and Space Administration (NASA) and the United States Geological Survey (USGS) [28]. There are nine spectral bands in OLI for measuring surface reflection [28]: coastal/aerosol (0.435–0.451 μm), visible blue (0.450–0.515 μm), green (0.525–0.600 μm), red (0.630–0.680 μm), Near InfraRed (NIR) (0.845–0.885 μm), Short Wave InfraRed 1 (SWIR1) (1.560–1.660 μm), Short Wave InfraRed 2 (SWIR2) (2.11–2.29 μm), cirrus (1.360–1.390 μm), and panchromatic mode (0.500–0.680 μm). In addition, there are two bands in TIRS for measuring radiation (10.60–11.19 μm and 11.50–12.51 μm). Thirteen scenes from band 10 (10.60–11.19 μm) obtained under cloud cover of less than 10% during spring, summer, and fall were selected as suitable TIR imagery to clarify the LST distribution on Hokkaido (Table 1 and Figure 1). The images are the best quality for each scene, with the path and row numbers in Figure 1.
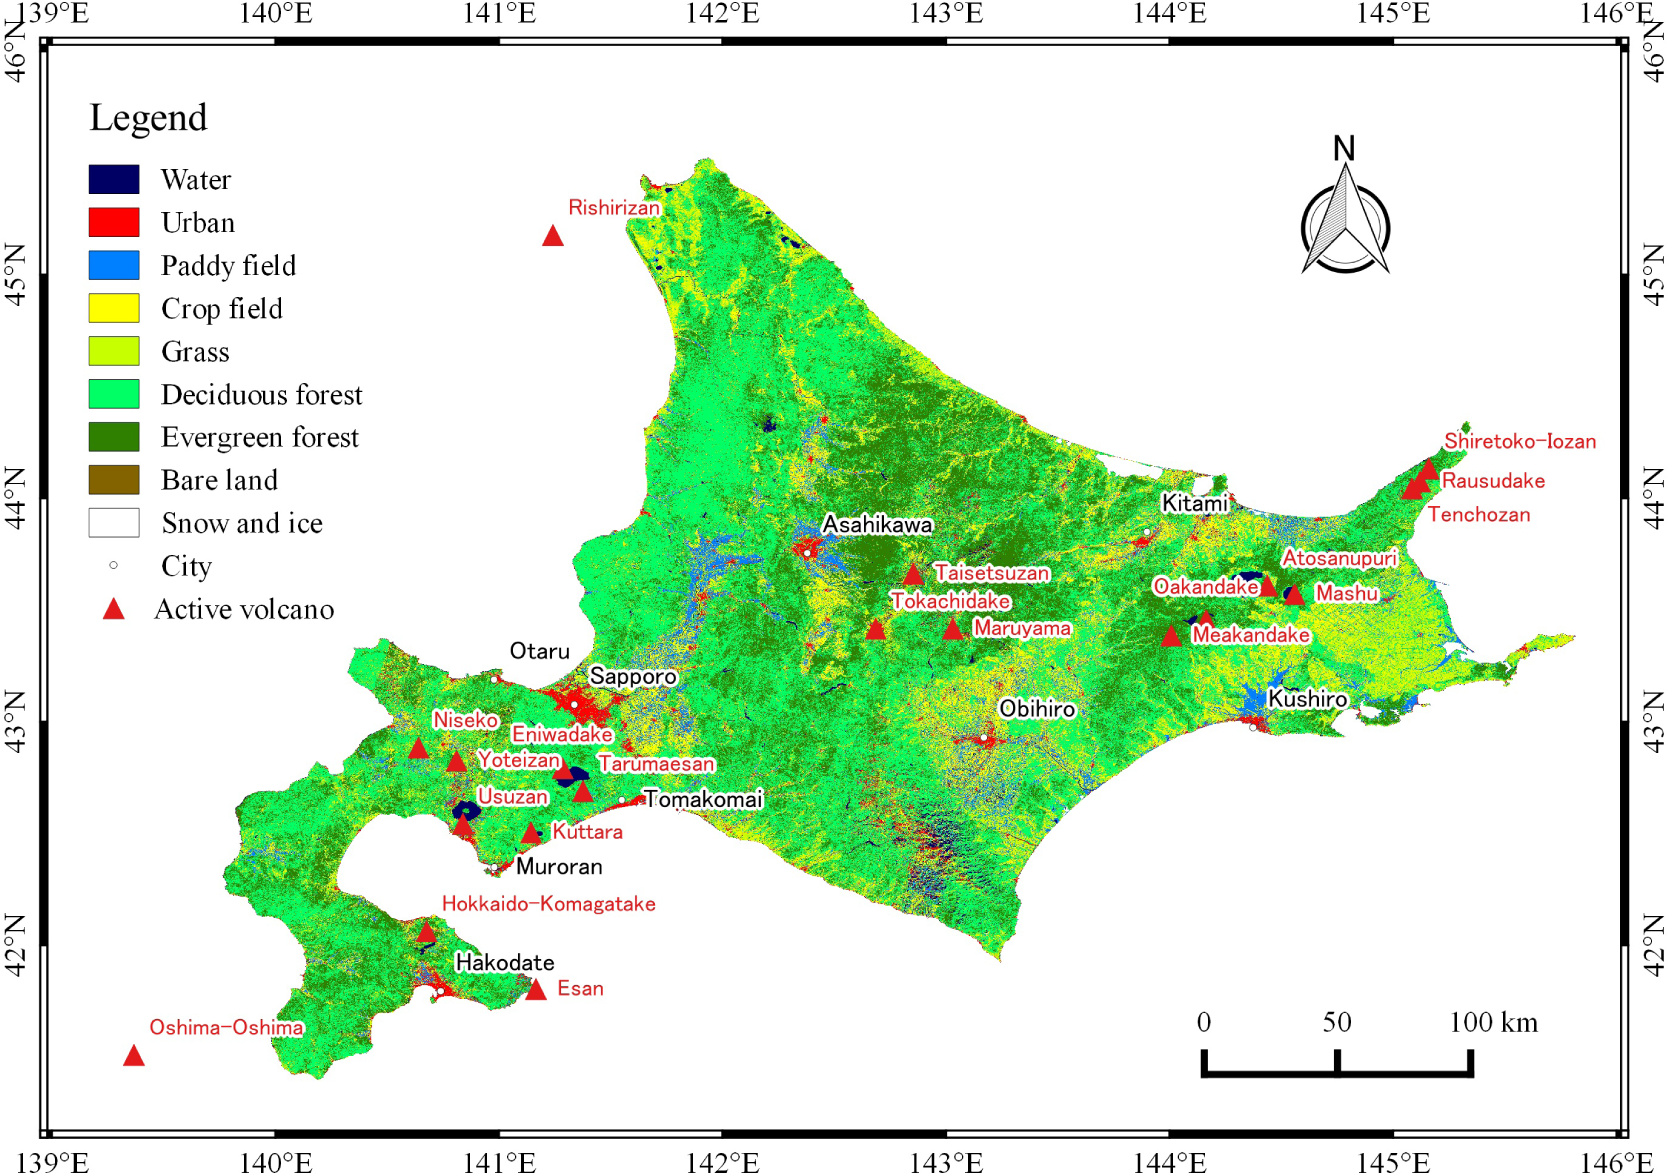
In addition, a Land-Use and Land-Cover (LULC) map of Hokkaido with a resolution of 30 m generated by Japan Aerospace Exploration Agency (JAXA) Earth Observation Research Center (EORC) [29] was used to estimate emissivity and anthropogenic impacts on thermal anomalies. This LULC map was produced using Advanced Visible and Near Infrared Radiometer type 2 (AVNIR-2) image data with a resolution of 10 m onboard Advanced Land Observing Satellite (ALOS). The categories of LULC are water, urban, paddy field, crop field, grass land, deciduous forest, evergreen forest, bare land, and snow and ice (Figure 6).
3. Methods for Estimating Subsurface and Surface Temperatures
3.1. Geostatistical Estimation of 3D Subsurface Temperature
As shown in Figure 4, the temperature data are not statistically stationary because they increase with depth. Kriging with External Drift or trend (KED) (Equation (1)) is suitable to produce a spatial model for regionalized data with significant spatial trends, such as the temperature logging data used in this study. KED incorporates a local trend within the neighborhood search window as a smoothly varying function, which is usually a polynomial function of the coordinates, and then estimates the trend component within the window and a value at the unsampled point by simple kriging using the residual sample data. This residual is equal to the sample value minus the local mean in the window [30]. KED is calculated by:
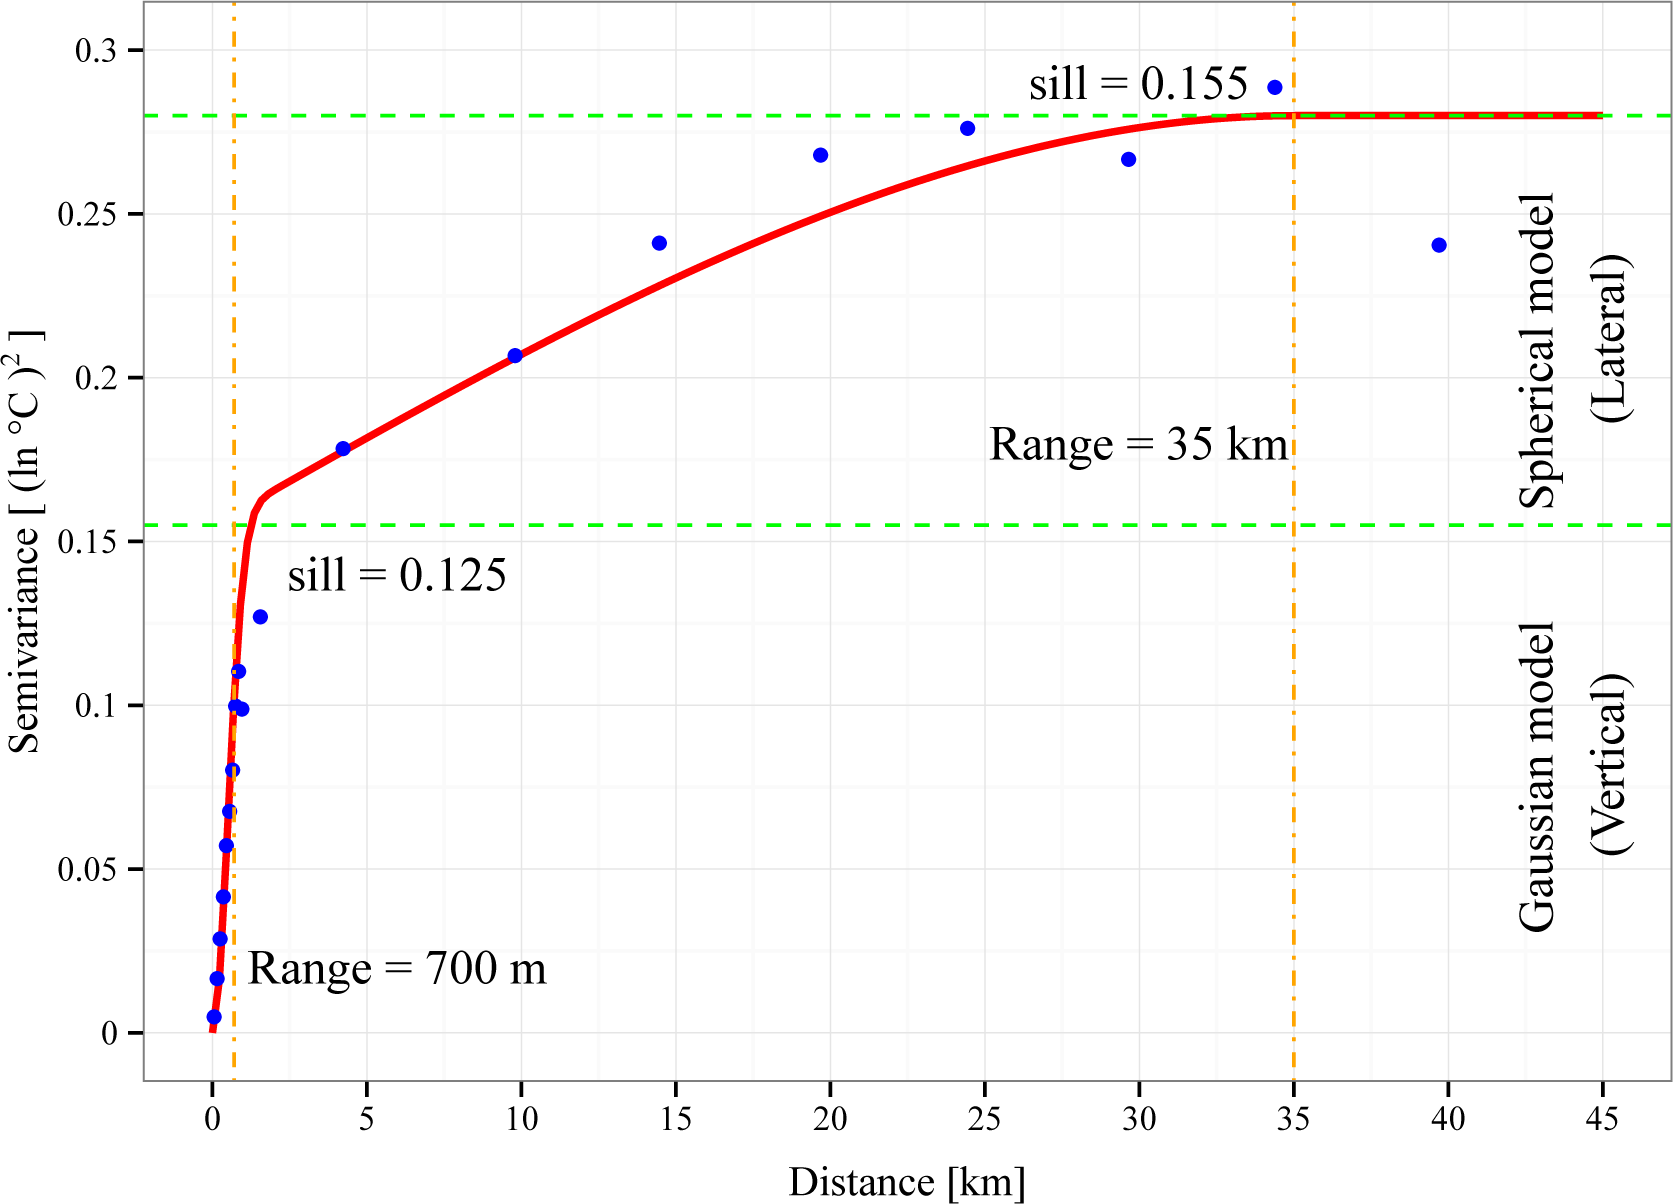
A workflow of KED is shown in Figure 7. For simplification, a global linear trend related to the physics of conduction was adopted for the log-transformed temperature data used for 3D KED estimation. This estimation also assumed the steady state of temperature. The log-transformation was conducted to reduce data distribution bias and approximate a normal distribution, a suitable condition for geostatistical application. Prior to analysis, it was necessary to generate a variogram. Figure 8 shows the resultant omnidirectional experimental variogram and its approximation by the best-fitted variogram model. A nested structure clearly appeared in the variogram, indicating a mixture of short and long spatial correlation structures. The short structures primarily expressed the correlation along the vertical direction and were approximated by a Gaussian model with a range (maximum correction distance) of 700 m and sill of 0.155. In contrast, the long structure reflected the lateral direction and was approximated by the spherical model, with a much longer range of 35 km and a sill of 0.125.
3.2. Physical Basis of LST
According to Planck’s law, spectral radiance B(λ, T) (Wm2μm−1sr−1) of black body is function of wavelength λ (m) of electromagnetic waves and temperature T (K) that can be defined as follows:
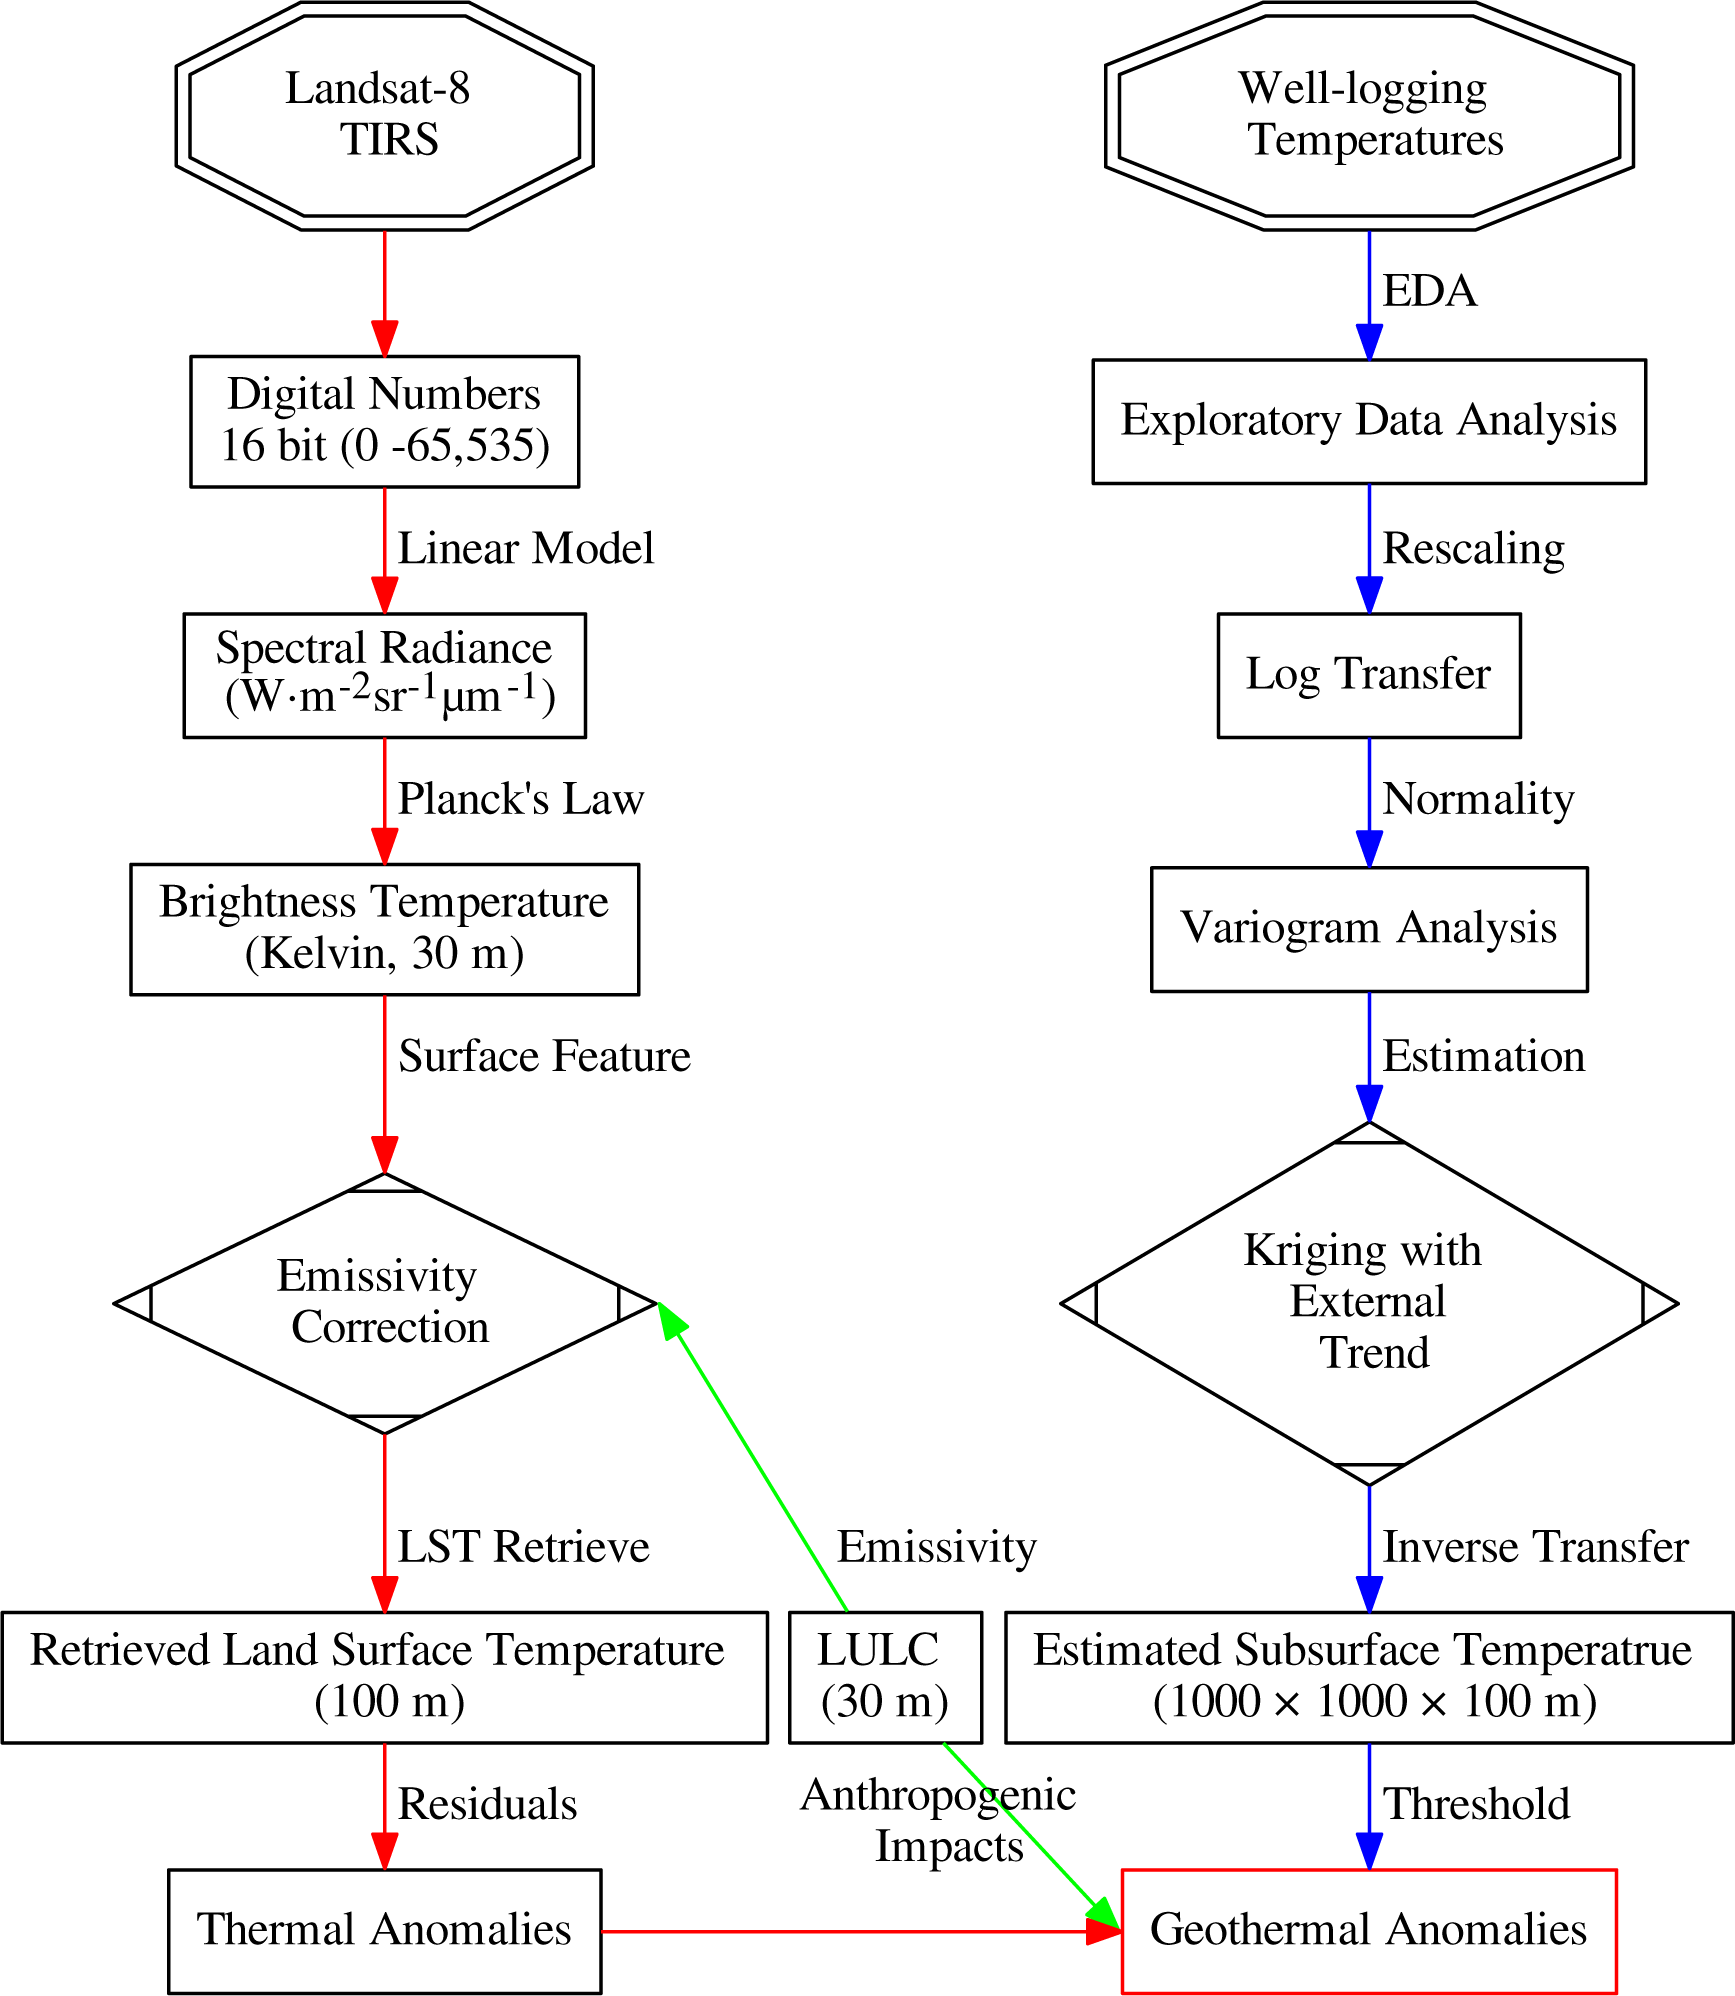
3.3. LST Algorithm
Many algorithms based on different assumptions have been proposed for estimation of LST from satellite TIR image data to date [31,32]. For this investigation, an algorithm proposed by Artis et al. [33] was selected because it requires only one parameter (emissivity of surface material), which was suitable here because LST residuals from many low cloud cover scenes with different seasons were used. The method used to obtain the LST map from the Landsat 8 TIRS band 10 image data using a set of R [34] scripts is summarized in Figure 7. First, Digital Number (DN) was converted to B(λ, T), which is the at-sensor spectral radiance at the middle wavelength of band 10 (λ = 10.9μm). TB at sensor or Top of Atmosphere (TOA) was then calculated using Equation (3). Next, TB was corrected by considering the Land Surface Emissivity (LSE), ε. The values of ε were assigned to each pixel based on the categories shown in the LULC map (Figure 6). Finally, LST was calculated from TB and ε (Table 2) using equation [33]:
Because of the mixture of seasons, the LST maps derived from the image data in Table 1 cannot be directly compared with each other. To reduce this seasonable change effect in LST, each LST map was normalized by subtracting the mean LST value, LSTm as:
All LSTn maps were connected to highlight high temperature anomaly zones.
Additionally, a suite of open source R packages (raster [35], sp [36], rgeos [37], rgdal [38], gdalUtils [39], landsat [40], wrspathrow [41], gstat [42], maptools [43], ggplot2 [44], ggmap [45], and rasterVis [46] were used for data downloads, analyses and mapping in this study. We developed an R software package for TIR image analysis and LST mapping in the R programming language. The source codes of the package are freely available to download from [47] (see Appendix).
4. Results
4.1. Characterization of 3D Subsurface Temperature Modeling
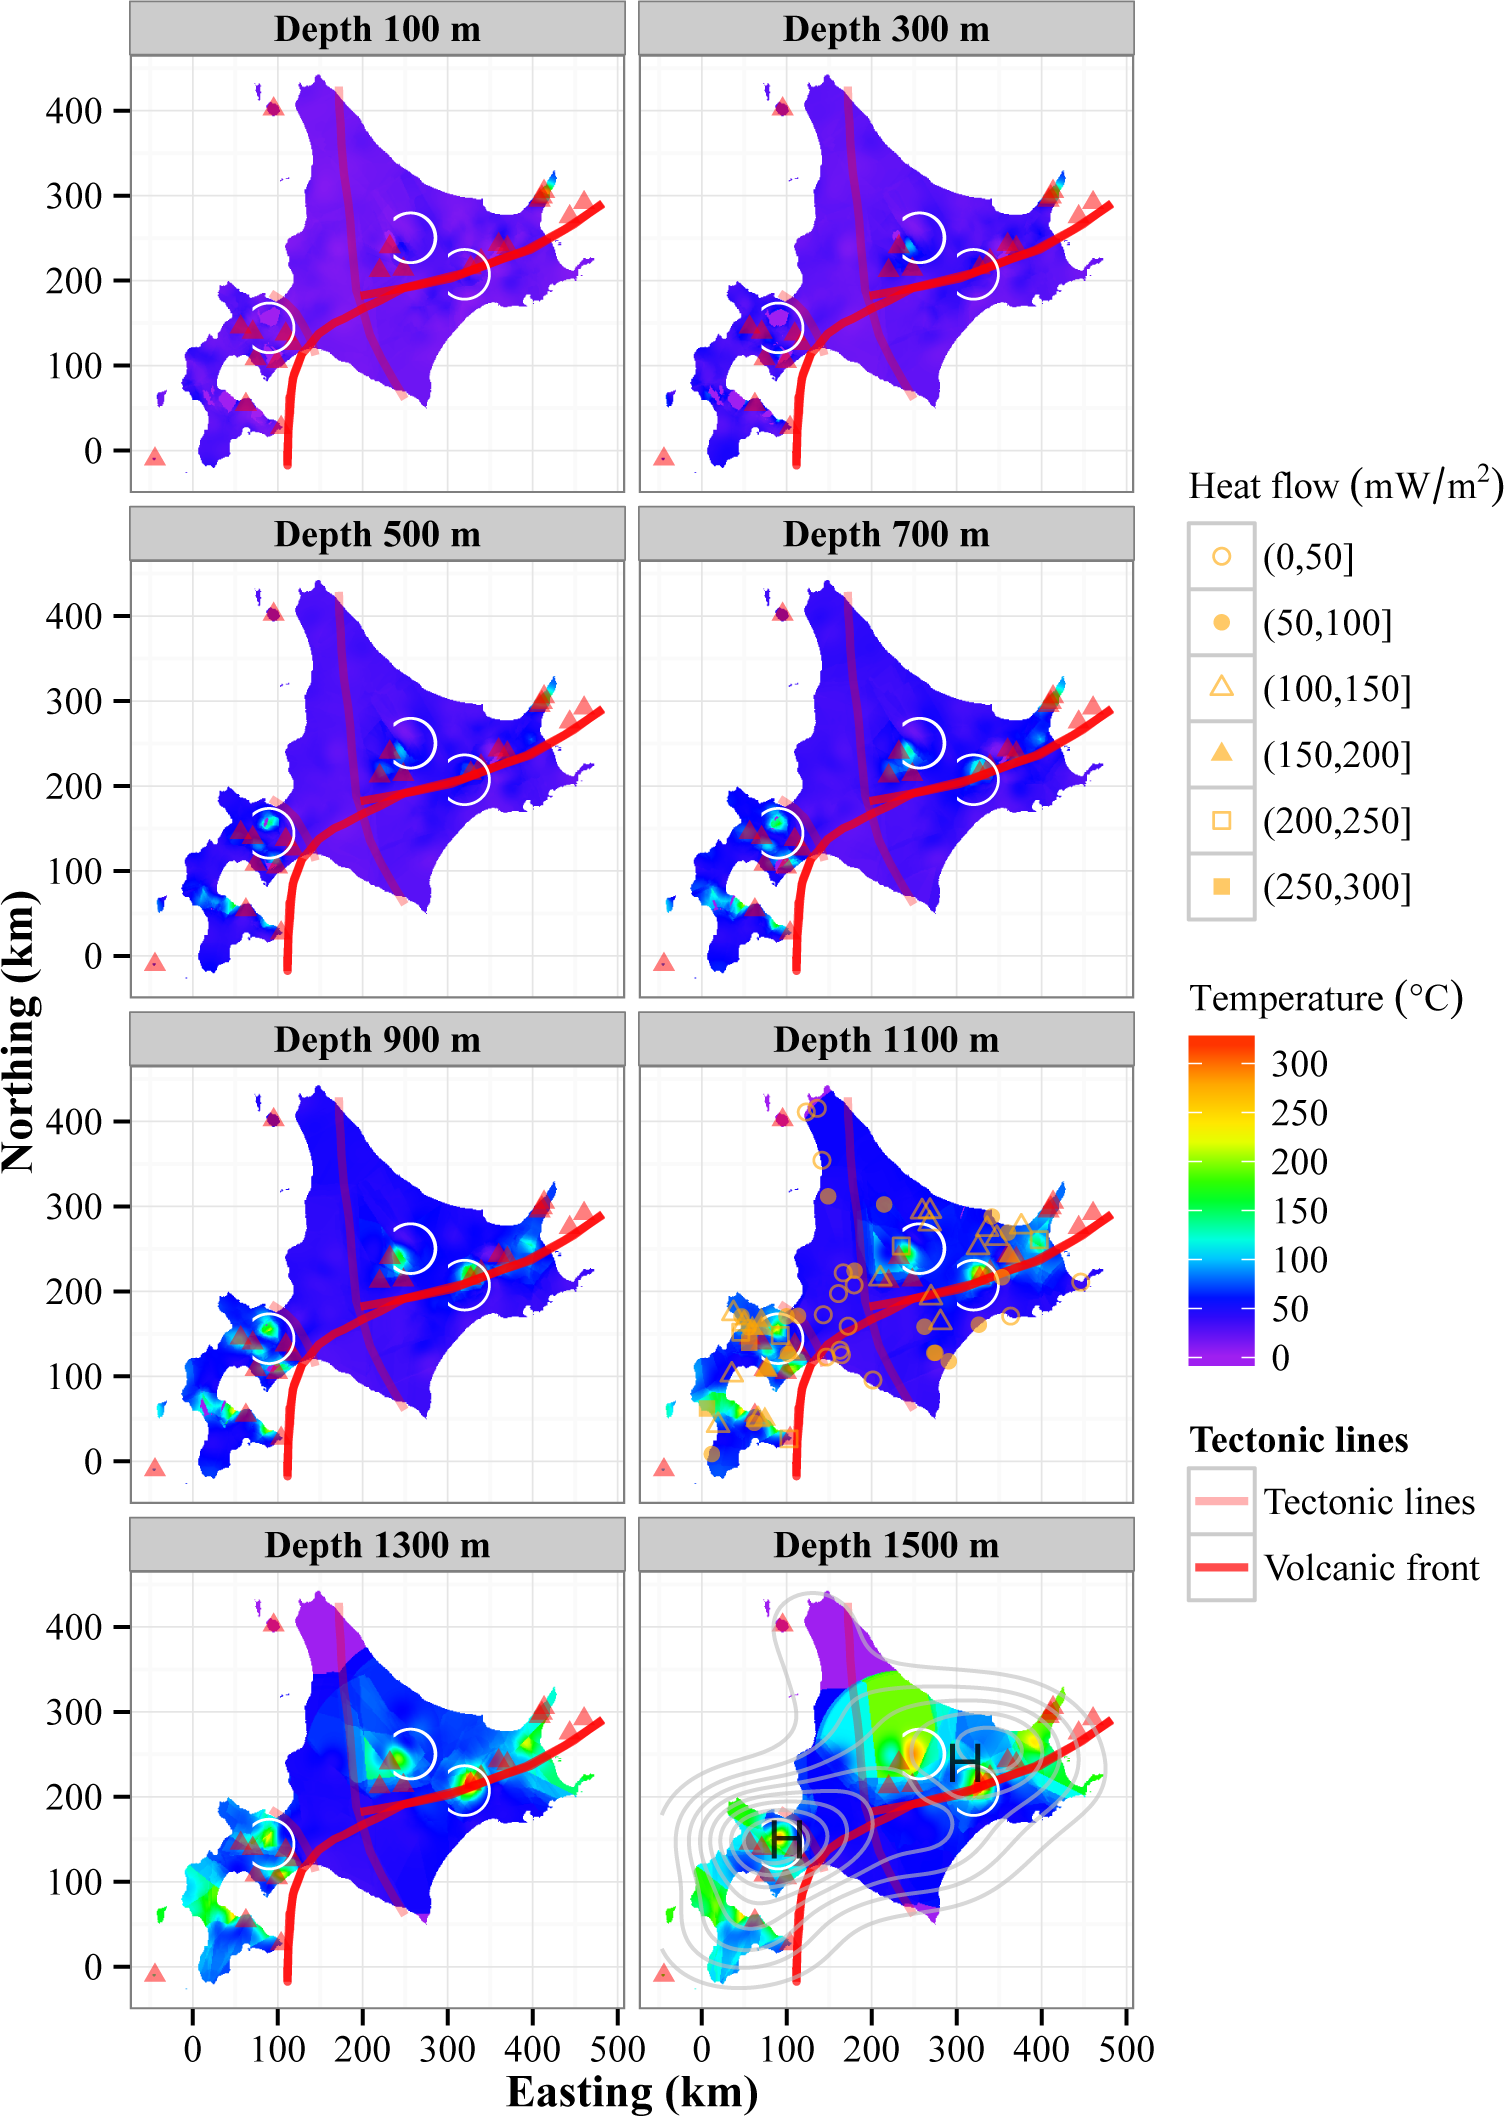
The 3D SST (Figure 9) was calculated for depths of 100 m to 1500 m over Hokkaido by KED using the model (Figure 8) and a unit grid size of 1000 m × 1000 m × 100 m. The result is shown by slices of 3D SST distributions at the same depth (Figure 9). To confirm the estimation accuracy of the 3D SST, cross-validation was conducted for the sampled temperature value and the predicted value by KED and the results were reported as a linear correlation coefficient (r). The r value was 0.97, indicating that the SST model is reliable. Temperature distributions at different depths are shown in Figure 9. The distributions were characterized by local high temperature zones over 150 °C at all depths, with temperature ranging from 50 to 300 °C. The local anomalies were limited to locations on the eastern border, central, and western parts of the study area at shallow depths of no more than 500 m below sea level (b.s.l.), which is concordant with the locations of active volcanoes. The high anomaly zones are more evident and extend with increasing the depth. One remarkable feature is that the high temperature zones extend into the western region (Northeast Japan Arc, Figure 2), while temperatures in the central region (arc-arc collision zone, Figure 2) are generally low, and those in the middle of the eastern region (Kuril Arc part, Figure 2) are high relative to the surrounding areas. This feature becomes greater at depths of 1500 m b.s.l. or more. In general, temperatures in the western region are higher than in the other two regions, which agrees with the large distribution frequency of Quaternary volcanoes. As shown in Figure 9, high SST zones mostly overlapped with the distribution of Quaternary volcanic rocks areas (Figure 2).
4.2. LST
MODerate resolution Imaging Spectroradiometer (MODIS) LST has been widely used to verify LST accuracy through Landsat series or remotely obtained images [9,50]. The differences between MODIS LST values and ETM+ are reportedly smaller than 2 °C [50]. In addition to the KED results, LST maps derived by Equation (5) were verified by comparison with the MODIS LST maps on the same acquisition dates as the 13 scenes. This was the only method of verification used in the present study because there were insufficient in-site surface temperature data available. As in [50], the average differences in the LST values at corresponding locations were smaller than 2 °C for all scenes, which indicates that the LST results were accurate. Accordingly, the LST maps can be effectively used to characterize LST over the study area.
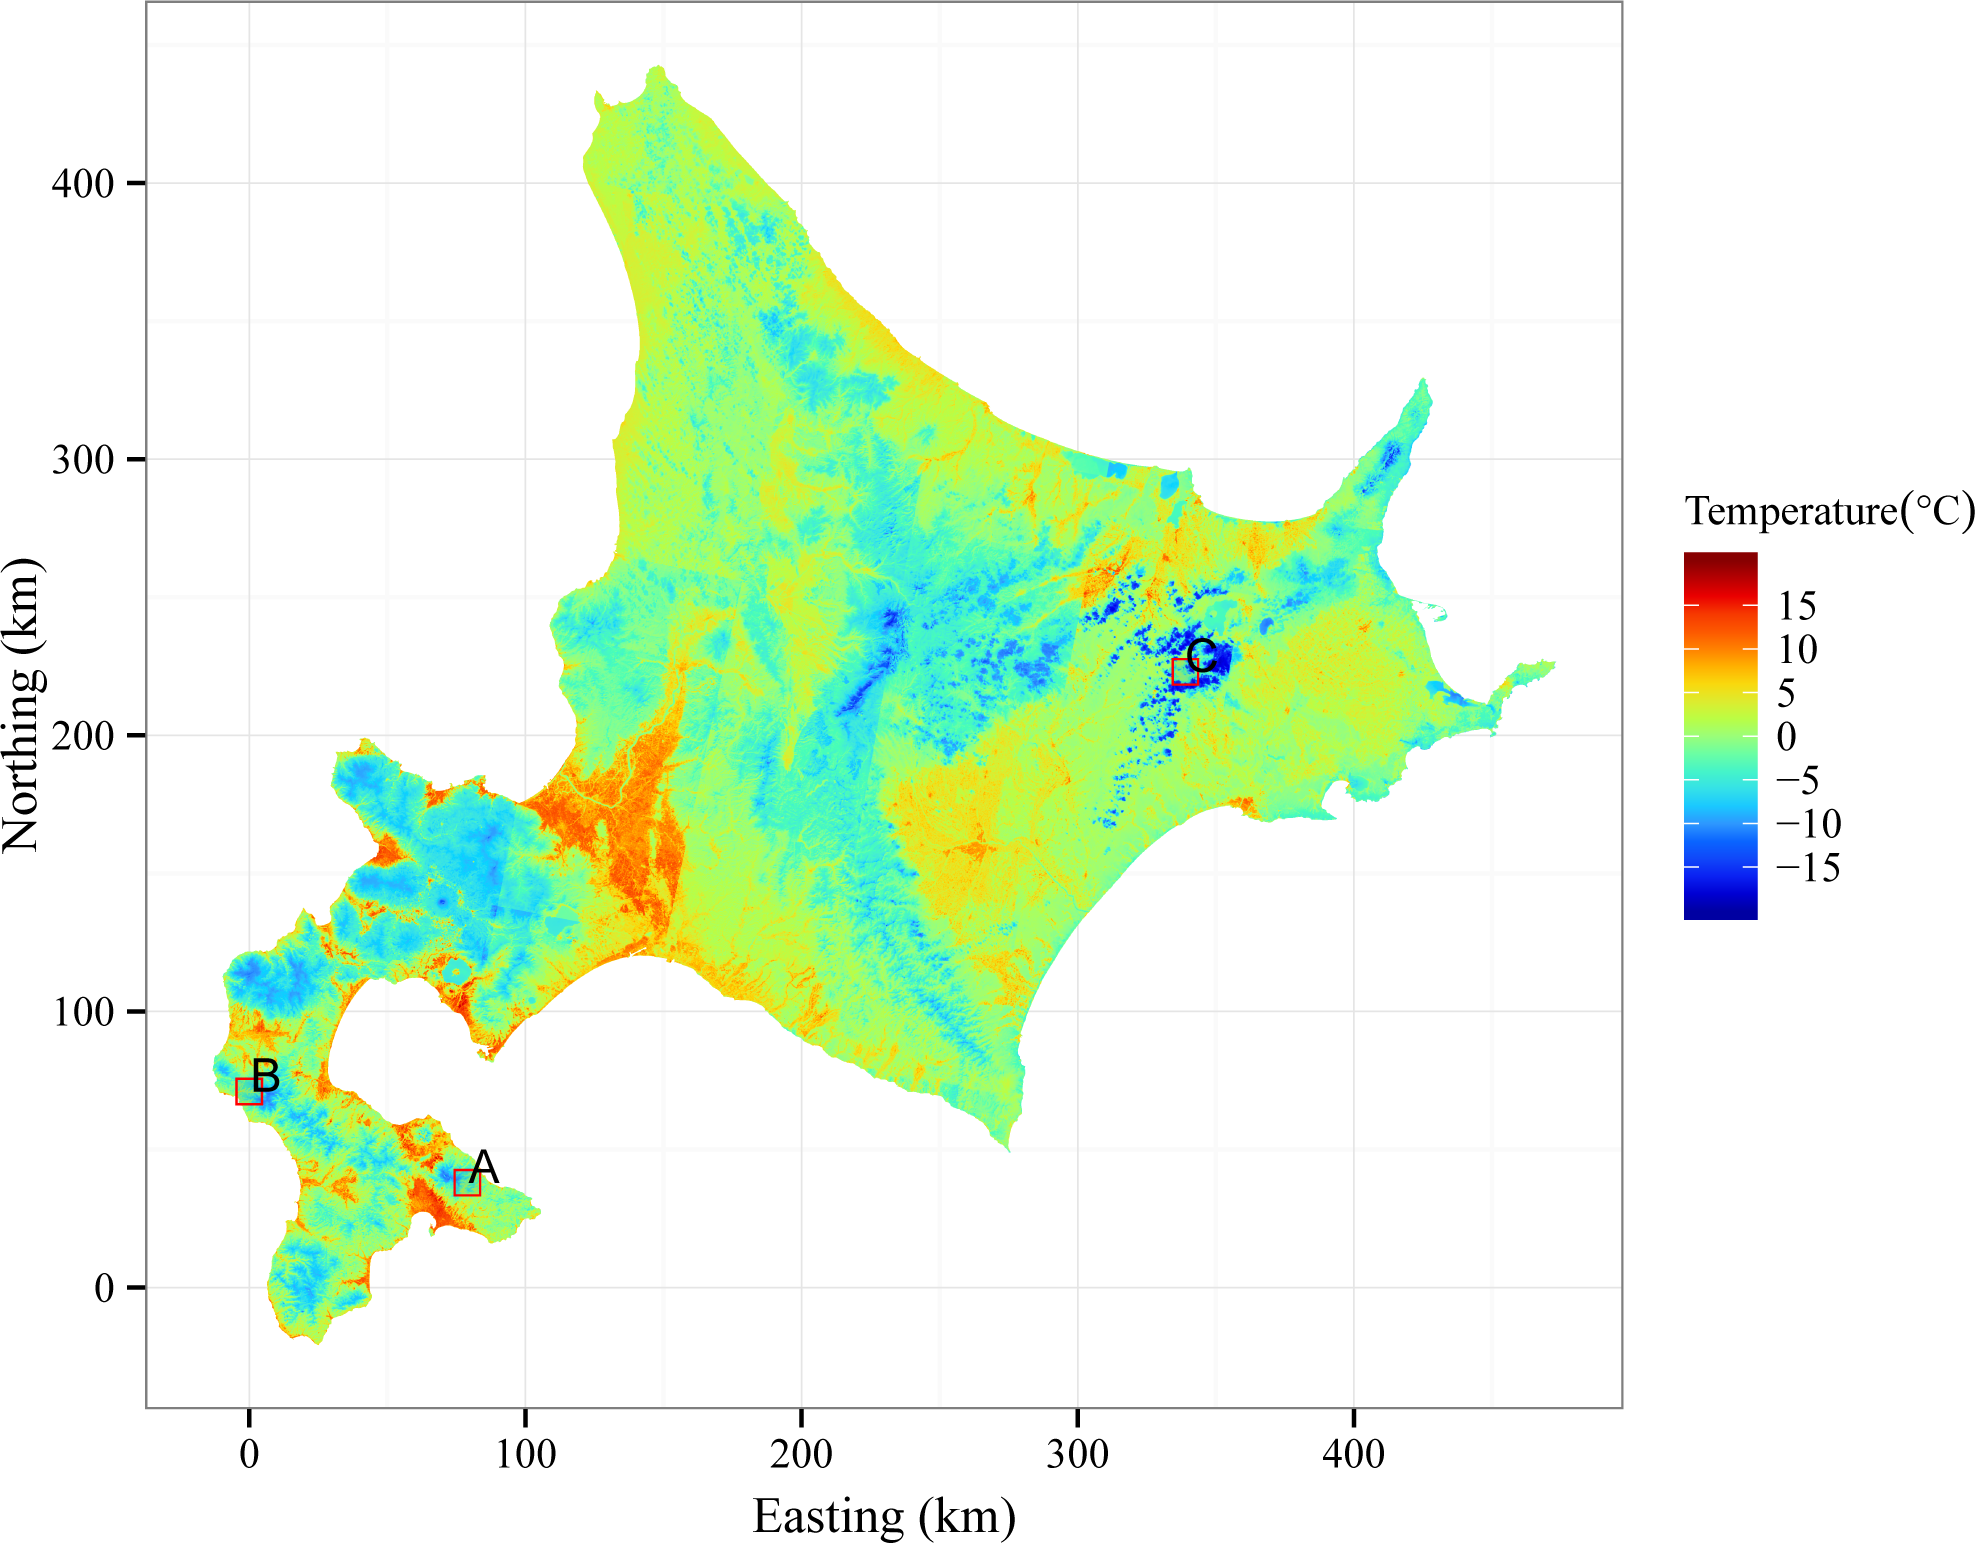
Connected LSTn highlights high temperature zones (Figure 10), which were primarily located in anthropocentric areas such as urban areas, paddy fields and crop fields. Among these regions, urban areas had the highest LST. The low LST extends into high elevation areas covered by forest. By excluding all high LST associated with anthropocentric effects, three zones (A, B, and C in Figure 10) were identified for examination of the correlation between LST and SST values, as well as for assessment of their geothermal potential. These three zones were selected because they were all are situated at local high temperatures, with 150 °C at 1500 m b.s.l. LST maps in the three zones covering 10 km × 10 km are compared with the LULC maps and the location maps (from Google terrain map) in Figure 11. At all zones, LULC fell into the category of deciduous or evergreen forest (Figure 11); therefore, the LULC effects on LST must be small. Nevertheless, all zones contained high LST anomalies, being 3 to 9 °C higher than the surrounding areas. Based on these results, the residual LST can contribute to detection of high temperature zones connected with the high SST in shallow and deep depths and favorable geothermal resources.
5. Discussion
5.1. Geological Interpretation of the Crustal Temperature Distribution
The SST results can be characterized based on the differences among the three regions on Hokkaido, with the highest values being observed in the western region and the lowest in the central region. The SST model is harmonious with the terrestrial heat flow map retrieved from the database of geothermal gradients and heat flow data in and around Japan [48,49], with the highest temperature zones at 1500 m b.s.l. being found in the western region (Figure 10), which is consistent with the extremely high heat flow region (Figure 9). Moreover, the presence of relatively high temperatures at shallow depths (e.g., 200 °C at 500 m b.s.l.) in the western region and a portion of the eastern region indicates that the heat sources in these regions may be shallower than in the surrounding areas. Based on the geophysical features, the temperatures in these western region were inferred to increase to 1000 °C at depths of 15–20 km depths, whereas they only increased to 200 °C at the same depth range in the central region [51].
From a geological viewpoint, the western region with high SST is overlain by green tuff (Figure 2) which is a product of submarine volcanic activity that mainly occurred in the Miocene [23]. The cause of the high temperatures in the eastern region can also be attributed to igneous activity originating from subduction of the Pacific Ocean plate because Hokkaido is situated in a subduction zone at the northwestern margin of the Pacific Ocean. Magma is generated under island arcs in response to subduction of the Pacific Ocean plate and partial melting of the crust. The formation and location of the volcanic front (Figure 2) likely originated from this magma.
Formation of the volcanic front is related to the distribution of trenches (Figure 2). Based on the above generation mechanism of high temperature zones, another high temperature zone have high possibility to appear on the southeastern side along the volcanic front in the central region. However, the area was found to be dominated by low temperatures that continue to 1500 m b.s.l. (Figure 9). Two narrow metamorphic zones, the Sorachi-Yezo belt and the Kamuikotan belt, are distributed around the central region (Figure 2), which might have interrupted the geothermal activities of the island arc by large blocks of serpentinite and high-pressure terrane [51,52]. A sedimentary layer with a thickness of approximately 3–9 km [23,53] characterized by low heat production originating from radioactive decay and low thermal conductivity may be other factors responsible for the low temperatures in the central region.
5.2. LST Anomalies and Geothermal Potential
LST is predominately controlled by solar radiation, to a lesser degree by the Earth’s interior heat, and in some cases primarily by soil heat flux [54]. Excessive soil heat flux transferred to the land surface via conduction and convection causes LST anomalies, with temperatures that are higher than the surrounding areas. Accordingly, LST anomalies signify the existence of heat sources at relatively shallow depths and the formation of thermal channels, which can be related to the high potential for use as a geothermal resource. Another possible approach is to correlate LST with deeper thermal structure by the methods of Mareschal et al. [55] which calculated the subsurface temperature from the surface heat flow data by the downward continuation techniques. The method were well applicable in two different settings, one was assumed to be conductive equilibrium and the other one was characterized by hydrothermal convection. As mentioned above, LST anomalies can be separated into those of urban origin and those associated with the subsurface heat source. Because the present study area is extensive, regional LST is certainly affected by LULC anomalies, particularly urban heat islands that greatly enhance LST and produce local anomalies. Such anomalies should be excluded from sites assessed as potential geothermal resources.
Based on these findings, we correlated areas of high SST with LST anomalies for the above three (A to C) zones. As shown in Figure 11, all of the zones considered contained faults, which can be paths of hydro-thermal ascent flow and heat transfer. These geological conditions indicate that the three zones considered have high potential for geothermal resources. Indeed, there is one hot spring, Usubetsu in zone B (Figure 11). Additionally, zone C is located in the volcanic area containing a Quaternary volcano, Oakan-dake. Although no manifestations were observed in zone A, an M 4.2 earthquake occurred within this zone on 16 April 2004, suggesting that there is a fault within the zone. Taken together, these findings demonstrate the high geothermal potential in the three zones. Consequently, use of a combination of LST anomalies detected from Landsat 8 TIRS image data by SST modeling is a practical and effective method for evaluation of geothermal potentials over a wide area.
6. Conclusions
A set of the 28,476 well-logging temperature datapoints collected from 433 sites and 13 Landsat 8 Thermal InfraRed Sensor (TIRS) images were used to clarify the extensive variability of temperatures in the upper crust and on the surface over Hokkaido in northern Japan. The Subsurface Temperature (SST) model was constructed using the dataset and a geostatistical method, Kriging with External Drift or trend (KED) while the Land Surface Temperature (LST) map was first produced using the Land Surface Emissivity (LSE) based universal algorithm by Artis et al. [33], and then transformed into the residual form by subtracting the scene average temperature to detect local thermal anomalies. Remarkable features were detected from the SST model by KED; specifically, high temperature zones were mostly located in the western region and a part of the eastern region in accordance with the distribution of Quaternary volcanoes and high heat flow, while the central region was dominated by low temperatures due to the thick cover of sedimentary rocks. Although LST is mostly controlled by Land-Use and Land-Cover (LULC), such as urban areas and topography, high temperature anomaly zones were detected in the high SST areas. These findings demonstrate the effectiveness of the combination of subsurface and surface temperatures using geostatistical spatial modeling and TIRS remote sensing for identification of zones with high potential for geothermal resources. However, the effects of heat generated by urban activity and topography should be investigated in detail in a future study. A study is currently being conducted to develop a heat flux map using the combination approach described herein.
A. Appendix
Supplementary data and codes used for this article are available on-line at the Bingwei Tian’s GitHub web page https://github.com/bwtian/TIR. The R codes and data used in this paper will be developed and maintained as an add-on package of the R statistical programming software.
Acknowledgments
The authors express their sincere thanks to NASA, USGS, JAXA and JAEA for providing Landsat 8 satellite images, LULC data and well-logging borehole data and to AIST, GSJ and MOE for free use of volcanoes data. Sincere thanks are extended to four anonymous reviewers for their valuable comments and suggestions that greatly helped to improve the clarity and quality of this manuscript.
Author Contributions
Bingwei Tian and Katsuaki Koike designed the research plan and led the development of this study. Bingwei Tian programmed the codes, processed the data and wrote the manuscript with contributions from Ling Wang, Koki Kashiwaya and Katsuaki Koike. All authors have read and approved the final manuscript.
Conflicts of Interest
The authors have no conflicts of interest to declare.
References
- Fridleifsson, I.B. Geothermal energy for the benefit of the people. Renew. Sustain. Energy Rev. 2001, 5, 299–312. [Google Scholar]
- Barbier, E. Geothermal energy technology and current status: An overview. Renew. Sustain. Energy Rev. 2002, 6, 3–65. [Google Scholar]
- Bertani, R. Geothermal power generation in the world 2005–2010 update report. Geothermics 2012, 41, 1–29. [Google Scholar]
- Asaue, H.; Koike, K.; Yoshinaga, T.; Takakura, S. Magnetotelluric resistivity modeling for 3D characterization of geothermal reservoirs in the Western side of Mt. Aso, SW Japan. J. Appl. Geophys. 2006, 58, 296–312. [Google Scholar]
- Teng, Y.; Koike, K. Three-dimensional imaging of a geothermal system using temperature and geological models derived from a well-log dataset. Geothermics 2007, 36, 518–538. [Google Scholar]
- Agemar, T.; Schellschmidt, R.; Schulz, R. Subsurface temperature distribution in Germany. Geothermics 2012, 44, 65–77. [Google Scholar]
- Hodder, D. Application of remote sensing to geothermal prospecting. Geothermics 1970, 2, 368–380. [Google Scholar]
- Urai, M. Heat discharge estimation using satellite remote sensing data on the Iwodake volcano in Satsuma-Iwojima, Japan. Earth Planets Space. 2002, 54, 211–216. [Google Scholar]
- Qin, Q.; Zhang, N.; Nan, P.; Chai, L. Geothermal area detection using Landsat ETM+ thermal infrared data and its mechanistic analysis—A case study in Tengchong, China. Int. J. Appl. Earth Observ. Geoinf. 2011, 13, 552–559. [Google Scholar]
- van der Meer, F.; Hecker, C.; Ruitenbeek, F.V.; Werff, H.V.D.; Wijkerslooth, C.D.; Wechsler, C. Geologic remote sensing for geothermal exploration : A review. Int. J. Appl. Earth Observ. Geoinf. 2014, 33, 255–269. [Google Scholar]
- Hellman, M.J.; Ramsey, M.S. Analysis of hot springs and associated deposits in Yellowstone National Park using ASTER and AVIRIS remote sensing. J. Volcanol. Geotherm. Res. 2004, 135, 195–219. [Google Scholar]
- Andres, R.J.; Rose, W.I. Remote sensing spectroscopy of volcanic plumes and clouds. Monit. Active Volcan. Strateg. Proced. Tech. 1995, 1, 301–314. [Google Scholar]
- Harris, A.J.L.; Wright, R.; Flynn, L.P. Remote monitoring of Mount Erebus volcano, Antarctica, using polar orbiters: Progress and prospects. Int. J. Remote Sens. 1999, 20, 3051–3071. [Google Scholar]
- Flynn, L.P.; Harris, A.J.L.; Wright, R. Improved identification of volcanic features using Landsat 7 ETM+. Remote Sens. Environ. 2001, 78, 180–193. [Google Scholar]
- Wang, L.; Tian, B.; Masoud, A.; Koike, K. Relationship between remotely sensed vegetation change and fracture zones induced by the 2008 Wenchuan earthquake, China. J. Earth Sci. 2013, 24, 282–296. [Google Scholar]
- Vlassova, L.; Perez-Cabello, F.; Nieto, H.; Martín, P.; Riaño, D.; de la Riva, J. Assessment of methods for land surface temperature retrieval from Landsat-5 TM images applicable to multiscale tree-grass ecosystem modeling. Remote Sens. 2014, 6, 4345–4368. [Google Scholar]
- Sobrino, J.A.; Jiménez-Muñoz, J.C.; Paolini, L. Land surface temperature retrieval from LANDSAT TM 5. Remote Sens. Environ. 2004, 90, 434–440. [Google Scholar]
- Jiménez-mu noz, J.C.; Sobrino, J.A.; Skokovi, D.; Mattar, C.; Cristóbal, J.; Bands, A.L.T. Land surface temperature retrieval methods rrom Landsat-8 thermal infrared sensor data. IEEE Geosci. Remote Sens. Lett. 2014, 11, 1840–1843. [Google Scholar]
- Yu, X.; Guo, X.; Wu, Z. Land surface temperature retrieval from Landsat 8 TIRS-comparison between radiative transfer equation-based method, split window algorithm and single channel method. Remote Sens. 2014, 6, 9829–9852. [Google Scholar]
- Kimura, G. Collision orogeny at arc-arc junctions in the Japanese Islands. Island Arc. 1996, 5, 262–275. [Google Scholar]
- Siebert, L.; Simkin, T.; Kimberly, P. Volcanoes of the World; University of California Press: Davis, CA, USA, 2010. [Google Scholar]
- Geological Survey of Japan, A. Seamless Digital Geological Map of Japan 1: 200,000 Jul 3, 2012 Version. Research Information Database DB084, Geological Survey of Japan, National Institute of Advanced Industrial Science and Technology, Available online: https://gbank.gsj.jp/seamless/index_en.html?p=download accessed on 15 May 2014.
- Minato, M.; Yagi, K.; Hunahashi, M. Geotectonic Synthesis of the Green Tuff Regions in Japan, Available online: http://repository.dl.itc.u-tokyo.ac.jp/dspace/bitstream/2261/11860/1/ji0343002.pdf accessed on 17 December 2014.
- AIST. Volcanoes of Japan, Available online: https://gbank.gsj.jp/volcano/index_e.htm accessed on 31 October 2014.
- JAEA. Temperatures Profiles in Japan, Available online: http://www.jaea.go.jp/04/tono/siryou/welltempdb.html accessed on 31 October 2014.
- Tian, B.; Koike, K. Mapping spatial variability of geothermal resource in Hokkaido Japan by combination of thermal remote sensing and borehole data, Proceedings of the 2014 IEEE International Geoscience and Remote Sensing Symposium, Quebec City, QC, Canada, 13–18 July 2014; pp. 879–882.
- Fridleifsson, I.; Bertani, R.; Huenges, E. The Possible Role and Contribution of Geothermal Energy to the Mitigation of Climate Change, Available online: http://citeseerx.ist.psu.edu/viewdoc/download?doi=10.1.1.362.1202rep=rep1type=pdfpage=75 accessed on 17 December 2014.
- NASA. What Are the Band Designations for the Landsat Satellites? Available online: http://landsat.usgs.gov/band_designations_landsat_satellites.php accessed on 17 December 2014.
- JAXA. High Resolution Land Use Land Cover Map, Available online: http://www.eorc.jaxa.jp/ALOS/lulc/lulc_jindex.htm accessed on 31 October 2014.
- Bourennane, H.; King, D.; Couturier, A. Comparison of kriging with external drift and simple linear regression for predicting soil horizon thickness with different sample densities. Geoderma 2000, 97, 255–271. [Google Scholar]
- Li, Z.L.; Tang, B.H.; Wu, H.; Ren, H.; Yan, G.; Wan, Z.; Trigo, I.F.; Sobrino, J.A. Satellite-derived land surface temperature: Current status and perspectives. Remote Sens. Environ. 2013, 131, 14–37. [Google Scholar]
- Li, Z.L. Land surface emissivity retrieval from satellite data. Int. J. Remote Sens. 2012, 34, 37–41. [Google Scholar]
- Artis, D.A.; Carnahan, W.H. Survey of emissivity variability in thennography of urban areas. Remote Sens. Environ. 1982, 329, 313–329. [Google Scholar]
- R Core Team, R: A Language and Environment for Statistical Computing; R Foundation for Statistical Computing: Vienna, Austria, 2014.
- Hijmans, R.J. Raster: Geographic Data Analysis and Modeling, Available online: http://cran.r-project.org/web/packages/raster/ accessed on 17 December 2014.
- Pebesma, E.; Bivand, R. Sp: Classes and Methods for Spatial Data, Available online: http://cran.univ-lyon1.fr/web/packages/sp/ accessed on 17 December 2014.
- Bivand, R.; Rundel, C. Rgeos: Interface to Geometry Engine-Open Source (GEOS), Available online: http://cran.r-project.org/web/packages/rgeos/index.html accessed on 17 December 2014.
- Bivand, R.; Keitt, T.; Rowlingson, B. Rgdal: Bindings for the Geospatial Data Abstraction Library, Available online: http://cran.univ-lyon1.fr/web/packages/rgdal/ accessed on 17 December 2014.
- Greenberg, J.A.; Mattiuzzi, M. gdalUtils: Wrappers for the Geospatial Data Abstraction Library (GDAL) Utilities, Available online: http://rjournal.github.io/archive/2014-1/RJ-2014-1.pdfpage=186 accessed on 17 December 2014.
- Goslee, S. Landsat: Radiometric and Topographic Correction of Satellite Imagery, Available online: http://artax.karlin.mff.cuni.cz/r-help/library/landsat/html/00Index.html accessed on 17 December 2014.
- Zvoleff, A. Wrspathrow: Functions for Working with Worldwide Reference System (WRS), Available online: http://rpackages.ianhowson.com/cran/wrspathrow/ accessed on 17 December 2014.
- Pebesma, E.; Graeler, B. Gstat: Spatial and Spatio-Temporal Geostatistical Modelling, Prediction and Simulation, Available online: http://artax.karlin.mff.cuni.cz/r-help/library/gstat/html/00Index.html accessed on 17 December 2014.
- Bivand, R.; Lewin-Koh, N. Maptools: Tools for Reading and Handling Spatial Objects, Available online: http://lojze.lugos.si/darja/software/r/library/maptools/html/00Index.html accessed on 17 December 2014.
- Wickham, H.; Chang, W. ggplot2: An Implementation of the Grammar of Graphics, Available online: http://ftp.auckland.ac.nz/software/CRAN/src/contrib/Descriptions/ggplot.html accessed on 17 December 2014.
- Kahle, D.; Wickham, H. ggmap: A package for spatial visualization with Google Maps and OpenStreetMap, Available online: http://artax.karlin.mff.cuni.cz/r-help/library/ggmap/html/00Index.html accessed on 17 December 2014.
- Perpinan Lamigueiro, O.; Hijmans, R. rasterVis: Visualization Methods for the Raster Package, Available online: http://rpackages.ianhowson.com/cran/rasterVis/ accessed on 17 December 2014.
- Tian, B. TIR: A Package for Thermal Infrared Remote Sensing Data Analysis and Mapping, Available online: https://github.com/bwtian/TIR accessed on 17 December 2014.
- Tanaka, A.; Yamano, M.; Yano, Y.; Sasada, M. Geothermal gradient and heat flow data in and around Japan(I): Appraisal of heat flow from geothermal gradient data. Earth Planets Space. 2004, 56, 1191–1194. [Google Scholar]
- Tanaka, A. Geothermal gradient and heat flow data in and around Japan (II ): Crustal thermal structure and its relationship to seismogenic layer. Earth Planets Space. 2004, 56, 1195–1199. [Google Scholar]
- Srivastava, P.K.; Majumdar, T.J.; Bhattacharya, A.K. Surface temperature estimation in Singhbhum Shear Zone of India using Landsat-7 ETM+ thermal infrared data. Adv. Space Res. 2009, 43, 1563–1574. [Google Scholar]
- Ehara, S. Terrestrial heat flow in Hokkaido, Japan: Preliminary report. J. Faculty Sci. Hokkaido Univ. Ser. Geophys. 1972, 3, 443–460. [Google Scholar]
- Banno, S.; Nakajima, T. Metamorphic belts of Japanese islands. Ann. Rev. Earth Planet. Sci. 1992, 20, 159–179. [Google Scholar]
- Kametani, T.; Yoshimura, Y. Geophysical history of Ishikari region. Geophys. Explor. 1964, 17, 72–81. [Google Scholar]
- Guo, W.; Sun, S. Preliminary study on the effects of soil thermal anomaly on land surface energy budget. Acta Meteorol. Sin. 2002, 6, 706–714. [Google Scholar]
- Mareschal, J.; Hamdani, Y.; Jessup, D. Downward continuation of heat flow data. Tectonophysics 1989, 164, 129–137. [Google Scholar]


| Landsat 8 Identifier | Acquisition | Cloud Cover(%) | Sun Elevation (°) | Sun Azimuth (°) |
|---|---|---|---|---|
| LC81050292014153LGN00 | 2014-06-02 | 0.37 | 63.11 | 139.90 |
| LC81050302014153LGN00 | 2014-06-02 | 0.34 | 63.98 | 137.30 |
| LC81060292014176LGN00 | 2014-06-25 | 1.27 | 63.64 | 136.50 |
| LC81060302013189LGN00 | 2013-07-08 | 5.85 | 63.65 | 134.81 |
| LC81060312013189LGN00 | 2013-07-08 | 0.38 | 64.42 | 132.03 |
| LC81070282013292LGN00 | 2013-10-19 | 0.26 | 32.76 | 163.35 |
| LC81070292013292LGN00 | 2013-10-19 | 2.66 | 34.03 | 162.60 |
| LC81070302013292LGN00 | 2013-10-19 | 2.11 | 35.30 | 161.83 |
| LC81070312014119LGN00 | 2014-04-29 | 0.56 | 58.22 | 143.23 |
| LC81080282013283LGN00 | 2013-10-10 | 0.40 | 35.91 | 161.91 |
| LC81080292014078LGN00 | 2014-03-19 | 10.06 | 41.32 | 151.96 |
| LC81080302014110LGN00 | 2014-04-20 | 3.85 | 54.40 | 146.81 |
| LC81080312014110LGN00 | 2014-04-20 | 1.45 | 55.43 | 145.09 |
| LULC Code [29] | LULC Category | Emissivity(ε) | Color in Figure 6 |
|---|---|---|---|
| 1 | Water | 0.99 | darkblue |
| 2 | Urban area | 0.93 | red |
| 3 | Paddy field | 0.96 | skyblue |
| 4 | Crop field | 0.95 | yellow |
| 5 | Grass land | 0.96 | yellowgreen |
| 6 | Deciduous forest | 0.97 | springgreen |
| 8 | Evergreen forest | 0.98 | forestgreen |
| 10 | Bare land | 0.92 | saddlebrown |
| 11 | Snow and ice | 0.91 | white |
© 2015 by the authors; licensee MDPI, Basel, Switzerland This article is an open access article distributed under the terms and conditions of the Creative Commons Attribution license (http://creativecommons.org/licenses/by/4.0/).
Share and Cite
Tian, B.; Wang, L.; Kashiwaya, K.; Koike, K. Combination of Well-Logging Temperature and Thermal Remote Sensing for Characterization of Geothermal Resources in Hokkaido, Northern Japan. Remote Sens. 2015, 7, 2647-2667. https://doi.org/10.3390/rs70302647
Tian B, Wang L, Kashiwaya K, Koike K. Combination of Well-Logging Temperature and Thermal Remote Sensing for Characterization of Geothermal Resources in Hokkaido, Northern Japan. Remote Sensing. 2015; 7(3):2647-2667. https://doi.org/10.3390/rs70302647
Chicago/Turabian StyleTian, Bingwei, Ling Wang, Koki Kashiwaya, and Katsuaki Koike. 2015. "Combination of Well-Logging Temperature and Thermal Remote Sensing for Characterization of Geothermal Resources in Hokkaido, Northern Japan" Remote Sensing 7, no. 3: 2647-2667. https://doi.org/10.3390/rs70302647