Retrievals of All-Weather Daily Air Temperature Using MODIS and AMSR-E Data

Abstract
: Satellite optical-infrared remote sensing from the Moderate Resolution Imaging Spectroradiometer (MODIS) provides effective air temperature (Ta) retrieval at a spatial resolution of 5 km. However, frequent cloud cover can result in substantial signal loss and remote sensing retrieval error in MODIS Ta. We presented a simple pixel-wise empirical regression method combining synergistic information from MODIS Ta and 37 GHz frequency brightness temperature (Tb) retrievals from the Advanced Microwave Scanning Radiometer for the Earth Observing System (AMSR-E) for estimating surface level Ta under both clear and cloudy sky conditions in the United States for 2006. The instantaneous Ta retrievals showed favorable agreement with in situ air temperature records from 40 AmeriFlux tower sites; mean R2 correspondence was 86.5 and 82.7 percent, while root mean square errors (RMSE) for the Ta retrievals were 4.58 K and 4.99 K for clear and cloudy sky conditions, respectively. Daily mean Ta was estimated using the instantaneous Ta retrievals from day/night overpasses, and showed favorable agreement with local tower measurements (R2 = 0.88; RMSE = 3.48 K). The results of this study indicate that the combination of MODIS and AMSR-E sensor data can produce Ta retrievals with reasonable accuracy and relatively fine spatial resolution (∼5 km) for clear and cloudy sky conditions.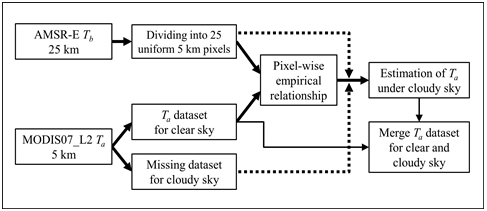
1. Introduction
Surface air temperature (Ta), which is defined as the measurement at the height of ∼2 m above ground in the standard weather (or meteorological) stations, is an important index of terrestrial environmental conditions [1], and plays a major role in applied meteorology and climatology [2]. Ta is an atmospheric Essential Climate Variable (ECV) [3] and key metric for gauging global climate warming at local, regional and global scales [4]. Ta is also major control on terrestrial biophysical processes, including plant photosynthesis, respiration, and evapotranspiration. Therefore, accurate monitoring of Ta is a fundamental prerequisite for assessing and understanding the biosphere response to a changing climate. However, characterizing the spatial distribution of Ta from sparse weather station observation networks is constrained over large areas due to measurement inconsistencies and bias, uncertainties involving landscape extrapolation and spatial interpolation of point measurements, and the representativeness of the station observation network [1,2,5].
Satellite remote sensing provides for spatially contiguous daily Ta monitoring from local to global scales. Various methods for estimating Ta from satellite optical-IR and passive microwave remote sensing have been widely implemented since the 1990s [1,2,6–13]. Satellite remote sensing estimation methods for Ta can be broadly classified as: (1) exploiting relationships between optical-infrared retrievals of land surface “skin” temperature (LST) and spectral vegetation indices such as the normalized difference vegetation index (NDVI) [1,11,14,15]; (2) exploiting relationships between LST and Ta [16–21]; (3) the use of infrared soundings of atmospheric temperatures [22,23]; (4) the use of lower frequency (≤37 GHz) brightness temperatures (Tb) and surface emissivities from passive microwave radiometry [7,24–27].
Satellite microwave remote sensing enables land surface observations under cloudy conditions and has been used for effective Ta retrieval. Previous studies have reported strong linear relationships between Ta and Tb for various regions and land cover types [24,26–28], especially at the 37 GHz frequency. The Tb at higher (e.g., 37 GHz) frequencies is equal to the physical temperature multiplied by the land surface emissivity, following the Rayleigh-Jeans approximation [24,29]. However, surface emissivity is sensitive to land surface properties and is difficult to quantify, though global land parameter records, including Ta, have been developed from satellite multi-frequency daily Tb observations and provide reasonable accuracy and consistency [27,30]. However, Ta derived from passive microwave remote sensing has a relatively coarse (∼12–25 km) spatial resolution needed to increase sensor signal-to-noise for detecting low-level land surface microwave emissions.
In contrast, satellite optical-infrared remote sensing provides for Ta retrievals at relatively finer spatial scales. A global operational Ta product is currently produced from MODIS infrared (IR) spectral channels [8]. The MODIS07_L2 atmosphere profiles product covers the entire globe at 1–2 day intervals, and produces various atmosphere variables, including Ta, at 5 km spatial resolution. The temperature variables derived from MODIS07_L2 product have been widely used to estimate surface radiation budget parameters, evapotranspiration, and plant productivity in previous applications [31–38]. However, the MODIS IR and temperature retrievals are significantly degraded by atmosphere aerosol, smoke and cloud cover contamination, which hampers terrestrial monitoring applications. For this reason, many applications based on MODIS data tend to be restricted to clear-sky conditions. Previous studies have been conducted to fill resulting Ta retrieval gaps using ancillary meteorological data [16,36,38]. However, most applications have used global scale meteorological data having coarse spatial resolution (approximately 100 km), which may be lead to uncertainties for terrestrial ecosystem monitoring applications at local to regional scales [38]. Nevertheless, global gap-filling methods commensurate with the 5 km resolution of the MODIS Ta retrievals are lacking.
In this study, we investigated a method for estimating Ta at a relatively fine spatial resolution by integrating synergistic information from satellite optical-IR and passive microwave remote sensing, and considering data continuity and local to regional scale applications. Our objective was to estimate Ta at the surface level under clear and cloudy sky conditions primarily using the NASA EOS Aqua MODIS07_L2 product. The Ta retrievals were directly derived from the MODIS07_L2 product (i.e., MYD07) under clear sky conditions, while Ta was estimated under cloudy conditions using a pixel-wise regression model developed between MODIS07_L2 Ta and 37 GHz frequency, vertically polarized Tb retrievals (Tb,37v) from AMSR-E. Both MODIS and AMSR-E are co-located on the same Aqua satellite platform, with simultaneous data acquisitions and global coverage with consistent local 1:30 PM/AM ascending and descending orbit equatorial crossings. We also estimated mean daily Ta using the gap-filled daytime and nighttime Ta retrievals, because daily Ta can be more useful for the ecological and agricultural applications than instantaneous Ta acquired during the Aqua satellite overpasses.
2. Datasets and Methods
2.1. Study Sites and Data Collection
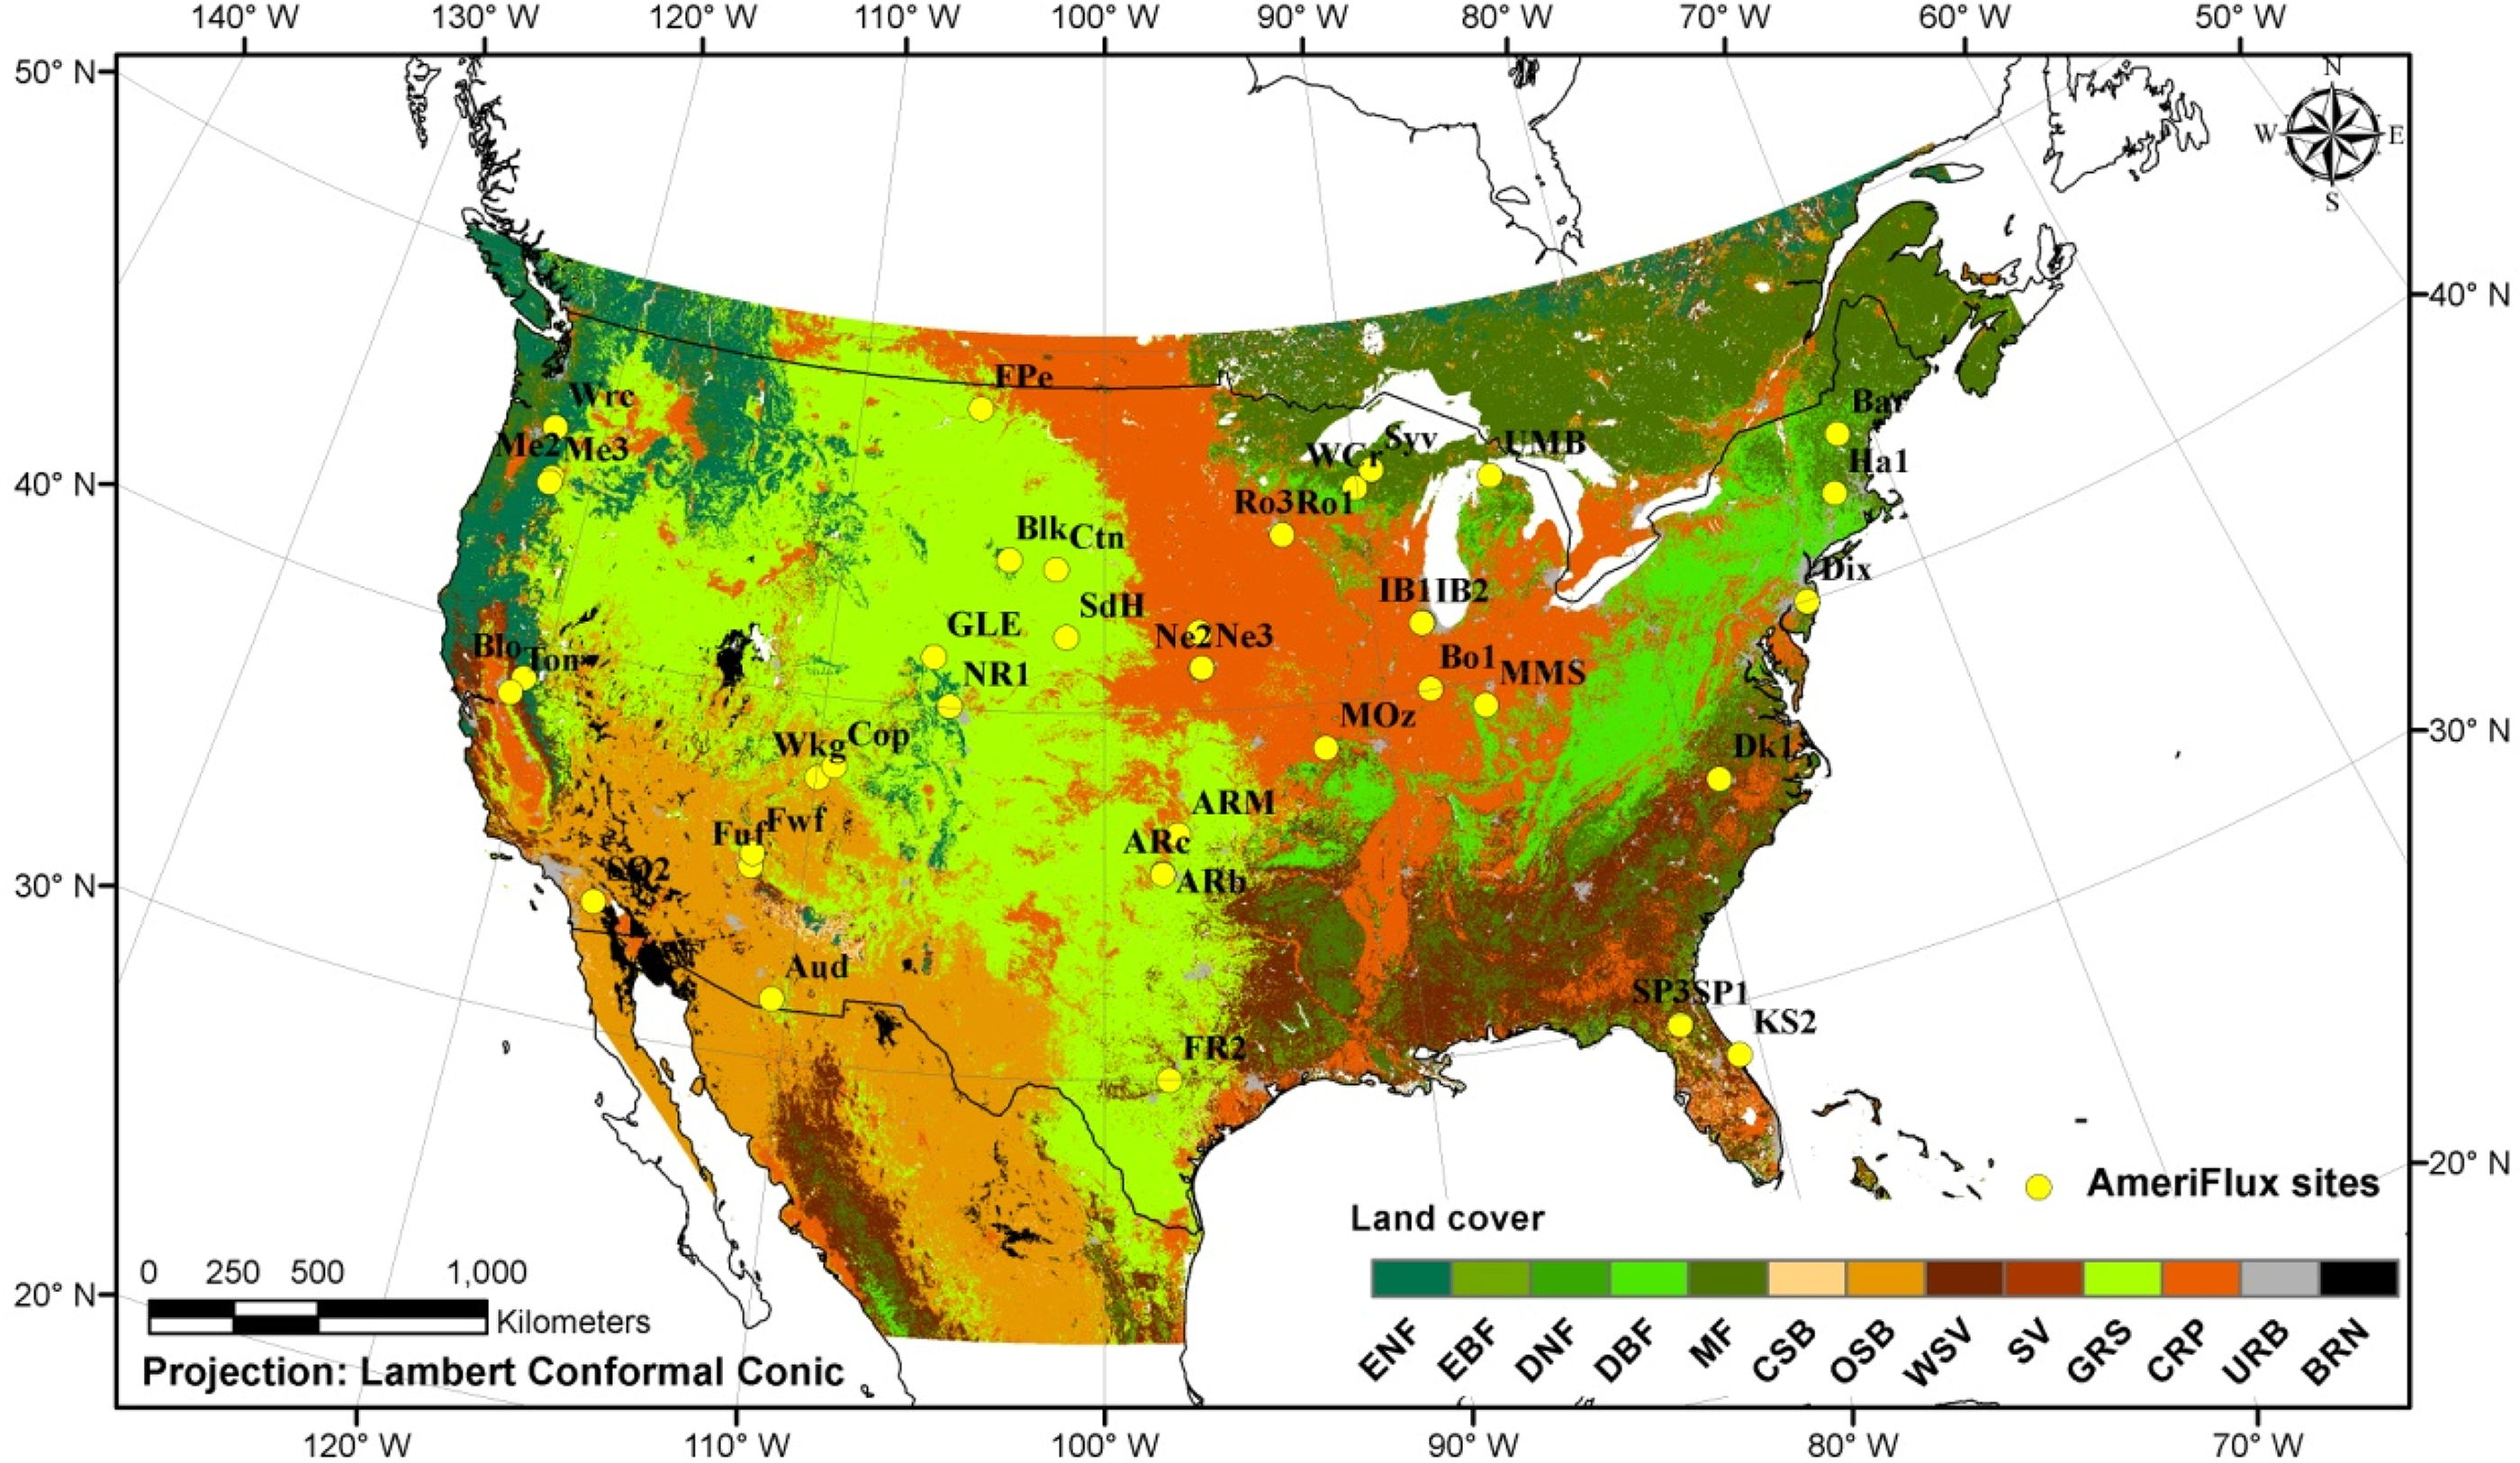
The domain of this investigation was the conterminous United States (US), which encompasses a broad range of ecological and climatic conditions (Figure 1). Level 2 half-hourly and hourly in situ air temperature measurement records were collected from the AmeriFlux tower monitoring network (Available online: http://public.ornl.gov/ameriflux/), and 40 tower sites within the US domain were selected to validate the satellite Ta retrievals (see Figure 1 and Table 1). The tower validation sites encompass the major regional climate and vegetation types, including evergreen needleleaf forest (ENF), deciduous broadleaf forest (DBF), mixed evergreen and deciduous forest (MF), woody savanna (WSV), closed shrubland (CSH), grassland (GRS) and cropland (CRP), indicated from the MODIS12Q1 the University of Maryland (UMD) global land cover classification [39]. The elevations of the selected tower validation sites vary from 6 to 3050 m above mean sea level, while additional tower site information is summarized in Table 1.
2.2. Estimation of Ta for Cloudy Sky Conditions
MODIS provides useful information for Ta (hereafter MODIS Ta) globally and with relative fine spatial resolution (5 km), though these data are largely limited to clear sky conditions [8]. This study presents a method to fill data gaps for continuous Ta monitoring by integrating satellite optical-IR and passive microwave remote sensing using pixel-wise empirical regression model relationships between MODIS Ta and AMSR-E Tb,37v retrievals to estimate Ta under cloudy conditions. Previous studies have reported strong correlations between surface air and land surface temperatures measured by ground stations and microwave Tb,37v [24,26–28,40]. The 37 GHz frequency Tb retrievals from AMSR-E are relatively insensitive to atmospheric effects, including cloud cover. Furthermore, the vertically polarized Tb is less affected by surface emissivity and atmospheric variations [26,27,41,42], and hence it should be applicable for the near-surface Ta estimation.
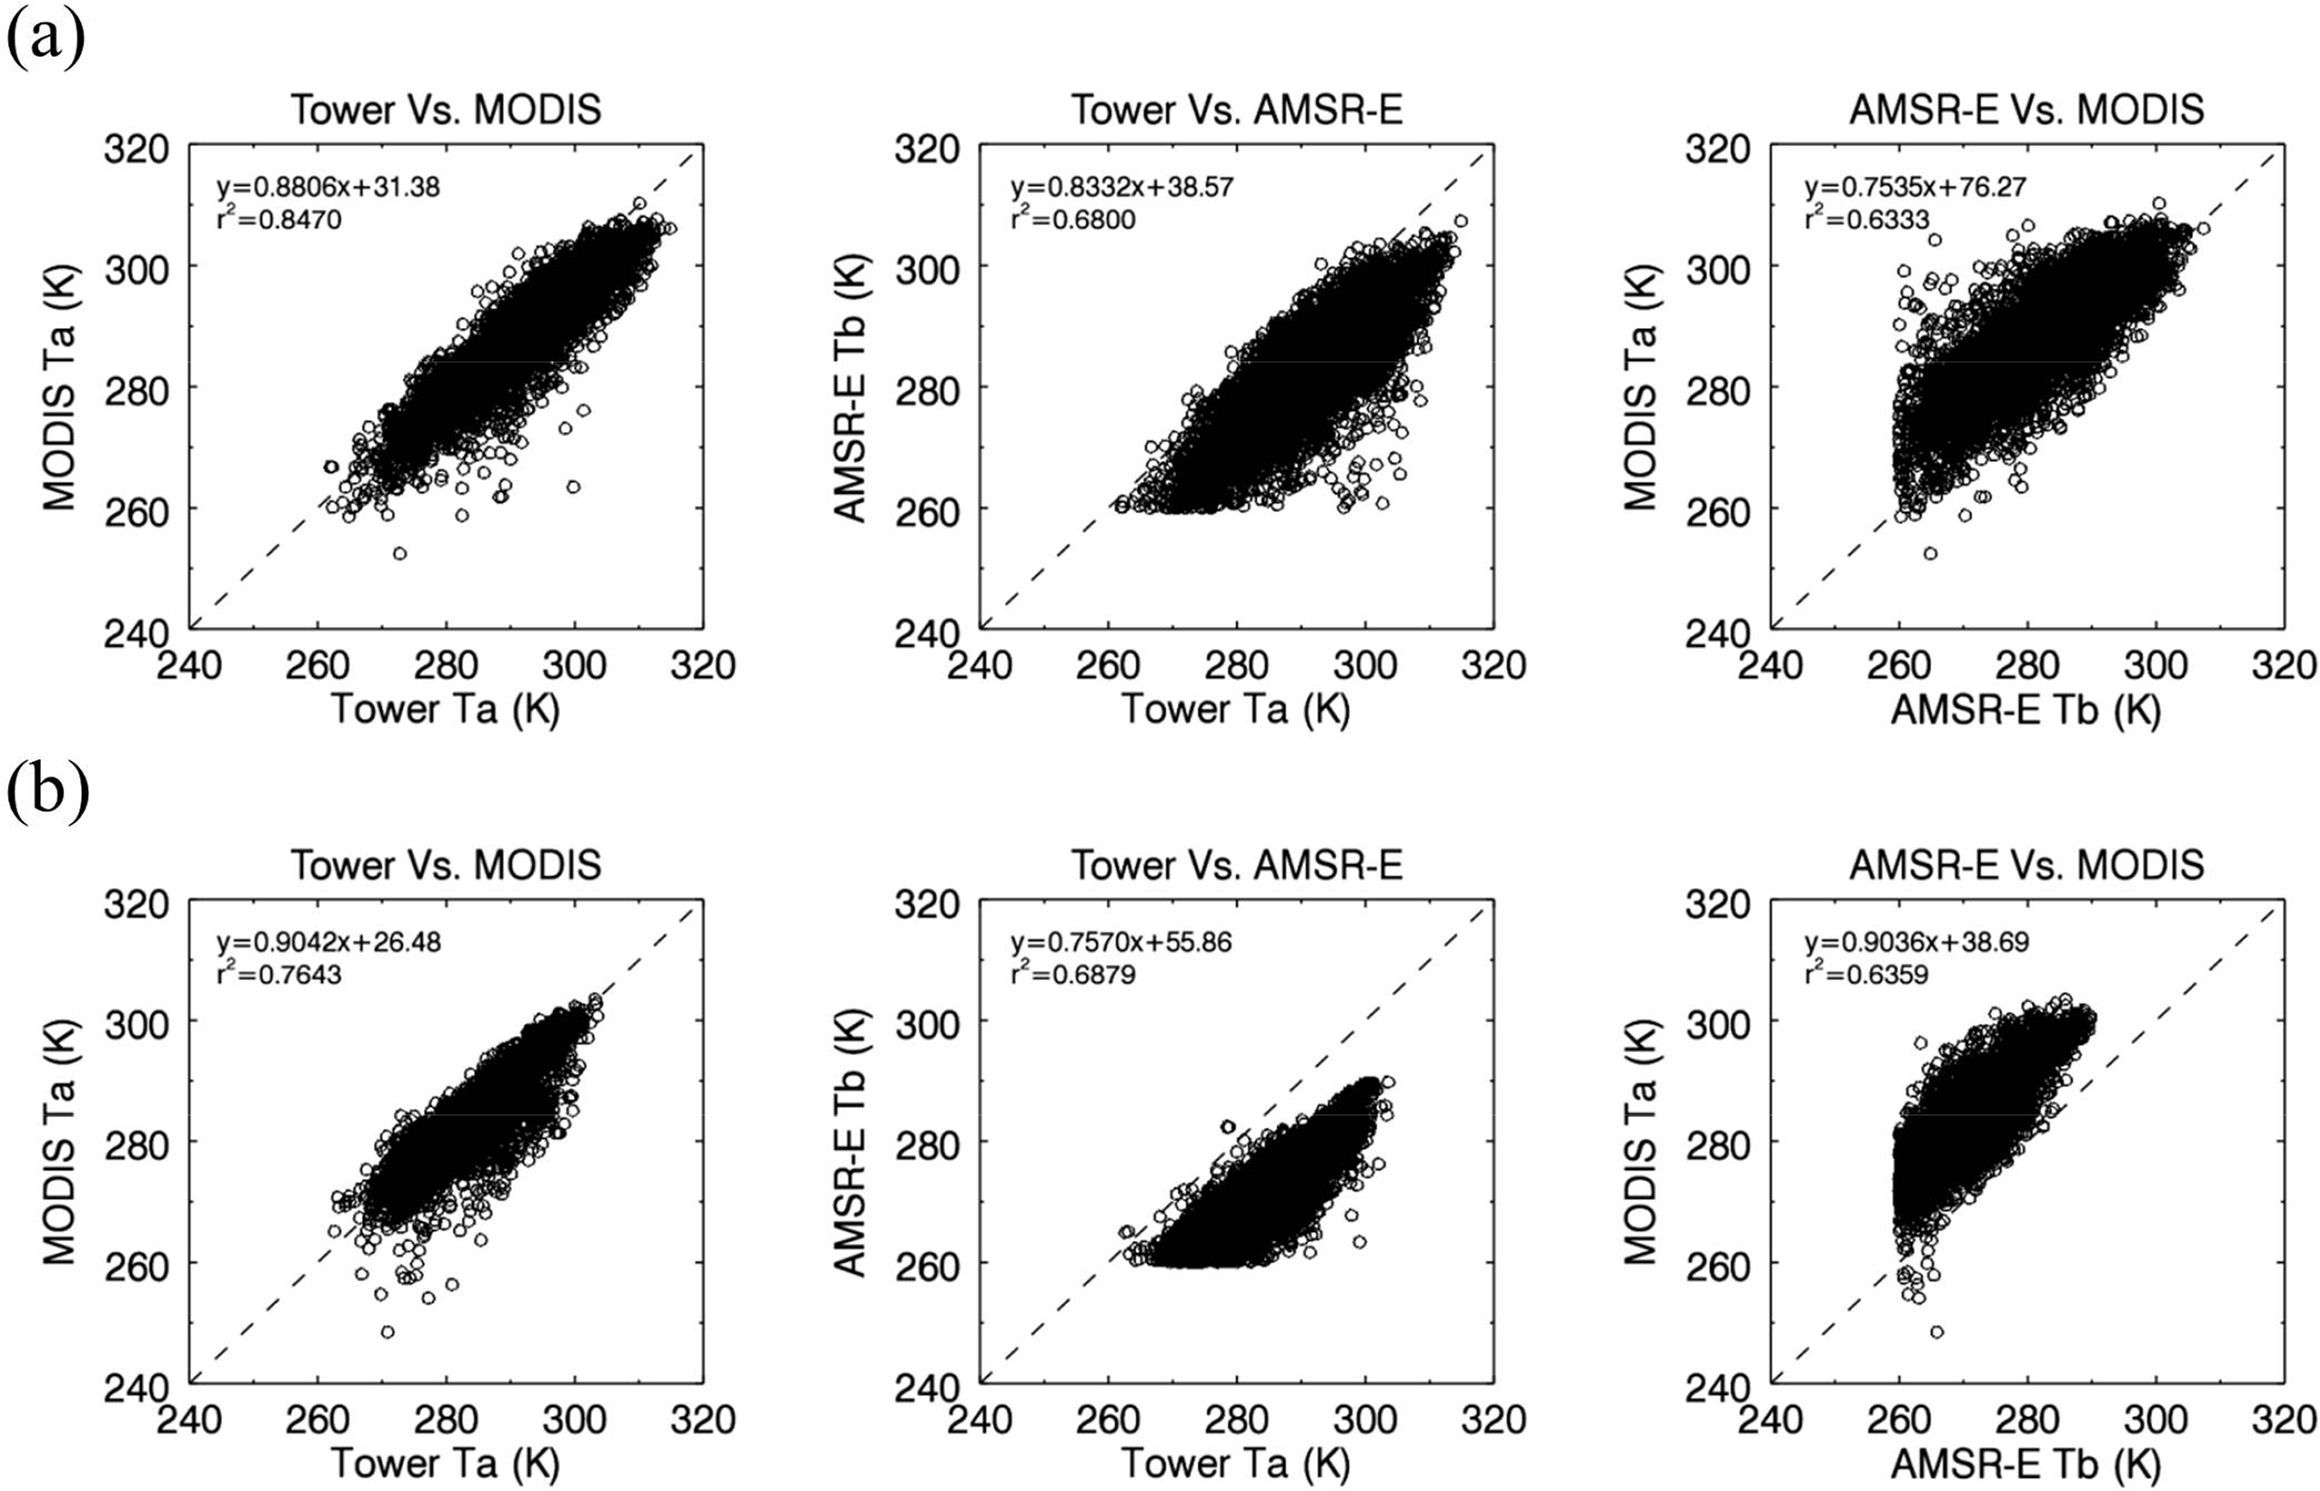
The regression method is simple and feasible to estimate Ta using the relationship between Ta and Tb,37v. We checked the relationships between coincident Ta from MODIS07_L2, Tb,37v from AMSR-E, and in situ Ta measurements from the 40 AmeriFlux tower validation sites for the daytime and nighttime Aqua satellite overpasses. AMSR-E Tb,37v was selected for unfrozen conditions exceeding 259.8 K, which marks the general threshold between frozen and unfrozen land surface conditions [26]. The scatterplot relationships between MODIS Ta, AMSR-E Tb,37v, and tower air temperatures under clear sky conditions in 2006 are summarized in Figure 2. Both MODIS Ta and AMSR-E Tb,37v show favorable relationships with the local tower observations. The MODIS Ta results show favorable accuracy with strong correspondence (R2 > 0.7643) and mean residual biases of −3.58 K and −0.08 K for daytime and nighttime overpasses, respectively. The MODIS Ta and AMSR-E Tb,37v results also show favorable R2 correspondences exceeding 63%, despite the effect of other environmental factors, such surface moisture variability, influencing the Tb,37v temperature sensitivity; these relationships also show substantial positive bias of +6.65 K and +12.54 K for respective daytime and nighttime conditions. The positive Ta bias relative to Tb,37v reflects the lower microwave emissivity of natural landscapes relative to a theoretical black body. Although the comparison between MODIS Ta and AMSR-E Tb,37v showed large bias at all sites, the high R2 correspondences were found at the individual sites ranging from 0.7647 to 0.9438. It provides the potential to establish the relatively simple empirical linear regression relationships at the pixel level between MODIS Ta and AMSR-E Tb,37v.
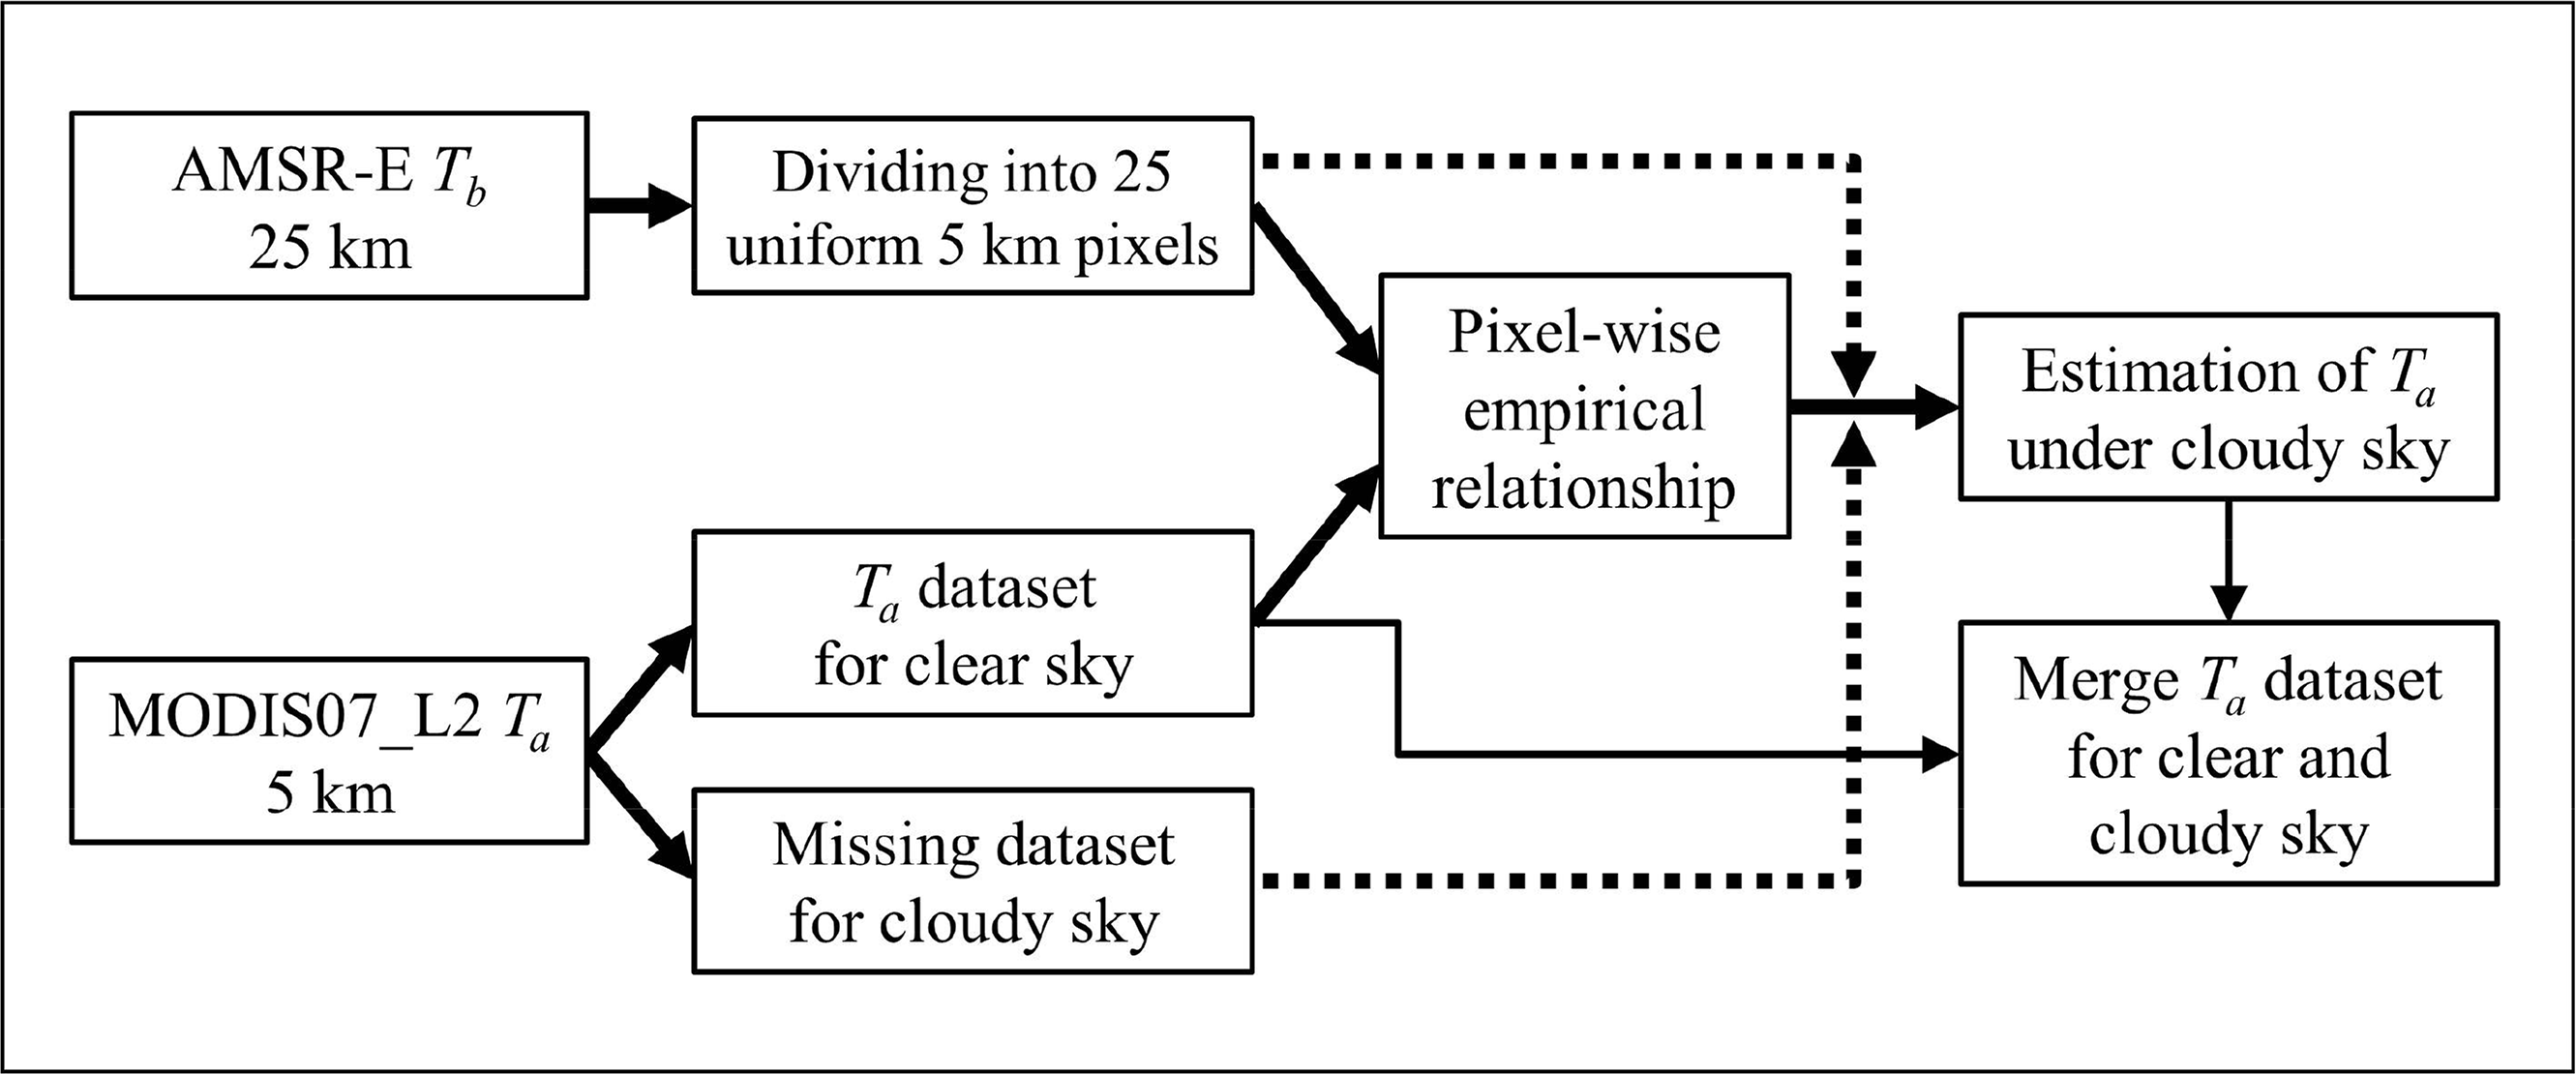
In this study, the gap-filling plan for estimating MODIS Ta under cloudy sky conditions was designed on the basis of the results from the relationships between MODIS Ta and AMSR-E Tb,37v. Figure 3 shows the conceptual processing flow for the gap-filling of MODIS Ta for cloudy sky conditions using pixel-wise empirical relationships developed between 5 km MODIS (MODIS07_L2) Ta for clear sky conditions and coincident 25 km Tb,37v values from the overlying AMSR-E grid cell. AMSR-E Tb was divided into homogenous 25 subgrid cells over 25 km grid cell. The linear regression relationships between AMSR-E Tb,37v and MODIS Ta were obtained at each pixel, and the regression functions were applied to estimate MODIS Ta under cloudy conditions defined from the MODIS07_L2 Quality Control (QC) information. The satellite-based continuous Ta estimation was obtained by merging Ta datasets for clear (i.e., MODIS Ta) and cloudy (i.e., gap-filled Ta) sky conditions. The simple regression development and application approach were applied separately to the day and nighttime overpass data, respectively.
2.3. Daily Ta Estimation
Daily scale Ta is generally more useful for ecological and agricultural applications than instantaneous day and nighttime overpass Ta retrievals. In this study, daily Ta was derived by averaging estimated daily Ta maxima and minima derived from the respective gap filled ascending orbit and descending orbit satellite overpass temperature retrievals. The overpass time of the Aqua satellite carrying the MODIS and AMSR-E sensors is close to the period of daily Ta maxima and minima. The local time (LT) of these overpasses at the study sites ranged from 13:00 to 15:00 LT (ascending orbit), and from 1:00 to 3:00 LT (descending orbit). The daily maximum Ta (Ta_max) generally occurs around 15:00 LT, and the daily minimum Ta (Ta_min) occurs before sunrise. The Ta_max and Ta_min retrievals were calibrated by subtracting the biases derived from the tower measurement site comparisons. The day and nighttime Ta measurements from the tower data were separated using local downward solar shortwave radiation measurements (Rsd, W m−2). Tower Ta measurements with corresponding Rsd values above and below a 5 W m−2 threshold were separated into day and nighttime data sets, respectively. If Rsd was not available from the tower measurement records, daytime conditions were assumed to be within 08:00 and 19:00 LT. Daily mean Ta (Ta_mean) was calculated from the tower measurements when the number of successful measurement intervals exceeded 40 per day for the integrated half-hourly data records and 20 per day for hourly data records, respectively.
2.4. Satellite Remote Sensing Data
In this study, synergistic MODIS and AMSR-E data records were used to estimate Ta under both clear and cloudy sky conditions. The operation of both sensors on board the same satellite platform facilitates co-located retrievals and consistent overpass time acquisitions. The MODIS Collection 5 atmosphere profile product (hereafter, MYD07_L2) produces the profiles of atmospheric temperature and moisture, atmospheric water vapor and stability, surface air pressure, and total ozone burden. The global profiles of atmospheric temperature (Ta) that used in this study is produced to 20 vertical atmospheric pressure levels using a statistical regression retrieval algorithm with the several MODIS spectral bands ranging from bands 24 (4465 nm) to 36 (14,235 nm), and excluding band 26 [8,25]. The MYD07_L2 parameters were derived for day and nighttime overpasses with 5 km pixel resolution from the lowest valid layer among 20 vertical levels under clear and partial clear sky conditions. The sky condition was determined by the number of clear atmosphere pixels (ClearPix) indicated from the accompanying cloud mask QC information ranging from 0 to 25 and derived from the MYD07_L2 1 km resolution data (i.e. 25 pixels within 5 km pixel). A ClearPix value of 25 indicates completely clear sky conditions within a given 5 km pixel and overpass time. If a ClearPix value is less than 5, the MYD_L2 retrievals are not derived due to severely cloudy conditions.
The AMSR-E Level 2A product contains the brightness temperatures at six frequencies (6.9, 10.7, 18.7, 23.8, 36.5, and 89.0 GHz) [43,44]. The vertically polarized Tb record at 36.5 GHz frequency (Ka band) and 55° incidence angle was used for this study and denoted as 37 GHz (Tb,37v). The Tb,37v data is projected to the Equal Area Scalable Earth (EASE) Grid [45] with 25 km spatial resolution. In this study, the AMSR-E Tb,37v record was obtained from the National Snow and Ice Data Center (NSIDC) [46]. The AMSR-E data record provides global coverage at 1–3 day intervals; gaps in the Tb,37v daily ascending and descending orbital time series were filled through temporal linear interpolation of adjacent Tb retrievals [47].
3. Results
3.1. Validation of Ta Retrievals
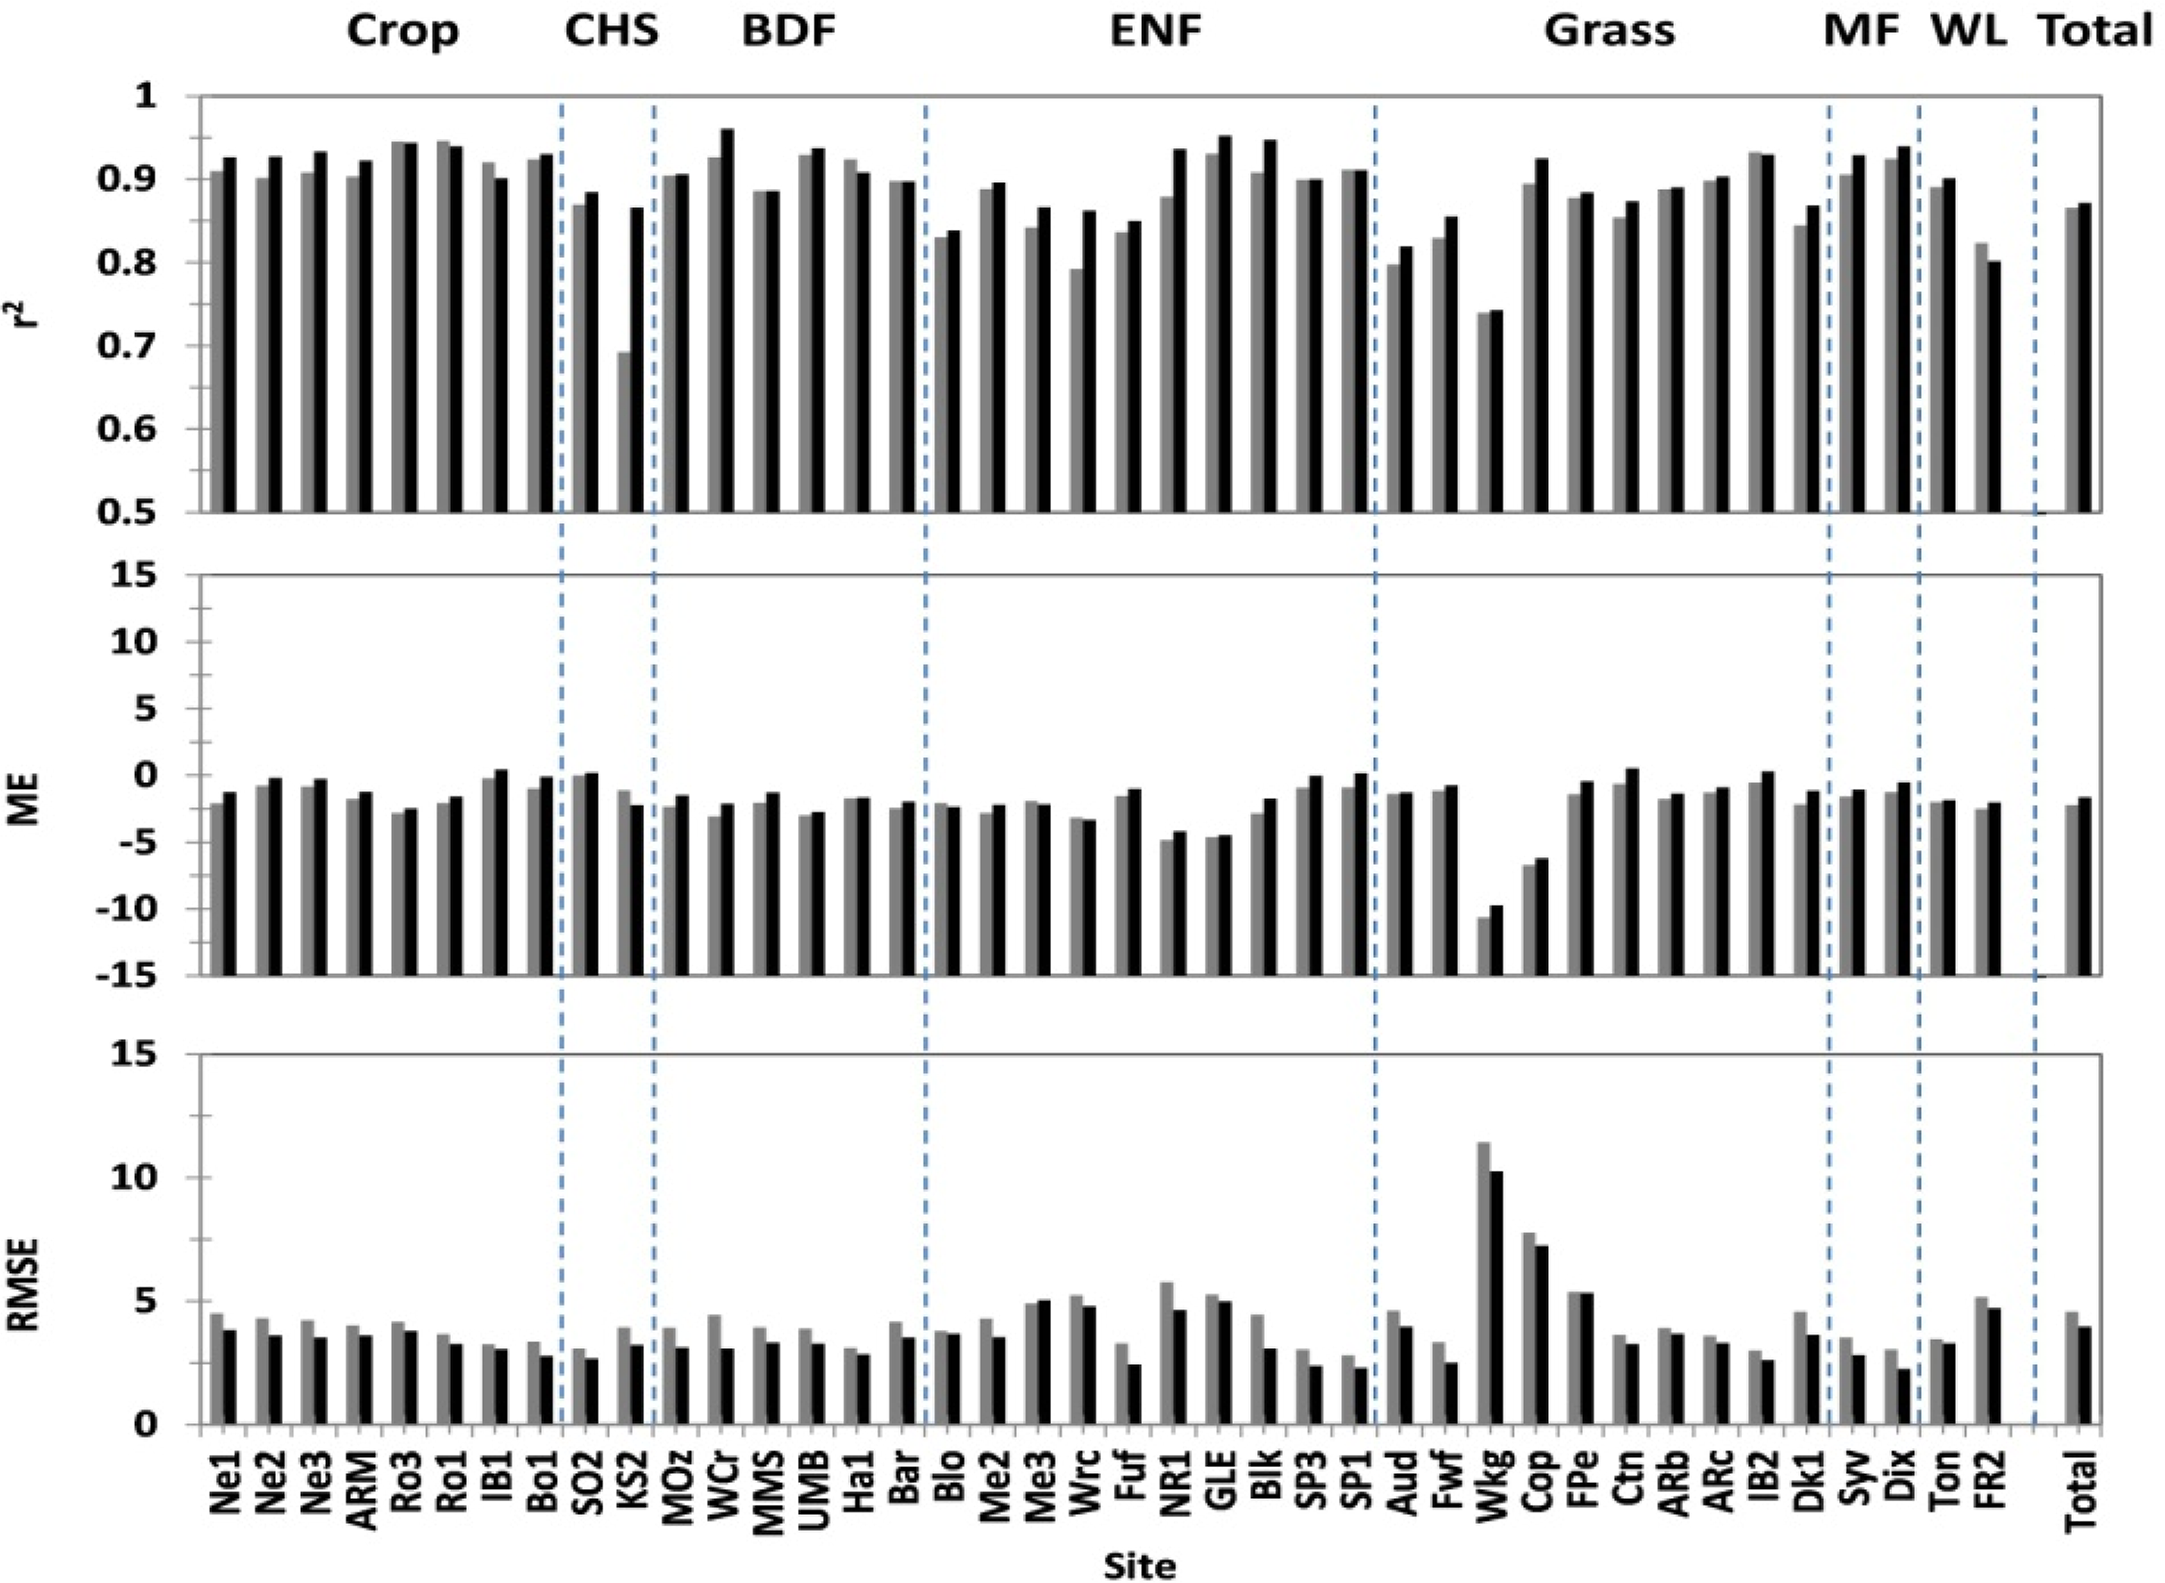
The relationships between satellite estimated Ta and corresponding tower measurements at the 40 AmeriFlux validation sites is summarized in Figure 4; gray and black bars in the figure indicate respective partial clear sky (ClearPix ≥ 5) and clear sky (ClearPix = 25) conditions. The MYD07_L2 instantaneous Ta records under clear and partial clear sky conditions (ClearPix ≥ 5) showed favorable agreement with the coincident tower validation site measurements for the 2006 study period. There were generally strong (R2 > 80.0%) linear associations between MODIS and tower Ta site comparisons, except for the KS2 (69.26%), Wrc (79.26%), Aud (79.77%), and Wkg (73.96%) sites. The MYD07_L2 Ta results generally underestimated tower measured temperatures at all sites; the mean residual error (ME) ranged from −0.01 (SO2) to −10.65 (Wkg) K; root mean square error (RMSE) differences ranged from 3.00 to 5.00 K, excluding the FR2 (5.17 K), Wrc (5.24 K), GLE (2.77 K), Cop (7.78 K) and Wkg (11.43 K) sites. The R2 correspondence, ME, and RMSE describing the overall relationship between the satellite retrievals and in situ tower Ta measurements were 86.58% (n = 12,285), −2.22, and 4.57 K, respectively, across all AmeriFlux sites.
For clear sky conditions (ClearPix = 25), the R2 correspondence between MODIS Ta and tower temperature observations was generally larger (87.17%) and associated errors were lower (i.e., ME = −1.63 K; RMSE = 3.98 K) across all sites (denoted as white circles in Figure 4). The highest and lowest correspondence under the clear sky conditions occurred at the Ro1 site (R2 = 96.04%) and Wkg site (R2 = 74.28%), respectively. For the KS2 site, the R2 correspondence increased from 69.26% under partial clear sky conditions to 86.59% under clear sky conditions. The ME and RMSE differences at the individual sites ranged from −9.72 (Wkg) to +0.54 (Ctn) K and from 2.26 (Dix) to 10.27 (Wkg) K, respectively. The RMSE values for the Wkg (10.27 K) and Cop (7.26 K) sites were higher than other sites (RMSE < 5.00 K) under clear-sky conditions. The number of Ta retrievals from MODIS under perfect clear-sky conditions was 6219 across all sites, which represented nearly half (50.6%) of the total retrievals for 2006 relative to partial clear sky conditions.
3.2. Estimation of Ta under Cloudy Sky Conditions
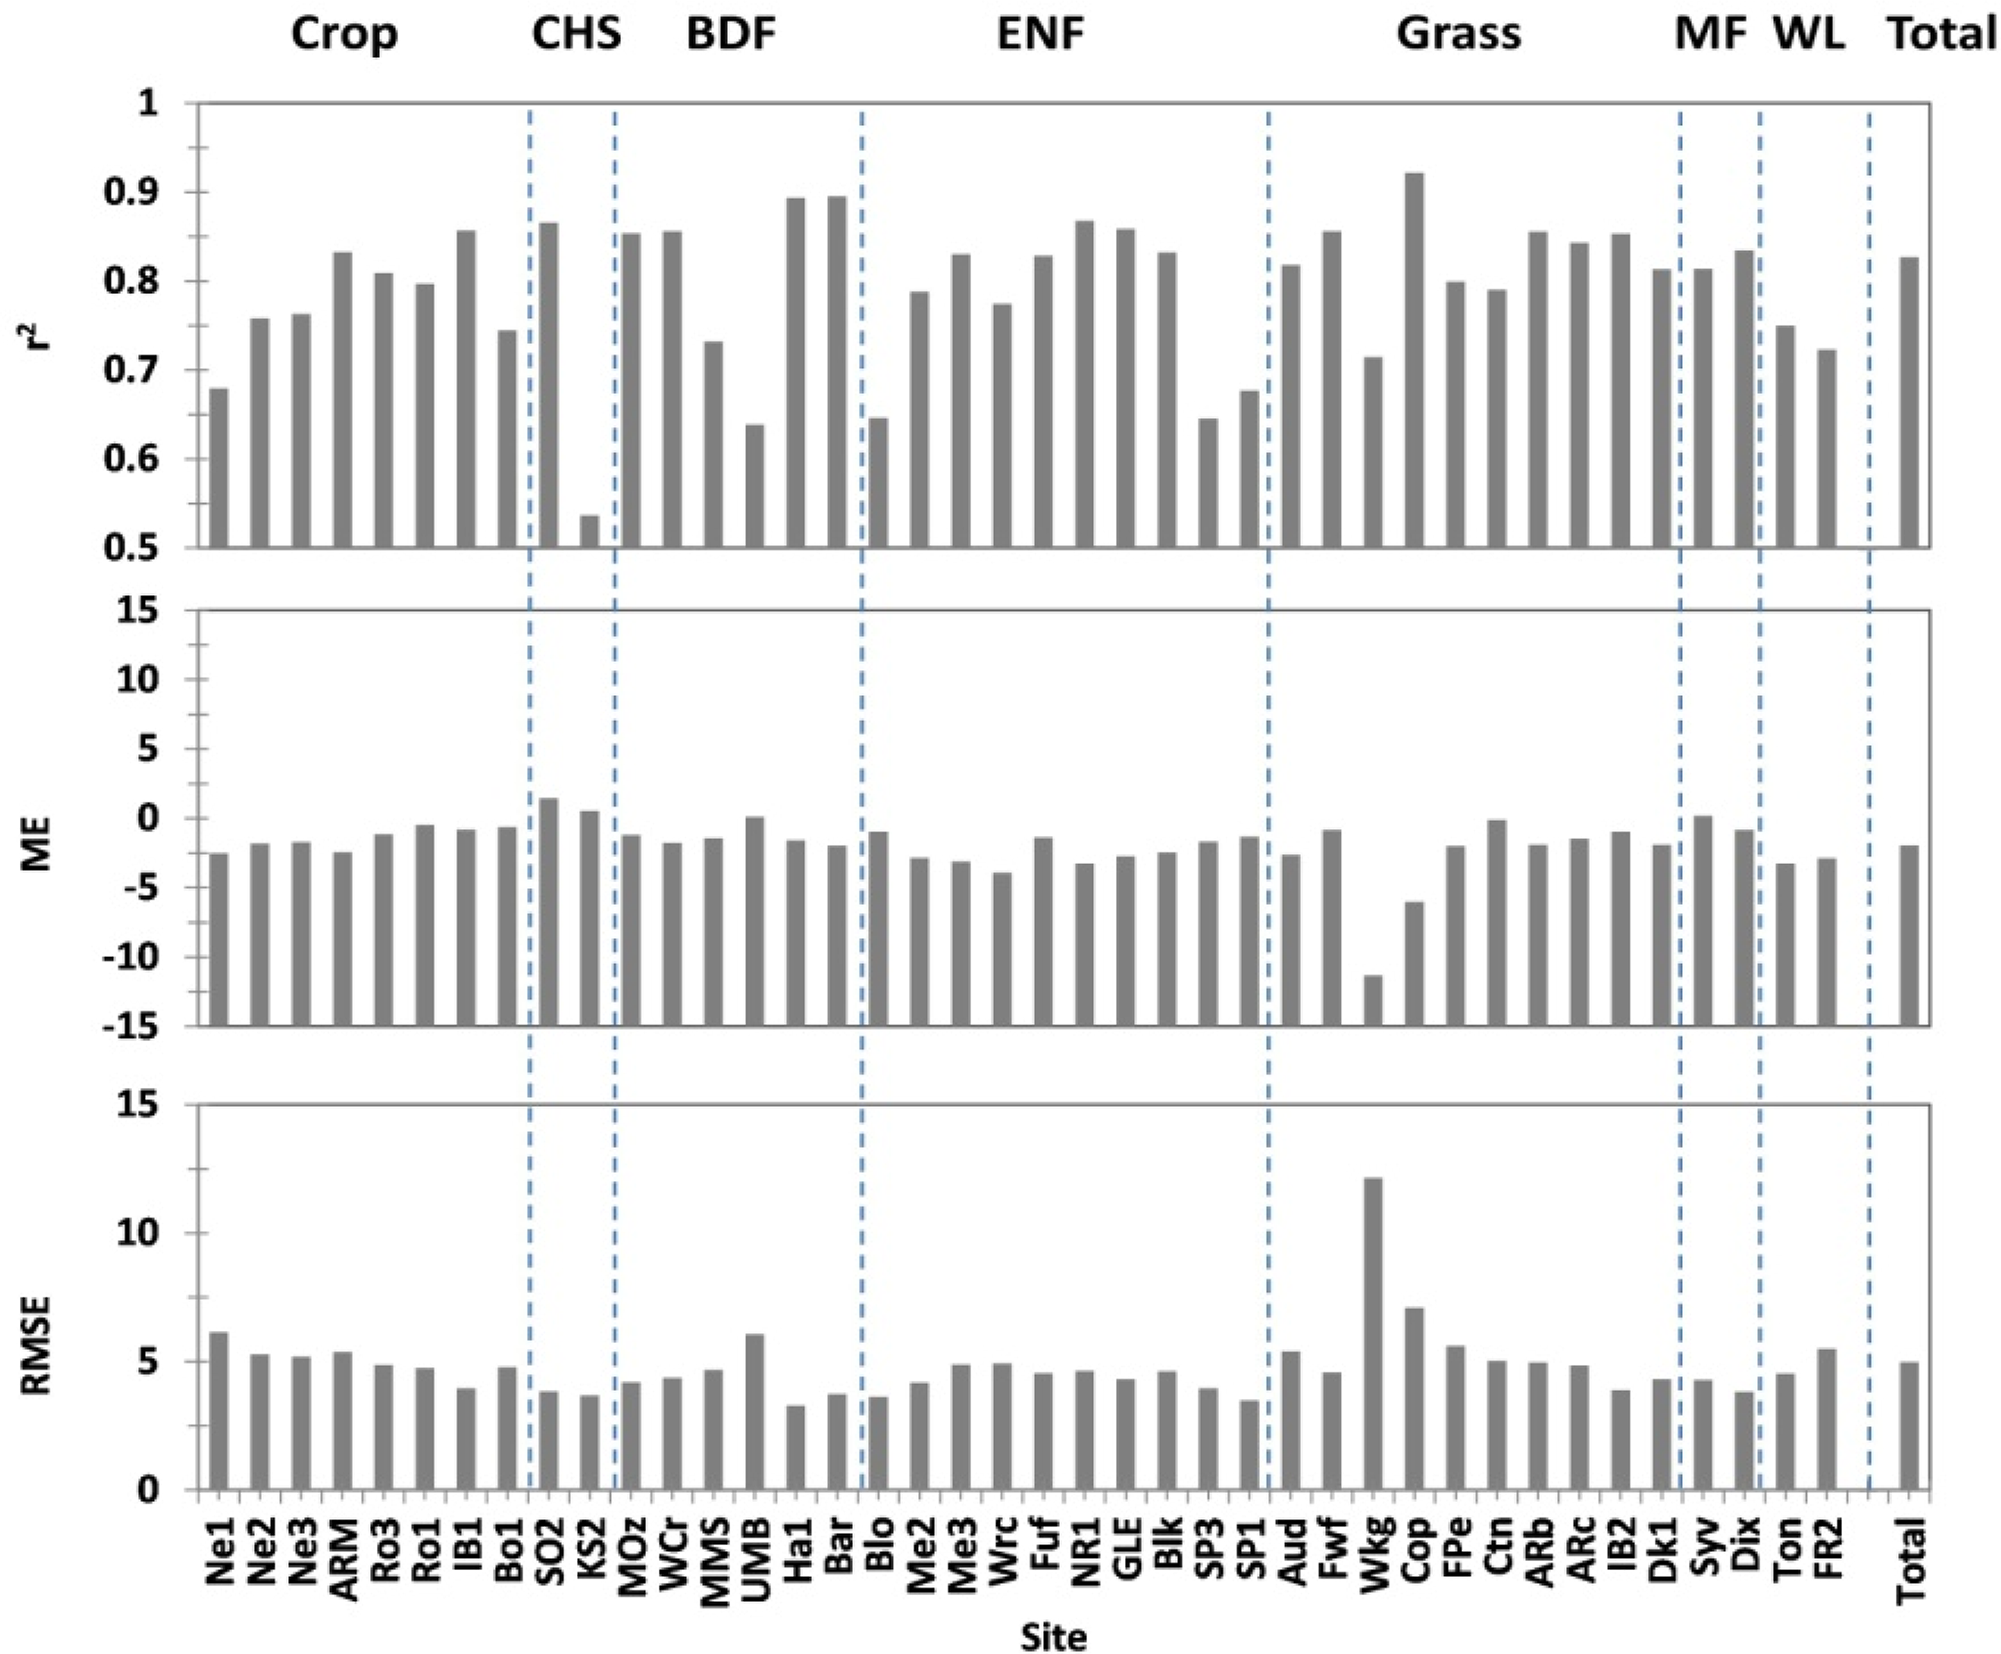
The Ta under cloudy sky conditions was estimated for each pixel using regression models derived from the relationship between MODIS Ta and AMSR-E Tb,37v. The number of estimated data points under cloudy sky conditions was 11,857 and represented 82.7% of the total 2006 data record. The estimated Ta at the 40 validation sites showed generally favorable agreement with the tower measurements (R2 = 82.70%, ME = −1.95 K, RMSE = 4.99 K). For the individual sites, KS2 and Cop showed the lowest and highest R2 correspondences of 53.7% and 92.21%, respectively (Figure 5). The Ne1, UMB, Blo, SP1, and SP3 sites showed slightly lower R2 values ranging from 63.89% to 67.95%, relative to the other sites (R2 > 0.7). The ME differences under cloudy conditions ranged from −11.33 (Wkg) to +1.45 (SO2) K, which was similar to the temperature estimation performance under clear sky conditions (ClearPix ≥ 5). The UBM site showed the lowest ME (+0.11 K) for cloudy sky conditions. For the Ro1 and Ro3 sites, the estimated Ta showed good correspondences with tower observations (R2 > 80.0%, ME > −1.1 K), while the temperature discrepancies more than 5 K between datasets were observed in January (not shown). The RMSE temperature difference was relatively large at the Wkg site (12.15 K), while the Ha1 site showed the smallest RMSE difference (3.3 K) of the 40 validation sites.
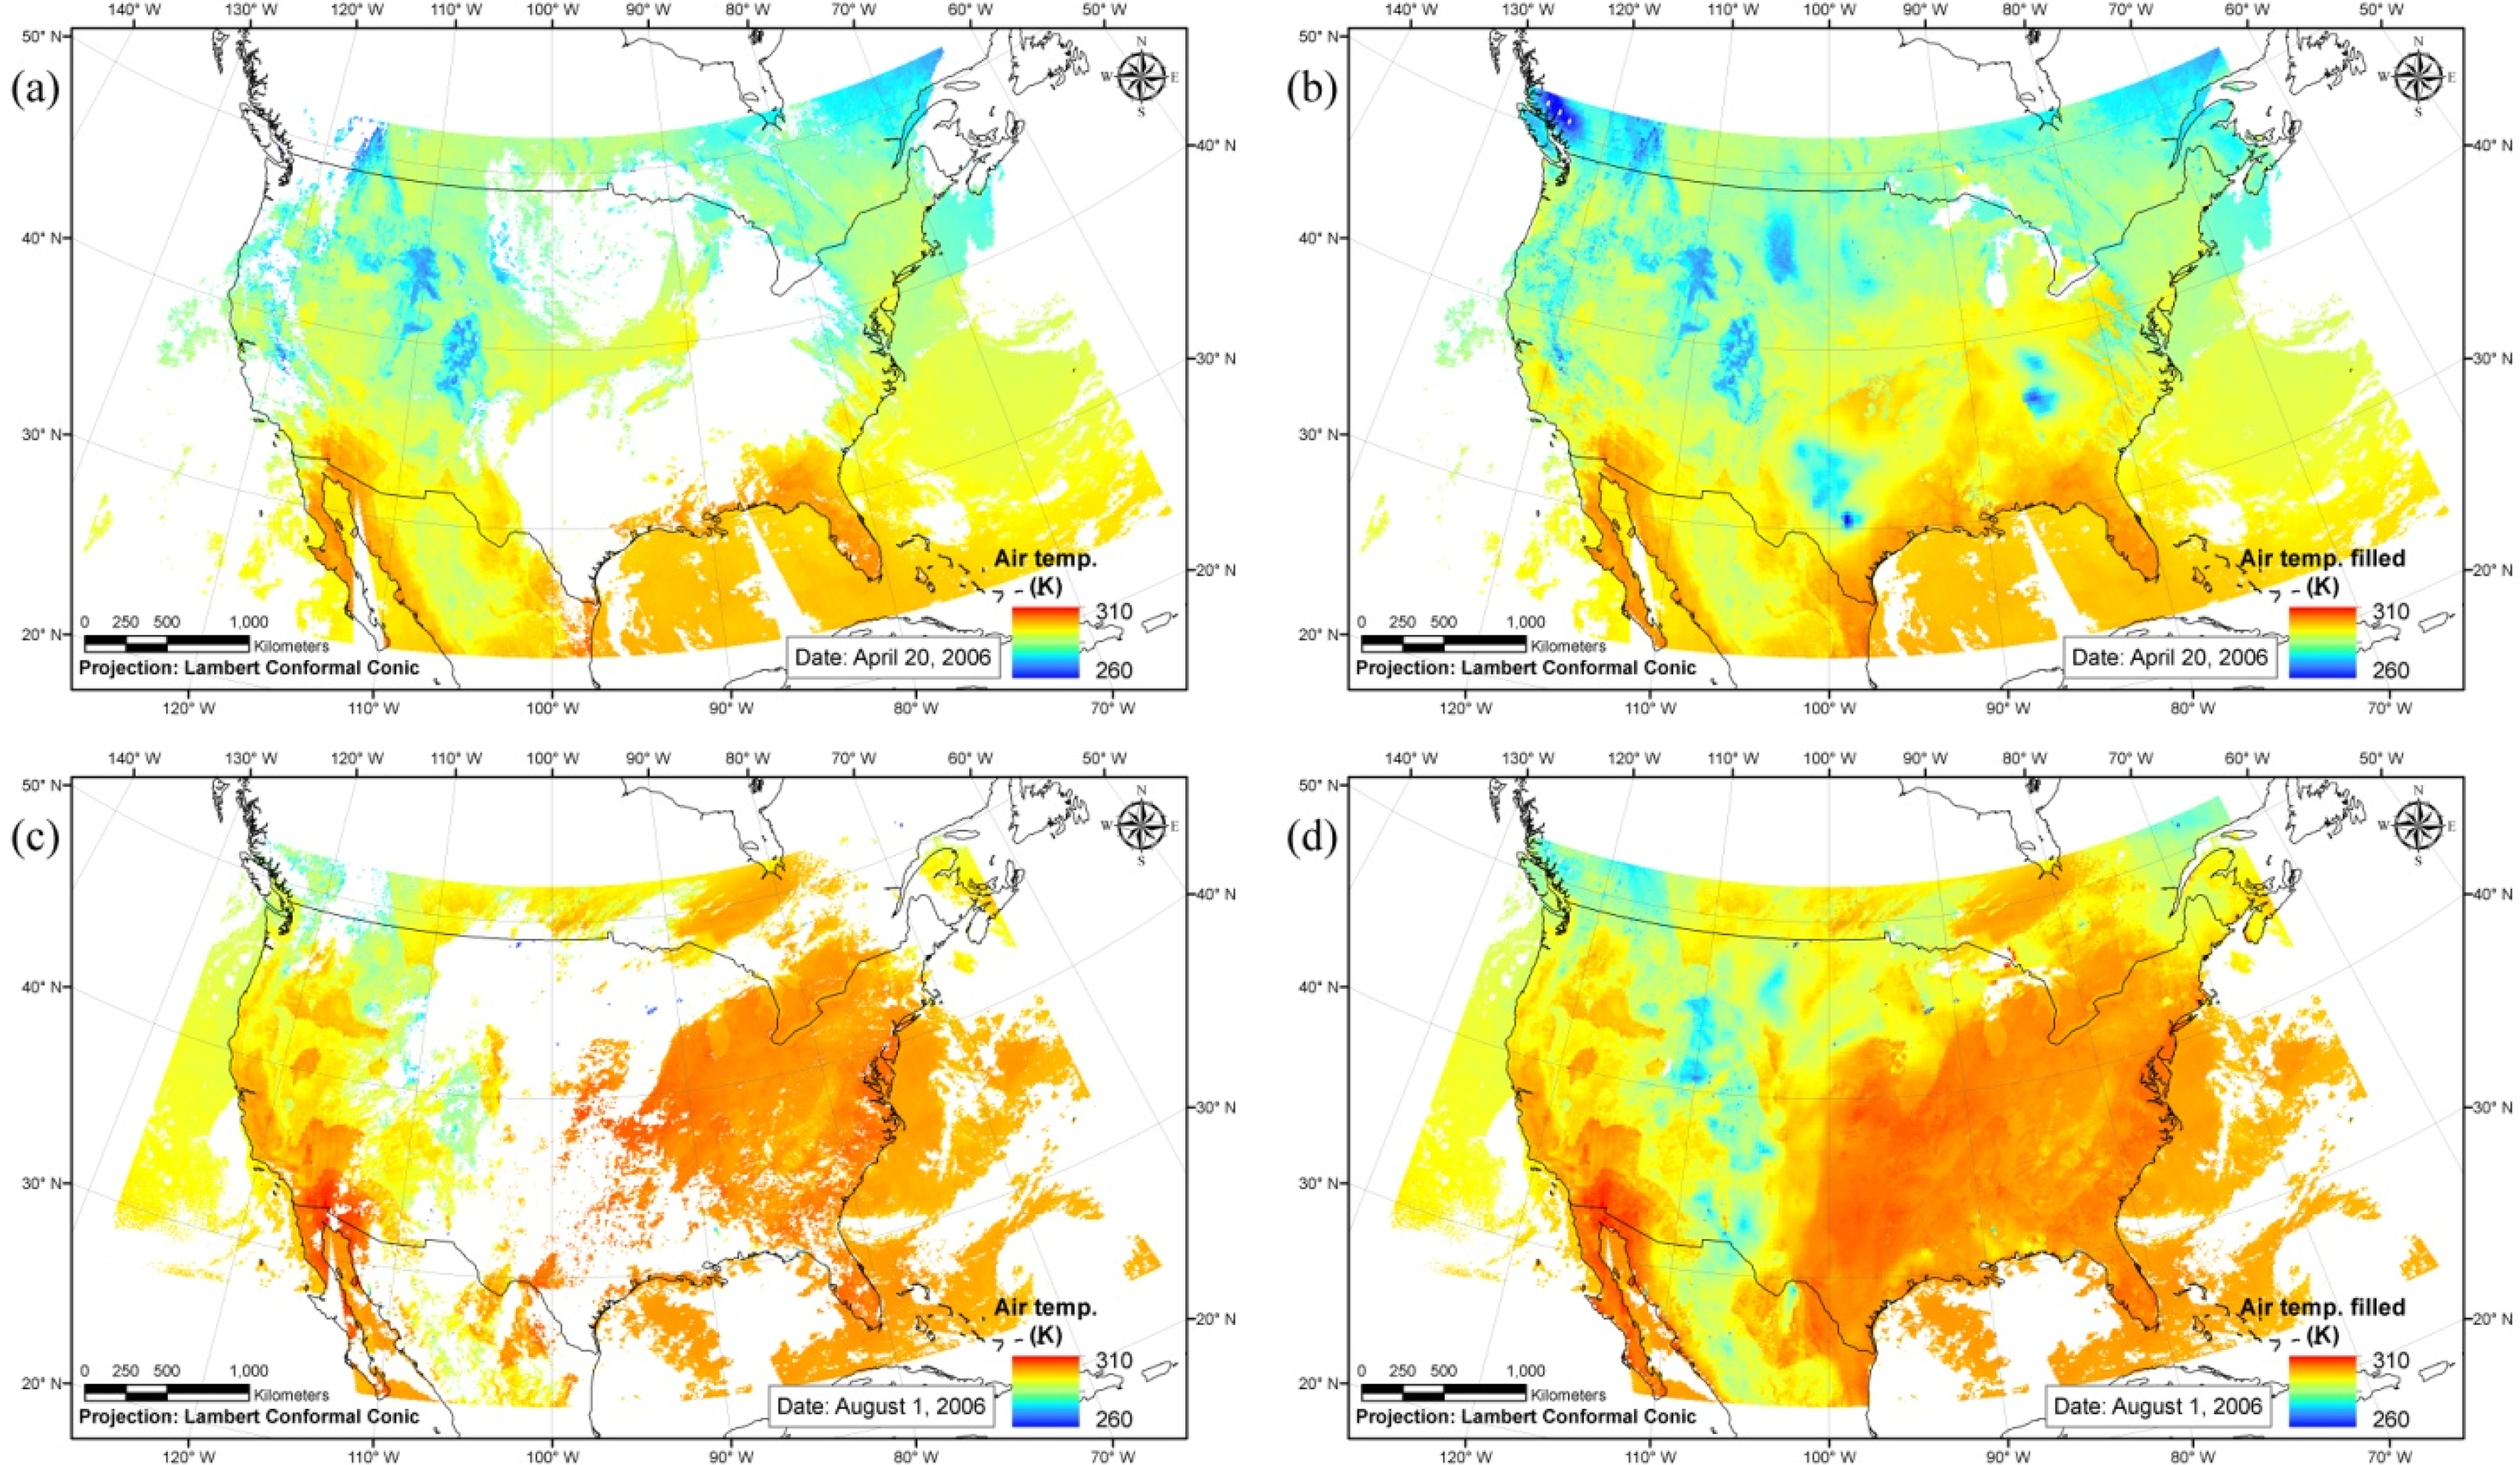
Figure 6a shows the comparison of Ta integrated for clear (blue circles) and cloudy (orange circles) sky conditions. The total number of data points was 24,142 for the 2006 study period. Although the estimated Ta was slightly underestimated relative to the local tower site measurements (ME = −2.09 K), our results showed strong linearity between both datasets. The total RMSE for the 40 tower validation sites was 4.79 K, which was slightly larger than the RMSE for clear sky conditions. Figure 6b shows the Ta comparison results for the individual tower sites. The KS2 and Cop sites show the lowest (R2 = 62.07%) and highest (R2 = 91.18%) Ta correspondence, respectively. The ME and RMSE differences ranged from −10.96 (Wkg) to +0.33 (SO2) K and from 3.16 (SP1) to 11.76 (Wkg) K, respectively. The Wkg site represents a regional outlier with relatively extreme Ta bias that was approximately 240% larger than the other site differences. The satellite-based Ta estimation method for clear and cloudy sky conditions was applied for the United States domain. Figure 7 shows the examples of spatial maps of Ta for daytime overpasses on April 20 (a and b) and August 1 (c and d) in 2006. There are lots of data gaps due to cloud presence of the domain in Figure 7a,c, whereas the gaps were successfully filled using the pixel-wise empirical relationships suggested in this study (Figure 7b,d). The spatial variation of Ta has come out well in the United States domain.
3.3. Daily Ta Estimation
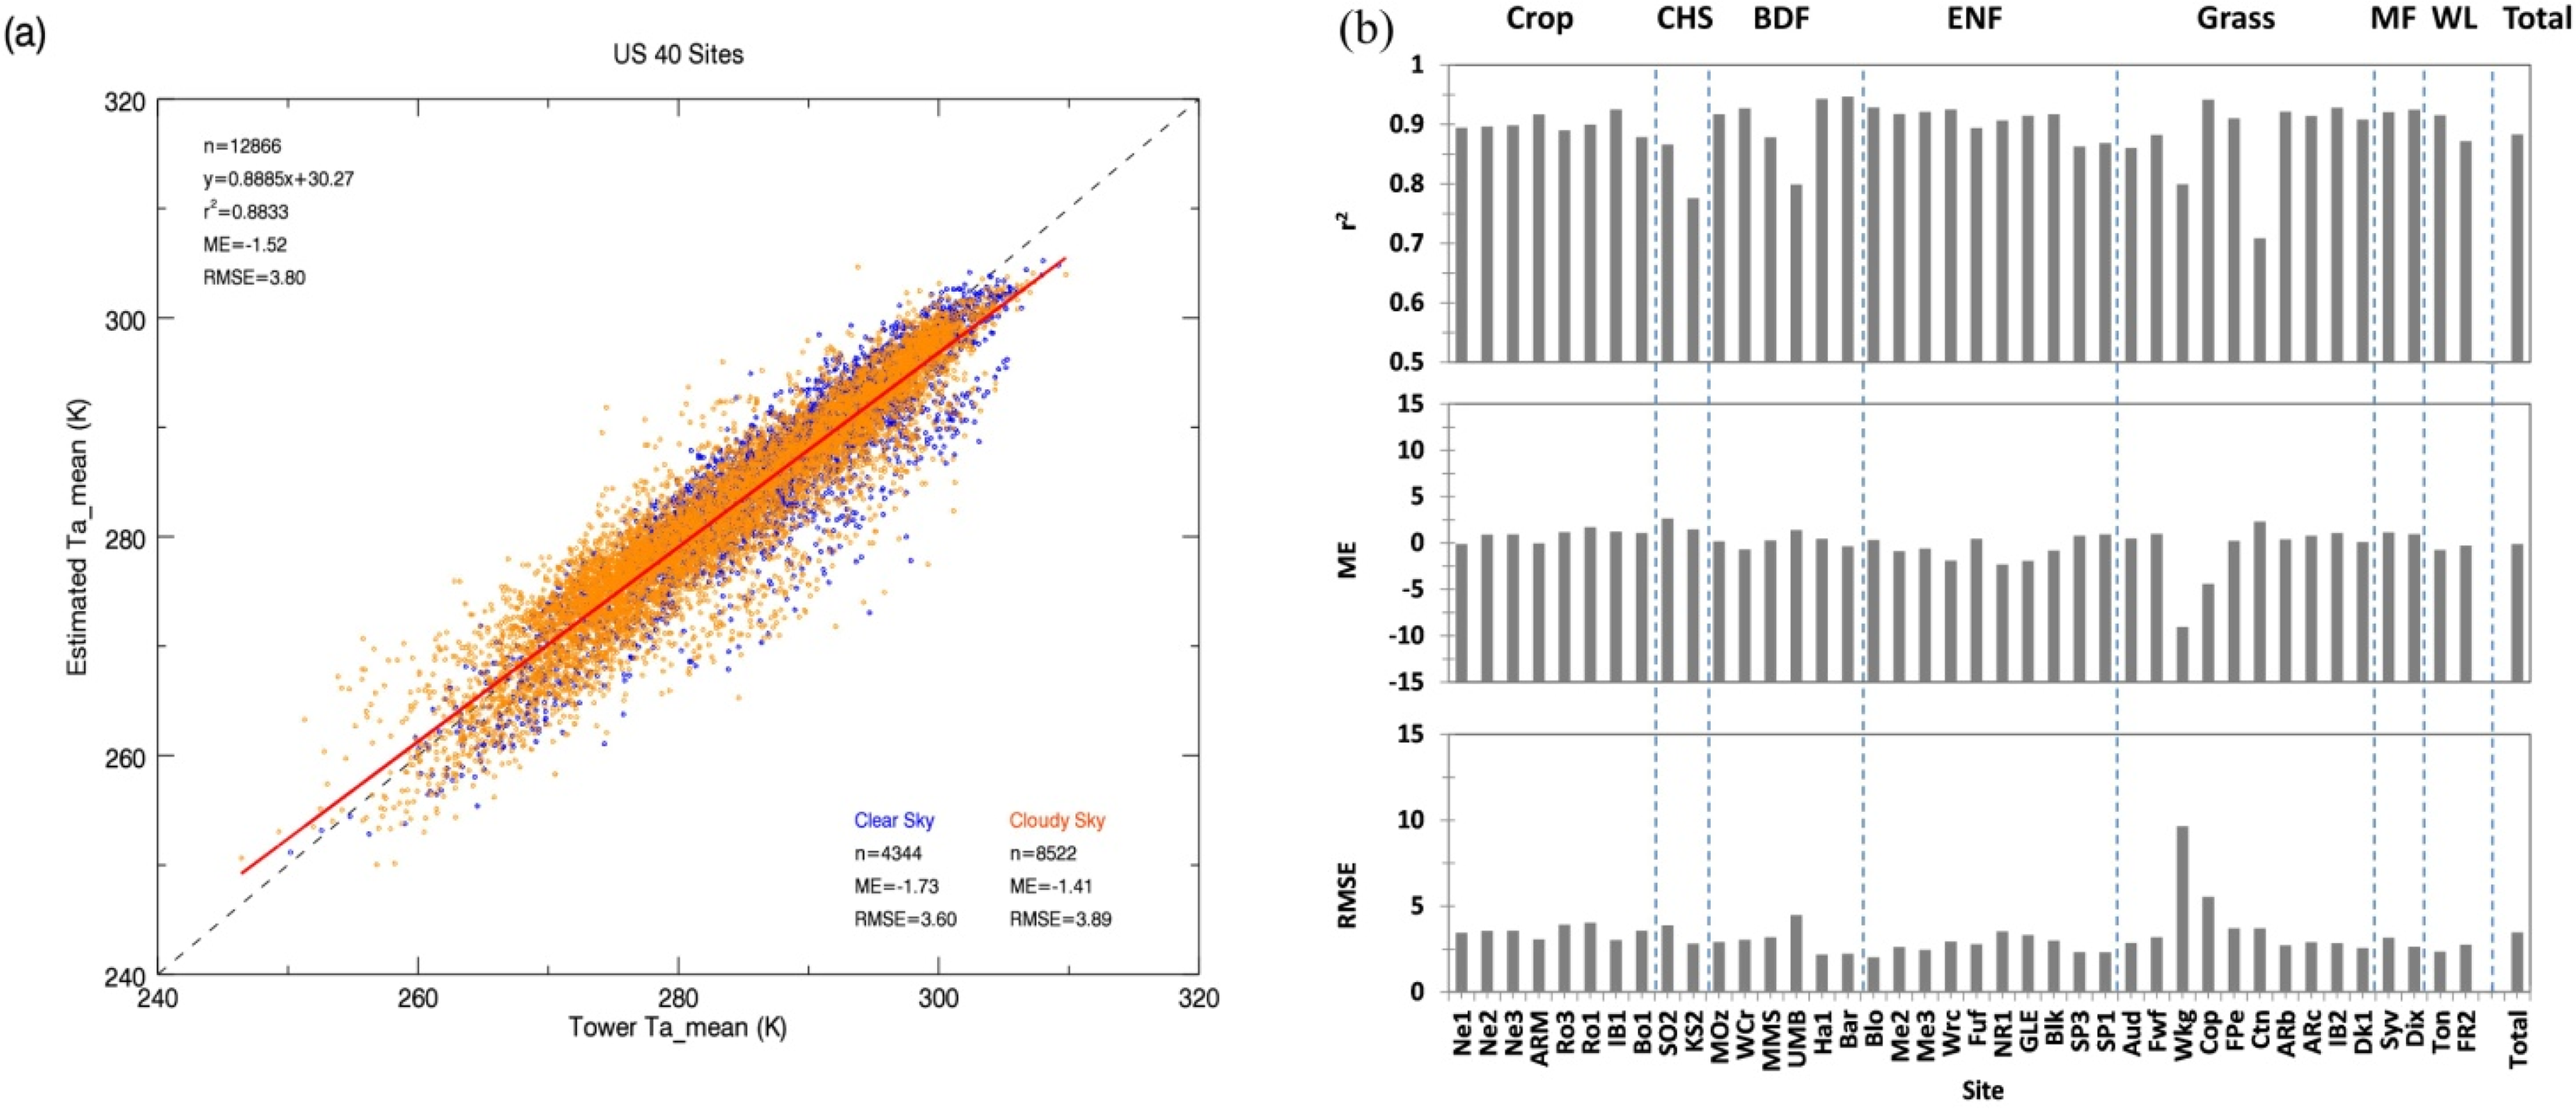
The gap-filled day and nighttime Ta retrievals from this study were assumed to be approximately equivalent to Ta_max and Ta_min, and were used to estimate the mean daily air temperature (Ta_mean). The satellite-derived Ta_max estimates was slightly underestimated in comparison with the tower measured Ta_max. The R2 correspondence for Ta_max was 86.58% (n = 13,552) for all tower validation sites, while associated ME and RMSE differences were −4.41 and 6.13 K, respectively. Although Ta_max for cloudy conditions showed larger variability (R2 = 83.77%, RMSE = 6.43 K) in satellite retrieval performance than for clear sky conditions (R2 = 86.30%, RMSE = 5.84 K), the linear trends were similar between clear and cloudy sky conditions (Table 2). For the Ta_min comparisons, the overall R2 correspondence was 78.86% (n = 13,699), which was slightly lower than for Ta_max. The satellite Ta_min estimated in this study was generally overestimated relative to the local tower Ta_min measurements (ME = +1.55 K, RMSE = 4.86 K). The associated R2, ME, and RMSE statistics for the daily mean air temperature (Ta_mean) for all sites were 88.33%, −1.52 K and 3.80 K, respectively. The satellite-based Ta_mean retrievals were generally underestimated relative to the tower measurements, except for the KS2 (ME = +0.06 K), Ro1 (+0.29 K), and SO2 (+1.22 K) sites.
The Ta_max and Ta_min satellite retrievals from this study were calibrated to improve estimation accuracy at the tower sites for Ta_mean by adding systematic offsets of −4.41 K (Ta_max) and +1.55 K (Ta_min) to the retrievals. The adjusted Ta_mean results derived from the calibrated Ta_max and Ta_min retrievals is presented in Figure 8. The ME and RMSE differences for the calibrated Ta_mean results were reduced by approximately 94% and 8%, respectively, relative to the uncorrected Ta_mean results. For the uncorrected Ta_mean results, respective ME and RMSE differences were −1.52 K and 3.80 K for all sites, and were reduced to −0.09 K and 3.48 K for the corrected Ta_mean results. Figure 8b shows the individual site comparison results for the corrected and uncorrected Ta_mean retrievals. In general, the ME was slightly larger for the adjusted Ta_mean results relative to the uncorrected retrievals, and ranged from −9.04 (Wkg) to 2.65 (SO2) K. On the other hand, the RMSE differences were generally lower for the adjusted Ta_mean retrievals and ranged from 2.02 (Blo) to 9.65 (Wkg) K.
4. Discussion
In this study, the Ta for clear and cloudy sky conditions were estimated using synergistic MODIS and AMSR-E data, and evaluated against local tower temperature measurements from 40 AmeriFlux sites spanning the continental US. For the clear sky conditions, the instantaneous Ta was obtained from the MODIS (MYD07_L2) atmosphere profiles product, which showed generally favorable agreement with the tower observations (RMSE = 4.57 K; Figure 4). The retrieval accuracies according to the different sky conditions were evaluated using the number of clear 1 km resolution pixels within each 5 km resolution grid cell determined from the MYD07_L2 product. The R2 correspondence between the satellite retrievals and tower measurements increased from 86.58% under partial cloud cover to 87.17% under clear-sky conditions, while associated ME and RMSE differences decreased from −2.22 to −1.63 K, and from 4.57 to 3.98 K, respectively (Figure 4). Although the temperature retrieval accuracies were improved under clear sky conditions, the number of retrieved clear-sky data from MODIS was nearly half of the total retrievals for the 2006 study period. Fortunately, retrieval differences for the different sky conditions were not significantly large (∼0.6 K). The Ta retrieval errors for clear sky conditions were generally similar to or slightly larger than those reported in previous studies using Terra and/or Aqua MODIS07_L2 ranging from 2.4 to 9.8 K [31,33,38,48]. Ta retrievals under all-weather conditions determined from relatively sophisticated radiative transfer (RT) algorithms and AMSR-E passive microwave sensor Tb observations have reported RMSE retrieval accuracies within 3.5K, but at relatively coarse (25 km) spatial resolution [27]. Similar Ta retrieval accuracies have also been reported from the Atmospheric Infrared Sounder (AIRS) atmospheric sounding measurements [49].
The Ta under cloudy sky conditions were estimated using pixel-wise regression model relationships between MODIS Ta for clear sky conditions and corresponding AMSR-E Tb,37v records. The regression method between two variables was applied for each pixel following the scheme presented in Figure 3, and then Ta was successfully generated for cloudy sky conditions over all AmeriFlux tower validation sites from the AMSR-E Tb,37v data (Figure 5). The accuracy of estimated Ta for cloudy conditions was dependent upon the accuracy of MODIS Ta for clear sky conditions, as well as AMSR-E Tb,37v. The estimated Ta under cloudy sky conditions at the Ro1 and Ro3 sites were underestimated by more than 5 K in January and may reflect snow, frost and frozen soil effects on AMSR-E Tb,37v and associated surface emissivity [26]. The atmosphere is also generally more opaque to the 37 GHz frequency (Ka band) observations than for alternative 23.8 GHz frequency (Ku band) AMSR-E observations. Jones et al. [27] found the best correlations between AMSR-E 23.8 GHz frequency Tb retrievals and in situ temperature measurements (see Figure 2 in Jones et al.’s paper); they used the 23.8 GHz frequency daily Tb records to estimate Ta_max and Ta_min for regional and global applications. However, 37 GHz frequency Tb observations from overlapping passive microwave sensor records provide long-term continuous global observations from the late 1970s to the present [26]. Thus, the simple regression method using two different sensors to estimate Ta under cloudy conditions proposed in this study can be applied retrospectively to earlier satellite records and to next generation satellite sensors such as the Visible Infrared Imaging Radiometer Suite (VIIRS) onboard the Suomi NPP and the Advanced Microwave Scanning Radiometer 2 (AMSR2) onboard the JAXA GCOM-W1 satellite. The VIIRS and AMSR2 sensors provide general continuity of global observations initiated by the NASA EOS MODIS and AMSR-E sensors, respectively.
Both the instantaneous MYD07_L2 Ta retrieval under clear sky conditions and the estimated Ta retrieval under cloudy conditions showed generally favorable agreement with in situ air temperature measurements spanning a broad AmeriFlux tower network. Although the results of Ta produced in this study showed slightly large RMSE (∼4 K) rather than previous studies using LST-NDVI relationship [1,11,14,15], the proposed method in this study can be applied to any region regardless of sky conditions such as cloud presence. Figure 7 is the good examples to show the spatial variability of Ta for all sky conditions at the regional scale. However, large errors were detected at relatively high altitude sites (e.g., Wkg and Cop sites in Figures 4 and 5); these discrepancies may reflect differences between the MYD07_L2 Ta retrieval height and the local tower elevation. There are efforts to improve the Ta retrieval accuracy from MODIS under clear sky conditions. Tang and Li [50], and Bisht and Bras [16] assume hydrostatic atmosphere conditions to estimate near-surface Ta by considering complex terrain, and applied the air temperature lapse rate to interpolate or extrapolate Ta given the lowest vertical pressure level from the Terra MOD07_L2 product. The MODIS07_L2 atmospheric profile product provides air temperature profiles at 20 vertical atmospheric pressure levels [25]. The vertical pressure levels for 850, 920, 950, 1000 hPa from MODIS07_L2 correspond approximately to surface altitudes of 1500, 800, 550, and 100 m, respectively. However, the apparent mismatch between the retrieval heights and local station elevations was observed at the Wkg and Cop sites. Interestingly, the pattern of linearity in comparison with tower measurements was strong, and the slope of the regression function was nearly 1.0. These systematic errors may occur from mismatches between the retrieval height and local topography. For example, the actual altitude is 1531 m for the Wkg site, while the MYD07_L2 Ta retrieval is generally produced at the 780 hPa pressure height level. The corresponding altitude of this level is approximately 2200 m above mean sea level. Although adjustment for the retrieval height was not considered in this study, it may improve the near-surface Ta retrieval accuracy from the MODIS07_L2 product and should be considered for future studies, especially over complex terrain areas.
In this study, the day and nighttime Ta derived from MODIS were assumed to be proxies for Ta_max and Ta_min to estimate Ta_mean. The resulting Ta_max and Ta_min estimates were under- and overestimated relative to the local tower measurements, respectively. The magnitudes of errors for Ta_min were generally similar to previous studies. Lee et al. [35] estimated Ta_min from 2003 to 2006 over the US Corn-Belt region by assuming equivalence between the Aqua MODIS nighttime overpass Ta retrievals and Ta_min; they reported resulting error ranges from −0.9 to +5.2 K (ME) and from 2.6 to 5.7 K (RMSE). Systematic offsets were applied to the satellite based Ta_max and Ta_min estimates to improve Ta_mean estimation accuracy at the local tower sites. The corrected Ta_mean results showed general improvement over the uncorrected results relative to the tower temperature measurements (Figure 8a).
5. Conclusions
Cloud contamination is a significant source of error for monitoring of the Earth surface from satellite optical-IR remote sensing. We presented a simple empirical regression method combining synergistic information from MODIS and AMSR-E sensors for estimating Ta under both clear and cloudy sky conditions. The fusion of data from both sensors is facilitated by their co-location on the same Aqua satellite platform, which enables spatially and temporally consistent Earth observations at optical-IR and microwave wavelengths. The simple regression method developed for Ta gap filling under cloudy conditions produced generally similar accuracy relative to MODIS (MYD07_L2) Ta retrievals under clear sky conditions, and in relation to in situ temperature measurements spanning a broad range of AmeriFlux tower sites, and representing diverse climate and land cover conditions. The instantaneous Ta retrievals for clear and cloudy sky conditions were successfully estimated and evaluated using local temperature measurements from 40 AmeriFlux tower validation sites. Although the RMSE bias of Ta produced in this study showed approximately 4 K, the suggested method for estimating Ta under cloudy sky condition is noticeable in the field of Ta estimation using satellite remotely sensed dataset because most of current methods are restricted for the clear sky. The instantaneous Ta retrievals at the satellite overpass times were successfully used as proxies for daily minimum and maximum air temperature, and for estimating mean daily air temperatures required for other science applications. The results of this study indicate that the combination of MODIS and AMSR-E sensor data can produce daily Ta records with consistent and reasonable accuracy, and relatively fine (∼5 km) spatial resolution for both clear and cloudy sky conditions. The resulting Ta retrievals for all sky conditions are suitable for various model applications, and as environmental inputs for estimating higher order parameters, including vegetation gross primary productivity and evapotranspiration. Furthermore, the simple regression method used to estimate Ta under cloudy sky conditions proposed in this study can potentially be applied to similar satellite records involving retrospective studies or next generation sensors.
Acknowledgments
We would like to give special thanks to Youngwook Kim for assistance with AMSR-E data processing and the AmeriFlux investigators for providing the tower observations used for temperature validation. This research was supported by grants from the Agenda Program of the Rural Development Agency (PJ00997802) and Korea Research Foundation (NRF-2013R1A1A4A01008632) in Republic of Korea and the NASA Terrestrial Hydrology program.
Author Contributions
Keunchang Jang, Sinkyu Kang, and Suk Young Hong designed and performed the research. John S. Kimball supported the AMSR-E dataset and English correction. All authors contributed with idea, writing and discussions.
Conflicts of Interest
The authors declare no conflict of interest.
References
- Prihodko, L.; Goward, S.N. Estimation of air temperature from remotely sensed surface observations. Remote Sens. Environ 1997, 60, 335–346. [Google Scholar]
- Vogt, J.V.; Viau, A.A.; Paquet, F. Mapping regional air temperature fields using satellite-derived surface skin temperatures. Int. J. Climatol 1997, 17, 1559–1579. [Google Scholar]
- CEOS. The Earth Observation Handbook. Available online: http://www.eohandbook.com/index.html (accessed on 10 October 2013).
- IPCC, Climate Change 2007: The Physical Science Basis; Solomon, S., Qin, D., Manning, M., Chen, Z., Marquis, M., Averyt, K.B., Tignor, M., Miller, H.L., Eds.; Cambridge University Press: Cambridge, UK, 2007.
- Marquínez, J.; Lastra, J.; García, P. Estimation models for precipitation in mountainous regions: The use of GIS and multivariate analysis. J. Hydrol 2003, 270, 1–11. [Google Scholar]
- Lakshmi, V.; Czajkowski, K.; Dubayah, R.; Susskind, J. Land surface air temperature mapping using TOVS and AVHRR. Int. J. Remote Sens 2001, 22, 643–662. [Google Scholar]
- Aumann, H.H.; Chahine, M.T.; Gautier, C.; Goldberg, M.D.; Kalnay, E.; McMillin, L.M.; Revercomb, H.; Rosenkranz, P.W.; Smith, W.L.; Staelin, D.H.; et al. AIRS/AMSU/HSB on the Aqua mission: Design, science objectives, data products, and processing systems. IEEE Trans. Geosci. Remote Sens 2003, 41, 253–264. [Google Scholar]
- Seemann, S.W.; Li, J.; Menzel, W.P.; Gumley, L.E. Operational retrieval of atmospheric temperature, moisture, and ozone from MODIS infrared radiances. J. Appl. Meteorol 2003, 42, 1072–1091. [Google Scholar]
- Jang, J.D.; Viau, A.A.; Anctil, F. Neural network estimation of air temperatures from AVHRR data. Int. J. Remote Sens 2004, 25, 4541–4554. [Google Scholar]
- Sun, Y.; Wang, J.; Zhang, R.; Gillies, R.R.; Xue, Y.; Bo, Y. Air temperature retrieval from remote sensing data based on thermodynamics. Theor. Appl. Climatol 2005, 80, 37–48. [Google Scholar]
- Stisen, S.; Sandholt, I.; Nørgaard, A.; Fensholt, R.; Eklundh, L. Estimation of diurnal air temperature using MSG SEVIRI data in West Africa. Remote Sens. Environ 2007, 110, 262–274. [Google Scholar]
- Vancutsem, C.; Ceccato, P.; Dinku, T.; Connor, S.J. Evaluation of MODIS land surface temperature data to estimate air temperature in different ecosystems over Africa. Remote Sens. Environ 2010, 114, 449–465. [Google Scholar]
- Guo, Z.; Chen, Y.; Cheng, M.; Jiang, H. Near-surface air temperature retrieval from Chinese Geostationary FengYun Meteorological Satellite (FY-2C) data. Int. J. Remote Sens 2014, 35, 3892–3914. [Google Scholar]
- Goward, S.N.; Xue, Y.; Czajkowski, K.P. Evaluating land surface moisture conditions from the remotely sensed temperature/vegetation index measurements: An exploration with the simplified simple biosphere model. Remote Sens. Environ 2002, 79, 225–242. [Google Scholar]
- Zakšek, K.; Schroedter-Homscheidt, M. Parameterization of air temperature in high temporal and spatial resolution from a combination of the SEVIRI and MODIS instruments. ISPRS J. Photogramm. Remote Sens 2009, 64, 414–421. [Google Scholar]
- Bisht, G.; Bras, R.L. Estimation of net radiation from the MODIS data under all sky conditions: Southern Great Plains case study. Remote Sens. Environ 2010, 114, 1522–1534. [Google Scholar]
- Jin, M.; Dickinson, R.E. Land surface skin temperature climatology: Benefitting from the strengths of satellite observations. Environ. Res. Lett 2010, 5, 044004. [Google Scholar]
- Niclos, R.; Valiente, J.A.; Barbera, M.J.; Caselles, V. Land surface air temperature retrieval from EOS-MODIS images. IEEE Geosci. Remote Sens. Lett 2014, 11, 1380–1384. [Google Scholar]
- Peón, J.; Recondo, C.; Calleja, J.F. Improvements in the estimation of daily minimum air temperature in peninsular Spain using MODIS land surface temperature. Int. J. Remote Sens 2014, 35, 5148–5166. [Google Scholar]
- Urban, M.; Eberle, J.; Hüttich, C.; Schmullius, C.; Herold, M. Comparison of satellite-derived land surface temperature and air temperature from meteorological stations on the pan-Arctic Scale. Remote Sens 2013, 5, 2348–2367. [Google Scholar]
- Williamson, S.; Hik, D.; Gamon, J.; Kavanaugh, J.; Flowers, G. Estimating temperature fields from MODIS land surface temperature and air temperature observations in a sub-Arctic Alpine environment. Remote Sens 2014, 6, 946–963. [Google Scholar]
- Susskind, J.; Barnet, C.D.; Blaisdell, J.M. Retrieval of atmospheric and surface parameters from AIRS/AMSU/HSB Data in the presence of clouds. IEEE Trans. Geosci. Remote Sens 2003, 41, 390–409. [Google Scholar]
- Susskind, J.; Blaisdell, J.M.; Iredell, L.; Keita, F. Improved temperature sounding and quality control methodology using AIRS/AMSU data: The AIRS science team version 5 retrieval algorithm. IEEE Trans. Geosci. Remote Sens 2011, 49, 883–907. [Google Scholar]
- Surdyk, S. Using microwave brightness temperature to detect short-term surface air temperature changes in Antarctica: An analytical approach. Remote Sens. Environ 2002, 80, 256–271. [Google Scholar]
- Seemann, S.W.; Borbas, E.E.; Li, J.; Menzel, W.P.; Gumley, L.E. MODIS Atmospheric Profile Retrieval Algorithm Theoretical Basis Document; Publisher: NASA: Greenbelt, MD, USA, 2006; pp. 1–34. [Google Scholar]
- Holmes, T.R.H.; De Jeu, R.A.M.; Owe, M.; Dolman, A.J. Land surface temperature from Ka band (37 GHz) passive microwave observations. J. Geophys. Res. Atmos 2009, 114, D04113. [Google Scholar]
- Jones, L.A.; Ferguson, C.R.; Kimball, J.S.; Zhang, K.; Chan, S.T.K.; McDonald, K.C.; Njoku, E.G.; Wood, E.F. Satellite microwave remote sensing of daily land surface air temperature minima and maxima from AMSR-E. IEEE J. Sel. Top. Appl. Earth Obser. Remote Sens 2010, 3, 111–123. [Google Scholar]
- Owe, M.; Griend, V.D. On the relationship between thermodynamic surface temperature and high-frequency (37 GHz) vertically polarized brightness temperature under semi-arid conditions. Int. J. Remote Sens 2001, 22, 3521–3532. [Google Scholar]
- Jones, H.G.; Vaughan, R.A. Remote Sensing of Vegetation; Oxford University Press: New York, NY, USA, 2010. [Google Scholar]
- Jones, L.A.; Kimball, J.S. Daily Global Land Surface Parameters Derived from AMSR-E. Available online: http://nsidc.org/data/nsidc-0451 (accessed on 1 March 2013).
- Bisht, G.; Venturini, V.; Islam, S.; Jiang, L. Estimation of the net radiation using MODIS (moderate resolution imaging spectroradiometer) data for clear sky days. Remote Sens. Environ 2005, 97, 52–67. [Google Scholar]
- Batra, N.; Islam, S.; Venturini, V.; Bisht, G.; Jiang, L. Estimation and comparison of evapotranspiration from MODIS and AVHRR sensors for clear sky days over the Southern Great Plains. Remote Sens. Environ 2006, 103, 1–15. [Google Scholar]
- Jeong, S.; Jang, K.; Kang, S.; Kim, J.; Kondo, H.; Gamo, M.; Asanuma, J.; Saigusa, N.; Wang, S.; Han, S. Evaluation of MODIS-derived evapotranspiration at the flux tower sites in East Asia. Korean J. Agric. Meteor 2009, 11, 174–184. [Google Scholar]
- Jang, K.; Kang, S.; Kim, J.; Lee, C.B.; Kim, T.; Kim, J.; Hirata, R.; Saigusa, N. Mapping evapotranspiration using MODIS and MM5 four-dimensional data assimilation. Remote Sens. Environ 2010, 114, 657–673. [Google Scholar]
- Lee, J.; Kang, S.; Jang, K.; Ko, J.; Hong, S.Y. The evaluation of meteorological inputs retrieved from MODIS for estimation of gross primary productivity in the US corn belt region. Korean J. Remote Sens 2011, 27, 481–494. [Google Scholar]
- Ryu, Y.; Baldocchi, D.D.; Kobayashi, H.; Ingen, C.; Li, J.; Black, T.A.; Beringer, J.; Gorsel, E.; Knohl, A.; Law, B.E. Integration of MODIS land and atmosphere products with a coupled-process model to estimate gross primary productivity and evapotranspiration from 1 km to global scales. Glob. Biogeochem. Cycle 2011, 25, GB4017. [Google Scholar]
- Do, N.; Kang, S.; Myeong, S.; Chun, T.; Lee, J.; Lee, C.B. The estimation of gross primary productivity over North Korea using MODIS FPAR and WRF meteorological data. Korean J. Agric. For. Meteorol 2012, 28, 215–226. [Google Scholar]
- Jang, K.; Kang, S.; Lim, Y.; Jeong, S.; Kim, J.; Kimball, J.S.; Hong, S.Y. Monitoring daily evapotranspiration in Northeast Asia using MODIS and a regional Land Data Assimilation System. J. Geophys. Res. Atmos 2013, 118, 927–940. [Google Scholar]
- Friedl, M.A.; Sulla-Menashe, D.; Tan, B.; Schneider, A.; Ramankutty, N.; Sibley, A.; Huang, X. MODIS collection 5 global land cover: Algorithm refinements and characterization of new datasets. Remote Sens. Environ 2010, 114, 168–182. [Google Scholar]
- Köhn, J.; Royer, A. Microwave brightness temperature as an indicator of near-surface air temperature over snow in Canadian northern regions. Int. J. Remote Sens 2012, 33, 1126–1138. [Google Scholar]
- Pulliainen, J.T.; Grandell, J.; Hallikainen, M.T. Retrieval of surface temperature in boreal forest zone from SSM/I data. IEEE Trans. Geosci. Remote Sens 1997, 35, 1188–1200. [Google Scholar]
- Basist, A.; Grody, N.C.; Peterson, T.C.; Williams, C.N. Using the Special Sensor Microwave/Imager to monitor land surface temperatures, wetness, and snow cover. J. Appl. Meteor 1998, 37, 888–911. [Google Scholar]
- Ashcroft, P.; Wentz, F.J. AMSR Level 2A Algorithm. Available online: https://nsidc.org/data/amsre/pdfs/amsr_atbd_level2a.pdf (accessed on 18 March 2012).
- Kawanishi, T.; Sezai, T.; Ito, Y.; Imaoka, K.; Takeshima, T.; Ishido, Y.; Shibata, A.; Miura, M.; Inahata, H.; Spencer, R.W. The Advanced Microwave Scanning Radiometer for the Earth Observing System (AMSR-E), NASDA’s contribution to the EOS for global energy and water cycle studies. IEEE Trans. Geosci. Remote Sens 2003, 41, 184–194. [Google Scholar]
- Armstrong, R.L.; Brodzik, M.J. An earth-gridded SSM/I data set for cryospheric studies and global change monitoring. Adv. Space Res 1995, 16, 155–163. [Google Scholar]
- Knowles, K.; Savoie, M.; Armstrong, R.; Brodzik, M.J. AMSR-E/Aqua Daily EASE-Grid Brightness Temperatures. Available online: http://nsidc.org/data/nsidc-0301 (accessed on 1 March 2013).
- Kim, Y.; Kimball, J.S.; McDonald, K.C.; Glassy, J. Developing a global data record of daily landscape freeze/thaw status using satellite passive microwave remote sensing. IEEE Trans. Geosci. Remote Sens 2011, 49, 949–960. [Google Scholar]
- Houborg, R.M.; Soegaard, H. Regional simulation of ecosystem CO2 and water vapor exchange for agricultural land using NOAA AVHRR and Terra MODIS satellite data. Application to Zealand, Denmark. Remote Sens. Environ 2004, 93, 150–167. [Google Scholar]
- Tian, B.; Fetzer, E.J.; Kahn, B.H.; Teixeira, J.; Manning, E.; Hearty, T. Evaluating CMIP5 models using AIRS tropospheric air temperature and specific humidity climatology. J. Geophys. Res. Atmos 2013, 118, 114–134. [Google Scholar]
- Tang, B.; Li, Z. Estimation of instantaneous net surface longwave radiation from MODIS cloud-free data. Remote Sens. Environ 2008, 112, 3482–3492. [Google Scholar]


| ID | Latitude (°N), Longitude (°W) | LC Type | State | Elevation (m) | ID | Latitude (°N), Longitude (°W) | LC Type | State | Elevation (m) |
|---|---|---|---|---|---|---|---|---|---|
| Ne1 | 42.16, 96.47 | CRP | NE | 361 | Fuf | 35.08, 111.76 | ENF | AZ | 2180 |
| Ne2 | 41.16, 96.47 | CRP | NE | 362 | NR1 | 40.03, 105.54 | ENF | CO | 3050 |
| Ne3 | 41.17, 96.43 | CRP | NE | 363 | GLE | 41.36, 106.24 | ENF | WY | 3190 |
| ARM | 36.60, 97.48 | CRP | OK | 314 | Blk | 44.15, 103.65 | ENF | SD | 1718 |
| Ro3 | 44.72, 93.08 | CRP | MN | 259 | SP3 | 29.75, 82.16 | ENF | FL | 36 |
| Ro1 | 44.71, 93.08 | CRP | MN | 259 | SP1 | 29.73, 82.21 | ENF | FL | 44 |
| IB1 | 41.85, 88.22 | CRP | IL | 225 | Aud | 31.59, 110.51 | GRS | AZ | 1469 |
| Bo1 | 40.00, 88.29 | CRP | IL | 219 | Wkg | 37.73, 109.94 | GRS | AZ | 1531 |
| SO2 | 33.37, 116.62 | CSH | CA | 1393 | Cop | 38.09, 109.39 | GRS | UT | 1520 |
| KS2 | 28.60, 80.67 | CSH | FL | 6 | FPe | 48.30, 105.10 | GRS | MT | 634 |
| MOz | 38.74, 92.20 | DBF | MO | 219 | Ctn | 43.95, 101.84 | GRS | SD | 744 |
| WCr | 45.80, 90.07 | DBF | WI | 515 | ARb | 35.54, 98.04 | GRS | OK | 424 |
| MMS | 39.32, 86.41 | DBF | IN | 275 | ARc | 35.54, 98.04 | GRS | OK | 424 |
| UMB | 45.55, 84.73 | DBF | MI | 234 | IB2 | 41.84, 88.24 | GRS | IL | 226 |
| Ha1 | 42.53, 72.17 | DBF | MA | 340 | Dk1 | 35.97, 79.09 | GRS | NC | 168 |
| Bar | 44.06, 71.28 | DBF | NH | 272 | Fwf | 35.44, 111.77 | GRS | AZ | 2270 |
| Blo | 38.89, 120.63 | ENF | CA | 1315 | Syv | 46.24, 89.34 | MF | MI | 540 |
| Me2 | 44.45, 121.55 | ENF | OR | 1253 | Dix | 39.97, 74.43 | MF | NJ | 48 |
| Me3 | 44.31, 121.61 | ENF | OR | 1005 | Ton | 38.43, 120.96 | WSV | CA | 169.1 |
| Wrc | 45.82, 121.95 | ENF | WA | 371 | FR2 | 29.94, 97.99 | WSV | TX | 271 |
| Ta_max | Ta_min | |||||
|---|---|---|---|---|---|---|
| Clear Sky | Cloudy Sky | Total | Clear Sky | Cloudy Sky | Total | |
| n | 6978 | 6574 | 13,552 | 6705 | 6994 | 13,699 |
| R2 | 0.86 | 0.84 | 0.86 | 0.82 | 0.76 | 0.79 |
| slope | 0.88 | 0.81 | 0.85 | 0.91 | 0.81 | 0.85 |
| intercept | 30.44 | 50.01 | 38.71 | 43.33 | 27.38 | 54.62 |
| ME (K) | −4.46 | −4.36 | −4.41 | +1.20 | +1.89 | +1.55 |
| RMSE (K) | 5.84 | 6.43 | 6.13 | 4.38 | 5.27 | 4.86 |
© 2014 by the authors; licensee MDPI, Basel, Switzerland This article is an open access article distributed under the terms and conditions of the Creative Commons Attribution license (http://creativecommons.org/licenses/by/3.0/).
Share and Cite
Jang, K.; Kang, S.; Kimball, J.S.; Hong, S.Y. Retrievals of All-Weather Daily Air Temperature Using MODIS and AMSR-E Data. Remote Sens. 2014, 6, 8387-8404. https://doi.org/10.3390/rs6098387
Jang K, Kang S, Kimball JS, Hong SY. Retrievals of All-Weather Daily Air Temperature Using MODIS and AMSR-E Data. Remote Sensing. 2014; 6(9):8387-8404. https://doi.org/10.3390/rs6098387
Chicago/Turabian StyleJang, Keunchang, Sinkyu Kang, John S. Kimball, and Suk Young Hong. 2014. "Retrievals of All-Weather Daily Air Temperature Using MODIS and AMSR-E Data" Remote Sensing 6, no. 9: 8387-8404. https://doi.org/10.3390/rs6098387