Article

Evaluating the Ability of NPP-VIIRS Nighttime Light Data to Estimate the Gross Domestic Product and the Electric Power Consumption of China at Multiple Scales: A Comparison with DMSP-OLS Data

1
Key Laboratory of Geographic Information Science, Ministry of Education, East China Normal University, 500 Dongchuan Rd., Shanghai 200241, China
2
Shanghai Key Laboratory for Urban Ecological Processes and Eco-Restoration, East China Normal University, 500 Dongchuan Rd, Shanghai 200241, China
3
Department of Geography, University of California Santa Barbara, Santa Barbara, CA 93106, USA
*
Author to whom correspondence should be addressed.
Remote Sens. 2014, 6(2), 1705-1724; https://doi.org/10.3390/rs6021705
Submission received: 9 December 2013 / Revised: 5 February 2014 / Accepted: 14 February 2014 / Published: 20 February 2014
(This article belongs to the Special Issue Remote Sensing with Nighttime Lights)

Abstract

:
The nighttime light data records artificial light on the Earth’s surface and can be used to estimate the spatial distribution of the gross domestic product (GDP) and the electric power consumption (EPC). In early 2013, the first global NPP-VIIRS nighttime light data were released by the Earth Observation Group of National Oceanic and Atmospheric Administration’s National Geophysical Data Center (NOAA/NGDC). As new-generation data, NPP-VIIRS data have a higher spatial resolution and a wider radiometric detection range than the traditional DMSP-OLS nighttime light data. This study aims to investigate the potential of NPP-VIIRS data in modeling GDP and EPC at multiple scales through a case study of China. A series of preprocessing procedures are proposed to reduce the background noise of original data and to generate corrected NPP-VIIRS nighttime light images. Subsequently, linear regression is used to fit the correlation between the total nighttime light (TNL) (which is extracted from corrected NPP-VIIRS data and DMSP-OLS data) and the GDP and EPC (which is from the country’s statistical data) at provincial- and prefectural-level divisions of mainland China. The result of the linear regression shows that R2 values of TNL from NPP-VIIRS with GDP and EPC at multiple scales are all higher than those from DMSP-OLS data. This study reveals that the NPP-VIIRS data can be a powerful tool for modeling socioeconomic indicators; such as GDP and EPC.

1. Introduction

Obtaining accurate and up-to-date information on the spatial dimensions of gross domestic product (GDP) and electric power consumption (EPC) is important to understanding a country’s social and economic status. Previous studies on GDP and EPC have mainly used statistical data for administrative units [14]. For instance, using GDP statistical data, Mehrotra et al. [5] evaluated the dynamics of GDP growth for China against alternative indicators. Michieka et al. [6] investigated the relationship among GDP, electricity production and coal consumption in mainland China from 1971 to 2009. However, statistical data only provide numeric records for the socioeconomic situation of a specific region (e.g., census or administrative region), and the spatial distribution of those records is not explicitly represented. Therefore, appropriate approaches should be used as complements to the statistics data for estimating and mapping the spatial patterns of those socioeconomic indicators, such as GDP and EPC, in a statistical area [7].
Compared to the traditional socioeconomic census, remote sensing techniques provide a suitable method for describing the spatial distribution of GDP and EPC. Nighttime light data are typical remote sensing data used to map GDP and EPC [812]. Such data can help investigate the socioeconomic situation at a large spatial scale with a comparatively low cost [1215]. Consequently, it has become the preferred choice for modeling spatial distribution of GDP and EPC in national or continental scales. Traditionally, the nighttime light data acquired by the Defense Meteorological Satellite Program’s Operational Linescan System (DMSP-OLS) archived by the National Oceanic and Atmospheric Administration’s National Geophysical Data Center (NOAA/NGDC) of the United States comprise the only useful dataset for estimating and mapping socioeconomic indicators, such as GDP and EPC [1620]. For example, De Souza et al. [21] evaluated Brazil’s 2001 energy crisis by using DMSP-OLS data. Propastin and Kappas [22] revealed that the DMSP-OLS data became an effective tool for the monitoring of both spatial and temporal variability of the examined socioeconomics. Min et al. [23] detected rural electrification in Africa using DMSP-OLS data. Furthermore, Zhao et al. [24] produced a GDP change map of China based on a regression between DMSP-OLS data and the population.
However, pixel saturation in the DMSP-OLS data could reduce the correlation between the socioeconomic activity and the nighttime light data [9,25].This issue results from the OLS sensor’s low radiometric resolution. As the OLS sensor’s radiance ranges from 10−1° to 10−8 W·cm−2·sr−1·um−1 under normal operation, pixels with radiance greater than 10−8 W·cm−2·sr−1·um−1 (which often existed in the centers of large cities) would not be distinguished [2629]. DMSP-OLS data have pixel values ranging from 0 to 63. Due to the aforementioned reasons, such saturated pixels are all given the value of 63. This effect introduced inaccuracies to GDP and EPC modeling in some areas, especially in the centers of large cities with strong artificial lighting [10,14,23,30].
A new generation of nighttime light data sensed by the Visible Infrared Imaging Radiometer Suite (VIIRS) carried by the Suomi National Polar-Orbiting Partnership (Suomi NPP) satellite was released by NOAA/NGDC in early 2013 [17,31]. VIIRS is one of the five instruments (others are the Advanced Technology Microwave Sounder [32], the Cross-Track Infrared Sounder [33], the Ozone Mapping Profiler Suite [34,35], and the Clouds and the Earth’s Radiant Energy System [36,37]) on the satellite, and is configured to collect visible and infrared imagery and radiometric measurements of the land, atmosphere, cryosphere, and oceans [3840]. The first global NPP-VIIRS nighttime light data were generated by the Earth Observation Group, NOAA National Geophysical Data Center. VIIRS day/night band data collected on nights with zero moonlight during 18–26 April 2012 and 11–23 October 2012 was composited into a single dataset [31,4144].
Compared with the DMSP-OLS data, the better qualities of NPP-VIIRS data are threefold. First, as a new generation of nighttime light data, the NPP-VIIRS data feature a higher spatial resolution (15 arc-second, about 500 m) than the DMSP-OLS data (30 arc-second, about 1,000 m). Second, the NPP-VIIRS data do not have the issue of over-saturation existing in the DMSP-OLS data, since a wider radiometric detection range has been used. The VIIRS day/night band on Suomi NPP has a specified dynamic range of approximately seven orders of magnitude from 3 × 10⁻⁹ W·cm−2·sr−1 to 0.02 W·cm−2·sr−1 [39]. Third, The NPP-VIIRS data employ onboard calibration (not available for the DMSP-OLS data) which increases the data quality. More details are available in [45]. Li et al. [17] employed NPP-VIIRS data to estimate gross regional products (GRP) in China and demonstrated that the data have a strong capacity in modeling regional economic indicators at the national scale. However, to the best of our knowledge, few studies have been conducted to investigate the potential of NPP-VIIRS nighttime light data for estimating GDP and EPC at multiple scales. In addition, there is still a lack of comparison between the GDP and EPC estimation using NPP-VIIRS data and the estimation using DMSP-OLS data. Therefore, a comprehensive assessment of the advantages of the new dataset to estimate such socioeconomic indicators would provide a better understanding of the data quality, as well as support further analysis in future research.
This study aims to investigate the potential of NPP-VIIRS data for estimating GDP and EPC in provincial and prefecture units of mainland China. The structure of the paper is organized as follows. A detailed description of study area and data will be presented in Section 2. The data processing and linear regression methods used in this study will be described in Section 3. We will then present the estimation results and discuss the advantages and limits of NPP-VIIRS data in modeling GDP and EPC at multiple scales. Finally, we summarize results and draw conclusions in the last section.

2. Case Study Area and Data

2.1. Case Study Area: Mainland China

This study takes mainland China as the case study area. Hong Kong, Macao, and Taiwan are not included in this research due to the lack of relevant statistical data. Since the economic reform and the adoption of open-door policy in 1979, China has been undergoing rapid economic development. The GDP of China keeps on increasing in the last several decades at an unprecedented high speed. Meanwhile, the EPC of China continues increasing as well, providing support to the economic activities.
The administrative divisions of mainland China contain five levels; there is a level for the province, prefecture, county, township, and village. The provincial level is the highest level of administrative division. There are 31 provincial-level divisions, including 22 provinces, four municipalities (Beijing, Shanghai, Tianjin, and Chongqing), and five autonomous regions. Generally, a province consists of several prefectural-level units, and a prefecture includes several counties. This study employs provincial and prefectural levels to perform a multi-scale analysis. At the provincial level, all the provincial units are included in our analysis. At the prefectural level, 268 out of 333 prefectures in mainland China are selected for this study. The 268 prefectures belong to 27 provincial units. The areas of the prefectural divisions in municipalities are much smaller than those in provinces and autonomous regions, and cannot be accurately identified from nighttime light data. Consequently, all the prefectural divisions of four municipalities are neglected in the prefectural-level analysis. Other neglected prefectural units are located in western China due to a lack of their GDP and EPC statistical data.

2.2. Data Collections

The only available composite NPP-VIIRS nighttime light data of the year 2012 were obtained from website of NOAA/NGDC ( http://ngdc.noaa.gov/eog/viirs/download_viirs_ntl.html) [44]. Unlike DMSP-OLS data, the NPP-VIIRS data have not been filtered to remove light detections associated with fires, gas flares, volcanoes or aurora. Also, the background noise has not been subtracted. For example, the weak light reflected by snowcapped mountains and dry lake beds is recorded in the data, as well. It should be noted that there are some pixels with negative DN values in original NPP-VIIRS data. As there is no description about those pixels in the metadata of original NPP-VIIRS data, we assume the negative DN values of those pixels are caused by background noise and outliers from data processing.
The DMSP-OLS data can be divided into three types: the stable light data, the cloud-free coverage, and the data with no further filtering. Among the three types of data, the stable light data contain lights from cities, towns and other sites with persistent lighting, and have removed ephemeral events (e.g., fires, gas flares, volcanoes and background noise) [46,47]. In September 2013, NOAA/NGDC updated Version 4 DMSP-OLS Nighttime Lights Time Series dataset, and provided the stable light datasets from 1992 to 2012. Since the NPP-VIIRS data were only available for the year 2012, we use the DMSP-OLS stable light data of the year 2012 in this study (available at http://ngdc.noaa.gov/eog/dmsp/downloadV4composites.html).
The boundary data of administrative divisions of mainland China, including national, provincial, and prefectural boundaries, were obtained from the National Geomatics Center of China. The nighttime light images of China were extracted from the global datasets of NPP-VIIRS data (Figure 1) and DMSP-OLS data (Figure 2) by using a mask polygon of the national boundary of China with a 50 km buffer. All the data were projected into the Lambert Azimuthal Equal Area Projection and resampled to the spatial resolution of 500 m × 500 m (cell size).
The GDP and EPC statistical data for provincial and prefectural units in China were obtained from the China Statistical Yearbook and the China City Statistical Yearbook. Unfortunately, GDP and EPC data of the year 2012 are not available yet. The GDP data of the year 2011 for provincial and prefectural units, the EPC data of the year 2011 for provincial unit, and the EPC data of the year 2010 for prefectural units were adopted as alternatives.
Three scenes of Landsat 8 OLI-TIRS images (free of cloud) are used to provide a visual evaluation for the quality of nighttime light data in this study. Two images were acquired on 14 April 2013, and another one was acquired on 21 April 2013. These images were downloaded from the Geospatial Data Cloud ( http://www.gscloud.cn/). They cover three cities at the prefectural level in China, including Chengdu (the capital of Sichuan Province in western China), Wuhan (the capital of Hubei Province in central China), and Nanjing (the capital of Jiangsu Province in eastern China).

3. Methods

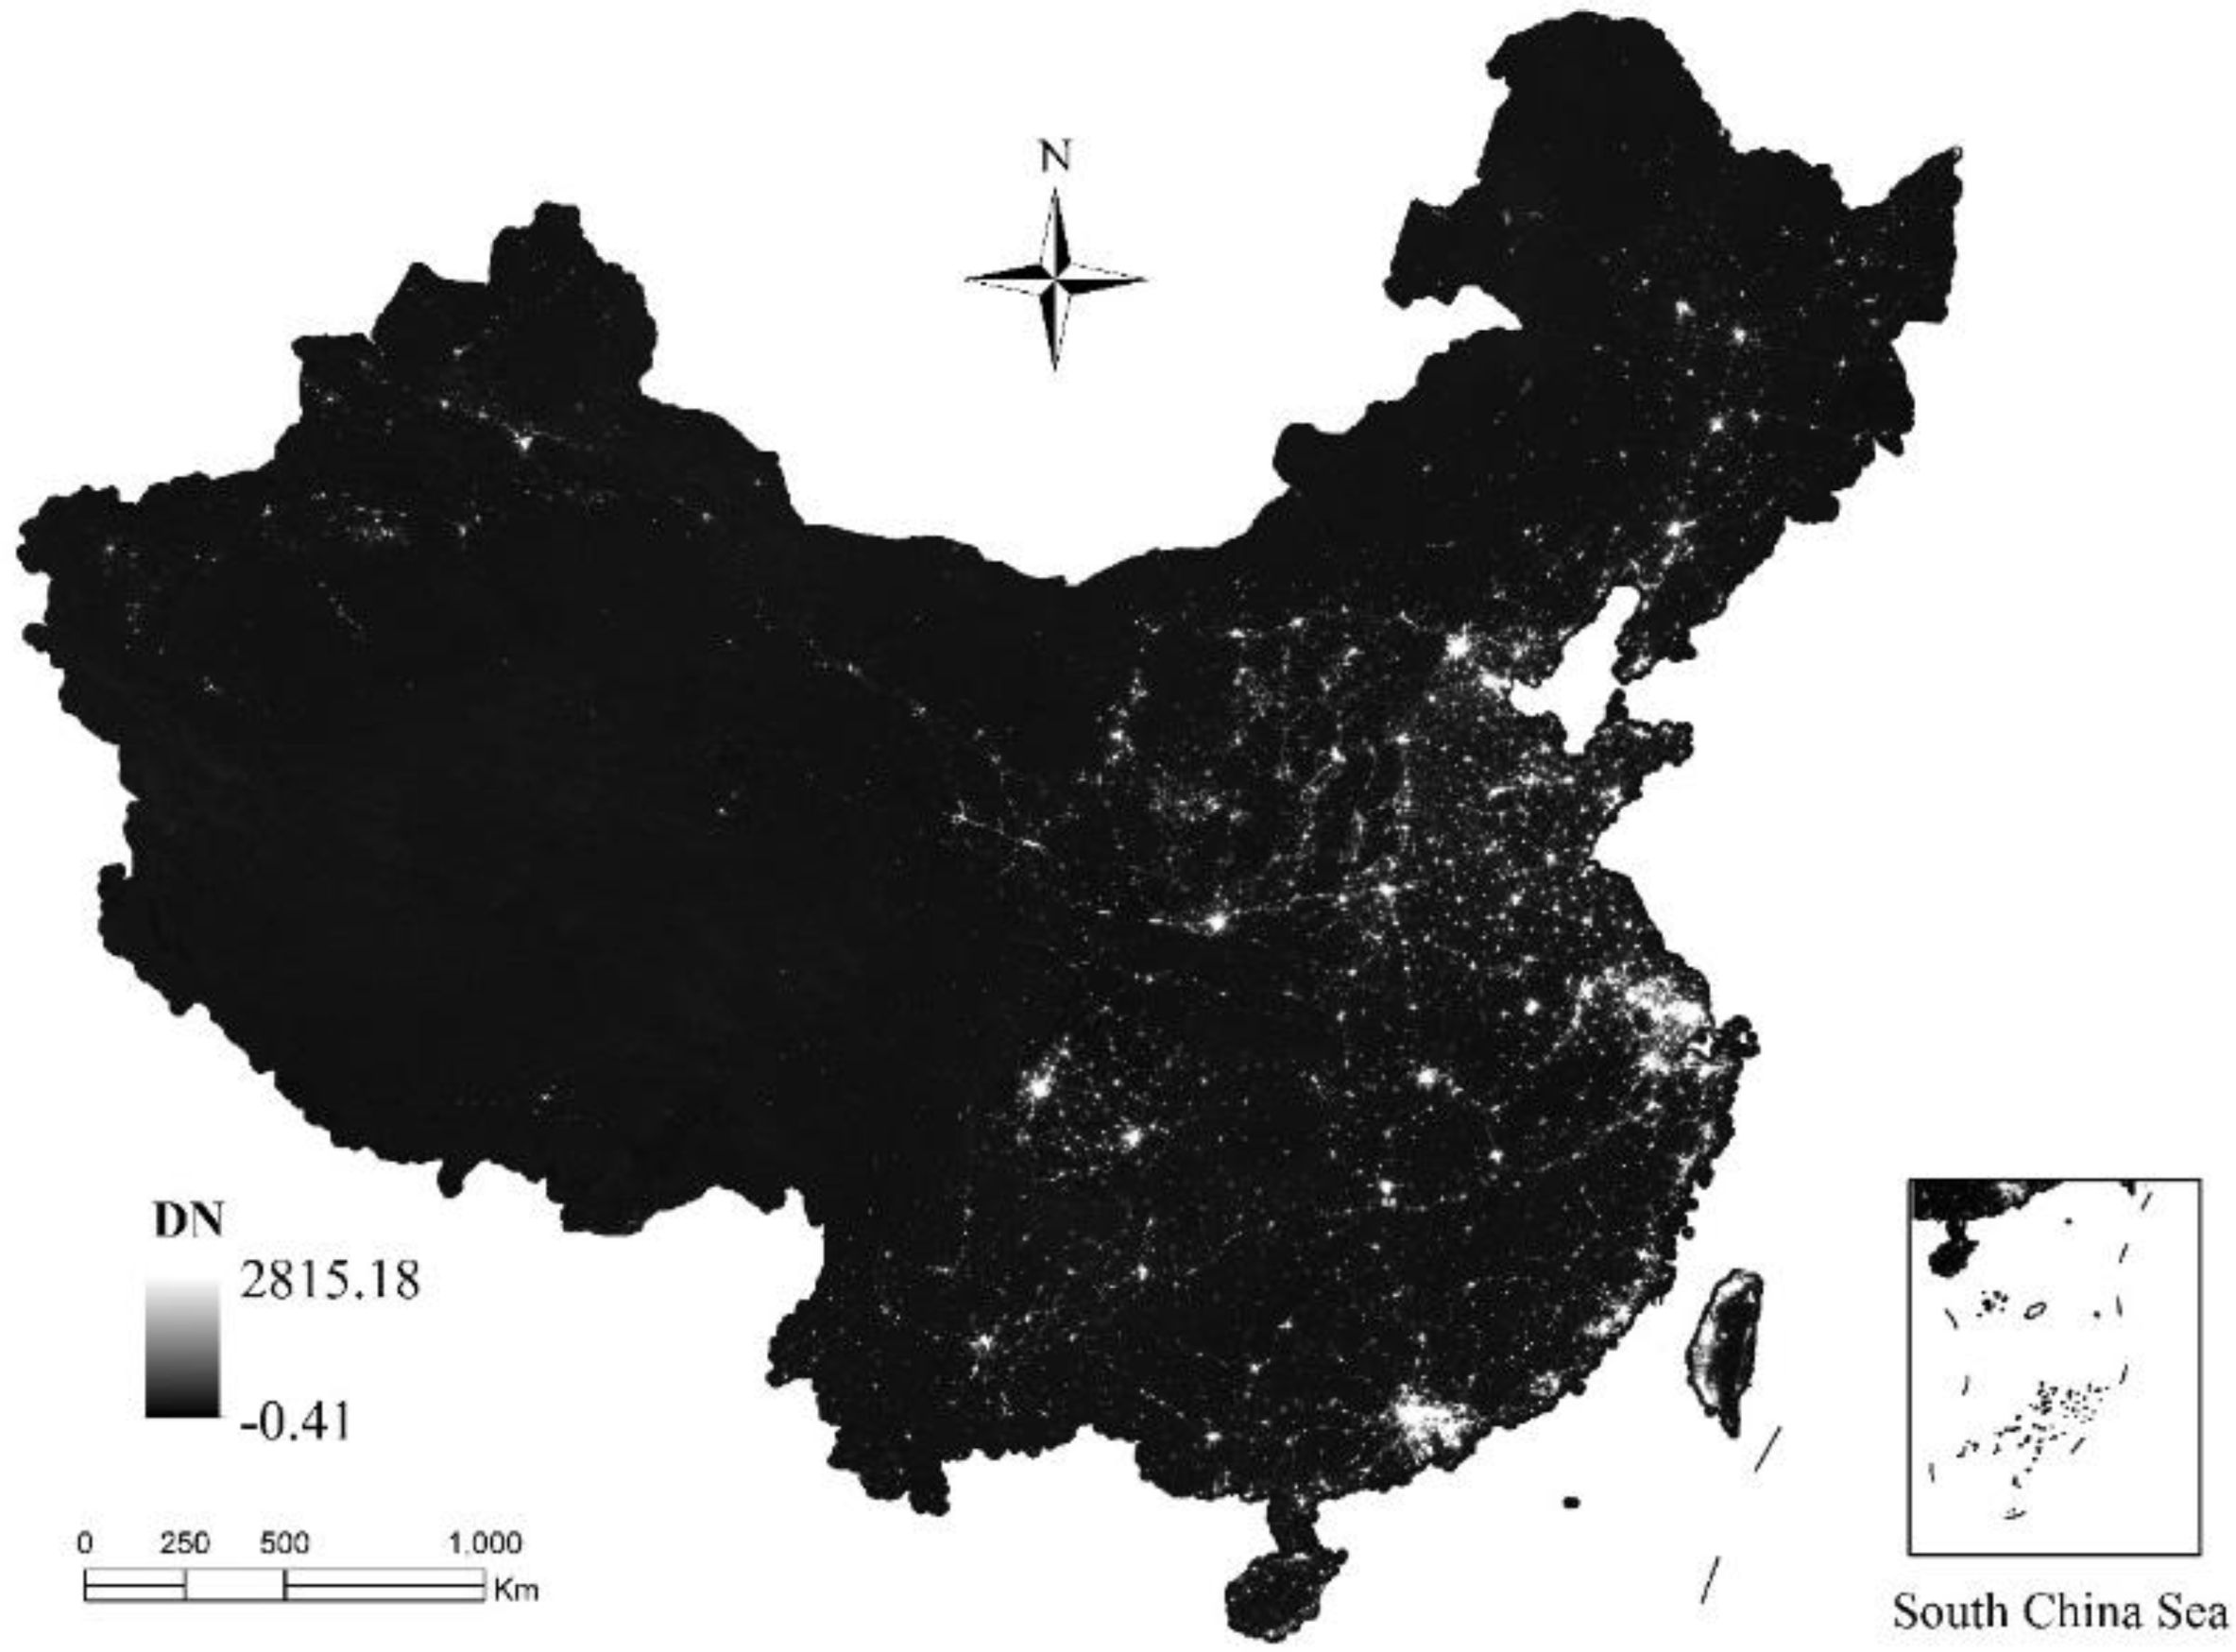
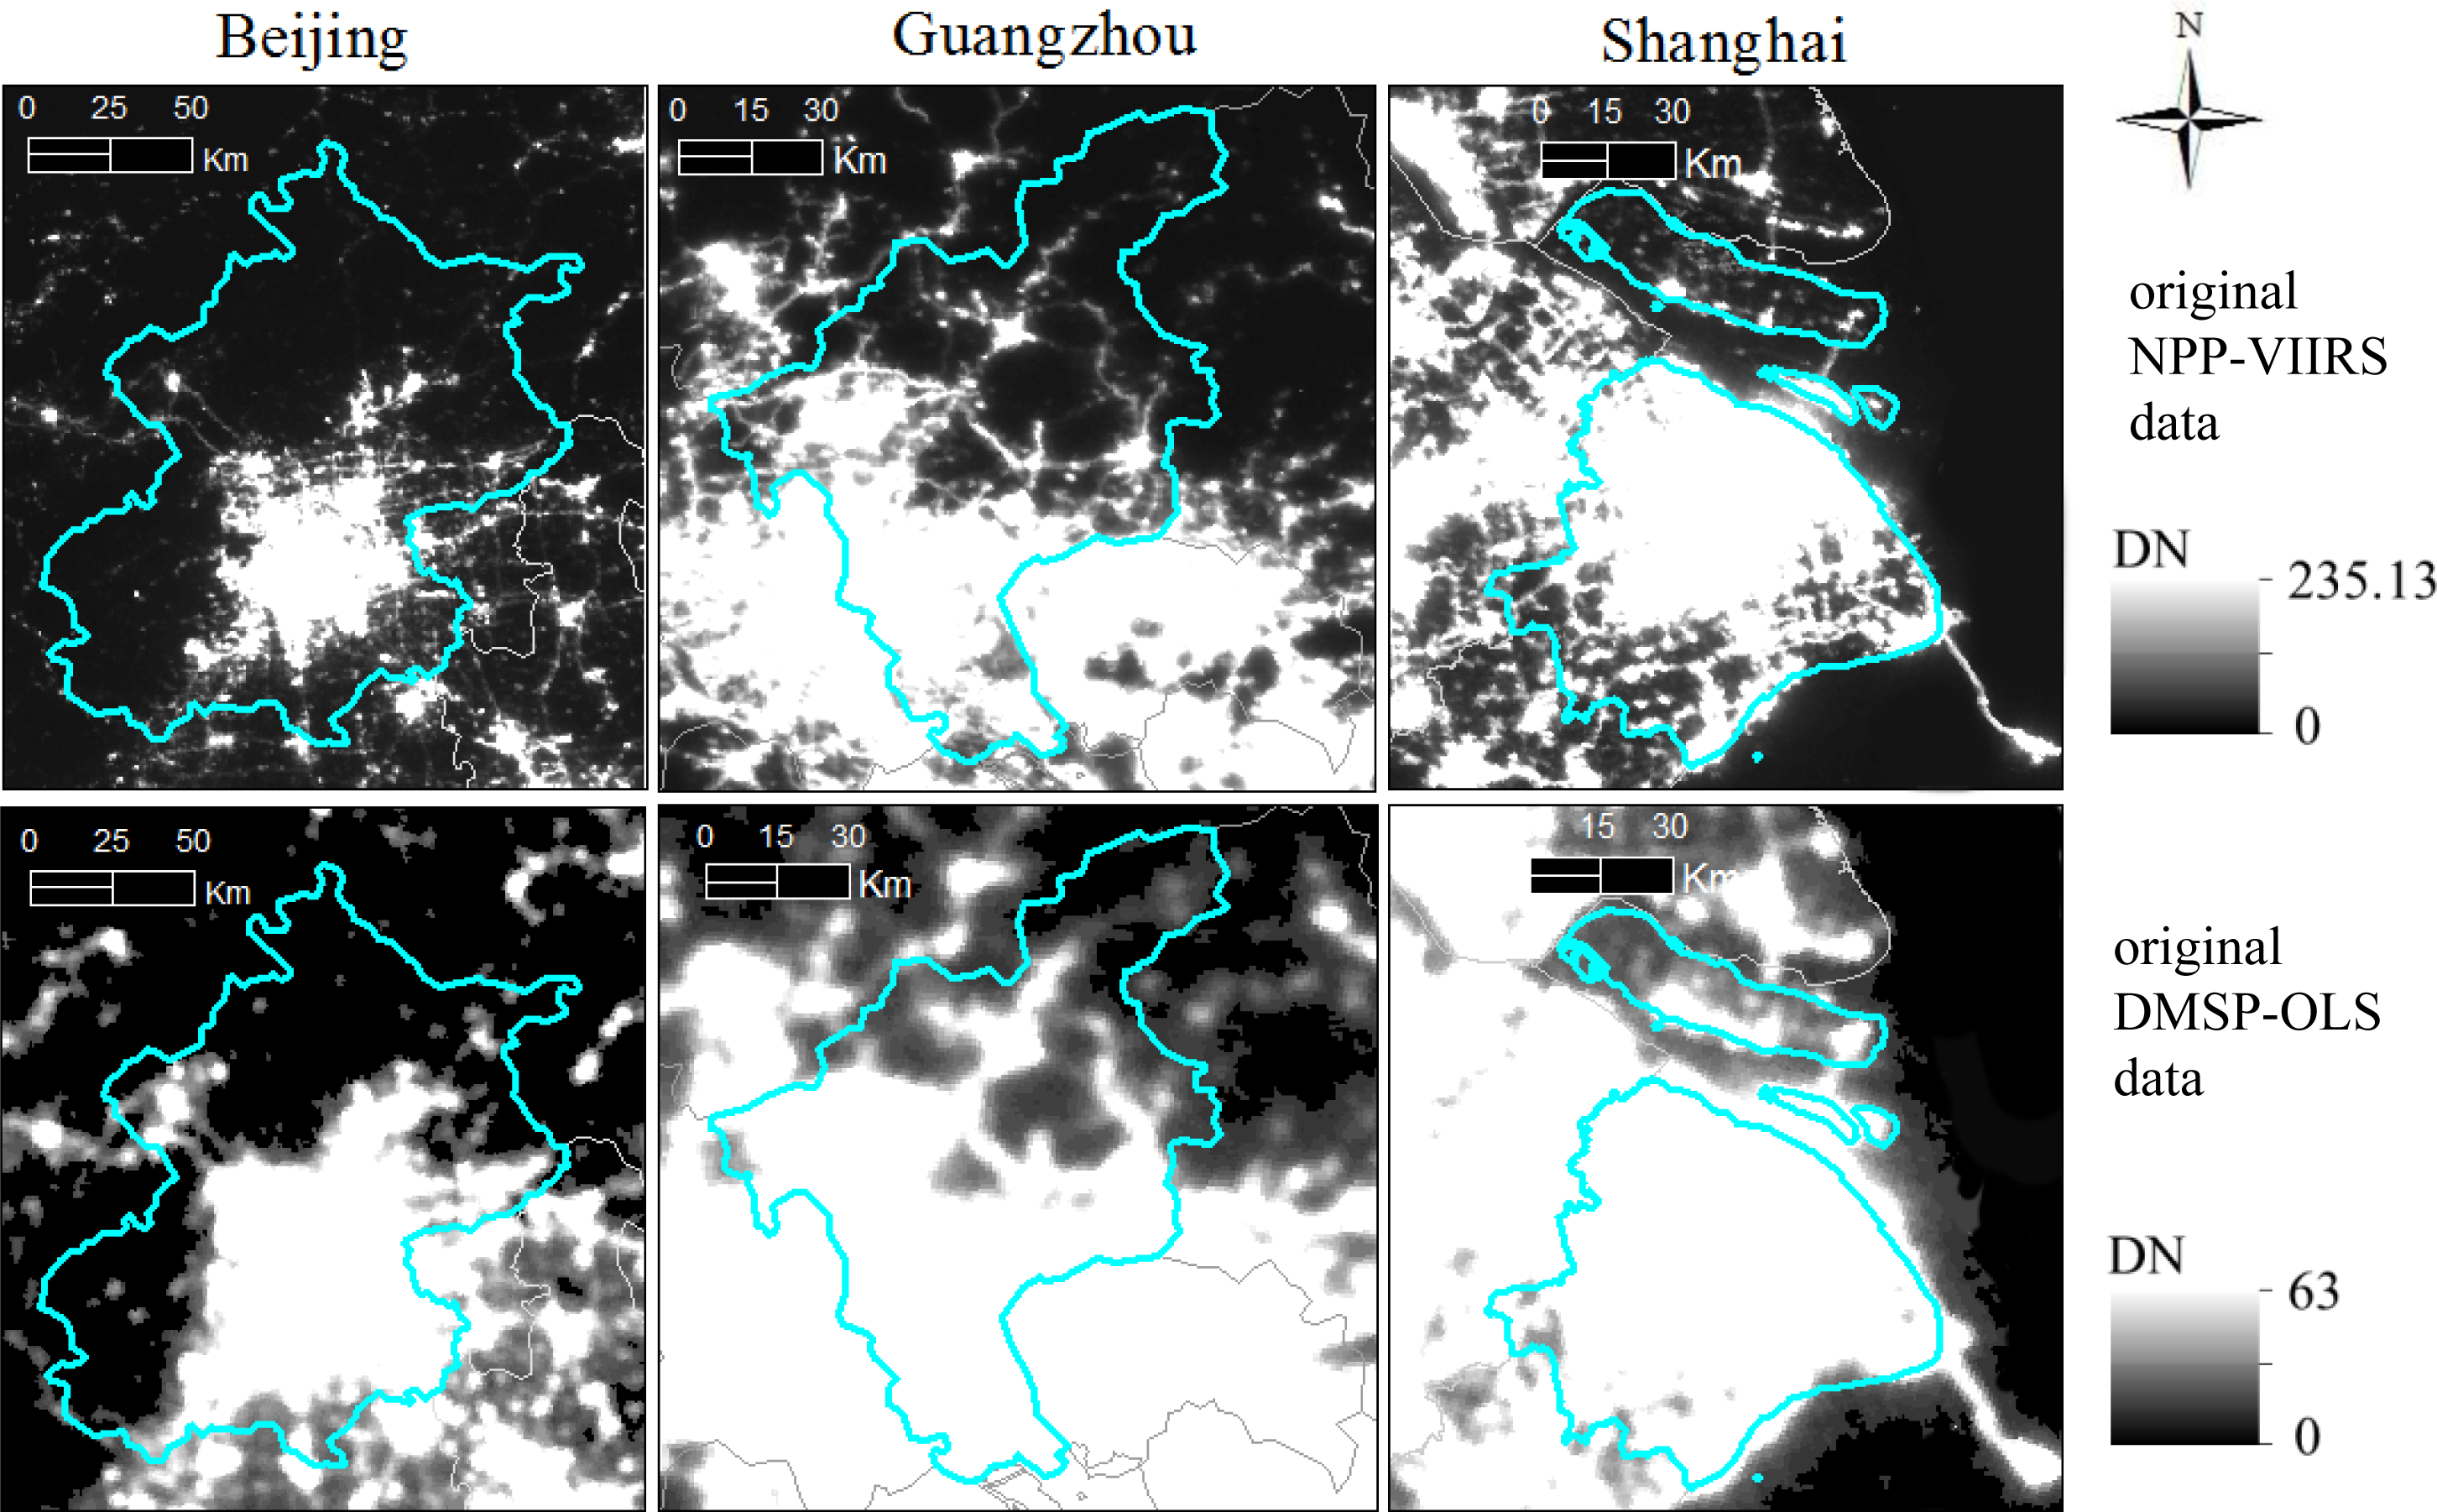
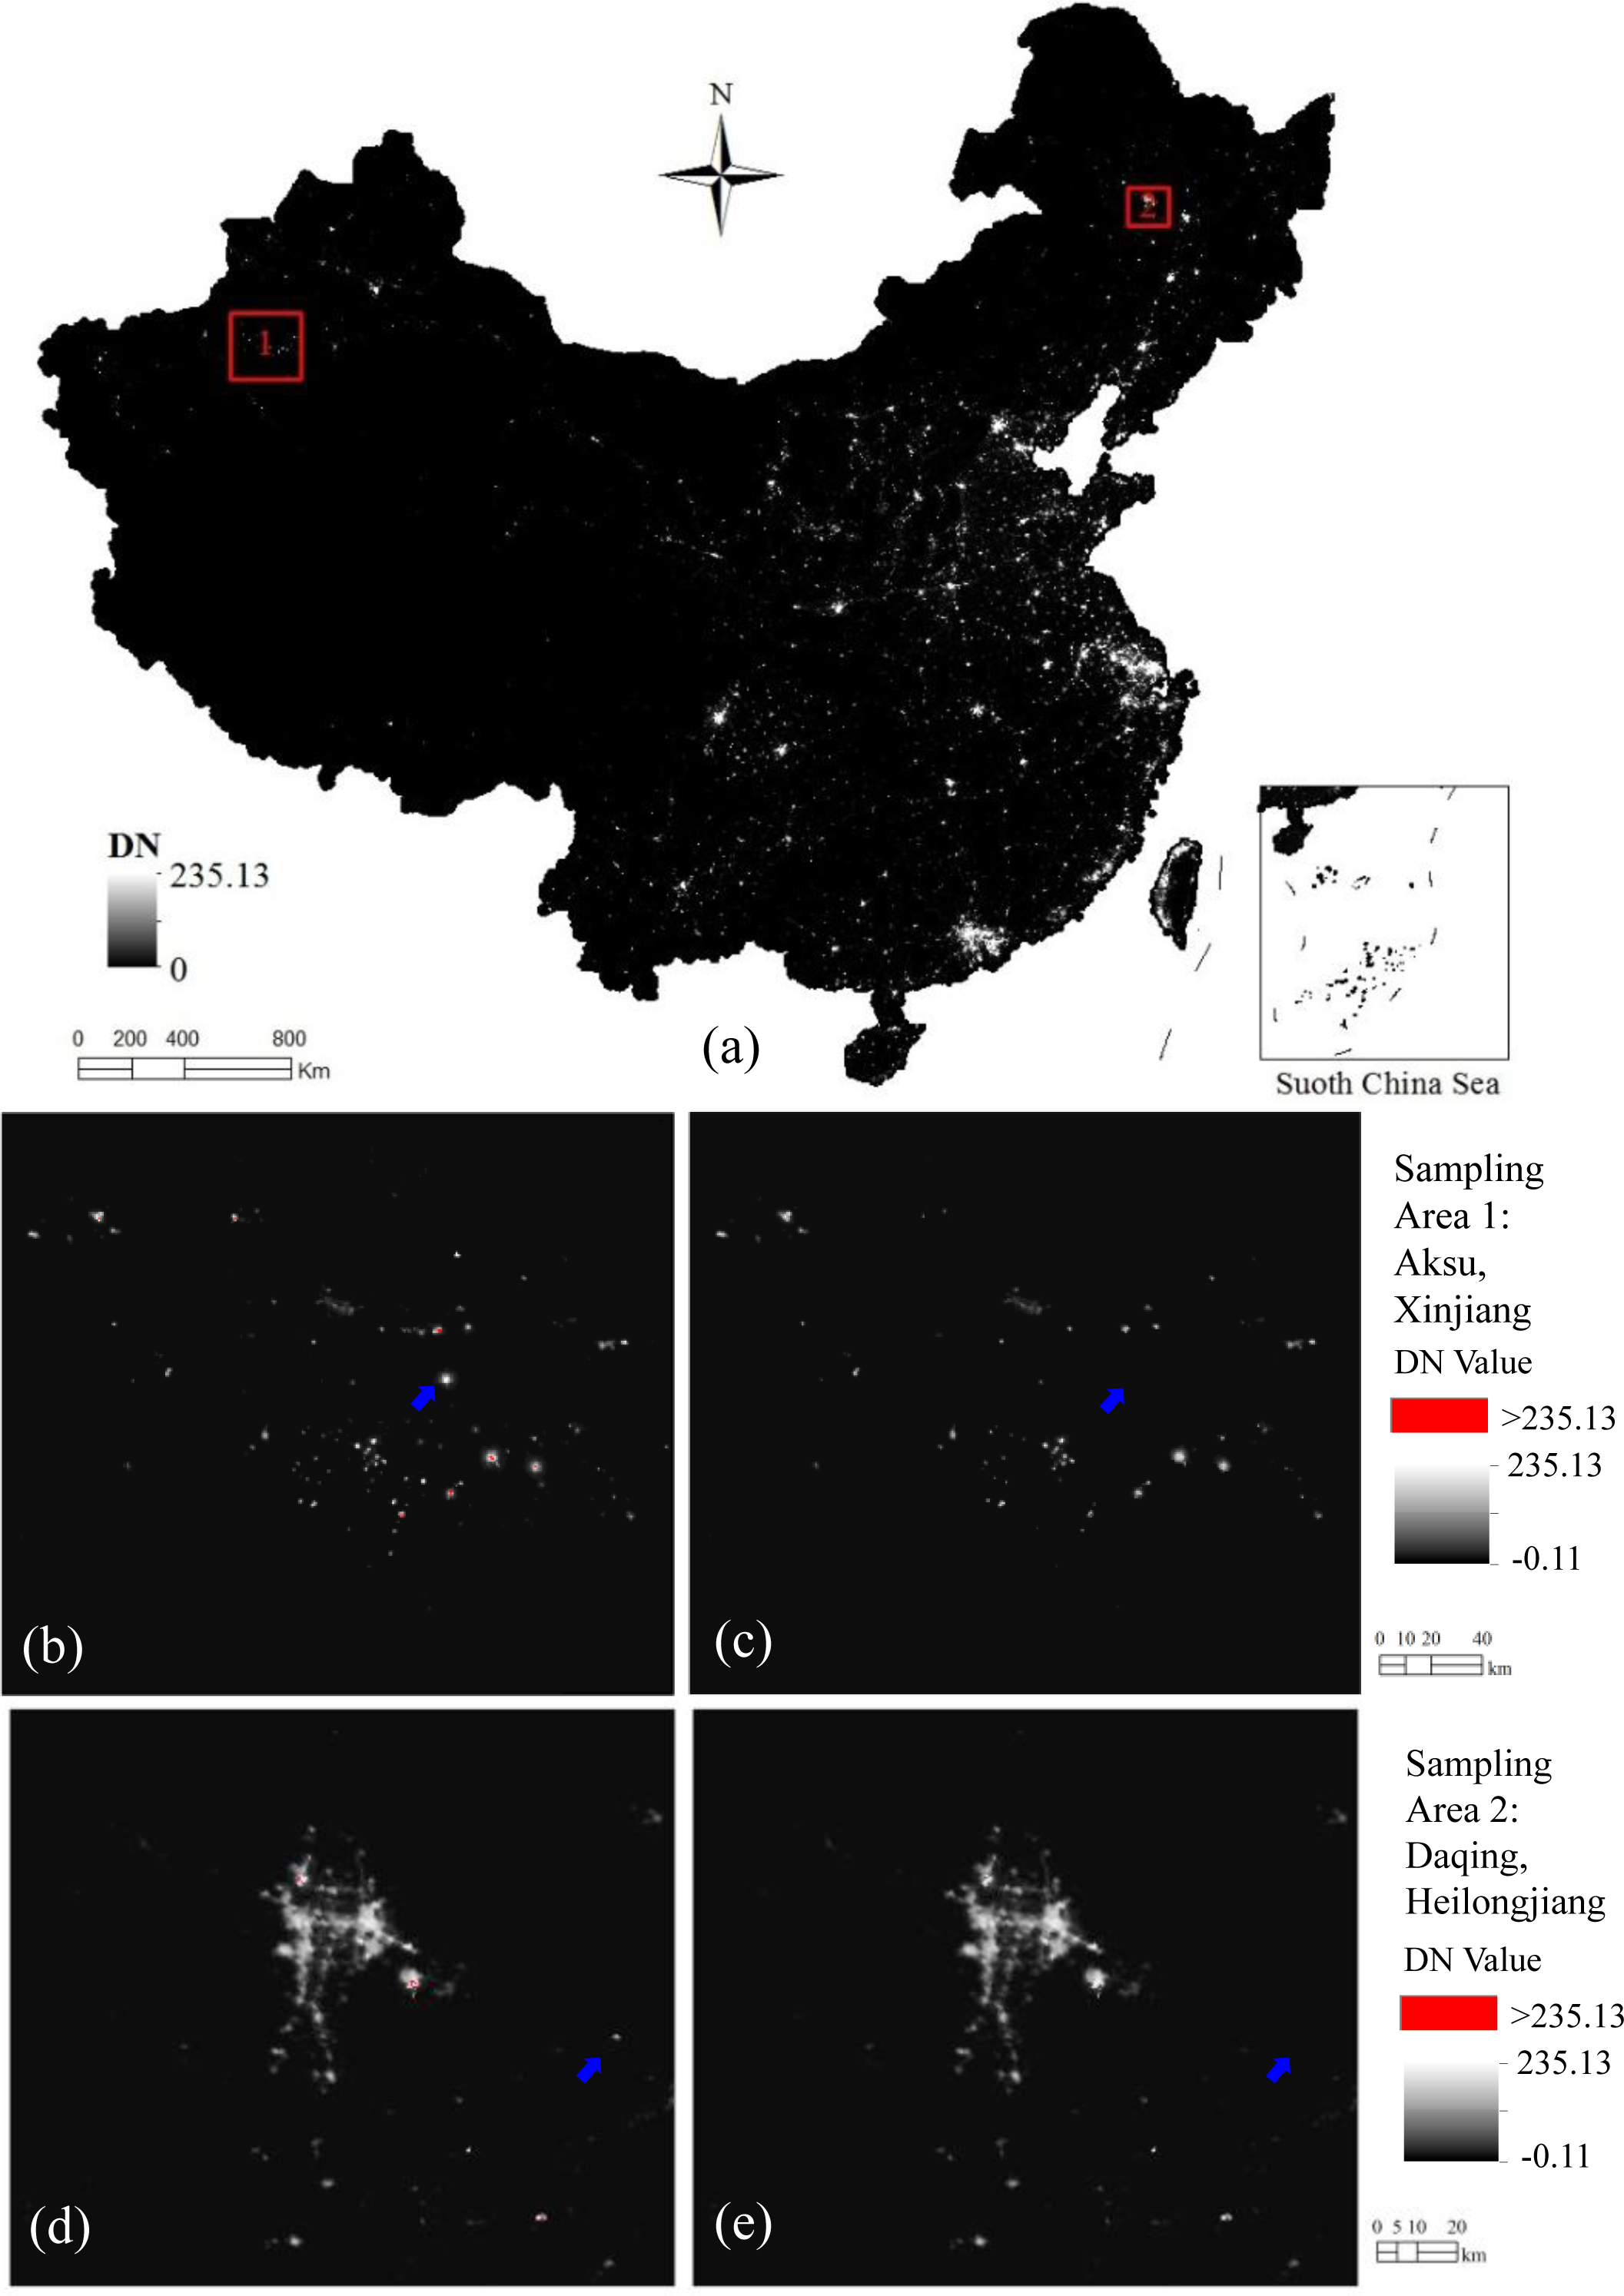
3.1. Correction of the NPP-VIIRS Nighttime Light Data

As was already mentioned, the released NPP-VIIRS nighttime light data have not been filtered to remove light detections associated with fires, gas flares, volcanoes and background noise. Such data noise can limit the accuracy and reliability in GDP and EPC estimation. Therefore, a sequence of preprocessing procedures are used to reduce those negative factors.
There are two kinds of pixels in nighttime light data. The pixels with DN value of 0 represent dark background, and other pixels with positive DN values represent the lit areas. Li et al. [17] used a hypothesis that the lit areas in 2010 and 2012 are the same and thus generated a mask with all pixels with positive DN values from the DMSP-OLS data in 2010 and then multiplied the NPP-VIIRS image by the mask to derive denoised NPP-VIIRS data. A similar assumption, but with more more up-to-date DMSP-OLS data, is adopted in our study. We assume that the lit areas in the 2012 NPP-VIIRS data and the 2012 DMSP-OLS stable light data were one in the same. Based on this assumption, we extract the pixels whose DN values are positive from the DMSP-OLS data in 2012. We then overlay the extracted pixels with 2012 NPP-VIIRS data to find the corresponding pixels in the same locations. Those pixels in 2012 NPP-VIIRS data are extracted to generate an initial corrected image. Unlike Li et al. [17], we preserve DN values of the extracted pixels in 2012 NPP-VIIRS data rather than multiplying them by the extracted pixels from the DMSP-OLS data image. In addition, the pixels with negative DN values in NPP-VIIRS data are assigned to 0.
The initial corrected data could already provide a fair performance for GDP and EPC estimation, but we still detect a few outliers in northeast and western China by a visual inspection. The outliers are probably caused by the stable lights from fires of oil or gas wells located in those areas. Since Beijing, Shanghai, and Guangzhou are the three biggest and most developed cities in China, the pixel values of the other areas should not exceed those of the three megacities theoretically (Figure 3). The highest DN value of those three megacities is 235.13, which is used as a threshold to correct the outliers. Each pixel whose DN value is larger than 235.13 in the NPP-VIIRS data is assigned as a new value. The new value is the maximal DN value within the pixel’s immediate eight neighbors. If DN values of the immediate eight neighbors are all larger than 235.13, the maximal DN value of eight neighbors for each pixel in the immediate eight-neighbor area will be selected. After this process, all the pixel values in the corrected NPP-VIIRS data are less than 235.13. The total lit area removed from the original NPP-VIIRS image was 11,419.75 km2.

3.2. Linear Regression Model

A number of methods, such as linear regression models [25,48,49], log–log regression models [50], and a second-order regression models [10], have been used to estimate GDP and EPC using nighttime light data. Among these methods, linear regression models are relatively accurate and easy to implement. Therefore, a linear regression model [49] is used in this study (Equation (1)).
G = w L + c
where G is the statistical data (GDP or EPC) of an administrative unit, L denotes the total nighttime light (TNL), which is measured by the sum value of all pixels in the corresponding administrative region [49], w is the regression coefficient, and c denotes the intercept determined by the regression analysis based on the sample pixels. The linear regression is performed for 31 provincial units and 268 prefectural units in China.

4. Results

4.1. Correction Results of the NPP-VIIRS Nighttime Light Data

Figure 4a showed the corrected NPP-VIIRS data of mainland China. Two sampling areas bounded by red rectangles in Figure 4a were magnified in Figure 4b–e to illustrate the corrected results. As can be seen from Figure 4, our proposed data correction method removed some lit areas in the original NPP-VIIRS data. The sampling area No. 1 in Figure 4 was located in Aksu city, Xinjiang Province (northwest China). Some bright areas located in the desert (Figure 4b) had become dim in the corrected data (Figure 4c). It must be noted that the removed lit area pointed at by a blue arrow in Figure 4b was an oil refinery located in the desert. The light in the original data was caused by an oil fire at the refinery. Other removed lit areas in the corrected data were the reflected light of dry riverbed, lakes, and desert. The sampling area No. 2 in Figure 4 was located at Daqing city, in the province of Heilongjiang (northeast China). The lit area pointed at by the blue arrow in Figure 4d was an oilfield, which had been removed in the corrected image (Figure 4e). The comparison results showed our proposed data correction method could remove some noises in the original NPP-VIIRS data. The corrected data should be more reliable for the GDP and ECP estimation.

4.2 Regression Results

4.2.1. Regression Results at the Provincial Level

Through the linear regressions, the TNL-GDP relationship and the TNL-EPC relationship at the provincial level were evaluated (Figure 5). At the provincial level, the R2 value of the TNL from corrected NPP-VIIRS data and GDP was 0.8702 (Figure 5a), whereas that of the TNL from DMSP-OLS data and GDP was 0.7315 (Figure 5c). In addition, the R2 value of the TNL from original NPP-VIIRS and GDP was as low as 0.1224 (Figure 5e). The R2 value of the TNL from corrected NPP-VIIRS data with EPC was 0.8961 (Figure 5b), which was higher than that value from DMSP-OLS data with EPC (0.8208, see Figure 5d). The R2 value of the TNL from the original NPP-VIIRS and EPC was the lowest value (0.1832, see Figure 5f) in all the provincial-level regression results. The results showed that the corrected NPP-VIIRS data could better reflect GDP and EPC in the provincial units than both DMSP-OLS data and original NPP-VIIRS data.
The relative error had been used to further assess the capacity of the corrected NPP-VIIRS data in estimating GDP and EPC. Table 1 showed that both the corrected NPP-VIIRS and the DMSP-OLS data had varied predictability in different provincial units. For instance, the relative error of the predicted GDP derived from the DMSP-OLS data in Xinjiang and Liaoning were 185.9% and −0.6% respectively, which were considerably different, while the maximum and minimum relative error produced by the corrected NPP-VIIRS data were 167.7% and −0.4% in Xinjiang and Sichuan, respectively. The high relative error of estimated GDP in Xinjiang is mainly caused by the lights from the desert. Although our proposed method had removed some noise, it was still very difficult to distinguish the real lights lit in the urbanized regions from the lights lit by other manmade structures or reflected by some special earth surfaces.
A similar issue had been observed in the relative error of the predicted EPC derived from the DMSP-OLS data in Tibet and Henan, which were 430.0% and 0.7%, respectively. In comparison, the counterparts of the predicted EPC derived from the corrected NPP-VIIRS data were 1.0% (Guangdong) and 415.5% (Tibet), whereby the differences were smaller.
We also divided the relative errors into three classes: 0–30% as high accuracy, 30%–50% as moderate accuracy and >50% as inaccuracy (Table 2). There were 19 provincial units with high accuracy in the 31 regions (61.29%) when GDP was predicted from the corrected NPP-VIIRS data. The corrected NPP-VIIRS data showed a high capacity in predicting GDP and EPC, with 61.29% and 70.97% as the percentages of high accuracies, respectively. These two values were higher than the percentages summarized from the relative errors of the DMSP-OLS data. Moreover, the percentages of inaccurate prediction for GDP and EPC using the corrected NPP-VIIRS (22.58% and 19.35%) were lower than those using the DMSP-OLS data (38.71% and 25.81%). In summary, the comparative analysis of R2 values and relative errors had confirmed that the NPP-VIIRS data was more reliable in estimating GDP and EPC than the DMSP-OLS data at the provincial level.

4.2.2. Regression Results at the Prefectural Level

Linear regressions had also been applied to all 268 selected prefectural-level units of mainland China to evaluate the TNL-GDP relationship and the TNL-EPC relationship, as shown in Figure 6. At the prefectural level, the R2 value of the TNL from corrected NPP-VIIRS data and GDP was 0.8088 (Figure 6a), whereas that of the TNL from DMSP-OLS data and GDP was 0.6644 (Figure 6c). In addition, the R2 value of the TNL from original NPP-VIIRS and GDP was 0.5735 (Figure 6e). The R2 value of the TNL from corrected NPP-VIIRS data with EPC was 0.5114 (Figure 6b), which was higher than that value from DMSP-OLS data with EPC (0.3019, see Figure 6d) and that value from the original NPP-VIIRS and EPC (0.3810, see Figure 6f). Although the R2 values were relatively low, they all passed the F-test at the 0.001 level.
To further verify the relationship of different nighttime light data for GDP and EPC at prefectural level, a series of linear regressions were developed in prefectural units of each province. For most of the prefectural units in Xinjiang, Tibet, Qinghai, and Hainan had no statistical data of GDP and EPC, only 23 provinces were selected as a sample dataset. As listed in Table 3, the average R2 value of the corrected NPP-VIIRS data with GDP was 0.829, whereas that of the DMSP-OLS data was 0.545. With regard to EPC, the average R2 was 0.626 for the corrected NPP-VIIRS data, which was higher than the R2 from the DMSP-OLS data (0.345). In addition, the TNL-GDP relationships of 19 provinces derived from the corrected NPP-VIIRS data had passed the F-test at the 0.001 level, which comprised 82.61% of all provinces in the sample dataset. This value was significantly higher than that of the DMSP-OLS data, which was only 65.21% of all provinces that passed the test. In addition, there were 11 linear regressions of provinces that had passed the F-test at the 0.001 level in the TNL-EPC relationship using the corrected NPP-VIIRS data. This number was higher than that of the DMSP-OLS data, which had only five linear regressions that passed the test.

5. Discussion

The regression results show the corrected NPP-VIIRS nighttime light data have a better performance in estimating GDP and EPC than the DMSP-OLS data at both the provincial and prefectural levels. The better estimated results mainly benefit from the higher resolution and radiometric detection range of NPP-VIIRS nighttime light data. This could be easily discovered from a visual comparison among DMSP-OLS data, NPP-VIIRS data, and a fine-resolution reference, Landsat 8 OLI-TIRS images, for three different cities in China (Figure 7). It should be noted that since Landsat 7 Enhanced Thematic Mapper Plus (ETM+) images of 2012 have banded noise, the newly released Landsat 8 OLI-TIRS images of 2013 are a better choice to be the reference data. Moreover, considering that the temporal difference between Landsat 8 OLI-TIRS images of 2013 and nighttime light data of 2012 is slight, we believe that an observation among them can be used to compare the spatial consistency of urban areas in two types of nighttime light data. The three sampling cities include Chengdu (located in western China), Wuhan (located in central China), and Nanjing (located in eastern China). The lit areas of the three cities spread out the urban built-up areas (see Landsat 8 images) considerably, regardless of the developed levels and locations of the cities. In addition, the regions of water bodies and urban forests in Wuhan and Nanjing are also illuminated in DMSP-OLS data. This “blooming” phenomenon was also reported by other researchers [51,52] and would obstruct a better estimation of socioeconomic indicators from DMSP-OLS data. On the contrary, the NPP-VIIRS data can display the patterns of urban built-up areas which compares to the Landsat 8 OLI-TIRS images. As one can see from Figure 7, the approximate boundaries of rivers and lakes can be identified in the NPP-VIIRS data. Unlike the DMSP-OLS data, the DN values of the pixels in NPP-VIIRS data located at the central areas of those cities are no longer identically 63. The varied DN values in NPP-VIIRS data can reflect human activities and support a more accurate GDP and EPC estimation.
Although the high resolution and wide radiometric detection range benefit the GDP and EPC estimation, the noise in the first global NPP-VIIRS nighttime light data affects the accuracy of the estimation at multiple scales. As shown in Figure 5 and Figure 6, the R2 value of the TNL from the original NPP-VIIRS data with either GDP or EPC is much lower than corresponding estimated values by using corrected NPP-VIIRS data. Our method for NPP-VIIRS data preprocessing can significantly reduce the negative effects caused by the brightness from oilfield, dry riverbed, and desert, which is still recorded in the raw NPP-VIIRS data. Meanwhile, some researchers (e.g., [17,31]) have proposed some methods for detecting wildfires or removing the noise from NPP-VIIRS data. Those efforts would help to improve the quality of the new-generation nighttime light data in future.
Due to absence of the statistical GDP and EPC in 2012, we also have to use the 2012 corrected NPP-VIIRS data to model GDP and EPC in 2011 at the provincial level. In addition, because of the same reason, we also have to use the 2012 corrected NPP-VIIRS data to model GDP in 2011 and EPC in 2010 at the prefectural level, respectively. Although there is a one-year gap between the corrected NPP-VIIRS data and GDP and EPC at the provincial level, the corrected NPP-VIIRS data demonstrated a good performance in modeling GDP and EPC. At the prefectural level, the corrected NPP-VIIRS data could also have a correlation in modeling GDP. However, as there is the two-year gap between the corrected NPP-VIIRS data and EPC at the prefectural level, the corrected NPP-VIIRS data are not perfectly correlated with the EPC. In fact, other studies also used nighttime light images and statistical data in different years for the regression analysis, also due to unavailable data [19]. We can thus infer that using the corrected NPP-VIIRS data to model GDP and EPC in the same year could produce more accurate results.
In addition, the modeled GDP and EPC are lower than the actual socioeconomic data (GDP and EPC) in some provincial-level units, such as Chongqing, Guangxi, Hebei, Henan, Hubei, Hunan, Jiangxi and Shandong (Table 1). These provincial-level units are medium-developed regions in mainland China. The utilization of a sole regression model for estimating the GDP and EPC of all the provinces is liable to underestimating the socioeconomic indicators in those regions. In that circumstance, an appropriate subdivision of provincial-level units into several regions could help improve the estimate accuracy [19]. Meanwhile, estimated results of several provinces, such as Xinjiang, Tibet, Yunnan, Shaanxi, and Heilongjiang, are much higher than the statistics data (Table 1). Because there are many dry riverbeds, deserts, and snowy mountains in those regions, this overestimation may be ascribed to the negative effects caused by the background noises of NPP-VIIRS data. Although our corrected method has removed 11,419.75 km2 lit areas and decreased 6,257,364 TNL value in mainland China (see Table 4), the residual noise still affects the estimated accuracy. The total nighttime light (TNL) of some provinces in western China (such as Xinjiang, Yunnan, and Tibet) are still high, as shown in Table 4.
Although the corrected NPP-VIIRS nighttime light data have improved the accuracy of GDP and EPC estimation, the proposed models still contain some uncertainty, caused by the following factors. First, even though many studies have proven the nighttime light images can be used to estimate GDP, EPC, and other socioeconomic variables [811,1620], the relationship between the TNL and those variables is an empirical relationship which cannot be viewed as an absolute law. Second, the reliability of statistical data is a key factor affecting the modeling accuracy since such data are the basis for the linear regressions. Third, the NPP-VIIRS nighttime light data released by NOAA/NGDC are raw data in which noise still exists. Thus, there is still room for improving the data quality, and more methods could be applied to the data correction process (such as [17,31]). In addition, other techniques, such as application of the entropy-based approach [53] could also be applied to make a prediction of GDP and EPC using NPP-VIIRS nighttime light data.

6. Conclusions

The nighttime light data records artificial light on the Earth’s surface and can be used to represent human activities and estimate socioeconomic indicators. Traditionally, the DMSP-OLS stable nightlight data are the only effective nighttime light data to estimate GDP and EPC. In early 2013, the first global NPP-VIIRS nighttime light data were released by the Earth Observation Group. As a new-generation nighttime light data, NPP-VIIRS data have a higher spatial resolution and a wider radiometric detection range compared with the DMSP-OLS data. At the same time, the noise in the original NPP-VIIRS nighttime light data still affects the accuracy of the estimation at multiple scales considerably. In this study, a sequence of preprocessing procedures is used to reduce the negative impacts from the background noise of the original data. The results prove that our proposed method is effective for reducing the negative effects caused by the lights from oilfield, dry riverbed, and desert in the original NPP-VIIRS data and can provide a more reliable dataset for the GDP and EPC estimation.
Through a case study of mainland China, this research investigates the ability of NPP-VIIRS data to estimate GDP and EPC at two levels: provincial and prefectural. The linear regression analysis results reveal that the corrected NPP-VIIRS data have better performance in estimating GDP and EPC than the DMSP-OLS data. At the provincial level, the R2 values of the corrected NPP-VIIRS data with GDP and EPC are 0.8702 and 0.8961, respectively, which are higher than those values of the DMSP-OLS data (0.7315 and 0.8208). In the provincial-level divisions, over 60% and 70% administrative units have high-accuracy estimated results of GDP and EPC, respectively. At the prefectural level, the R2 of the corrected NPP-VIIRS data with GDP is 0.8088, while that of the DMSP-OLS data is 0.6644. With respect to EPC, the R2 of NPP-VIIRS data is as low as 0.5144, which is still higher than the R2 value (0.3019) from the DMSP-OLS data. The estimation of different nighttime light data for GDP and EPC of prefectural-level units in each province also shows that the corrected NPP-VIIRS nighttime light data have a better performance in estimating GDP than EPC than the DMSP-OLS data at the prefecture level. The average R2 values of the corrected NPP-VIIRS data with GDP and EPC are higher than those values with DMSP-OLS data. In conclusion, the results prove that the corrected NPP-VIIRS data are more reliable for estimating GDP and EPC than the DMSP-OLS data at multiple scales.
Since the NPP-VIIRS data comprise an emerging data source, all the released data are taken from one sequence of images acquired in 2012, which hinders a more comprehensive evaluation. As NOAA/NGDC may produce more and better-quality NPP-VIIRS nighttime light data in the future, we could also apply a multi-temporal analysis of the data in wider fields.

Acknowledgments

The authors thank three anonymous reviewers for their constructive comments and suggestions. This study is supported by the National Basic Research Program of China (973 Program) (Grant No. 2010CB951603), the National Natural Science Foundation of China (Grant No. 41001270), the Grant from Shanghai Key Lab for Urban Ecological Processes and Eco-Restoration (Grant No. SHUES2012A03), and the Fundamental Research Funds for the Central Universities of China.

Author Contributions

Bailang Yu and Jianping Wu conceived and supervised the research topic. Kaifang Shi and Bailang Yu proposed the methods. Kaifang Shi, Yixiu Huang, Bing Yin, Zuoqi Chen, and Liujia Chen processed the data. Kaifang Shi, Bailang Yu, and Yingjie Hu analyzed the results and write the paper.

References

  1. Duan, P. Influence of China’s population mobility on the change of regional disparity since 1978. China Popul. Resour. Environ 2008, 18, 27–33. [Google Scholar]
  2. Amaral, S.; Câmara, G.; Monteiro, A.M.V.; Quintanilha, J.A.; Elvidge, C.D. Estimating population and energy consumption in Brazilian Amazonia using DMSP night-time satellite data. Comput. Environ. Urban Syst 2005, 29, 179–195. [Google Scholar]
  3. Ma, C.; He, L. From state monopoly to renewable portfolio: Restructuring China’s electric utility. Energy Policy 2008, 36, 1697–1711. [Google Scholar]
  4. Rawski, T.G. What is happening to China’s GDP statistics? China Econ. Rev 2001, 12, 347–354. [Google Scholar]
  5. Mehrotra, A.; Pääkkönen, J. Comparing China’s GDP statistics with coincident indicators. J. Comp. Econ 2011, 39, 406–411. [Google Scholar]
  6. Michieka, N.M.; Fletcher, J.J. An investigation of the role of China’s urban population on coal consumption. Energy Policy 2012, 48, 668–676. [Google Scholar]
  7. Henderson, V.; Storeygard, A.; Weil, D.N. A bright idea for measuring economic growth. Am. Econ. Rev 2011, 101, 194–199. [Google Scholar]
  8. Elvidge, C.D.; Baugh, K.E.; Kihn, E.A.; Kroehl, H.W.; Davis, E.R.; Davis, C.W. Relation between satellite observed visible-near infrared emissions, population, economic activity and electric power consumption. Int. J. Remote Sens 1997, 18, 1373–1379. [Google Scholar]
  9. Zhao, N.; Ghosh, T.; Samson, E.L. Mapping spatio-temporal changes of Chinese electric power consumption using night-time imagery. Int. J. Remote Sens 2012, 33, 6304–6320. [Google Scholar]
  10. Townsend, A.C.; Bruce, D.A. The use of night-time lights satellite imagery as a measure of Australia’s regional electricity consumption and population distribution. Int. J. Remote Sens 2010, 31, 4459–4480. [Google Scholar]
  11. He, C.Y.; Ma, Q.; Li, T.; Yang, Y.; Liu, Z.F. Spatiotemporal dynamics of electric power consumption in Chinese Mainland from 1995 to 2008 modeled using DMSP/OLS stable nighttime lights data. J. Geogr. Sci 2012, 22, 125–136. [Google Scholar]
  12. Levin, N.; Duke, Y. High spatial resolution night-time light images for demographic and socio-economic studies. Remote Sens. Environ 2012, 119, 1–10. [Google Scholar]
  13. Colomb, R.; Alonso, C.; Nollmann, I. SAC-C mission and the international am constellation for earth observation. Acta Astronout 2003, 52, 995–1005. [Google Scholar]
  14. Letu, H.; Hara, M.; Tana, G.; Nishio, F. A saturated light correction method for DMSP/OLS nighttime satellite imagery. IEEE Trans. Geosci. Remote Sens 2012, 50, 389–396. [Google Scholar]
  15. Wu, J.; Wang, Z.; Li, W.; Peng, J. Exploring factors affecting the relationship between light consumption and GDP based on DMSP/OLS nighttime satellite imagery. Remote Sens. Environ 2013, 134, 111–119. [Google Scholar]
  16. He, C.; Shi, P.; Li, J.; Chen, J.; Pan, Y.; Li, J.; Zhuo, L.; Ichinose, T. Restoring urbanization process in China in the 1990s by using non-radiance-calibrated DMSP/OLS nighttime light imagery and statistical data. Chin. Sci. Bull 2006, 51, 1614–1620. [Google Scholar]
  17. Li, X.; Xu, H.; Chen, X.; Li, C. Potential of NPP-VIIRS nighttime light imagery for MODELING the regional economy of China. Remote Sens 2013, 5, 3057–3081. [Google Scholar]
  18. Chen, X.; Nordhaus, W.D. Using luminosity data as a proxy for economic statistics. Proc. Natl. Acad. Sci 2011, 108, 8589–8594. [Google Scholar]
  19. He, C.; Ma, Q.; Liu, Z.; Zhang, Q. Modeling the spatiotemporal dynamics of electric power consumption in Mainland China using saturation-corrected DMSP/OLS nighttime stable light data. Int. J. Digit. Earth 2013. [Google Scholar] [CrossRef]
  20. Liu, Z.; He, C.; Zhang, Q.; Huang, Q.; Yang, Y. Extracting the dynamics of urban expansion in China using DMSP-OLS nighttime light data from 1992 to 2008. Landsc. Urban Plan 2012, 106, 62–72. [Google Scholar]
  21. De Souza, C.R.; Zullo, J.; Elvidge, C. Brazil’s 2001 energy crisis monitored from space. Int. J. Remote Sens 2004, 25, 2475–2482. [Google Scholar]
  22. Propastin, P.; Kappas, M. Assessing satellite-observed nighttime lights for monitoring socioeconomic parameters in the Republic of Kazakhstan. Giscience Remote Sens 2012, 49, 538–557. [Google Scholar]
  23. Min, B.; Gaba, K.M.; Sarr, O.F.; Agalassou, A. Detection of rural electrification in Africa using DMSP-OLS night lights imagery. Int. J. Remote Sens 2013, 34, 8118–8141. [Google Scholar]
  24. Zhao, N.; Currit, N.; Samson, E. Net primary production and gross domestic product in China derived from satellite imagery. Ecol. Econ 2011, 70, 921–928. [Google Scholar]
  25. Letu, H.; Hara, M.; Yagi, H.; Naoki, K.; Tana, G.; Nishio, F.; Shuhei, O. Estimating energy consumption from night-time DMPS/OLS imagery after correcting for saturation effects. Int. J. Remote Sens 2010, 31, 4443–4458. [Google Scholar]
  26. Elvidge, C.D.; Baugh, K.E.; Dietz, J.B.; Bland, T.; Sutton, P.C.; Kroehl, H.W. Radiance calibration of DMSP-OLS low-light imaging data of human settlements. Remote Sens. Environ 1999, 68, 77–88. [Google Scholar]
  27. Yang, Y.; He, C.; Zhang, Q.; Han, L.; Du, S. Timely and accurate national-scale mapping of urban land in China using Defense Meteorological Satellite Program’s Operational Linescan System nighttime stable light data. J. Appl. Remote Sens 2013, 7. [Google Scholar] [CrossRef]
  28. Qian, Z.; Seto, K.C. Can night-time light data identify typologies of urbanization? A global assessment of successes and failures. Remote Sens 2013, 5, 3476–3494. [Google Scholar]
  29. Li, X.; Chen, F.; Chen, X. Satellite-observed nighttime light variation as evidence for global armed conflicts. IEEE J. Sel. Top. Appl. Earth Obs. Remote Sens 2013, 6, 2302–2315. [Google Scholar]
  30. Zhang, Q.; Schaaf, C.; Seto, K.C. The vegetation adjusted NTL urban index: A new approach to reduce saturation and increase variation in nighttime luminosity. Remote Sens. Environ 2013, 129, 32–41. [Google Scholar]
  31. Elvidge, C.D.; Zhizhin, M.; Hsu, F.-C.; Baugh, K.E. VIIRS nightfire: Satellite pyrometry at night. Remote Sens 2013, 5, 4423–4449. [Google Scholar]
  32. Weng, F.; Zou, X.; Wang, X.; Yang, S.; Goldberg, M.D. Introduction to Suomi national polar-orbiting partnership advanced technology microwave sounder for numerical weather prediction and tropical cyclone applications. J. Geophys. Res.: Atmos 2012. [Google Scholar] [CrossRef]
  33. Gambacorta, A.; Barnet, C.D. Methodology and information content of the NOAA NESDIS operational channel selection for the Cross-Track Infrared Sounder (CrIS). IEEE Trans. Geosci. Remote Sens 2013, 51, 3207–3216. [Google Scholar]
  34. Chen, Z.; Yu, B.; Huang, Y.; Hu, Y.; Lin, H.; Wu, J. Validation of total ozone column derived from OMPS using ground-based spectroradiometer measurements. Remote Sens. Lett 2013, 4, 937–945. [Google Scholar]
  35. Flynn, L.E.; McNamara, D.; Beck, C.T.; Petropavlovskikh, I.; Beach, E.; Pachepsky, Y.; Li, Y.P.; Deland, M.; Huang, L.K.; Long, C.S.; et al. Measurements and products from the Solar Backscatter Ultraviolet (SBUV/2) and Ozone Mapping and Profiler Suite (OMPS) instruments. Int. J. Remote Sens 2009, 30, 4259–4272. [Google Scholar]
  36. Wielicki, B.A.; Barkstrom, B.R.; Baum, B.A.; Charlock, T.P.; Green, R.N.; Kratz, D.P.; Lee, R.B.; Minnis, P.; Smith, G.L.; Wong, T.M.; et al. Clouds and the earth’s radiant energy system (CERES): Algorithm overview. IEEE Trans. Geosci. Remote Sens 1998, 36, 1127–1141. [Google Scholar]
  37. Wielicki, B.A.; Barkstrom, B.R.; Harrison, E.F.; Lee, R.B.; Smith, G.L.; Cooper, J.E. Clouds and the earth’s radiant energy system (CERES): An earth observing system experiment. Bull. Am. Meteorol. Soc 1996, 77, 853–868. [Google Scholar]
  38. Cao, C.; Xiong, J.; Blonski, S.; Liu, Q.; Uprety, S.; Shao, X.; Bai, Y.; Weng, F. Suomi NPP VIIRS sensor data record verification, validation, and long-term performance monitoring. J. Geophys. Res.: Atmos 2013, 118, 11,664–11,678. [Google Scholar]
  39. Liao, L.B.; Weiss, S.; Mills, S.; Hauss, B. Suomi NPP VIIRS Day-Night-Band (DNB) on-orbit performance. J. Geophys. Res.: Atmos 2013, 118, 705–718. [Google Scholar]
  40. Xiong, X.; Butler, J.; Chiang, K.; Efremova, B.; Fulbright, J.; Lei, N.; McIntire, J.; Oudrari, H.; Sun, J.; Wang, Z.; et al. VIIRS on-orbit calibration methodology and performance. J. Geophys. Res.: Atmos 2013. [Google Scholar] [CrossRef]
  41. Hillger, D.; Kopp, T.; Lee, T.; Lindsey, D.; Seaman, C.; Miller, S.; Solbrig, J.; Kidder, S.; Bachmeier, S.; Jasmin, T.; et al. First-Light Imagery from Suomi NPP VIIRS. Bull. Am. Meteorol. Soc 2013, 94, 1019–1029. [Google Scholar]
  42. Lee, T.E.; Miller, S.D.; Turk, F.J.; Schueler, C.; Julian, R.; Deyo, S.; Dills, P.; Wang, S. The NPOESS VIIRS day/night visible sensor. Bull. Am. Meteorol. Soc 2006, 87, 191–199. [Google Scholar]
  43. Miller, S.D.; Mills, S.P.; Elvidge, C.D.; Lindsey, D.T.; Lee, T.F.; Hawkins, J.D. Suomi satellite brings to light a unique frontier of nighttime environmental sensing capabilities. Proc. Natl. Acad. Sci. USA 2012, 109, 15706–15711. [Google Scholar]
  44. Baugh, K.; Hsu, F.-C.; Elvidge, C.D.; Zhizhin, M. Nighttime lights compositing using the VIIRS day-night band: Preliminary results. Proc. Asia Pac. Adv. Netw 2013, 35, 70–86. [Google Scholar]
  45. Elvidge, C.D.; Baugh, K.E.; Zhizhi, M.; Hsu, F.-C. Why VIIRS data are superior to DMSP for mapping nighttime lights. Proc. Asia Pac. Adv. Netw 2013, 35, 62–19. [Google Scholar]
  46. Elvidge, C.D.; Ziskin, D.; Baugh, K.E.; Tuttle, B.T.; Ghosh, T.; Pack, D.W.; Erwin, E.H.; Zhizhin, M. A fifteen year record of global natural gas flaring derived from satellite data. Energies 2009, 2, 595–622. [Google Scholar]
  47. Baugh, K.; Elvidge, C.; Ghosh, T.; Ziskin, D. Development of a 2009 stable lights product using DMSP-OLS data. Proc. Asia Pac. Adv. Netw 2010, 30, 114–130. [Google Scholar]
  48. Aldhous, P. Energy: China’s burning ambition. Nature 2005, 435, 1152–1154. [Google Scholar]
  49. Zhang, Q.; Seto, K.C. Mapping urbanization dynamics at regional and global scales using multi-temporal DMSP/OLS nighttime light data. Remote Sens. Environ 2011, 115, 2320–2329. [Google Scholar]
  50. Lo, C. Modeling the population of China using DMSP operational linescan system nighttime data. Photogramm. Eng. Remote Sens 2001, 67, 1037–1047. [Google Scholar]
  51. Small, C.; Pozzi, F.; Elvidge, C.D. Spatial analysis of global urban extent from DMSP-OLS night lights. Remote Sens. Environ 2005, 96, 277–291. [Google Scholar]
  52. Henderson, M.; Yeh, E.T.; Gong, P.; Elvidge, C.; Baugh, K. Validation of urban boundaries derived from global night-time satellite imagery. Int. J. Remote Sens 2003, 24, 595–609. [Google Scholar]
  53. Long, D.; Singh, V.P. An entropy-based multispectral image classification algorithm. IEEE Trans. Geosci. Remote Sens 2013, 51, 5225–5238. [Google Scholar]
Figure 1. The NPP-VIIRS nighttime light data of China in 2012.
Remotesensing 06 01705f1
Figure 2. The DMSP-OLS nighttime light data of China in 2012.
Remotesensing 06 01705f2
Figure 3. The original nighttime light data of Beijing, Guangzhou, and Shanghai in 2012.
Remotesensing 06 01705f3
Figure 4. (a) The corrected NPP-VIIRS nighttime light data of China in 2012. Two regions bounded by red rectangles are Aksu, Xinjiang (sampling area No. 1) and Daqing, Heilongjiang (sampling area NO.2). The (b) original and (c) corrected image of sampling area NO.1; and the (d) original and (e) corrected image of sampling area No. 2. Two typical removed lit areas are pointed by blue arrows.
Remotesensing 06 01705f4
Figure 5. The scatter diagram of linear regression analysis in provincial units: (a) the total nighttime light (TNL) of corrected NPP-VIIRS data and the gross domestic product (GDP); (b) the TNL of corrected NPP-VIIRS data and the electric power consumption (EPC); (c) the TNL of DMSP-OLS data and the GDP; (d) the TNL of DMSP-OLS data and the EPC; (e) the TNL of original NPP-VIIRS data and the GDP; (f) the TNL of original NPP-VIIRS data and the EPC.
Remotesensing 06 01705f5
Figure 6. The scatter diagram of linear regression analysis in prefectural units: (a) the total nighttime light (TNL) of corrected NPP-VIIRS data and the gross domestic product (GDP); (b) the TNL of corrected NPP-VIIRS data and the EPC; (c) the TNL of DMSP-OLS data and the GDP; (d) the TNL of DMSP-OLS data and the EPC; (e) the TNL of original NPP-VIIRS data and the GDP; (f) the TNL of original NPP-VIIRS data and the EPC.
Remotesensing 06 01705f6
Figure 7. Comparison among the DMSP-OLS data, corrected NPP-VIIRS data, and Landsat 8 OLI-TIRS images for three cities in China.
Remotesensing 06 01705f7
Table 1. Accuracy of the estimated gross domestic product (GDP) and the electric power consumption (EPC) at the provincial level by linear regression analysis. Note: GDP represents the statistical gross domestic product, EPC represents the statistical electric power consumption, PG represents the predicted GDP, PE represents the predicted EPC, and RE represents the relative error in percentage. The unit of the GDP is billion RMB, and the unit of EPC is billion·kilowatt·h−1.
Provincial-Level UnitsGDPNPP-VIIRSDMSP-OLSEPCNPP-VIIRSDMSP-OLS
PGRE(%)PGRE(%)PERE(%)PERE(%)
Anhui1,530.11,771.915.81,814.018.61,221.21,594.430.61,635.633.9
Beijing1,625.2945.5−41.8754.6−53.6821.7882.77.4683.3−16.8
Chongqing1,001.1721.7−27.9639.0−36.2717.0690.0−3.8579.3−19.2
Fujian1,756.01,932.310.01,621.9−7.61,515.91,732.414.31,462.9−3.5
Gansu502.0868.773.01,002.399.7923.4816.6−11.6905.9−1.9
Guangdong5,321.05,078.1−4.63,895.0−26.84,399.04,441.41.03,506.2−20.3
Guangxi1,172.11,135.2−3.11,325.113.11,112.21,046.0−6.01,196.17.5
Guizhou570.2675.018.4699.322.6944.1649.7−31.2633.5−32.9
Hainan252.3396.657.2518.8105.7185.3410.0121.3471.3154.4
Hebei2,451.62,383.4−2.83,230.331.82,984.92,120.9−28.92,908.7−2.6
Heilongjiang1,258.21,584.725.92,425.492.8801.91,433.178.72,185.1172.5
Henan2,693.12,410.1−10.52,973.910.42,659.12,143.9−19.42,678.20.7
Hubei1,963.21,110.2−43.51,294.8−34.01,450.81,024.5−29.41,168.8−19.4
Hunan1,967.01,009.3−48.71,075.4−45.31,293.4937.6−27.5971.6−24.9
Inner Mongolia1,436.01,736.220.92,239.355.91,864.11,563.6−16.12,017.88.2
Jiangsu4,911.05,065.03.14,095.0−16.64,281.64,430.23.53,685.9−13.9
Jiangxi1,170.3662.0−43.4934.2−20.2835.1638.6−23.5844.71.1
Jilin1,056.9976.2−7.61,189.312.5630.2909.144.31,074.070.4
Liaoning2,222.72,123.5−4.52,209.7−0.61,861.51,897.11.91,991.37.0
Ningxia210.2527.8151.1498.5137.1724.5523.0−27.8453.0−37.5
Qinghai167.0219.631.4294.276.1560.7257.6−54.1269.4−51.9
Shaanxi1,251.21,989.359.01,838.146.9982.51,781.681.31,657.268.7
Shandong4,536.23,624.9−20.14,366.6−3.73,635.33,190.0−12.23,930.18.1
Shanghai1,919.61,578.1−17.8627.4−67.31,339.61,427.46.6568.9−57.5
Shanxi1,123.81,808.660.92,118.388.51,650.41,625.9−1.51,909.115.7
Sichuan2,102.72,094.8−0.41,528.9−27.31,751.41,872.46.91,379.3−21.3
Tianjin1,130.7947.4−16.2694.0−38.6695.2884.327.2628.8−9.6
Tibet60.663.03.9134.6122.223.8122.7415.5125.9430.0
Xinjiang661.01,769.3167.71,889.7185.9839.11,592.189.71,703.6103.0
Yunnan889.31,475.465.91,585.178.21,204.11,339.011.21,429.818.8
Zhejiang3,231.93,460.17.12,631.5−18.63,116.93,048.1−2.22,370.4−23.9

Average--15.4-25.9--20.8-24.0
Table 2. Different classes of predicted accuracies for the gross domestic product (GDP) and electric power consumption (EPC) at provincial level.
DataPercentage of Relative Error (%)
InaccuracyModerate AccuracyHigh Accuracy
NPP-VIIRS and GDP22.5816.1361.29
DMSP-OLS and GDP38.7119.3541.94
NPP-VIIRS and EPC19.359.6870.97
DMSP-OLS and EPC25.819.6864.51
Table 3. R2 values and F-tests of the linear regressions analysis for prefectural units of each province. Note: Y represents the regression has passed the F-test at the 0.001 level, N represents the regression has not passed the test, GDP represents the statistical gross domestic product, EPC represents the statistical electric power consumption.
Provincial-Level UnitsNPP-VIIRS and GDPDMSP-OLS and GDPNPP-VIIRS and EPCDMSP-OLS and EPC

R2F-testR2F-testR2F-testR2F-test
Anhui0.893Y0.401N0.316N0.011N
Fujian0.965Y0.897Y0.471N0.123N
Gansu0.882Y0.739Y0.459N0.255N
Guangdong0.862Y0.604Y0.786Y0.475Y
Guangxi0.907Y0.251N0.693Y0.038N
Guizhou0.926Y0.726Y0.967Y0.830Y
Hebei0.934Y0.734Y0.751Y0.359N
Heilongjiang0.945Y0.669Y0.832Y0.431N
Henan0.952Y0.766Y0.638Y0.494N
Hubei0.973Y0.929Y0.940Y0.780Y
Hunan0.920Y0.898Y0.546N0.591N
Inner Mongolia0.595N0.115N0.248N0.052N
Jiangsu0.933Y0.797Y0.480N0.281N
Jiangxi0.315N0.192N0.020N0.001N
Jilin0.989Y0.925Y0.916Y0.944Y
Liaoning0.894Y0.831Y0.635Y0.433N
Ningxia0.163N0.005N0.050N0.087N
Shaanxi0.780Y0.546N0.293N0.042N
Shandong0.819Y0.529N0.276N0.077N
Shanxi0.544N0.038N0.026N0.068N
Sichuan0.981Y0.950Y0.814Y0.780Y
Yunnan0.961Y0.961Y0.601N0.601N
Zhejiang0.932Y0.884Y0.769Y0.634N

Average0.829-0.626-0.545-0.345-
Table 4. Decrease of the total nighttime light (TNL) value and lit area after correction.
Provincial-Level UnitsOriginal TNLCorrected TNLDecreased TNLRemoved Lit Area (km2)
Anhui443,439389,52253,917135.75
Beijing221,115214,3446,77117.75
Chongqing220,194166,90053,294118.50
Fujian478,268423,51254,756149.25
Gansu492,533198,068294,465967.25
Guangdong1,142,5401,090,34052,200112.75
Guangxi368,501254,552113,949294.00
Guizhou283,669157,000126,669365.25
Hainan107,18097,9919,1898.25
Hebei595,061519,14675,915327.25
Heilongjiang621,698349,825271,873307.75
Henan565,452524,80140,65172.25
Hubei350,886249,250101,636234.25
Hunan346,214227,859118,355261.00
Inner Mongolia1,253,380381,946871,4341,065.50
Jiangsu1,096,2001,087,5808,62023.00
Jiangxi239,534154,25485,280197.00
Jilin337,972220,850117,122411.25
Liaoning530,368464,05566,313167.25
Ningxia161,089125,79335,296159.75
Qinghai630,60360,461570,142423.75
Shaanxi546,673435,607111,066688.75
Shandong802,189782,30919,88053.75
Shanghai350,376348,4351,9412.00
Shanxi464,022397,28466,738274.75
Sichuan783,671457,960325,711899.50
Tianjin219,713214,7344,9794.00
Tibet984,28227,260957,022112.50
Xinjiang1,784,460388,9701,395,4902,749.75
Yunnan542,802326,669216,133777.00
Zhejiang777,933747,37630,55739.00

Total17,742,01711,484,6536,257,36411,419.75

