A Comparative Analysis of EO-1 Hyperion, Quickbird and Landsat TM Imagery for Fuel Type Mapping of a Typical Mediterranean Landscape


Abstract
:
1. Introduction
2. Materials and Methods
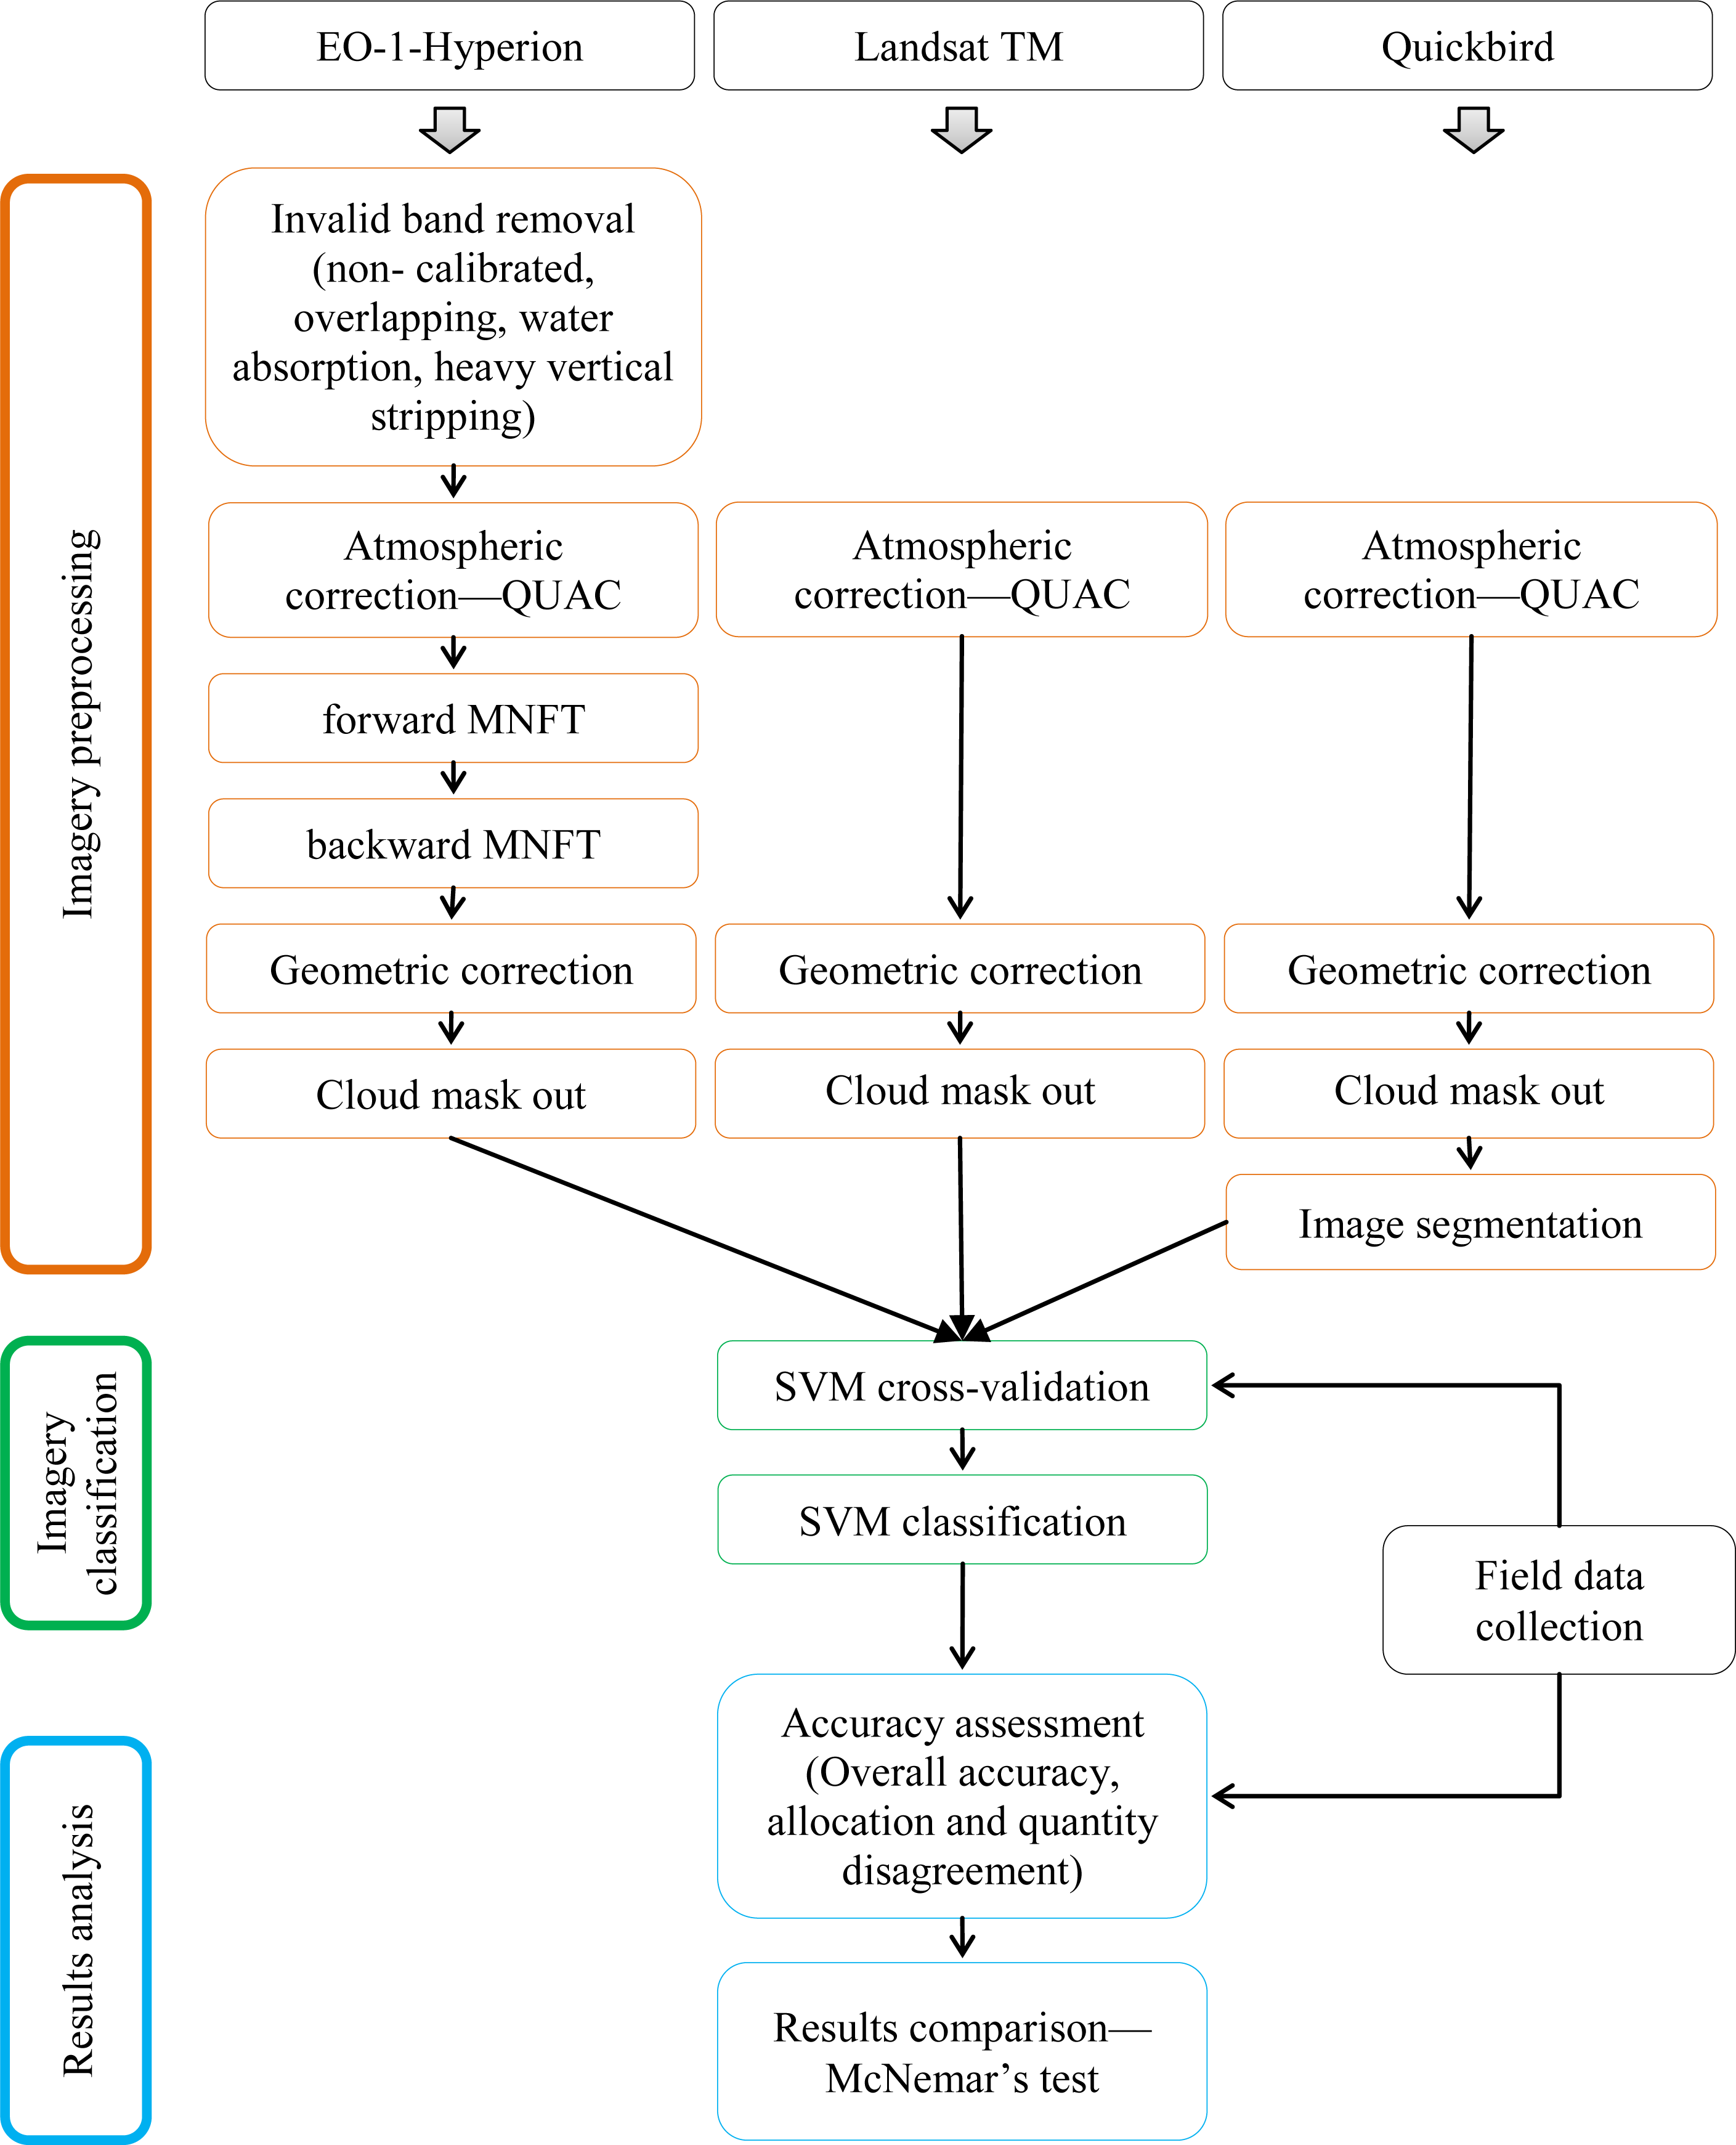
2.1. Outline of the Methodology
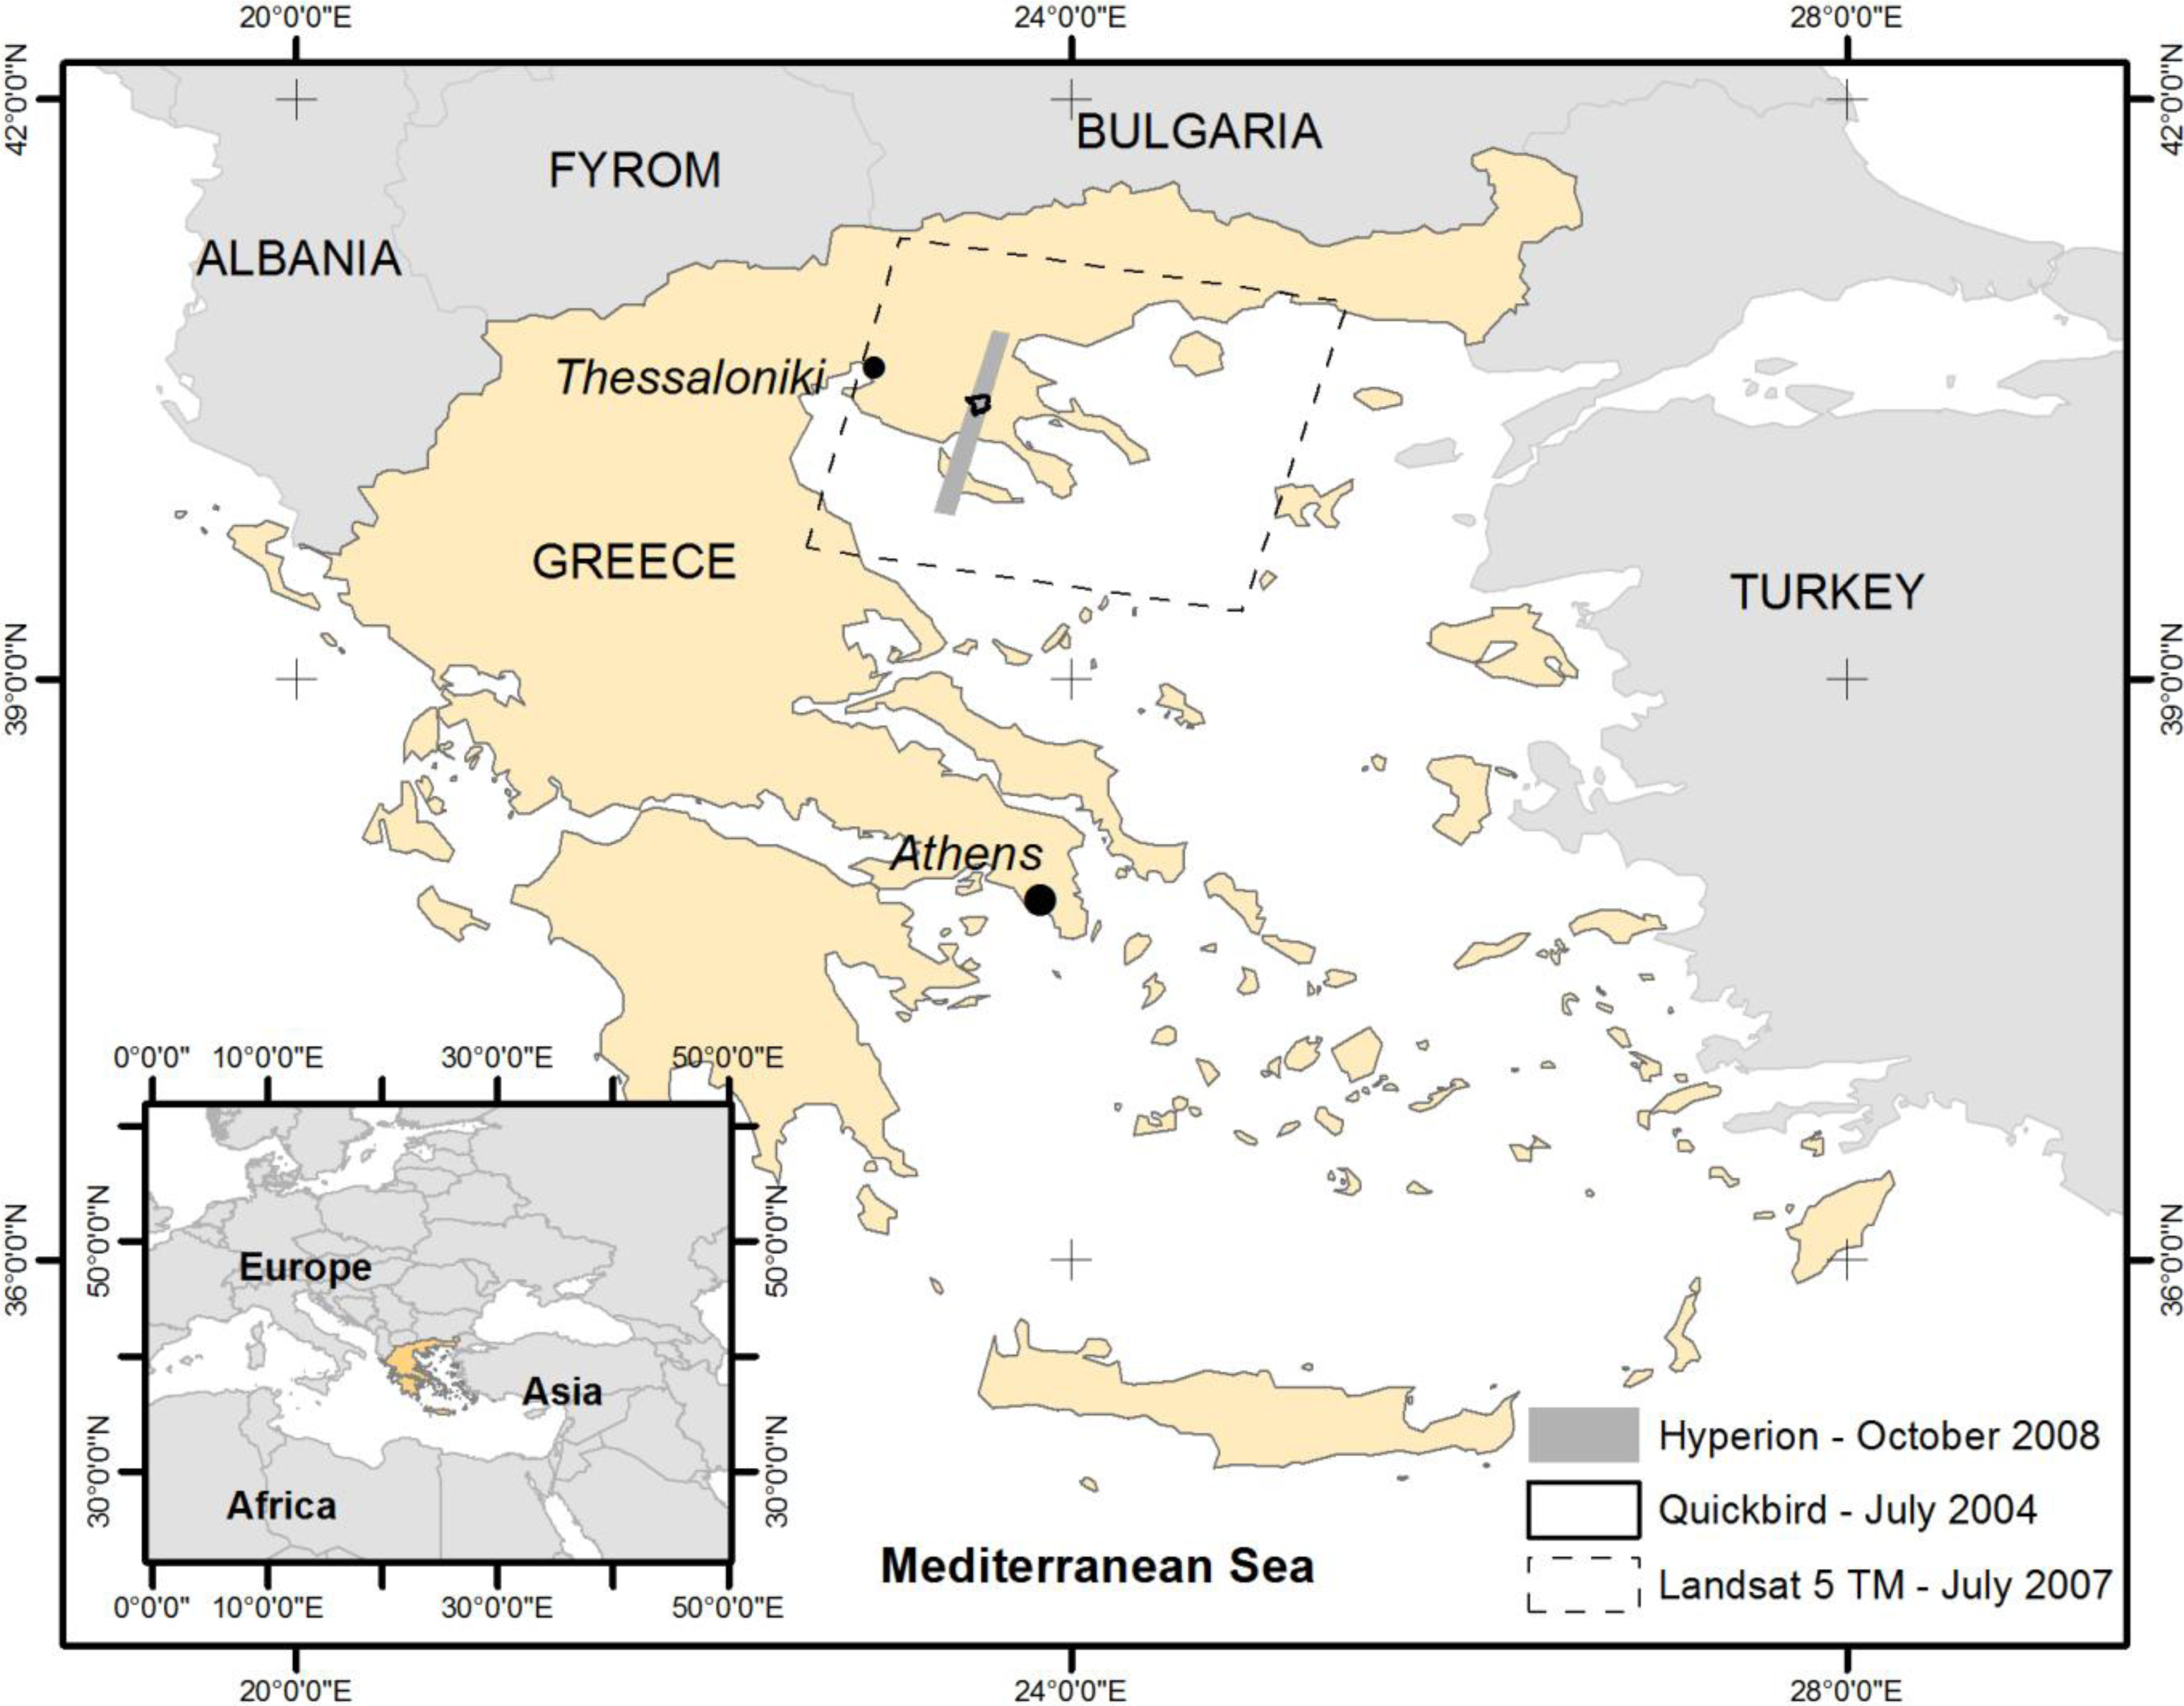
2.2. Study Area
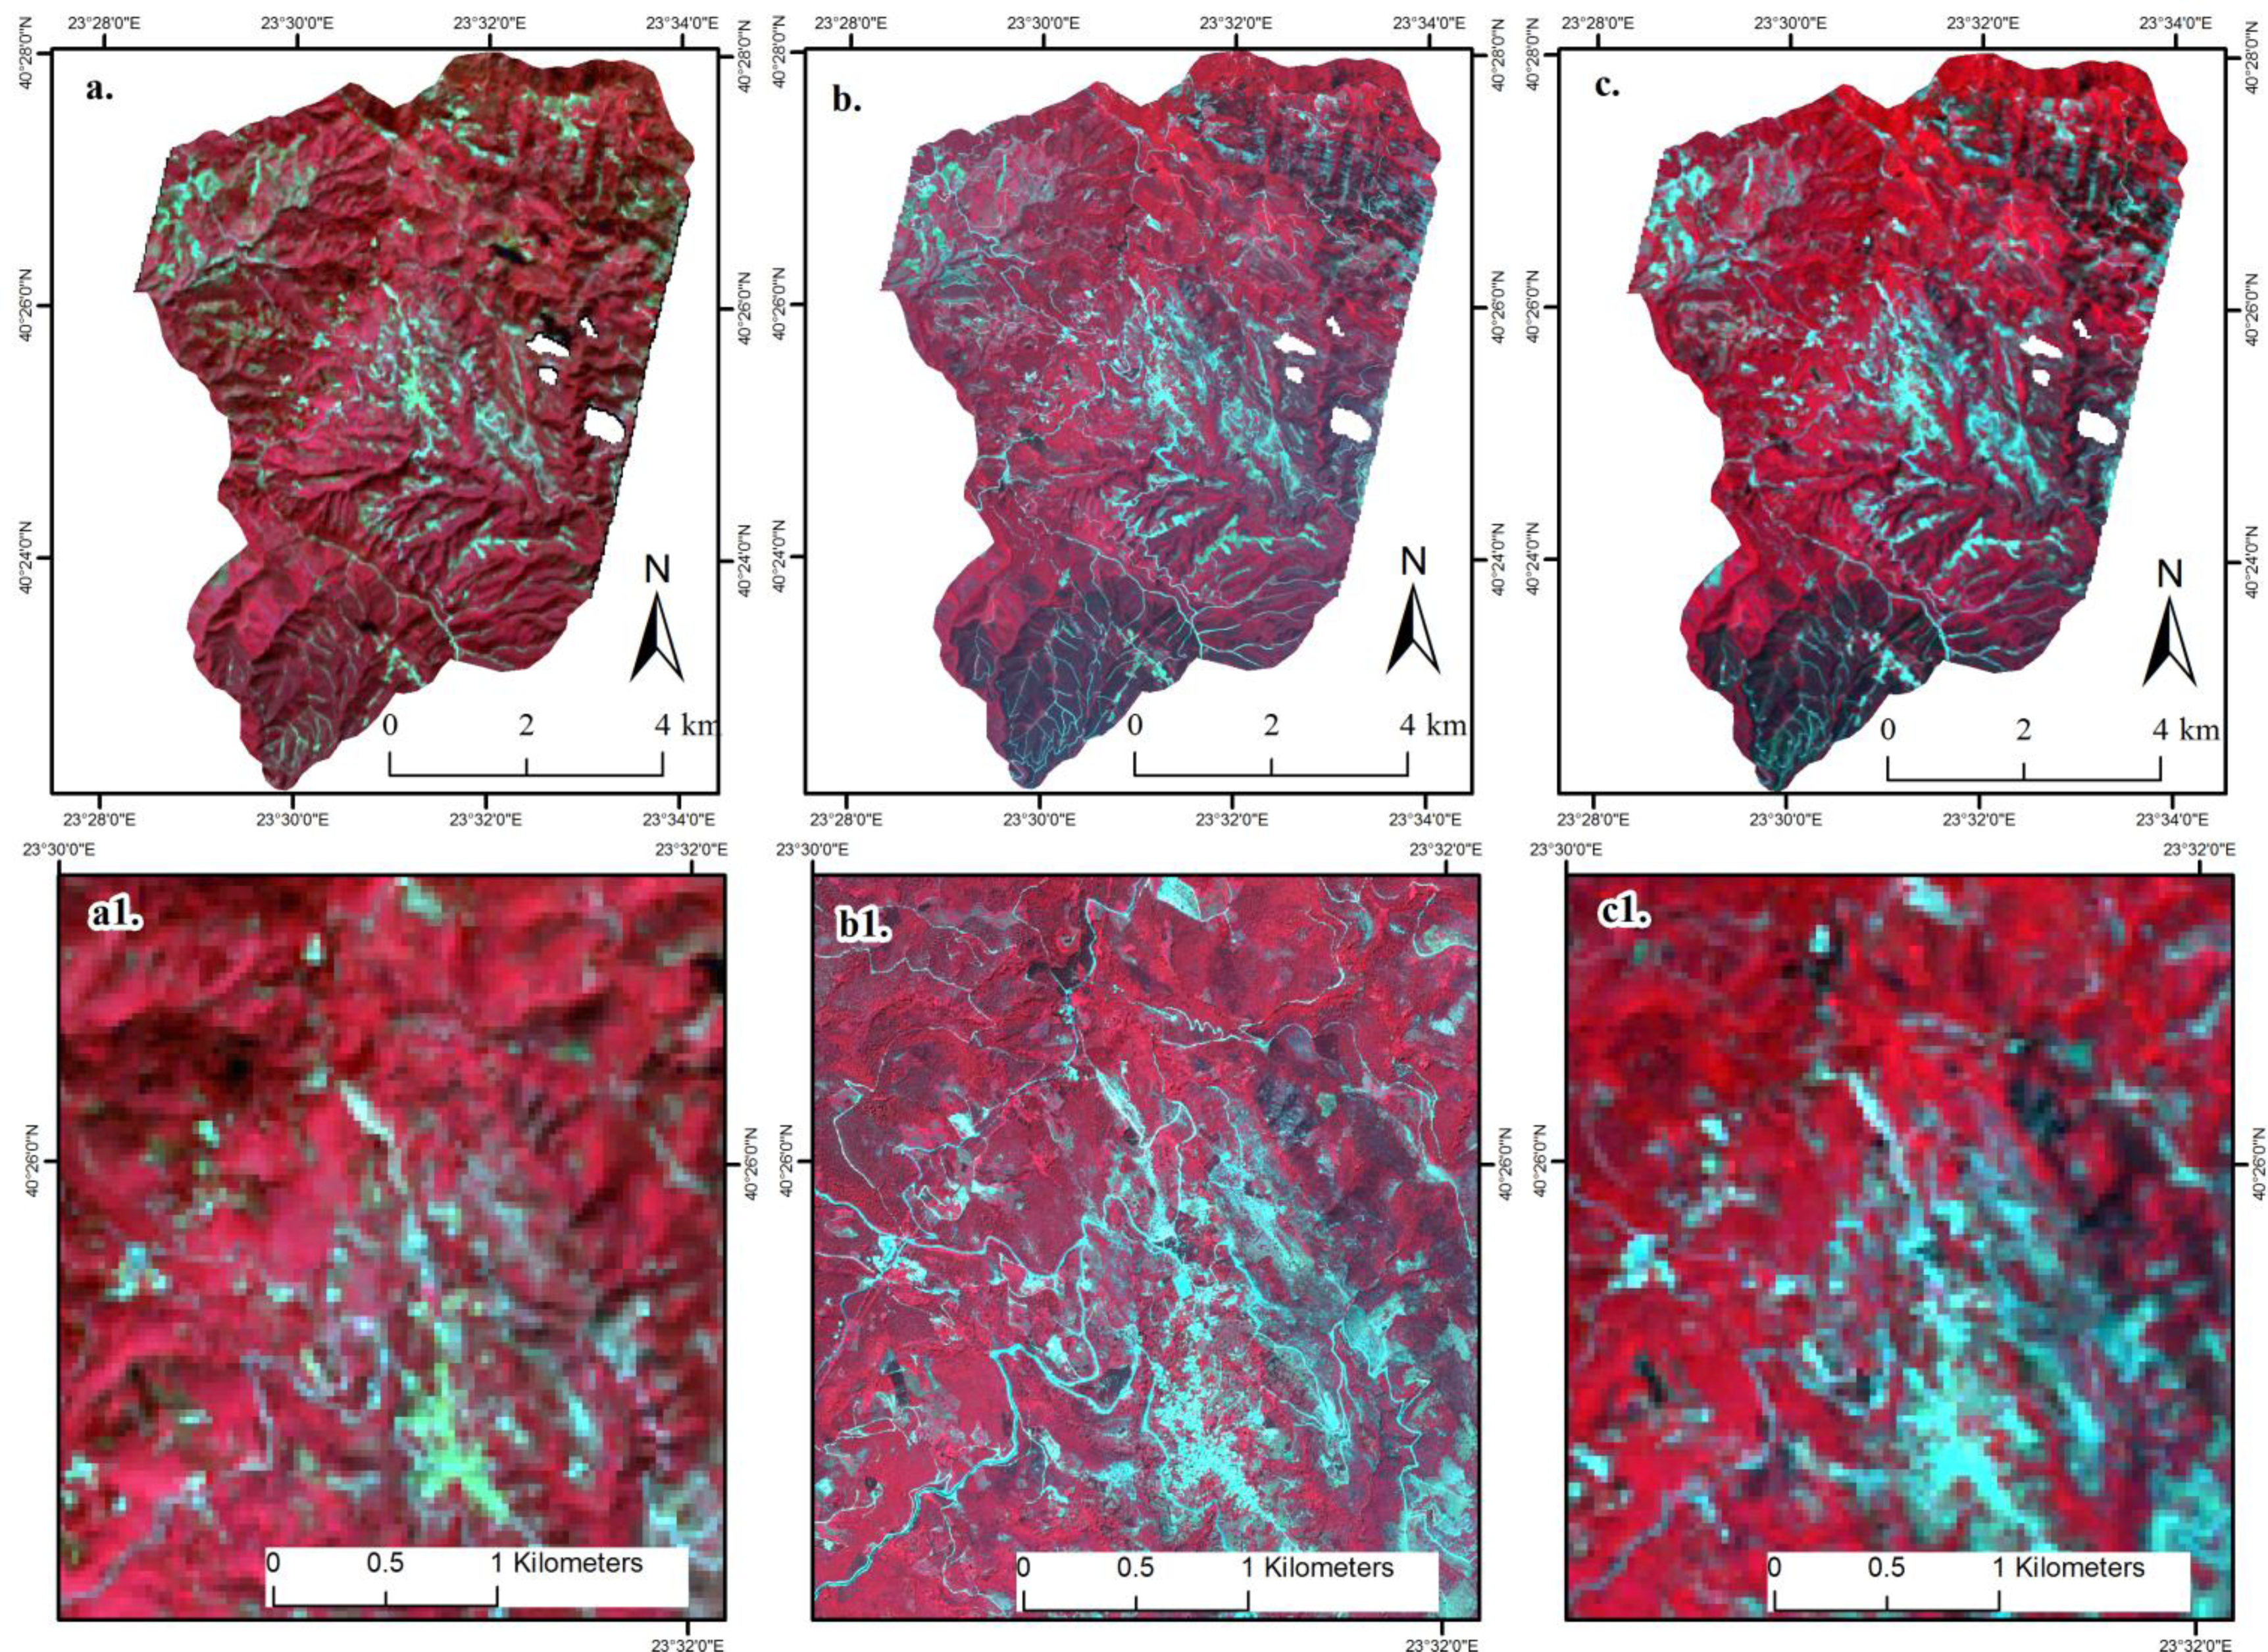
2.3. Satellite and Field Data
2.4. Image Pre-Processing
2.5. Image Segmentation
2.6. Support Vector Machines Classification
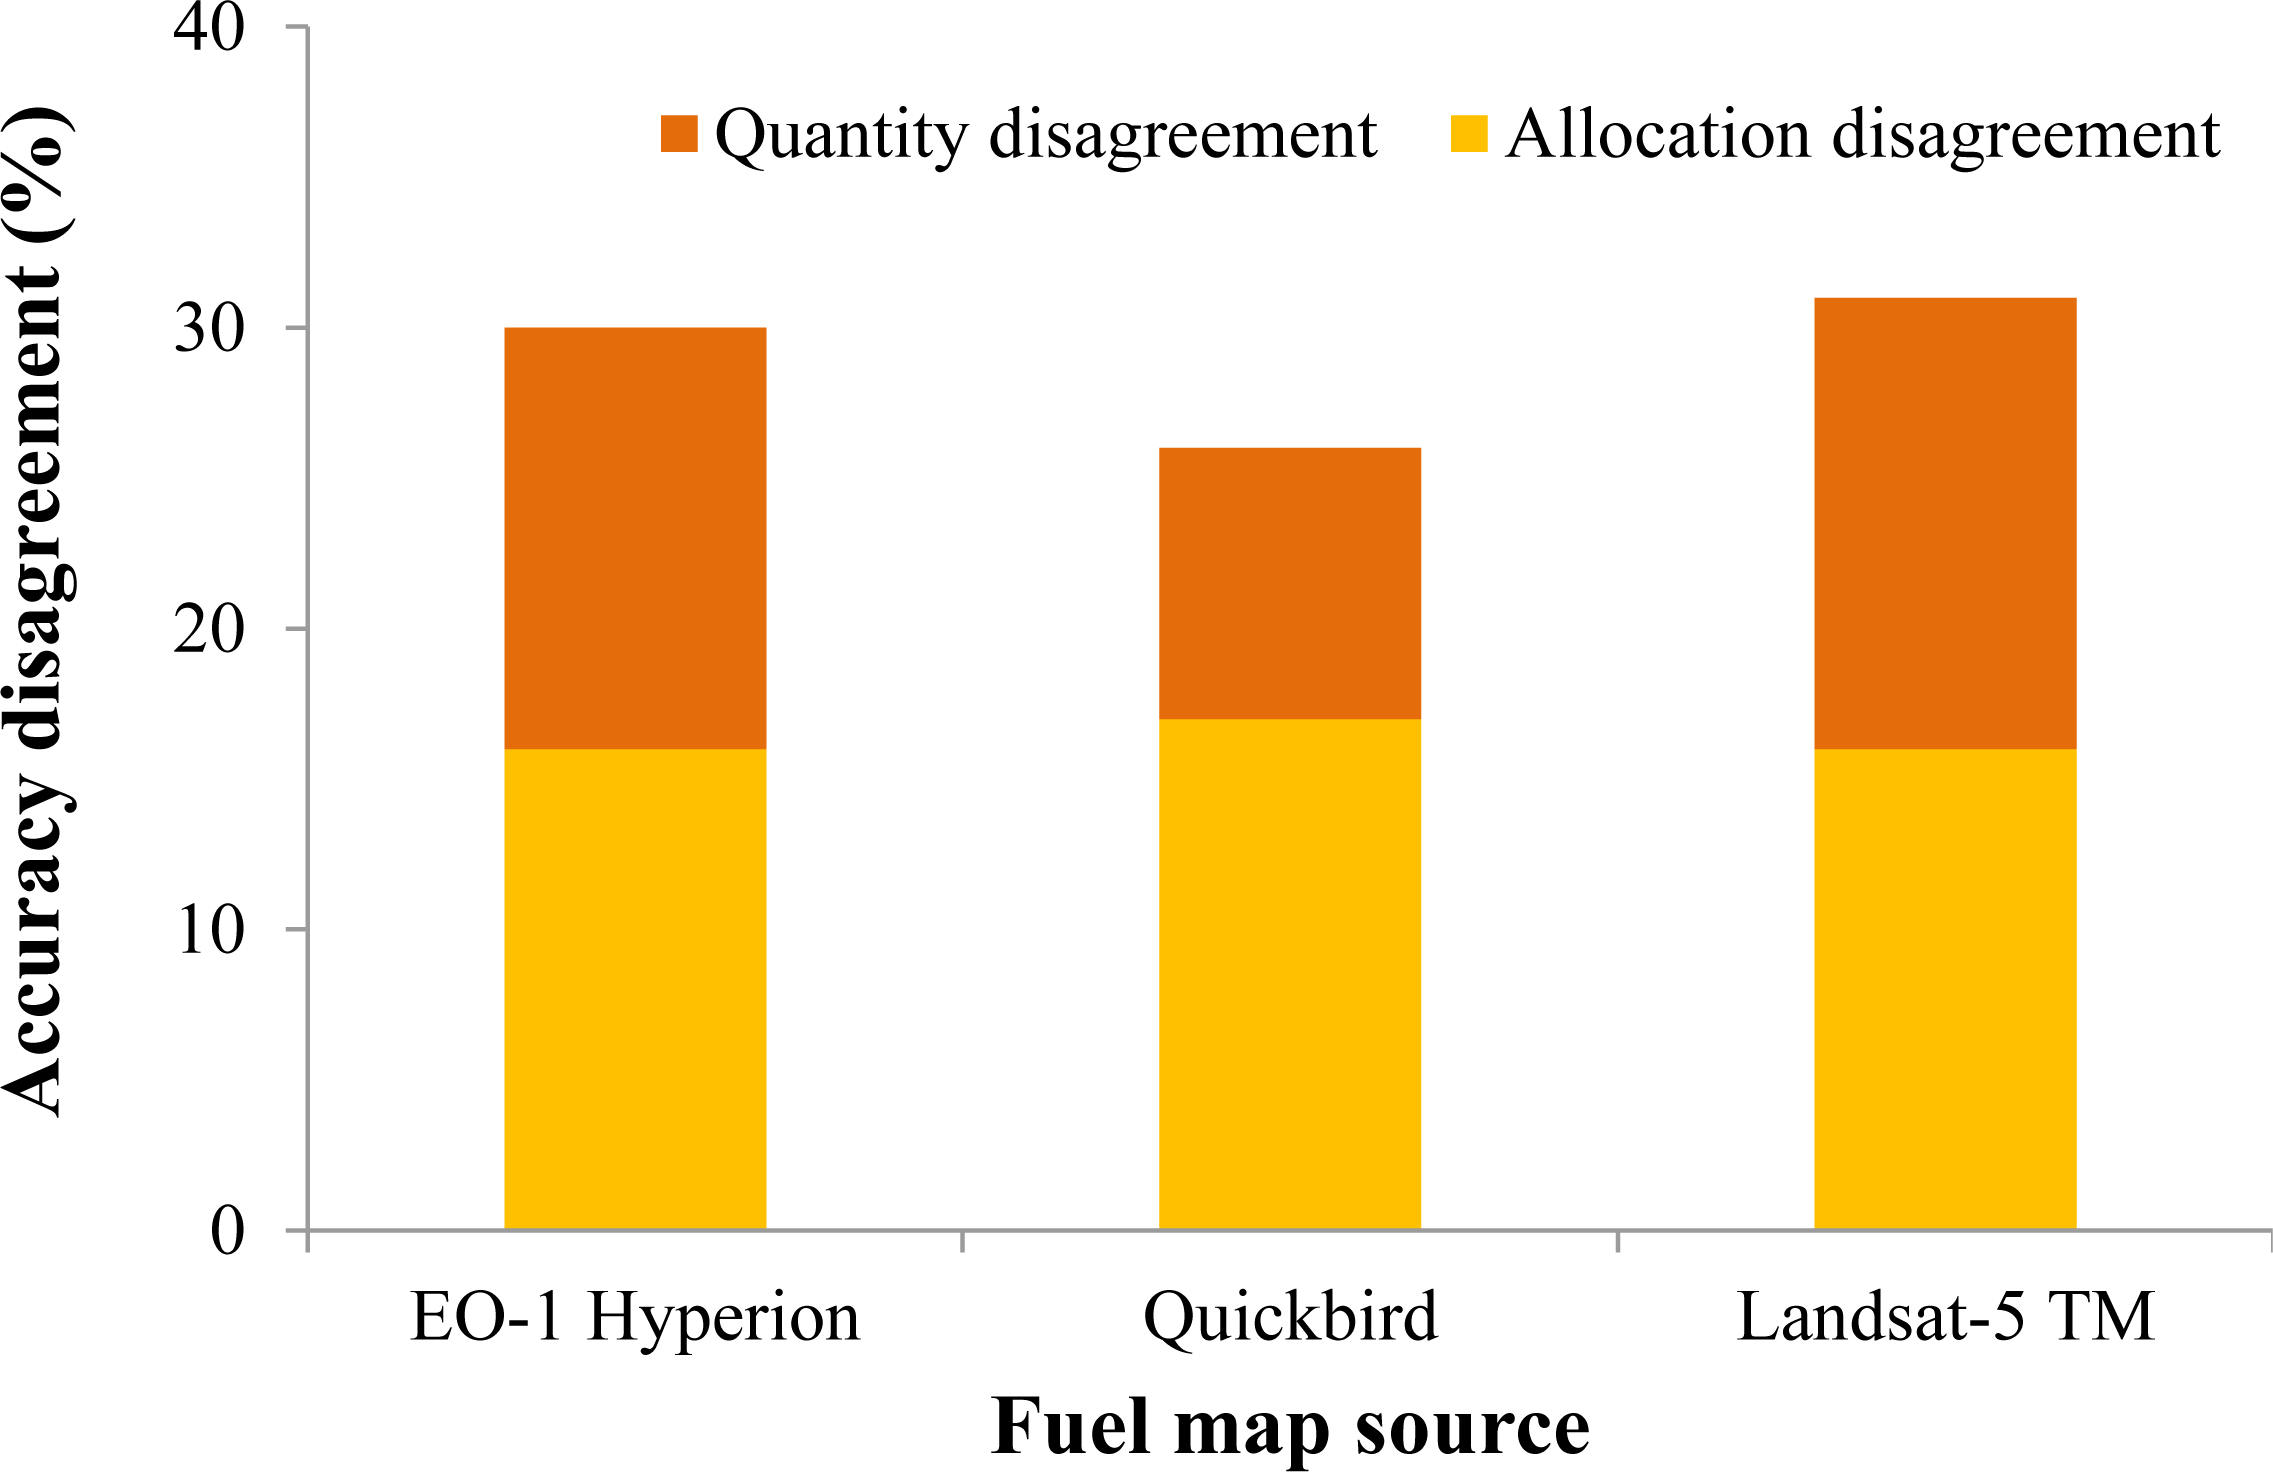
2.7. Accuracy Assessment
3. Results and Discussions
4. Conclusions
Acknowledgments
Author Contributions
Conflicts of Interest
References
- San-Miguel-Ayanz, J.; Moreno, J.M.; Camia, A. Analysis of large fires in European Mediterranean landscapes: Lessons learned and perspectives. For. Ecol. Manag 2014, 294, 11–22. [Google Scholar]
- Pausas, J.G.; Vallejo, R.V. The Role of Fire in European Mediterranean Ecosystems. In Remote Sensing of Large Wildfires; Chuvieco, E., Ed.; Springer: Berlin/Heidelberg, Germany, 1999; pp. 3–16. [Google Scholar]
- Piñol, J.; Terradas, J.; Lloret, F. Climate warming, wildfire hazard, and wildfire occurrence in coastal eastern Spain. Clim. Chang 1998, 38, 345–357. [Google Scholar]
- Koutsias, N.; Xanthopoulos, G.; Founda, D.; Xystrakis, F.; Nioti, F.; Pleniou, M.; Mallinis, G.; Arianoutsou, M. On the relationships between forest fires and weather conditions in Greece from long-term national observations (1894–2010). Int. J. Wildland Fire 2013, 22, 493–507. [Google Scholar]
- Kasischke, E.S.; Hyer, E.J.; Novelli, P.C.; Bruhwiler, L.P.; French, N.H.F.; Sukhinin, A.I.; Hewson, J.H.; Stocks, B.J. Influences of boreal fire emissions on Northern Hemisphere atmospheric carbon and carbon monoxide. Glob. Biogeochem. Cycl 2005, 19, 1–16. [Google Scholar]
- Flannigan, M.D.; Krawchuk, M.A.; de Groot, W.J.; Wotton, B.M.; Gowman, L.M. Implications of changing climate for global wildland fire. Int. J. Wildland Fire 2009, 18, 483–507. [Google Scholar]
- Dimitrakopoulos, A.P.; Vlahou, M.; Anagnostopoulou, C.G.; Mitsopoulos, I.D. Impact of drought on wildland fires in Greece: Implications of climatic change? Clim. Chang 2011, 109, 331–347. [Google Scholar]
- Pausas, J.G.; Fernández-Muñoz, S. Fire regime changes in the Western Mediterranean Basin: From fuel-limited to drought-driven fire regime. Clim. Chang 2012, 110, 215–226. [Google Scholar]
- Keane, R.E.; Burgan, R.; van Wagtendonk, J. Mapping wildland fuels for fire management across multiple scales: Integrating remote sensing, GIS, and biophysical modeling. Int. J. Wildland Fire 2001, 10, 301–319. [Google Scholar]
- Anderson, H.E. Aids to Determining Fuel Models for Estimating Fire Behavior; U.S. Department of Agriculture, Forest Service, Intermountain Forest and Range Experiment Station: Ogden, UT, USA, 1982. [Google Scholar]
- Burgan, R.E.; Rothermel, R.C. BEHAVE: Fire Behavior Prediction and Fuel Modeling System—FUEL Subsystem; U.S. Department of Agriculture, Forest Service, Intermountain Research Station: Ogden, UT, USA, 1984. [Google Scholar]
- Chuvieco, E.; Riaño, D.; van Wagtendok, J.; Morsdof, F. Fuel Loads and Fuel Type Mapping. In Wildland Fire Danger Estimation and Mapping; Chuvieco, E., Ed.; World Scientific Publishing: Singapore, 2003; pp. 119–142. [Google Scholar]
- Mallinis, G.; Mitsopoulos, I.D.; Dimitrakopoulos, A.P.; Gitas, I.Z.; Karteris, M. Local-scale fuel-type mapping and fire behavior prediction by employing high-resolution satellite imagery. IEEE J. Sel. Top. Appl. Earth Obs. Remote Sens 2008, 1, 230–239. [Google Scholar]
- Campbell, J.L.; Ager, A.A. Forest wildfire, fuel reduction treatments, and landscape carbon stocks: A sensitivity analysis. J. Environ. Manag 2013, 121, 124–132. [Google Scholar]
- Arroyo, L.A.; Pascual, C.; Manzanera, J.A. Fire models and methods to map fuel types: The role of remote sensing. For. Ecol. Manag 2008, 256, 1239–1252. [Google Scholar] [Green Version]
- Lentile, L.B.; Smith, A.M.S.; Hudak, A.T.; Morgan, P.; Bobbitt, M.J.; Lewis, S.A.; Robichaud, P.R. Remote sensing for prediction of 1-year post-fire ecosystem condition. Int. J. Wildland Fire 2009, 18, 594–608. [Google Scholar]
- Chuvieco, E.; Salas, J. Mapping the spatial distribution of forest fire danger using GIS. Int. J. Geogr. Inf. Syst 1996, 10, 333–345. [Google Scholar]
- Koutsias, N.; Karteris, M. Classification analyses of vegetation for delineating forest fire fuel complexes in a Mediterranean test site using satellite remote sensing and GIS. Int. J. Remote Sens 2003, 24, 3093–3104. [Google Scholar]
- Falkowski, M.J.; Gessler, P.E.; Morgan, P.; Hudak, A.T.; Smith, A.M.S. Characterizing and mapping forest fire fuels using ASTER imagery and gradient modeling. For. Ecol. Manag 2005, 217, 129–146. [Google Scholar]
- Keramitsoglou, I.; Kontoes, C.; Sykioti, O.; Sifakis, N.; Xofis, P. Reliable, accurate and timely forest mapping for wildfire management using ASTER and Hyperion satellite imagery. For. Ecol. Manag 2008, 255, 3556–3562. [Google Scholar]
- Lasaponara, R.; Lanorte, A. Remotely sensed characterization of forest fuel types by using satellite ASTER data. Int. J. Appl. Earth Obs. Geoinf 2007, 9, 225–234. [Google Scholar]
- Alonso-Benito, A.; Arroyo, L.A.; Arbelo, M.; Hernández-Leal, P.; González-Calvo, A. Pixel and object-based classification approaches for mapping forest fuel types in Tenerife Island from ASTER data. Int. J. Wildland Fire 2013, 22, 306–317. [Google Scholar]
- Tanase, M.A.; Gitas, I.Z. An examination of the effects of spatial resolution and image analysis technique on indirect fuel mapping. IEEE J. Sel. Top. Appl. Earth Obs. Remote Sens 2008, 1, 220–229. [Google Scholar]
- Shoshany, M. Satellite remote sensing of natural Mediterranean vegetation: A review within an ecological context. Prog. Phys. Geogr 2000, 24, 153–178. [Google Scholar]
- Scarascia-Mugnozza, G.; Oswald, H.; Piussi, P.; Radoglou, K. Forests of the Mediterranean region: Gaps in knowledge and research needs. For. Ecol. Manag 2000, 132, 97–109. [Google Scholar]
- Ozdemir, I.; Karnieli, A. Predicting forest structural parameters using the image texture derived from worldview-2 multispectral imagery in a dryland forest, Israel. Int. J. Appl. Earth Obs. Geoinf 2011, 13, 701–710. [Google Scholar]
- Mallinis, G.; Koutsias, N.; Makras, A.; Karteris, M. Forest parameters estimation in a European Mediterranean landscape using remotely sensed data. For. Sci 2004, 50, 450–460. [Google Scholar]
- Mallinis, G.; Koutsias, N.; Tsakiri-Strati, M.; Karteris, M. Object-based classification using Quickbird imagery for delineating forest vegetation polygons in a Mediterranean test site. ISPRS J. Photogramm. Remote Sens 2008, 63, 237–250. [Google Scholar]
- Mallinis, G.; Mitsopoulos, I.; Stournara, P.; Patias, P.; Dimitrakopoulos, A. Canopy fuel load mapping of Mediterranean pine sites based on individual tree-crown delineation. Remote Sens 2013, 5, 6461–6480. [Google Scholar]
- Arroyo, L.A.; Healey, S.P.; Cohen, W.B.; Cocero, D.; Manzanera, J.A. Using object-oriented classification and high-resolution imagery to map fuel types in a Mediterranean region. J. Geophys. Res. Biogeosci 2006, 111. [Google Scholar] [CrossRef]
- Gitas, I.Z.; Mitri, G.H.; Kazakis, G.; Ghosn, D.; Xanthopoulos, G. Fuel type mapping in Anopolis, Crete by employing QuickBird imagery and object-based classification. For. Ecol. Manag 2006, 234, S228. [Google Scholar]
- Lasaponara, R.; Lanorte, A. On the capability of satellite VHR QuickBird data for fuel type characterization in fragmented landscape. Ecol. Model 2007, 204, 79–84. [Google Scholar]
- Jia, G.J.; Burke, I.C.; Goetz, A.F.H.; Kaufmann, M.R.; Kindel, B.C. Assessing spatial patterns of forest fuel using AVIRIS data. Remote Sens. Environ 2006, 102, 318–327. [Google Scholar]
- Roberts, D.A.; Dennison, P.E.; Gardner, M.E.; Hetzel, Y.; Ustin, S.L.; Lee, C.T. Evaluation of the potential of Hyperion for fire danger assessment by comparison to the Airborne Visible/Infrared Imaging Spectrometer. IEEE Trans. Geosci. Remote Sens 2003, 41, 1297–1310. [Google Scholar]
- Roberts, D.A.; Dennison, P.E.; Peterson, S.; Sweeney, S.; Rechel, J. Evaluation of Airborne Visible/Infrared Imaging Spectrometer (AVIRIS) and Moderate Resolution Imaging Spectrometer (MODIS) measures of live fuel moisture and fuel condition in a shrubland ecosystem in southern California. J. Geophys. Res.: Biogeosci 2006, 111. [Google Scholar] [CrossRef]
- Lasaponara, R.; Lanorte, A.; Pignatti, S. Characterization and mapping of fuel types for the Mediterranean ecosystems of Pollino National Park in southern Italy by using hyperspectral MIVIS data. Earth Interact 2006, 10, 1–11. [Google Scholar]
- Carter, G.A.; Lucas, K.L.; Blossom, G.A.; Holiday, C.L.L.; Mooneyhan, D.S.; Fastring, D.R.; Holcombe, T.R.; Griffith, J.A. Remote sensing and mapping of tamarisk along the Colorado river, USA: A comparative use of summer-acquired Hyperion, thematic mapper and Quickbird data. Remote Sens 2009, 1, 318–329. [Google Scholar]
- Thenkabail, P.S.; Enclona, E.A.; Ashton, M.S.; Legg, C.; de Dieu, M.J.; Hyperion. IKONOS, ALI, and ETM+ sensors in the study of African rainforests. Remote Sens. Environ 2004, 90, 23–43. [Google Scholar]
- Dalponte, M.; Bruzzone, L.; Vescovo, L.; Gianelle, D. The role of spectral resolution and classifier complexity in the analysis of hyperspectral images of forest areas. Remote Sens. Environ 2009, 113, 2345–2355. [Google Scholar]
- Mountrakis, G.; Im, J.; Ogole, C. Support vector machines in remote sensing: A review. ISPRS J. Photogramm. Remote Sens 2011, 66, 247–259. [Google Scholar]
- Hasan, R.C.; Ierodiaconou, D.; Monk, J. Evaluation of four supervised learning methods for benthic habitat mapping using backscatter from multi-beam sonar. Remote Sens 2012, 4, 3427–3443. [Google Scholar]
- Vaughn, N.R.; Moskal, L.M.; Turnblom, E.C. Tree species detection accuracies using discrete point lidar and airborne waveform lidar. Remote Sens 2012, 4, 377–403. [Google Scholar]
- Mirik, M.; Ansley, R.J.; Steddom, K.; Jones, D.C.; Rush, C.M.; Michels, G.J., Jr.; Elliott, N.C. Remote distinction of a noxious weed (Musk Thistle: Carduus Nutans) using airborne hyperspectral imagery and the support vector machine classifier. Remote Sens 2013, 5, 612–630. [Google Scholar]
- Heumann, B.W. An object-based classification of mangroves using a hybrid decision tree-support vector machine approach. Remote Sens 2011, 3, 2440–2460. [Google Scholar]
- Dalponte, M.; Ørka, H.O.; Gobakken, T.; Gianelle, D.; Næsset, E. Tree species classification in boreal forests with hyperspectral data. IEEE Trans. Geosci. Remote Sens 2013, 51, 2632–2645. [Google Scholar]
- Feret, J.B.; Asner, G.P. Tree species discrimination in tropical forests using airborne imaging spectroscopy. IEEE Trans. Geosci. Remote Sens 2013, 51, 73–84. [Google Scholar]
- Melgani, F.; Bruzzone, L. Classification of hyperspectral remote sensing images with support vector machines. IEEE Trans. Geosci. Remote Sens 2004, 42, 1778–1790. [Google Scholar]
- Pal, M.; Mather, P.M. Assessment of the effectiveness of support vector machines for hyperspectral data. Future Gener. Comput. Syst 2004, 20, 1215–1225. [Google Scholar]
- Middleton, E.M.; Ungar, S.G.; Mandl, D.J.; Ong, L.; Frye, S.W.; Campbell, P.E.; Landis, D.R.; Young, J.P.; Pollack, N.H. The earth observing one (EO-1) satellite mission: Over a decade in space. IEEE J. Sel. Top. Appl. Earth Obs. Remote Sens 2013, 6, 243–256. [Google Scholar]
- Datt, B.; McVicar, T.R.; van Niel, T.G.; Jupp, D.L.B.; Pearlman, J.S. Preprocessing EO-1 Hyperion hyperspectral data to support the application of agricultural indexes. IEEE Trans. Geosci. Remote Sens 2003, 41, 1246–1259. [Google Scholar]
- Goodenough, D.G.; Dyk, A.; Niemann, K.O.; Pearlman, J.S.; Chen, H.; Han, T.; Murdoch, M.; West, C. Processing Hyperion and ALI for forest classification. IEEE Trans. Geosci. Remote Sens 2003, 41, 1321–1331. [Google Scholar]
- Pengra, B.W.; Johnston, C.A.; Loveland, T.R. Mapping an invasive plant, Phragmites australis, in coastal wetlands using the EO-1 Hyperion hyperspectral sensor. Remote Sens. Environ 2007, 108, 74–81. [Google Scholar]
- Pu, R.; Gong, P.; Yu, Q. Comparative analysis of EO-1 ALI and Hyperion, and Landsat ETM+ data for mapping forest crown closure and leaf area index. Sensors 2008, 8, 3744–3766. [Google Scholar]
- Bernstein, L.S.; Jin, X.; Gregor, B.; Adler-Golden, S.M. Quick atmospheric correction code: Algorithm description and recent upgrades. Opt. Eng 2012, 51. [Google Scholar] [CrossRef]
- Gersman, R.; Ben-Dor, E.; Beyth, M.; Avigad, D.; Abraha, M.; Kibreab, A. Mapping of hydrothermally altered rocks by the EO-1 Hyperion sensor, Northern Danakil Depression, Eritrea. Int. J. Remote Sens 2008, 29, 3911–3936. [Google Scholar]
- Hsu, S.M.; Burke, H.H.K.; Orloff, S.; Griffin, M. Examples of EO-1 Data Analysis. Proceedings of the Algorithms and Technologies for Multispectral, Hyperspectral, and Ultraspectral Imagery IX, Orlando, FL, USA, 24 September 2003; pp. 362–372.
- Hay, G.J.; Niemann, K.O.; McLean, G.F. An object-specific image-texture analysis of H-resolution forest imagery. Remote Sens. Environ 1996, 55, 108–122. [Google Scholar]
- Blaschke, T. Object based image analysis for remote sensing. ISPRS J. Photogramm. Remote Sens 2010, 65, 2–16. [Google Scholar]
- Benz, U.C.; Hofmann, P.; Willhauck, G.; Lingenfelder, I.; Heynen, M. Multi-resolution, object-oriented fuzzy analysis of remote sensing data for GIS-ready information. ISPRS J. Photogramm. Remote Sens 2004, 58, 239–258. [Google Scholar]
- Vapnik, V.N. The Nature of Statistical Learning Theory, 2nd ed; Springer: New York, NY, USA, 2000; p. 314. [Google Scholar]
- Zhang, J.; Lin, X.; Ning, X. SVM-based classification of segmented airborne LiDAR point clouds in urban areas. Remote Sens 2013, 5, 3749–3775. [Google Scholar]
- Yang, X. Parameterizing support vector machines for land cover classification. Photogramm. Eng. Remote Sens 2011, 77, 27–38. [Google Scholar]
- Jebur, M.N.; Mohd Shafri, H.Z.; Pradhan, B.; Tehrany, M.S. Per-pixel and object-oriented classification methods for mapping urban land cover extraction using SPOT 5 imagery. Geocarto Int 2013. [Google Scholar] [CrossRef]
- Alpaydin, E. Introduction to Machine Learning; MIT Press: Cambridge, MA, USA, 2004; p. 415. [Google Scholar]
- Chang, C.-C.; Lin, C.-J. LIBSVM: A library for support vector machines. ACM Trans. Intell. Syst. Technol 2011, 2, 1–27. [Google Scholar]
- Galidaki, G.; Gitas, I.Z. Mediterranean forest species mapping using classification of Hyperion imagery. Geocarto Int 2013, in press.. [Google Scholar]
- Pontius, R.G.; Millones, M. Death to Kappa: Birth of quantity disagreement and allocation disagreement for accuracy assessment. Int. J. Remote Sens 2011, 32, 4407–4429. [Google Scholar]
- Daniel, G.; Gregory, S.B.; Javier, M. Accuracy Assessment for Soft Classification Maps. In Remote Sensing of Natural Resources; CRC Press: Boca Raton, FL, USA, 2013; pp. 57–86. [Google Scholar]
- Foody, G.M. Thematic map comparison: Evaluating the statistical significance of differences in classification accuracy. Photogramm. Eng. Remote Sens 2004, 70, 627–633. [Google Scholar]
- Jia, G.J.; Burke, I.C.; Kaufmann, M.R.; Goetz, A.F.H.; Kindel, B.C.; Pu, Y. Estimates of forest canopy fuel attributes using hyperspectral data. For. Ecol. Manag 2006, 229, 27–38. [Google Scholar]
- Lasaponara, R.; Lanorte, A.; Pignatti, S. Multiscale fuel type mapping in fragmented ecosystems: Preliminary results from hyperspectral MIVIS and multispectral Landsat TM data. Int. J. Remote Sens 2006, 27, 587–593. [Google Scholar]
- Koetz, B.; Morsdorf, F.; van der Linden, S.; Curt, T.; Allgöwer, B. Multi-source land cover classification for forest fire management based on imaging spectrometry and LiDAR data. For. Ecol. Manag 2008, 256, 263–271. [Google Scholar]
- Varga, T.A.; Asner, G.P. Hyperspectral and LiDAR remote sensing of fire fuels in Hawaii volcanoes National Park. Ecol. Appl 2008, 18, 613–623. [Google Scholar]
- Thenkabail, P.S.; Enclona, E.A.; Ashton, M.S.; van der Meer, B. Accuracy assessments of hyperspectral waveband performance for vegetation analysis applications. Remote Sens. Environ 2004, 91, 354–376. [Google Scholar]
- Gitelson, A.A.; Gritz, Y.; Merzlyak, M.N. Relationships between leaf chlorophyll content and spectral reflectance and algorithms for non-destructive chlorophyll assessment in higher plant leaves. J. Plant Physiol 2003, 160, 271–282. [Google Scholar]
- Mariotto, I.; Thenkabail, P.S.; Huete, A.; Slonecker, E.T.; Platonov, A. Hyperspectral versus multispectral crop-productivity modeling and type discrimination for the HyspIRI mission. Remote Sens. Environ 2013, 139, 291–305. [Google Scholar]
- Gao, J.; Liu, Y. Mapping of land degradation from space: A comparative study of Landsat ETM + and ASTER data. Int. J. Remote Sens 2008, 29, 4029–4043. [Google Scholar]
- Platt, R.V.; Goetz, A.F.H. A comparison of AVIRIS and Landsat for land use classification at the urban fringe. Photogramm. Eng. Remote Sens 2004, 70, 813–819. [Google Scholar]
- Kruse, F.A.; Boardman, J.W.; Huntington, J.F. Comparison of airborne hyperspectral data and EO-1 Hyperion for mineral mapping. IEEE Trans. Geosci. Remote Sens 2003, 41, 1388–1400. [Google Scholar]
- Shao, Y.; Lunetta, R.S. Comparison of support vector machine, neural network, and CART algorithms for the land-cover classification using limited training data points. ISPRS J. Photogramm. Remote Sens 2012, 70, 78–87. [Google Scholar]
- Strahler, A.H.; Woodcock, C.E.; Smith, J.A. On the nature of models in remote sensing. Remote Sens. Environ 1986, 20, 121–139. [Google Scholar]
- Blaschke, T.; Hay, G.J.; Kelly, M.; Lang, S.; Hofmann, P.; Addink, E.; Queiroz Feitosa, R.; van der Meer, F.; van der Werff, H.; van Coillie, F.; et al. Geographic object-based image analysis—Towards a new paradigm. ISPRS J. Photogramm. Remote Sens 2014, 87, 180–191. [Google Scholar]
- Gross, H.N.; Schott, J.R. Application of spectral mixture analysis and image fusion techniques for image sharpening. Remote Sens. Environ 1998, 63, 85–94. [Google Scholar]


| EO-1 Hyperion | Quickbird | Landsat TM | |
|---|---|---|---|
| Spectral range (/μm) | 0.36–2.58 | 0.43–0.92 | 0.45–2.35 |
| Spatial resolution (m) | 30 | 2.4 | 30 |
| Swath width (km) | 7.7 | 16.5 | 185 |
| Spectral resolution | 0.1 μm | Variable | Variable |
| Signal-to-Noise Ratio (SNR) | 150:1 to 50:1 | 166:1 to 172:1 | 72 to 60 |
| Spectral coverage | Continuous | Discrete | Discrete |
| Radiometric resolution (bit) | 12-bit | 11-bit | 8-bit |
| Number of bands (VNIR/SWIR) | 196 (49/147) | 4 (4/0) | 6 (4/2) |
| Date of acquisition | October 2008 | July 2004 | July 2007 |
| Sun elevation (deg.) | 38.56 | 65.70 | 62.37 |
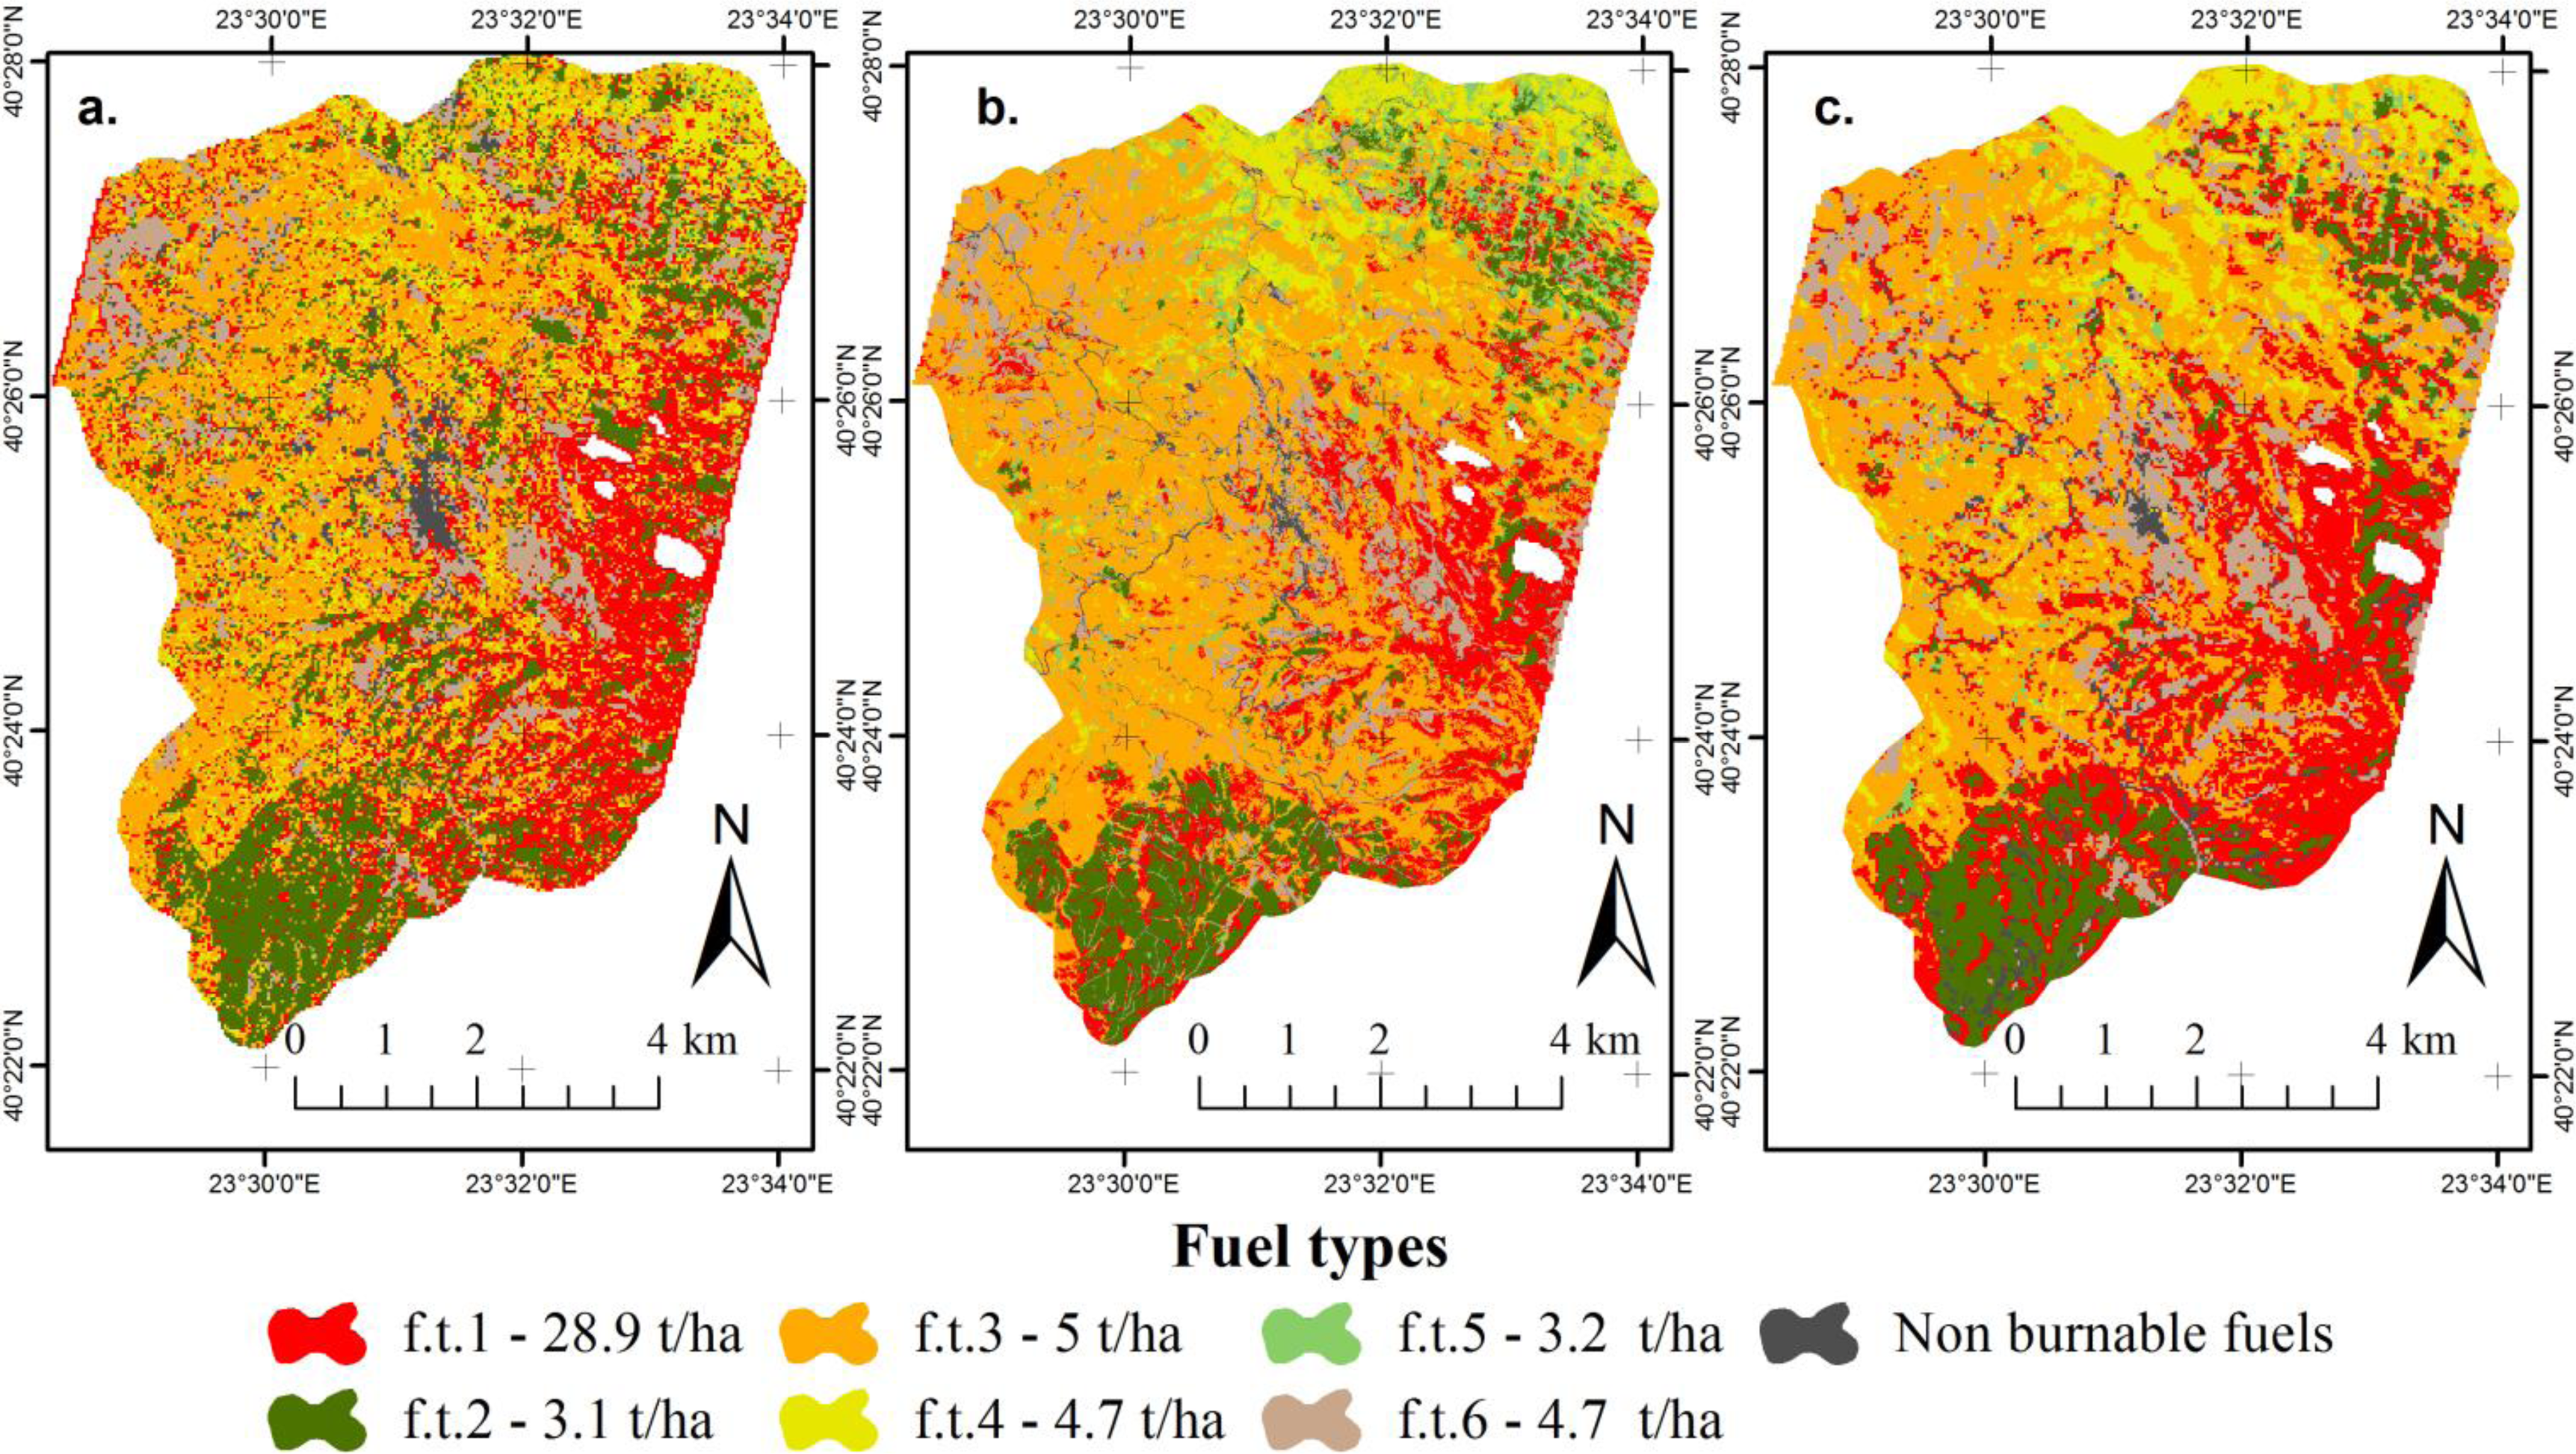
| Fuel Type | Fuel Model | Average Height (cm) | Total Fuel Load (t/ha) |
|---|---|---|---|
| f.t. 1 | Evergreen-sclerophyllous shrublands (maquis) (up to 2 m) | 152 | 28.9 |
| f.t. 2 | Litter layer of pine forests | 4 | 3.1 |
| f.t. 3 | Litter layer of oak forests | 6 | 5 |
| f.t. 4 | Litter layer of beech forests | 4.5 | 4.7 |
| f.t. 5 | Litter layer of mixed forests | 5 | 3.2 |
| f.t. 6 | Grassland | 25 | 4.7 |
| EO-1 Hyperion | |||||||||||
| Reference Data | |||||||||||
| Classified Data | f.t. 1 | f.t.2 | f.t.3 | f.t.4 | f.t.5 | f.t.6 | Non Fuels | Classified Totals | User Accuracy | Producer Accuracy | |
| f.t.1 | 33 | 3 | 4 | 8 | 8 | 3 | 8 | 67 | 49.25 | 84.62 | |
| f.t.2 | 2 | 45 | 2 | 1 | 8 | 2 | 2 | 62 | 72.58 | 80.36 | |
| f.t.3 | 3 | 51 | 1 | 5 | 3 | 3 | 66 | 77.27 | 72.86 | ||
| f.t.4 | 4 | 2 | 10 | 51 | 9 | 4 | 3 | 83 | 61.45 | 78.46 | |
| f.t.5 | 1 | 8 | 9 | 88.89 | 20.51 | ||||||
| f.t.6 | 3 | 3 | 3 | 1 | 48 | 2 | 64 | 80.00 | 78.69 | ||
| NB fuel | 1 | 29 | 30 | 96.67 | 61.7 | ||||||
| Overall classification accuracy = 70.00 | Kappa coefficient = 0.65 | ||||||||||
| Quickbird | |||||||||||
| Classified Data | f.t. 1 | f.t.2 | f.t.3 | f.t.4 | f.t.5 | f.t.6 | Non Fuels | Classified Totals | User Accuracy | Producer Accuracy | |
| f.t.1 | 25 | 4 | 5 | 4 | 3 | 41 | 60.98 | 64.1 | |||
| f.t.2 | 45 | 4 | 49 | 91.84 | 78.69 | ||||||
| f.t.3 | 12 | 5 | 57 | 14 | 7 | 6 | 101 | 56.44 | 91.49 | ||
| f.t.4 | 5 | 46 | 8 | 1 | 60 | 76.67 | 70.77 | ||||
| f.t.5 | 1 | 2 | 1 | 4 | 16 | 1 | 1 | 26 | 61.54 | 41.03 | |
| f.t.6 | 1 | 2 | 1 | 48 | 2 | 54 | 88.89 | 81.43 | |||
| NB fuel | 3 | 43 | 46 | 93.48 | 80.36 | ||||||
| Overall classification accuracy = 74.27 | Kappa coefficient = 0.70 | ||||||||||
| Landsat TM | |||||||||||
| Classified Data | f.t. 1 | f.t.2 | f.t.3 | f.t.4 | f.t.5 | f.t.6 | Non Fuels | Classified Totals | User Accuracy | Producer Accuracy | |
| f.t.1 | 32 | 8 | 11 | 2 | 12 | 5 | 4 | 74 | 43.24 | 82.05 | |
| f.t.2 | 3 | 45 | 4 | 1 | 53 | 84.91 | 80.36 | ||||
| f.t.3 | 2 | 2 | 55 | 14 | 9 | 8 | 90 | 61.11 | 78.57 | ||
| f.t.4 | 4 | 47 | 6 | 1 | 58 | 81.03 | 72.31 | ||||
| f.t.5 | 2 | 1 | 1 | 8 | 12 | 66.67 | 20.51 | ||||
| f.t.6 | 1 | 46 | 14 | 61 | 75.41 | 75.41 | |||||
| NB fuel | 29 | 29 | 100.00 | 61.70 | |||||||
| Reference Totals | 39 | 56 | 70 | 65 | 39 | 61 | 47 | 377 | |||
| Overall classification accuracy = 69.50 | Kappa coefficient = 0.64 | ||||||||||
| EO-1Hyperion | Landsat TM | |
|---|---|---|
| Landsat TM | 0.11 | |
| Quickbird | 1.96 | 3.00 |
© 2014 by the authors; licensee MDPI, Basel, Switzerland This article is an open access article distributed under the terms and conditions of the Creative Commons Attribution license (http://creativecommons.org/licenses/by/3.0/).
Share and Cite
Mallinis, G.; Galidaki, G.; Gitas, I. A Comparative Analysis of EO-1 Hyperion, Quickbird and Landsat TM Imagery for Fuel Type Mapping of a Typical Mediterranean Landscape. Remote Sens. 2014, 6, 1684-1704. https://doi.org/10.3390/rs6021684
Mallinis G, Galidaki G, Gitas I. A Comparative Analysis of EO-1 Hyperion, Quickbird and Landsat TM Imagery for Fuel Type Mapping of a Typical Mediterranean Landscape. Remote Sensing. 2014; 6(2):1684-1704. https://doi.org/10.3390/rs6021684
Chicago/Turabian StyleMallinis, Giorgos, Georgia Galidaki, and Ioannis Gitas. 2014. "A Comparative Analysis of EO-1 Hyperion, Quickbird and Landsat TM Imagery for Fuel Type Mapping of a Typical Mediterranean Landscape" Remote Sensing 6, no. 2: 1684-1704. https://doi.org/10.3390/rs6021684