1. Introduction
The planet Earth is a complex geosystem comprised of several dynamically coupled spheres including mantle, lithosphere, coversphere (including hydrosphere, cryosphere and biosphere), atmosphere and ionosphere, from inside to outer space. Earthquakes are one of the most unexpected and most destructive geohazards on planet Earth. As a result of the sudden release of great energy into the lithosphere, within a few seconds, medium-to-large earthquakes will bring intensive disasters to the world. Before a tectonic earthquake, the seismogenic zone has usually undergone a long-term process of energy preparation, in which tectonic stress was enhanced and accumulated in local crust rocks, especially around geo-structures or along active faults. The stress enhancement and energy accumulation inside the local lithosphere, especially inside the upper crust, will cause an anomalous change of multiple radiation signals [
1], such as electromagnetic [
2] and thermal radiations [
3–
12], from the local underground, from the surface (ground and sea), and from the atmosphere.
The Global Earth Observation System of Systems (GEOSS) under construction is providing more and more observations or revisits of the planet Earth, especially on the coversphere, which is the important interface between lithosphere and atmosphere. The coversphere acts as a very active member in the process of LCAI (Lithosphere-Coversphere-Atmosphere-Ionosphere) coupling [
13]. With global or local coverage, and with multiple parameters and resolutions, GEOSS supports global change and Earth System Science study more systematically, and provides a new opportunity to undertake earthquake anomaly recognition with multiple parameters from the available large database.
2. Philosophy
A large number of thermal anomalies occurring before many medium-to-large (M > 5.5) earthquakes were reported all over the world with the fast developing and application of satellite remote sensing. Anomalies of thermal infrared radiation (TIR) [
3–
7], outgoing longwave radiation (OLR) [
8], surface latent heat flux (SLHF) [
9–
12], and microwave radiation [
14] have been reported during the past decades. However, most of the anomalies were analyzed individually with different analytical methods on multiple observations with different spatial resolution and different temporal scales. There is a lack of discussion regarding the inherent correlations between different parameters, or the geological correlations with tectonic structures. The reported anomalies show various spatio-temporal features for scientific understanding with geosciences knowledge, which mean that the cognitions on earthquake thermal anomaly do not have a universal significance and general acceptance in the scientific community.
Some hypotheses, such as modification of groundwater regime leading to an increase of convective heat flux [
15], Earth degassing (Rn, CO
2, Ar, He, CH
4,
etc.) resulting local greenhouse effect [
3], underground charge generation and propagation in igneous rock with P-holes [
16], near-surface air ionization due to enhanced radon emission leading to the release of latent heat [
17], friction heat produced from rock fracturing and fault friction sliding [
18–
20], have been proposed to interpret the possible thermal anomaly mechanism. However, none of the above hypotheses are completely understood or fundamentally correct, since the influence of Earth coversphere (including water, ice, sand, soil and vegetation, which are quite different from the crust rock) on satellite remote sensing is inevitable and will cause great uncertainties to the earthquake thermal anomaly recognition.
The discharge of underground fluid and the local effusion of underground gases to the Earth surface will not only bring out underground heat, but also change the physical features (e.g., soil moisture and surface temperature) of the coversphere. The change of local soil moisture will further locally change the properties of the Earth surface (e.g., surface albedo, soil heat capacity, surface evaporation), which will locally affect the surface hydrothermal process. Moreover, the effusion of underground gases might result in local rise of the atmosphere temperature due to greenhouse effects, which will break the energy balance on local Earth surface. Subsequently, the mentioned behaviors will lead to water phase change and surface energy redistribution, and will further locally change the sensible heat and the latent heat transferred from the coversphere to the atmosphere [
21].
Therefore, we should pay more attention to the lithosphere-coversphere-atmosphere (LCA) coupling [
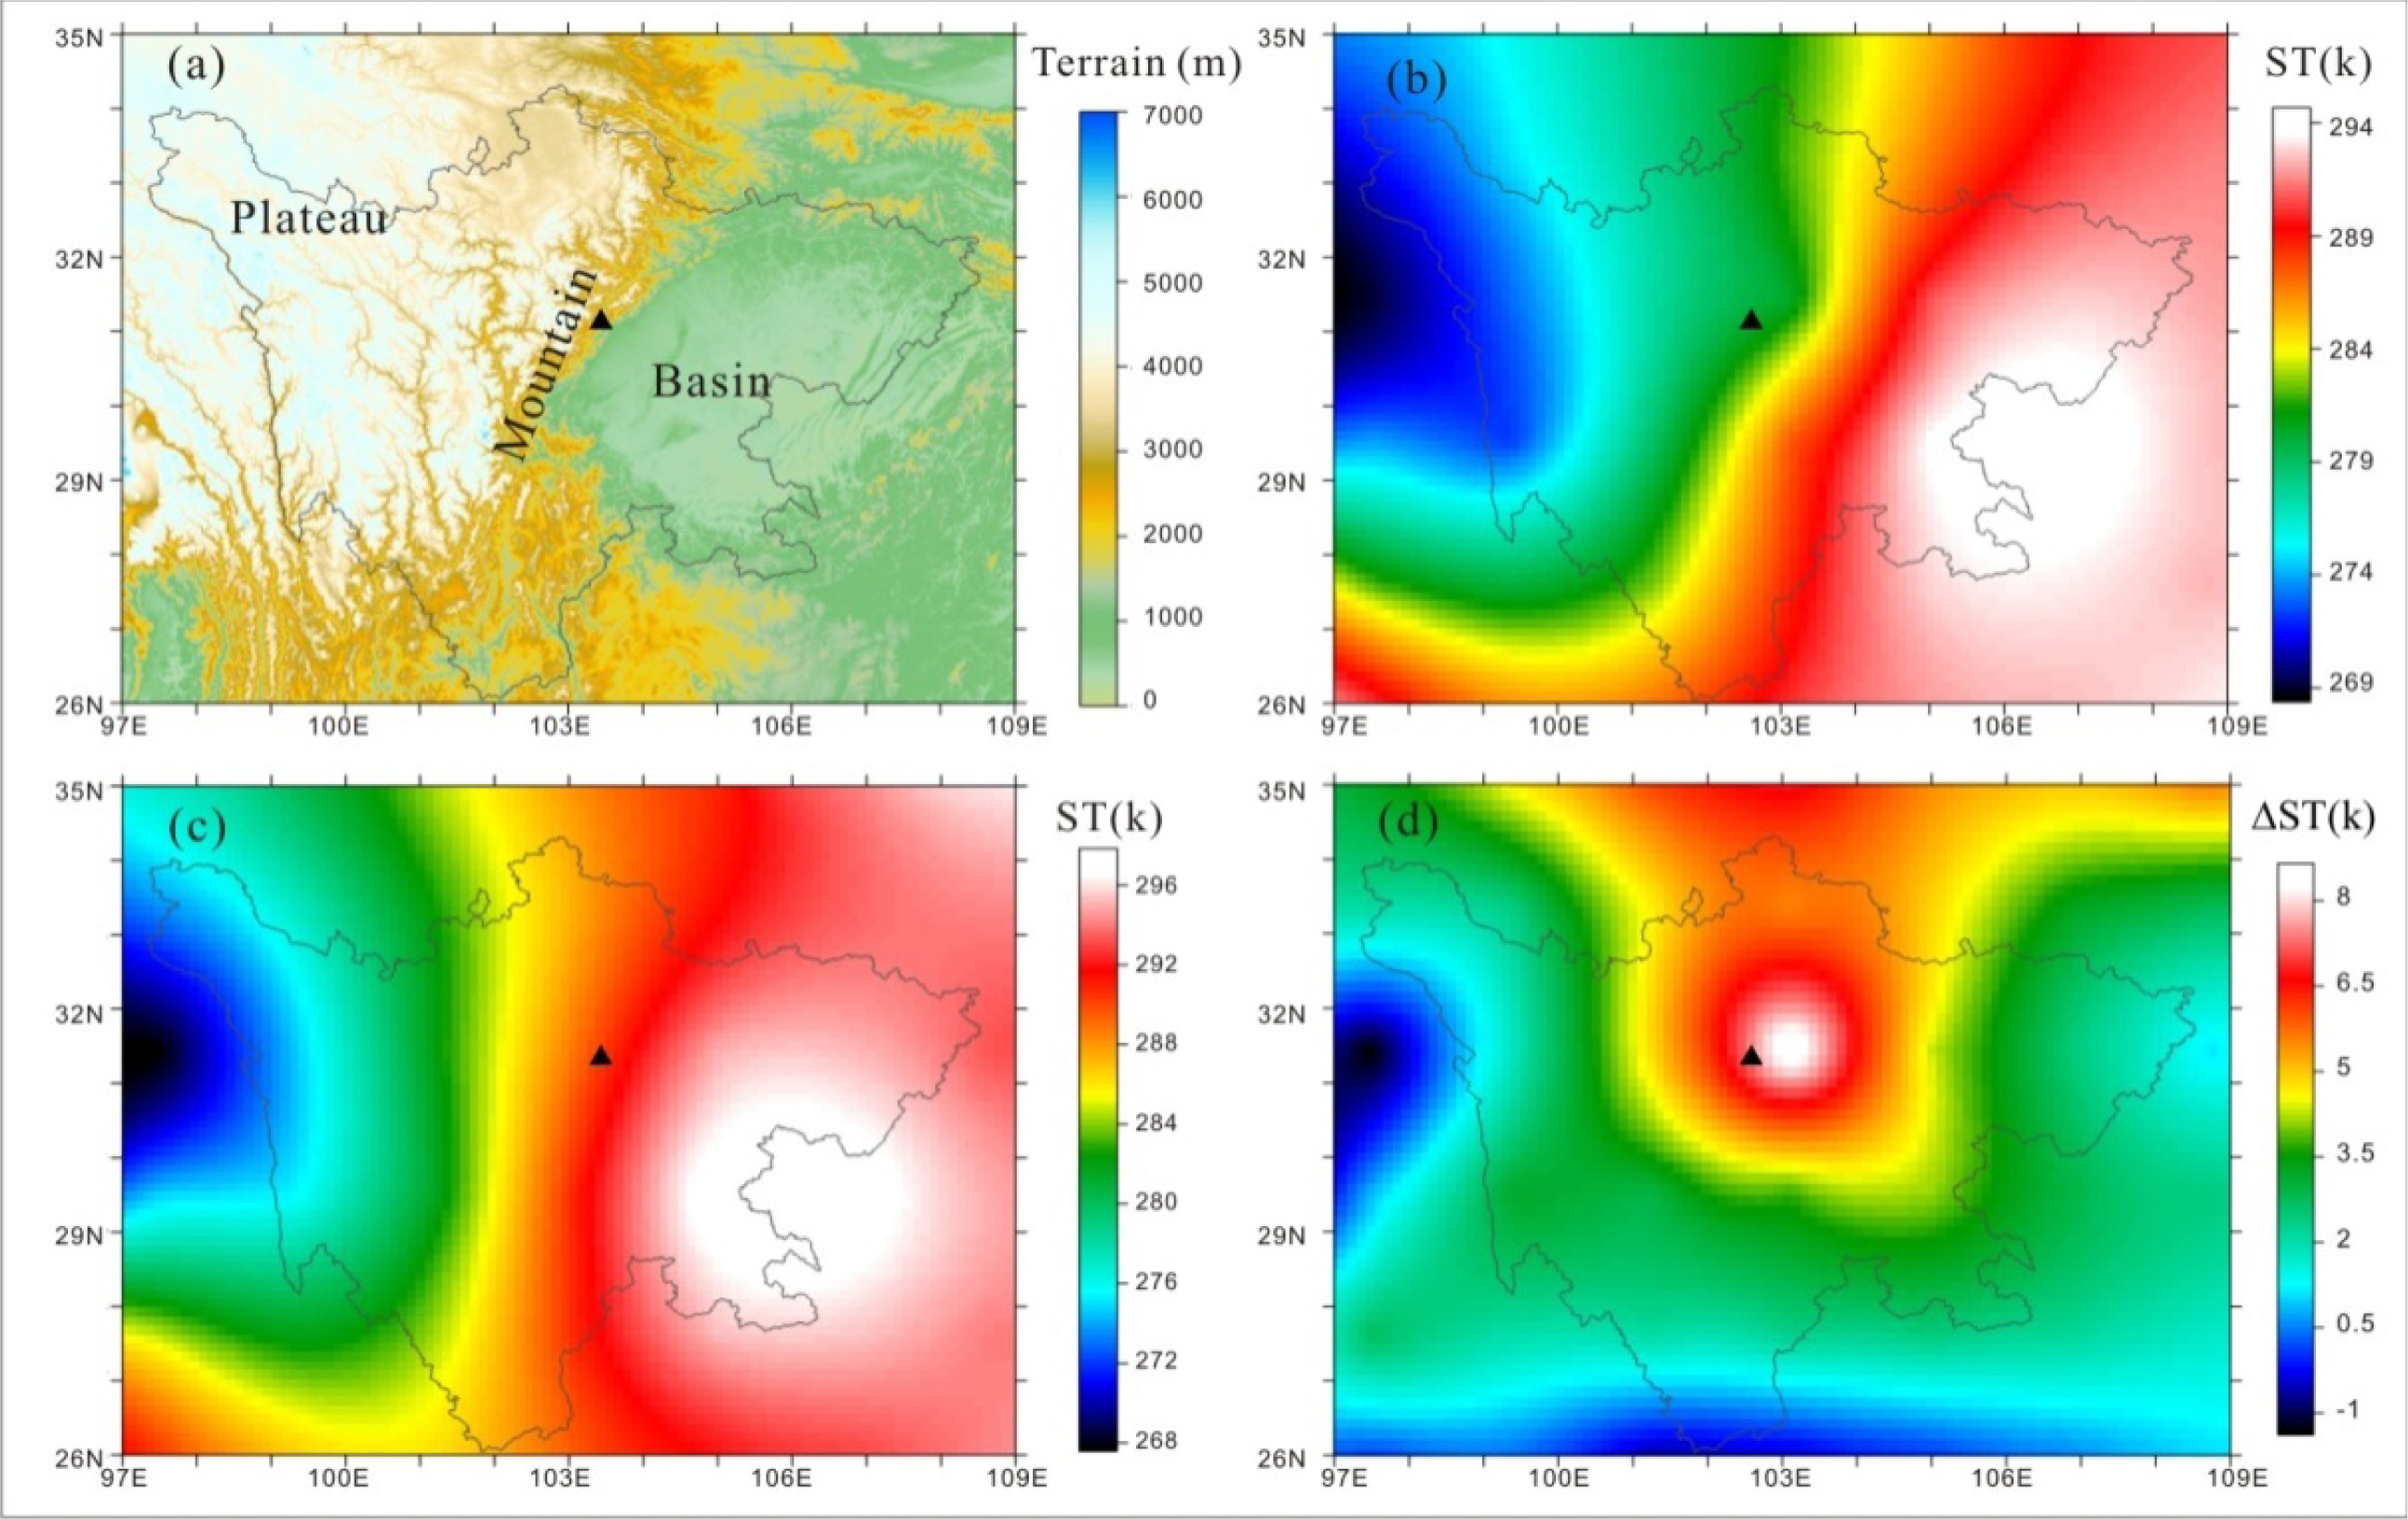
13] for a better understanding of the seismic thermal anomaly mechanisms and for better applications of GEOSS observations to earthquake anomaly recognition. It is worth noting that the local coversphere features and terrain topography have a somewhat stable influence on surface thermal radiation as a regional background. Taking the Wenchuan earthquake, 12 May 2008, as an example (
Figure 1), the spatial distribution of 33 years (1979–2012, excluding 2008) means of skin temperatures (ST) from USANCEP/NCAR (National Centers for Environmental Prediction/National Center for Atmospheric Research) Reanalysis on 6 May in Sichuan (
Figure 1b), is in good accordance with the local terrain featuring basins, mountains and plateaus, from east to west (
Figure 1a). From the spatial distribution of ST on 6 May 2008 (
Figure 1c), it is difficult to recognized it as an anomaly. However, if we subtract the background image (
Figure 1b), a differential ST (ΔST) image was obtained (
Figure 1d), which notably shows that a local anomaly occurred near the epicenter. Although there are also similar patterns in other years, the further analysis of time series and other thermal parameters (details in [
21]) suggested that the temperature enhancement on 5 May 2008 is unique and could be related to the Wenchuan earthquake.
3. Methodology
To reveal a potential anomaly from the difference between the current observations and the average background, a threshold should be defined to filter the anomaly out from normal variation. To verify furthermore the reliability of anomalies of several parameters, we need to analyze the spatio-temporal relations between different anomalies. Hence we have defined three criterions for earthquake anomaly recognition to support the data mining from GEOSS observations [
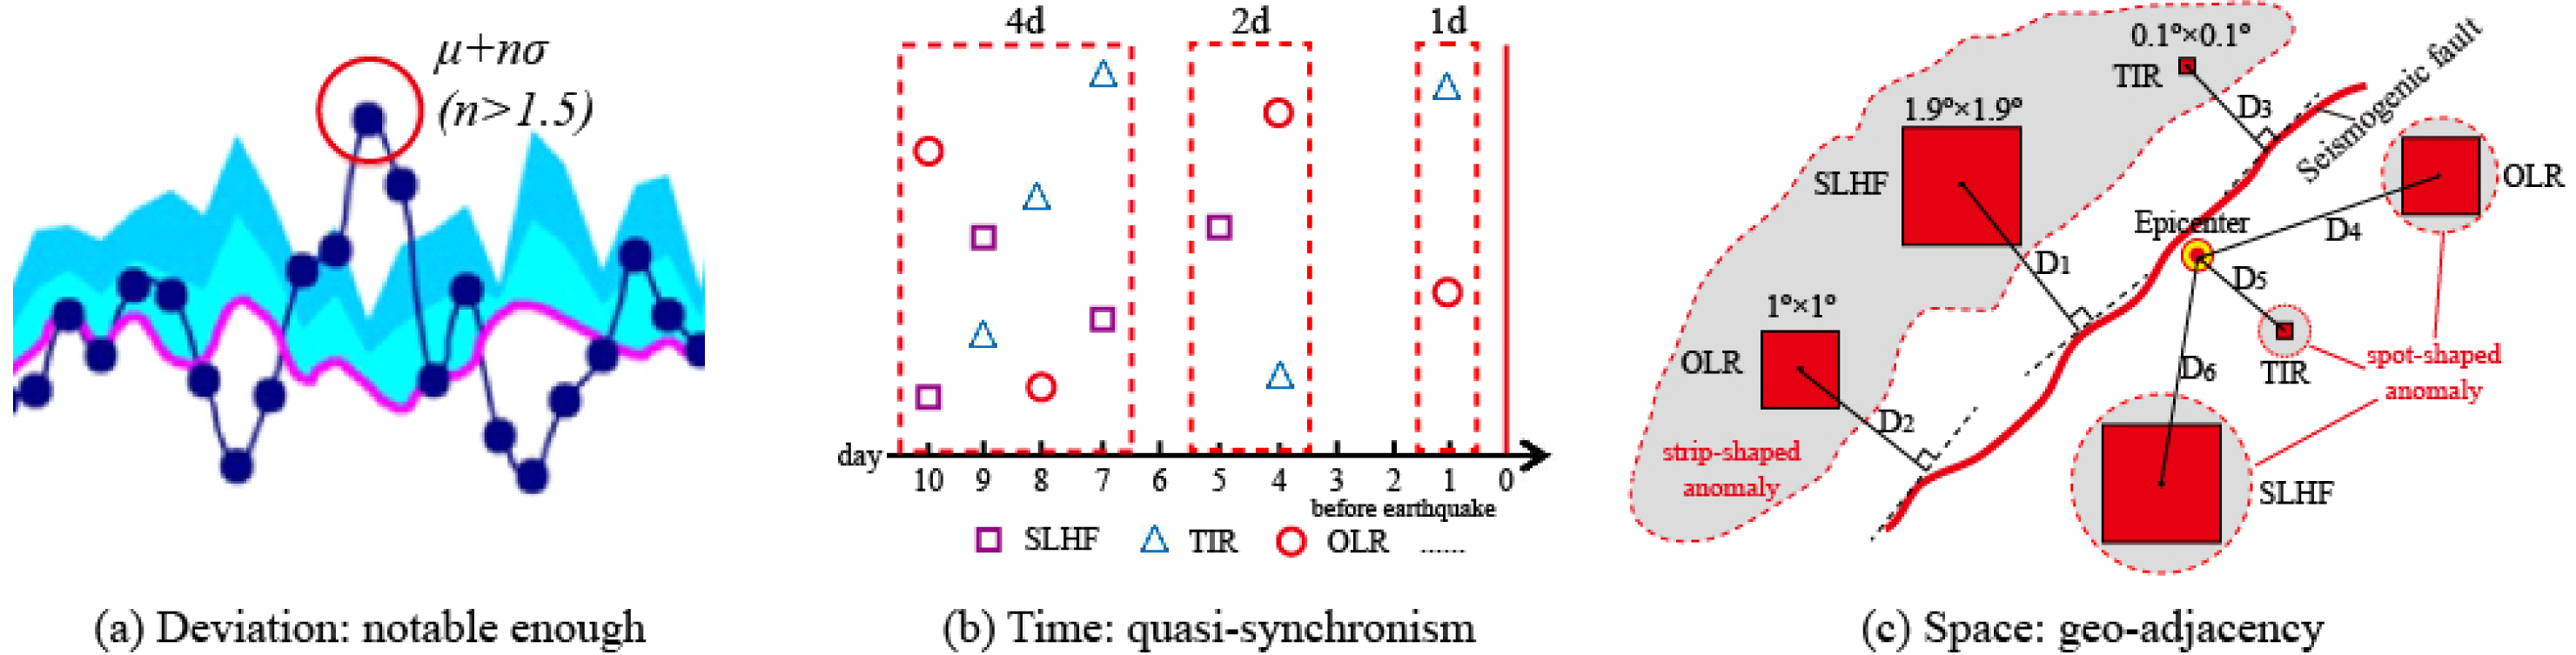
21]. In this paper, we further improve them as: (1) Only deviations of the differential value higher than 1.5σ (standard deviation) relative to the background can be considered a candidate anomaly (
Figure 2a); (2) Anomalies of different parameters should have temporal quasi-synchronism that different anomalies appear within a time window of several days before the main shock (
Figure 2b). (3) Anomalies of different thermal parameters should also have spatial geo-adjacency that all the different anomalies exhibit a spatial coincidence with the epicenter and/or the seismogenic faults (
Figure 2c). Based on the three criterions on anomaly’s deviation, time, and space, we developed a GEOSS-based comprehensive method named DTS-method (Deviation-Time-Space method) for earthquake anomaly recognition, and applied it to thermal parameters to reach a DTS-T method [
21].
Referring to the principles on geo-system energy balance and on thermal radiation transition from the Earth surface, we selected six thermal parameters for earthquake thermal anomaly analysis. They are: OLR, TIR, SLHF, ST, surface air temperature (SAT) and diurnal temperature range (DTR), respectively. Data preprocessing, including geo-registration, interpolation, and by-pixel DEM matching, to make geographical consistency in coordination and temporal consistency in daily intervals for different parameters, is important for statistical analysis. With non-earthquake years (the years without M > 5.5 earthquake) providing a reference background, the daily anomalous changes of each pixel are statistically calculated by subtracting the non-earthquake day-average from current day-value. Time-series curves of various thermal parameters on each pixel, especially the potential epicenter pixel or pixel group are plotted together with day-average, and μ + 1.5σ for help to visualize the change trend and to pick out anomaly candidates. The calculated daily difference of each pixel is imaged day-by-day in a certain zone covering the epicenter. Also, the differential images are superimposed after geo-registration with local tectonic structures, especially active faults, to reveal the spatial relations between thermal anomalies and geological faults.
Hence, based on the time-series curves and the differential images of individual thermal parameters, the potential anomalies are carefully checked referring to the criterions on deviations being noticeable enough. To pick out possible thermal anomalies from all potential thermal anomalies that are being checked, further tests are conducted relative to the criterions on time quasi-synchronism and space geo-adjacency. If there are several thermal parameters with a noticeable anomaly, quasi-synchronism and geo-adjacency, a comprehensive earthquake anomaly is recognized. The bigger the single-parameter deviation, the more reliable the comprehensive thermal anomaly is.
Furthermore, to evaluate the reliability of the recognized thermal anomalies, a reliability index (
RI) is defined in
Equation (1) considering three normalized indices,
NDI (normalized deviation index),
NSI (normalized synchronism index) and
NAI (normalized adjacency index), which are calculated according to
Equation (2) to quantify the deviation-time-space criterions.
where:
Pi is the value of an abnormal thermal parameter
i for a specific earthquake,
μi and
σi are the mean and the standard deviations relative to the background of the thermal parameter
i,
is the maximum of
for all the studied earthquake cases;
W̄ is the average time windows of temporal quasi-synchronism for a specific earthquake,
is the minimum of
W̄ for all the studied earthquake cases,
N̄ is the average parameter numbers of temporal quasi-synchronism for a specific earthquake,
is the maximum of
N for all the studied earthquake cases;
D̄ is the average distances between anomaly pixels and the epicenter (as straight line distance) or the seismogenic fault (as normal distance) considering both spot-shaped and strip-shaped anomalies for a specific earthquake,
is the minimum of
D̄ for all the studied earthquake cases.
4. Cases Results
In previous publications [
11,
12,
21,
22], we have applied the DTS-T method to analyze the possible anomalies preceding six tectonic earthquakes, including Ms 7.2 Yutian earthquake, 12 March 2008; Ms 8.0 Wenchuan earthquake, 12 May 2008; Ms 7.1 New Zeeland earthquake, 3 September 2010; Ms 6.3 New Zeeland earthquake, 21 February 2011; Ms 5.9 Emilia earthquake, 20 May 2012; and Ms 5.8 Emilia earthquake, 29 May 2012. To demonstrate the application of the DTS-T methods, in this paper we focus on the Ms 7.1 Yushu earthquake of 14 April 2010 which occurred 44 km northwestern of Yushu county (33.2°N, 96.6°E), Qinghai, China, with a focal depth of 14 km (according to the China Earthquake Network Center). FY-VISSR (FengYun satellite, Visible and Infrared Spin Scan Radiometer) TIR, NOAA-AVHRR (Advanced Very High Resolution Radiometer) OLR, and NCEP/NCAR Reanalysis DTR data were analyzed to reveal possible thermal anomalies before the Yushu earthquake.
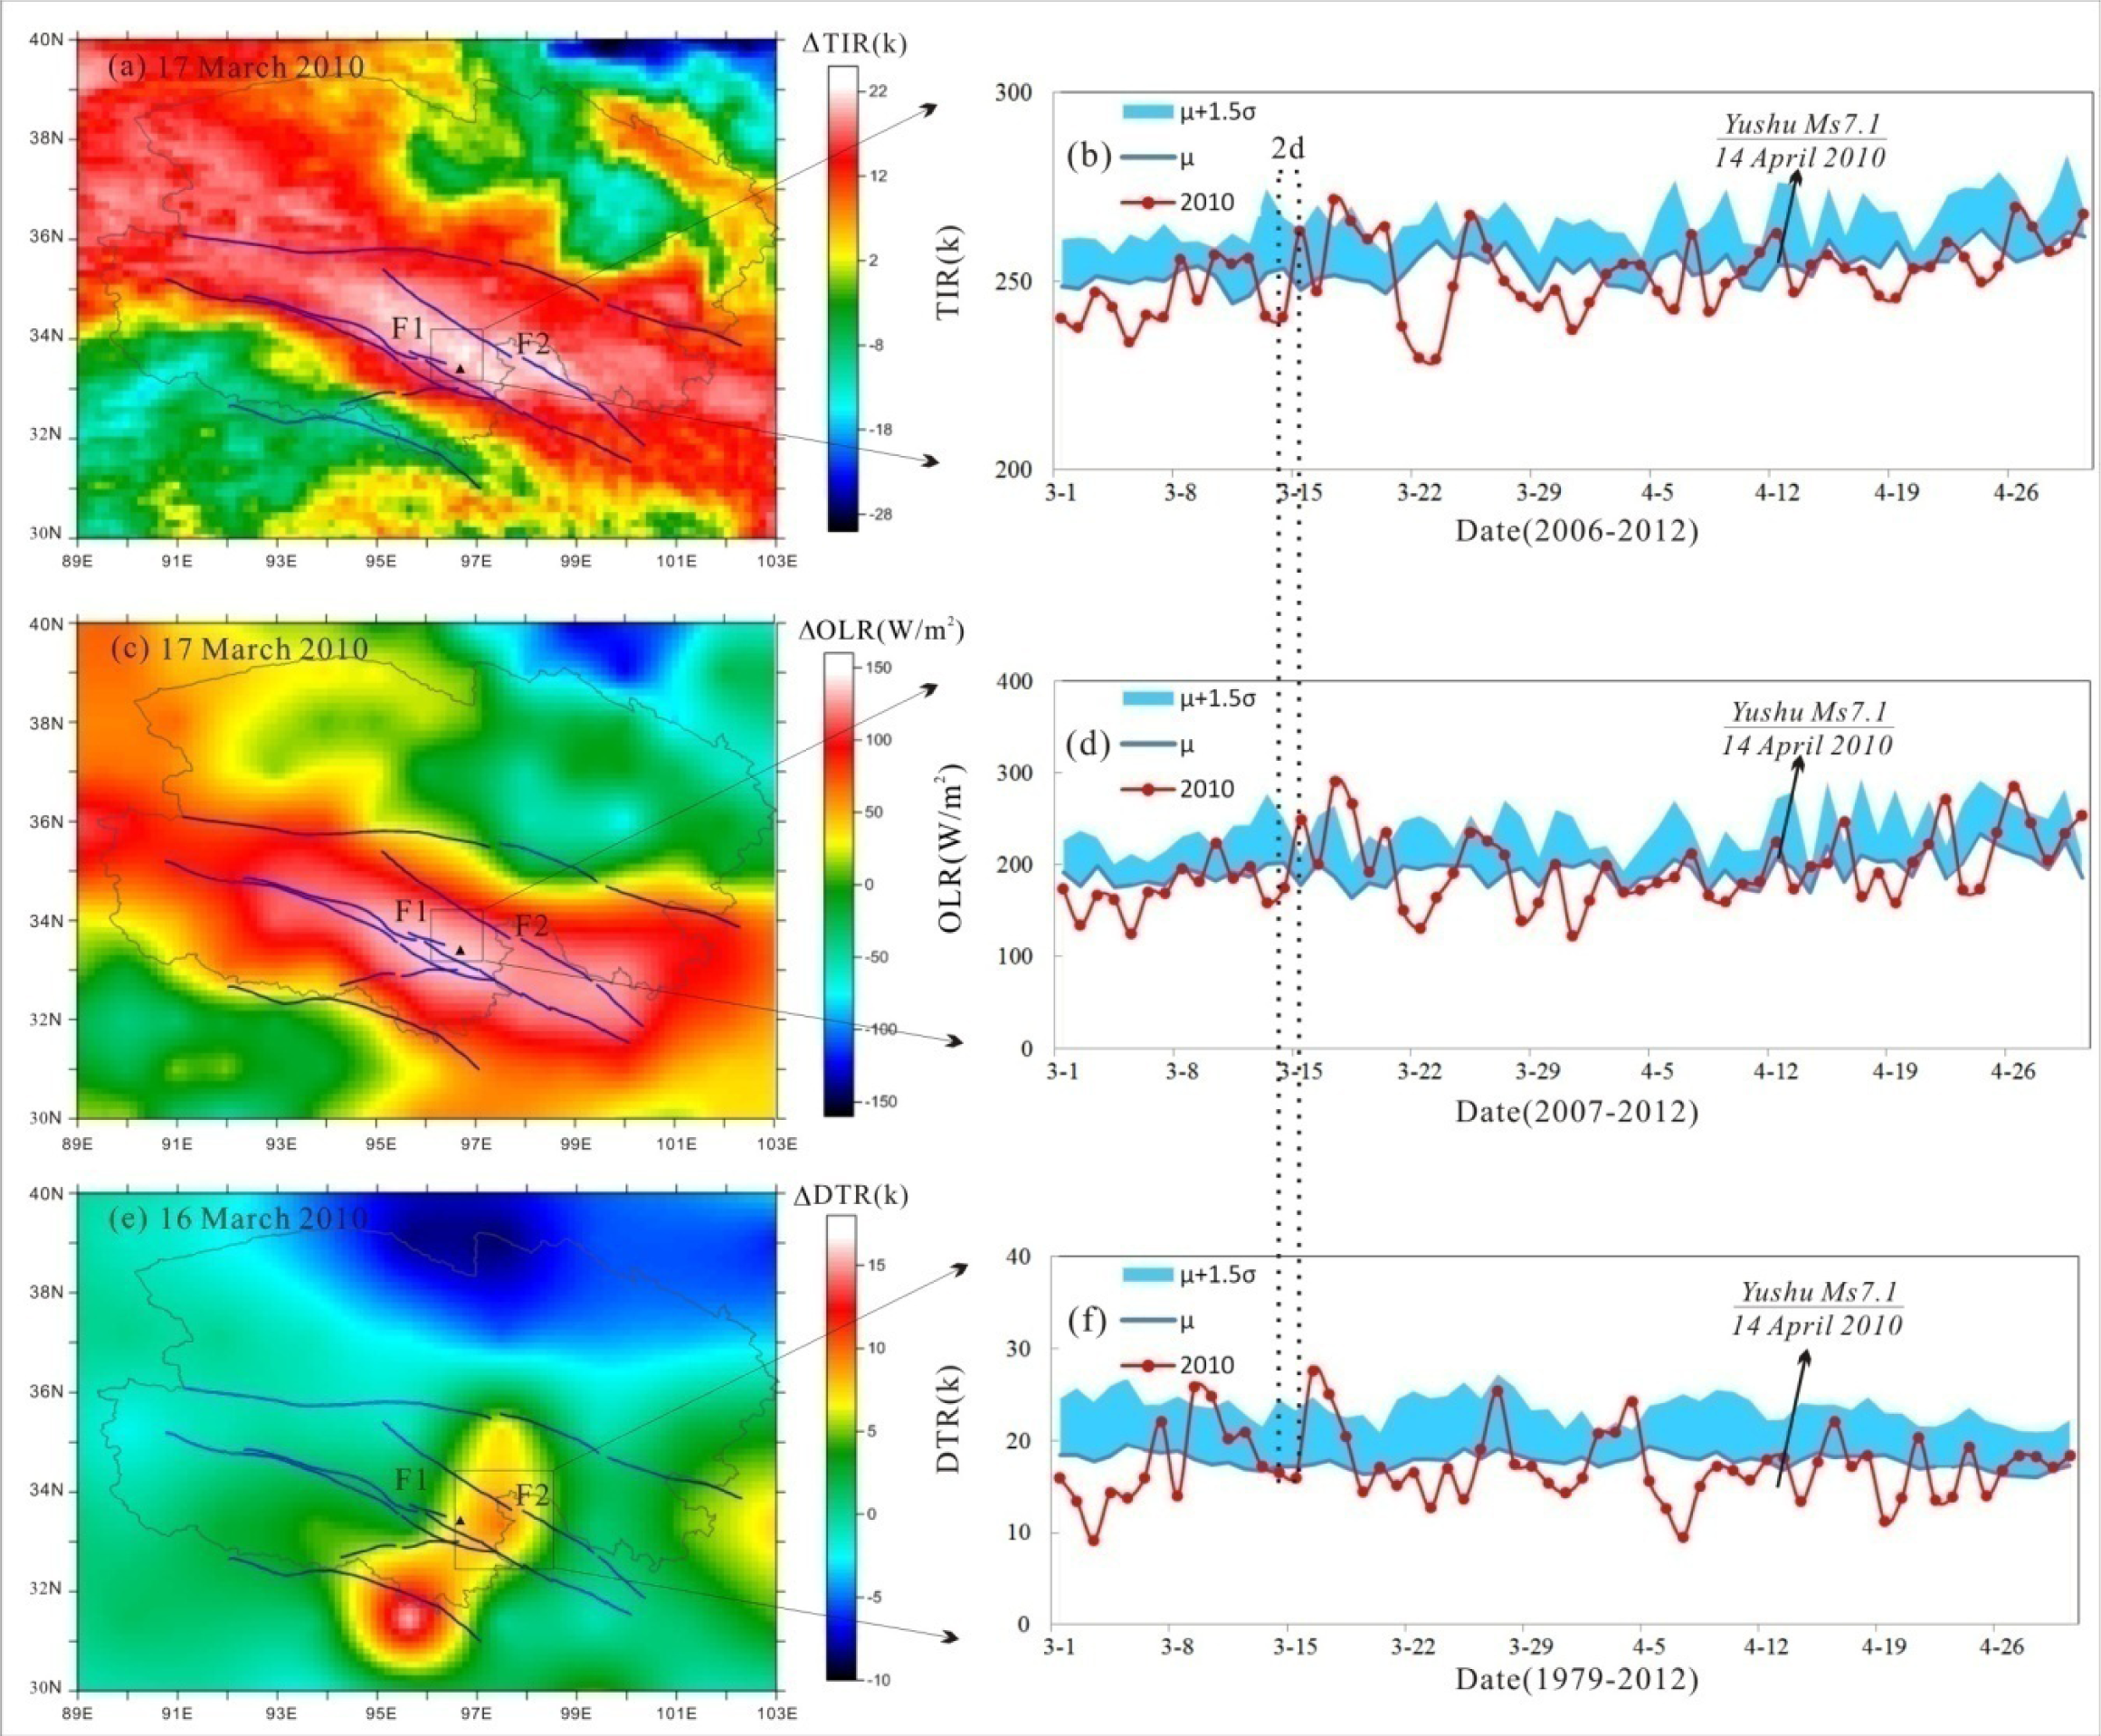
We found from the time-series curves and the differential images of individual thermal parameters that: (1) On 17 March 2010, there were high value strip-shaped zones of TIR and OLR anomalies spatially confined by the Ganze-Yushu Fault (F1) and the Qingshuihe Fault (F2) (
Figure 3a,c); (2) On 16 March 2010, there was a high value zone of DTR perpendicular to the Ganze-Yushu Fault (F1) and the Qingshuihe Fault (F2) (
Figure 3e); (3) The data of TIR and OLR on17 March 2010, and DTR on 16 March 2010 (
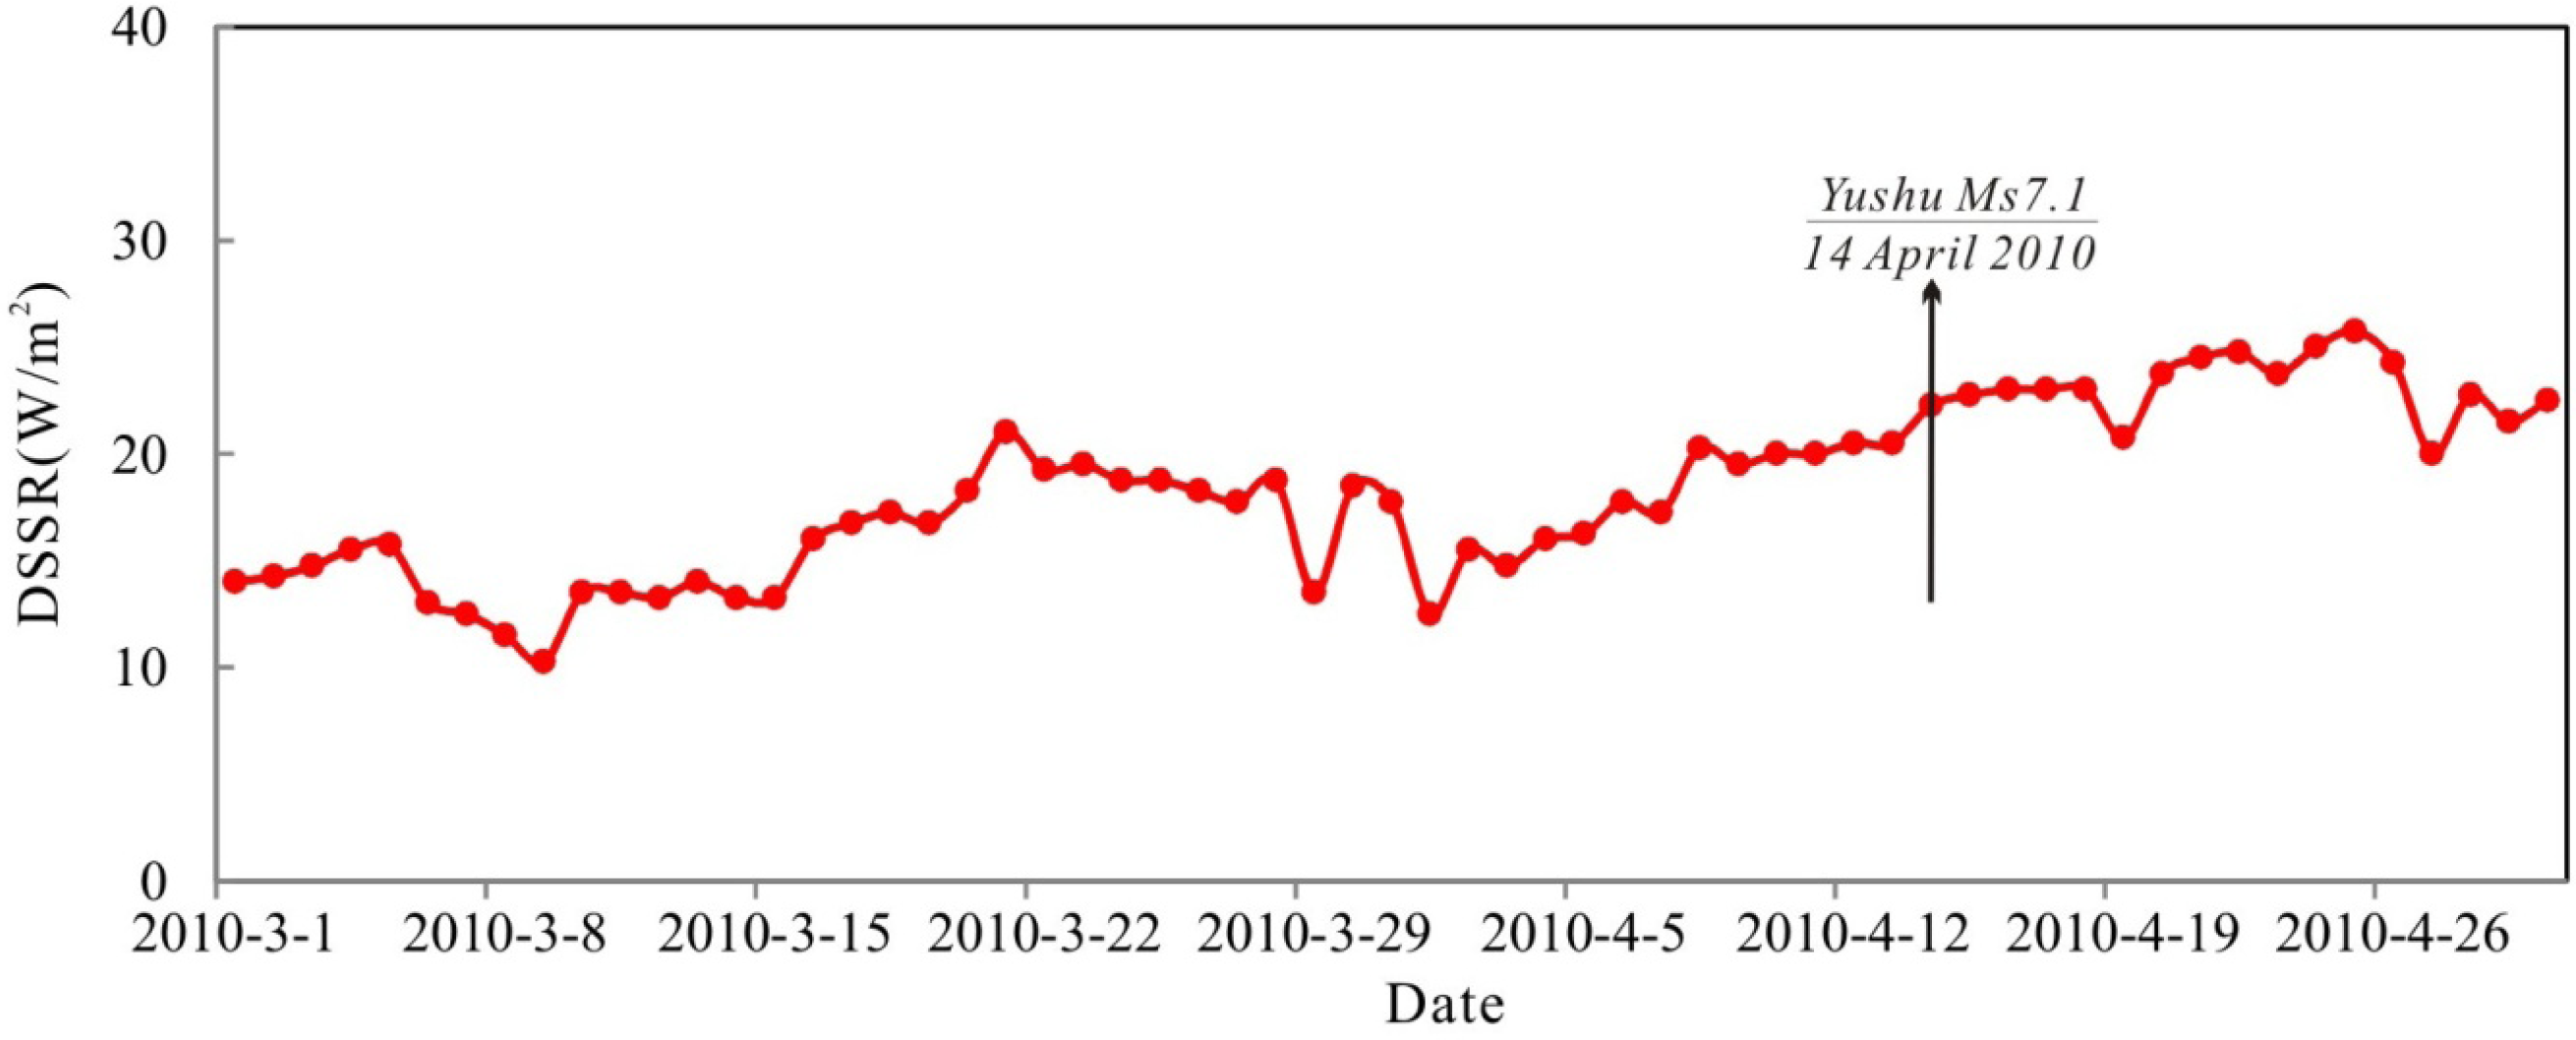
Figure 3b,d,f) were larger than μ + 1.5σ relative to the background. Furthermore, to answer whether or not the thermal anomaly was due to solar radiation, daily surface solar radiation (DSSR) data from FY-VISSR were analyzed. The result shows that, on 16 and 17 March 2010, the total solar downward shortwave radiation energy at earth surface from sunrise to sunset was not at high levels (
Figure 4). Therefore, the thermal anomaly pattern before the Yushu earthquake can be recognized as: multiple thermal parameters (TIR, OLR, and DTR) anomalies had appeared quasi-synchronously 29–28 days before shocking, and they were spatially related to the tectonic faults and the epicenter.
Summarizing the recognized anomalies of the above mentioned 7 cases, it was revealed that (
Table 1) there are at least two (2–5) thermal parameters appeared anomalies 5–32 days before the earthquakes, and the maximum
RI is 69.27%.


