1. Introduction: Remote Sensing Based Flood Monitoring
Flood assessment has been undertaken by numerous authors. While flood waters usually bring with them fertile sediments for agricultural fields, support irrigation, allow access to fish protein resources, and enable long term water storage, they also often have devastating consequences. Floods lead to the hindrance of transportation, bring with them pollution and disease, lead to the destruction of infrastructure, and more people lose their lives due to floods than due to any other natural hazard [
1–
3]. It is widely accepted that synthetic aperture radar (SAR) data is a suitable choice for the mapping and monitoring of flooded areas [
4–
8] as it allows for observations even during heavy cloud cover (typical during rainy seasons). Leinenkugel
et al. [
9] demonstrate that especially in the Mekong region cloud cover reaches 85%–95% during these monsoon-influenced months.
In radar images, flooded areas have very characteristic backscattering properties. They yield no or a very low return signal as water surfaces act as specular reflectors. Therefore, flooded areas can easily be distinguished from other types of land cover, if not disturbed by strong wind, which leads to increased surface roughness (waves) [
10]. Numerous authors assess flood situations based on a single radar data set, simply depicting the uni-temporal flood water extent and discuss flood water impact on other land cover classes, such as urban areas or infrastructure. Advanced studies rely on multi-temporal data to analyze flood progression [
6,
7,
11–
19].
For the Mekong Delta in Vietnam, Long
et al. [
3] used five ERS-2 SAR datasets to map flood occurrence and also flood mapping based on optical data has been undertaken. Sakamoto
et al. [
20] investigated temporal changes in the extent of annual flooding based on 500 m MODIS data spanning the years 2000–2004. The most comprehensive SAR based analyses was recently published by Kuenzer
et al. [
8] presenting flood and inundation patterns for the whole Mekong Delta based on a comprehensive Envisat ASAR-WSM (Envisat Advanced Synthetic Aperture Radar, Wide Swath Mode) time series of 60 observations spanning five years. Based on this extensive data set of 150 m spatial resolution it was elucidated that flooding in the Mekong Delta progresses radially from the Mekong branch main stems outwards, as well as from the Northwest to the Southeast. Furthermore, several flood components such as overland related flooding, tide related flooding, floods induced via human control, and floods due to heavy local precipitation could be identified [
8].
The study presented here has a different focus. We focus on the heavily urbanized province of Can Tho and here especially the city of Can Tho within the Mekong Delta and assess the capability of not only Envisat ASAR-WSM, but also additional TerraSAR-X Scansar and Stripmap data to analyze urban flood situations.
Research on the delineation of flood prone areas based on digital elevation models has been carried out by Dewan
et al. [
21] and Joshi
et al. [
22], amongst others. Verbeiren
et al. [
23] developed a method to assess urbanization growth and the related impact on flood prediction around Dublin City, Ireland. Flood monitoring in densely settled urban areas based on SAR data has been undertaken by Henry
et al. [
7], and Mason
et al. [
24,
25]. Henry
et al. [
7] compared the flood boundary delineation capability of multi-polarized Envisat ASAR data with ERS-2 data during the 2002 Elbe river flood in Dresden City and Mason
et al. [
24] investigated the century flood in Tewkesbury, UK in 2007. Mason
et al. [
26] developed a LiDAR post-processor based on the fusion of airborne scanning laser altimetry and digital map data for urban flood modeling. Schumann
et al. [
27] examined the potential of remote sensing to monitor flood dynamics in urban areas using a combination of a series of space-borne SAR data (ASAR-WSM, Radarsat-1, ASAR IMG, TerraSAR-X) and aerial photographic images. An automatic near real-time flood delineation algorithm working also in urban areas has been developed by Mason
et al. [
25,
26] and applied with TerraSAR-X data.
The region-specific as well as general questions we aim to answer are the following:
Which spatial patterns with respect to flood occurrence exist in Can Tho province? Which areas in Can Tho province are most frequently flooded and why?
Can Envisat ASAR-WSM and TerraSAR-X data support urban flood mapping? What scale issues arise when mapping floods with SAR sensors of differing spatial resolution in dense urban areas? What are advantages and disadvantages of Envisat and TerraSAR-X based flood monitoring?
2. Study Area: The Mekong Delta and Can Tho Province
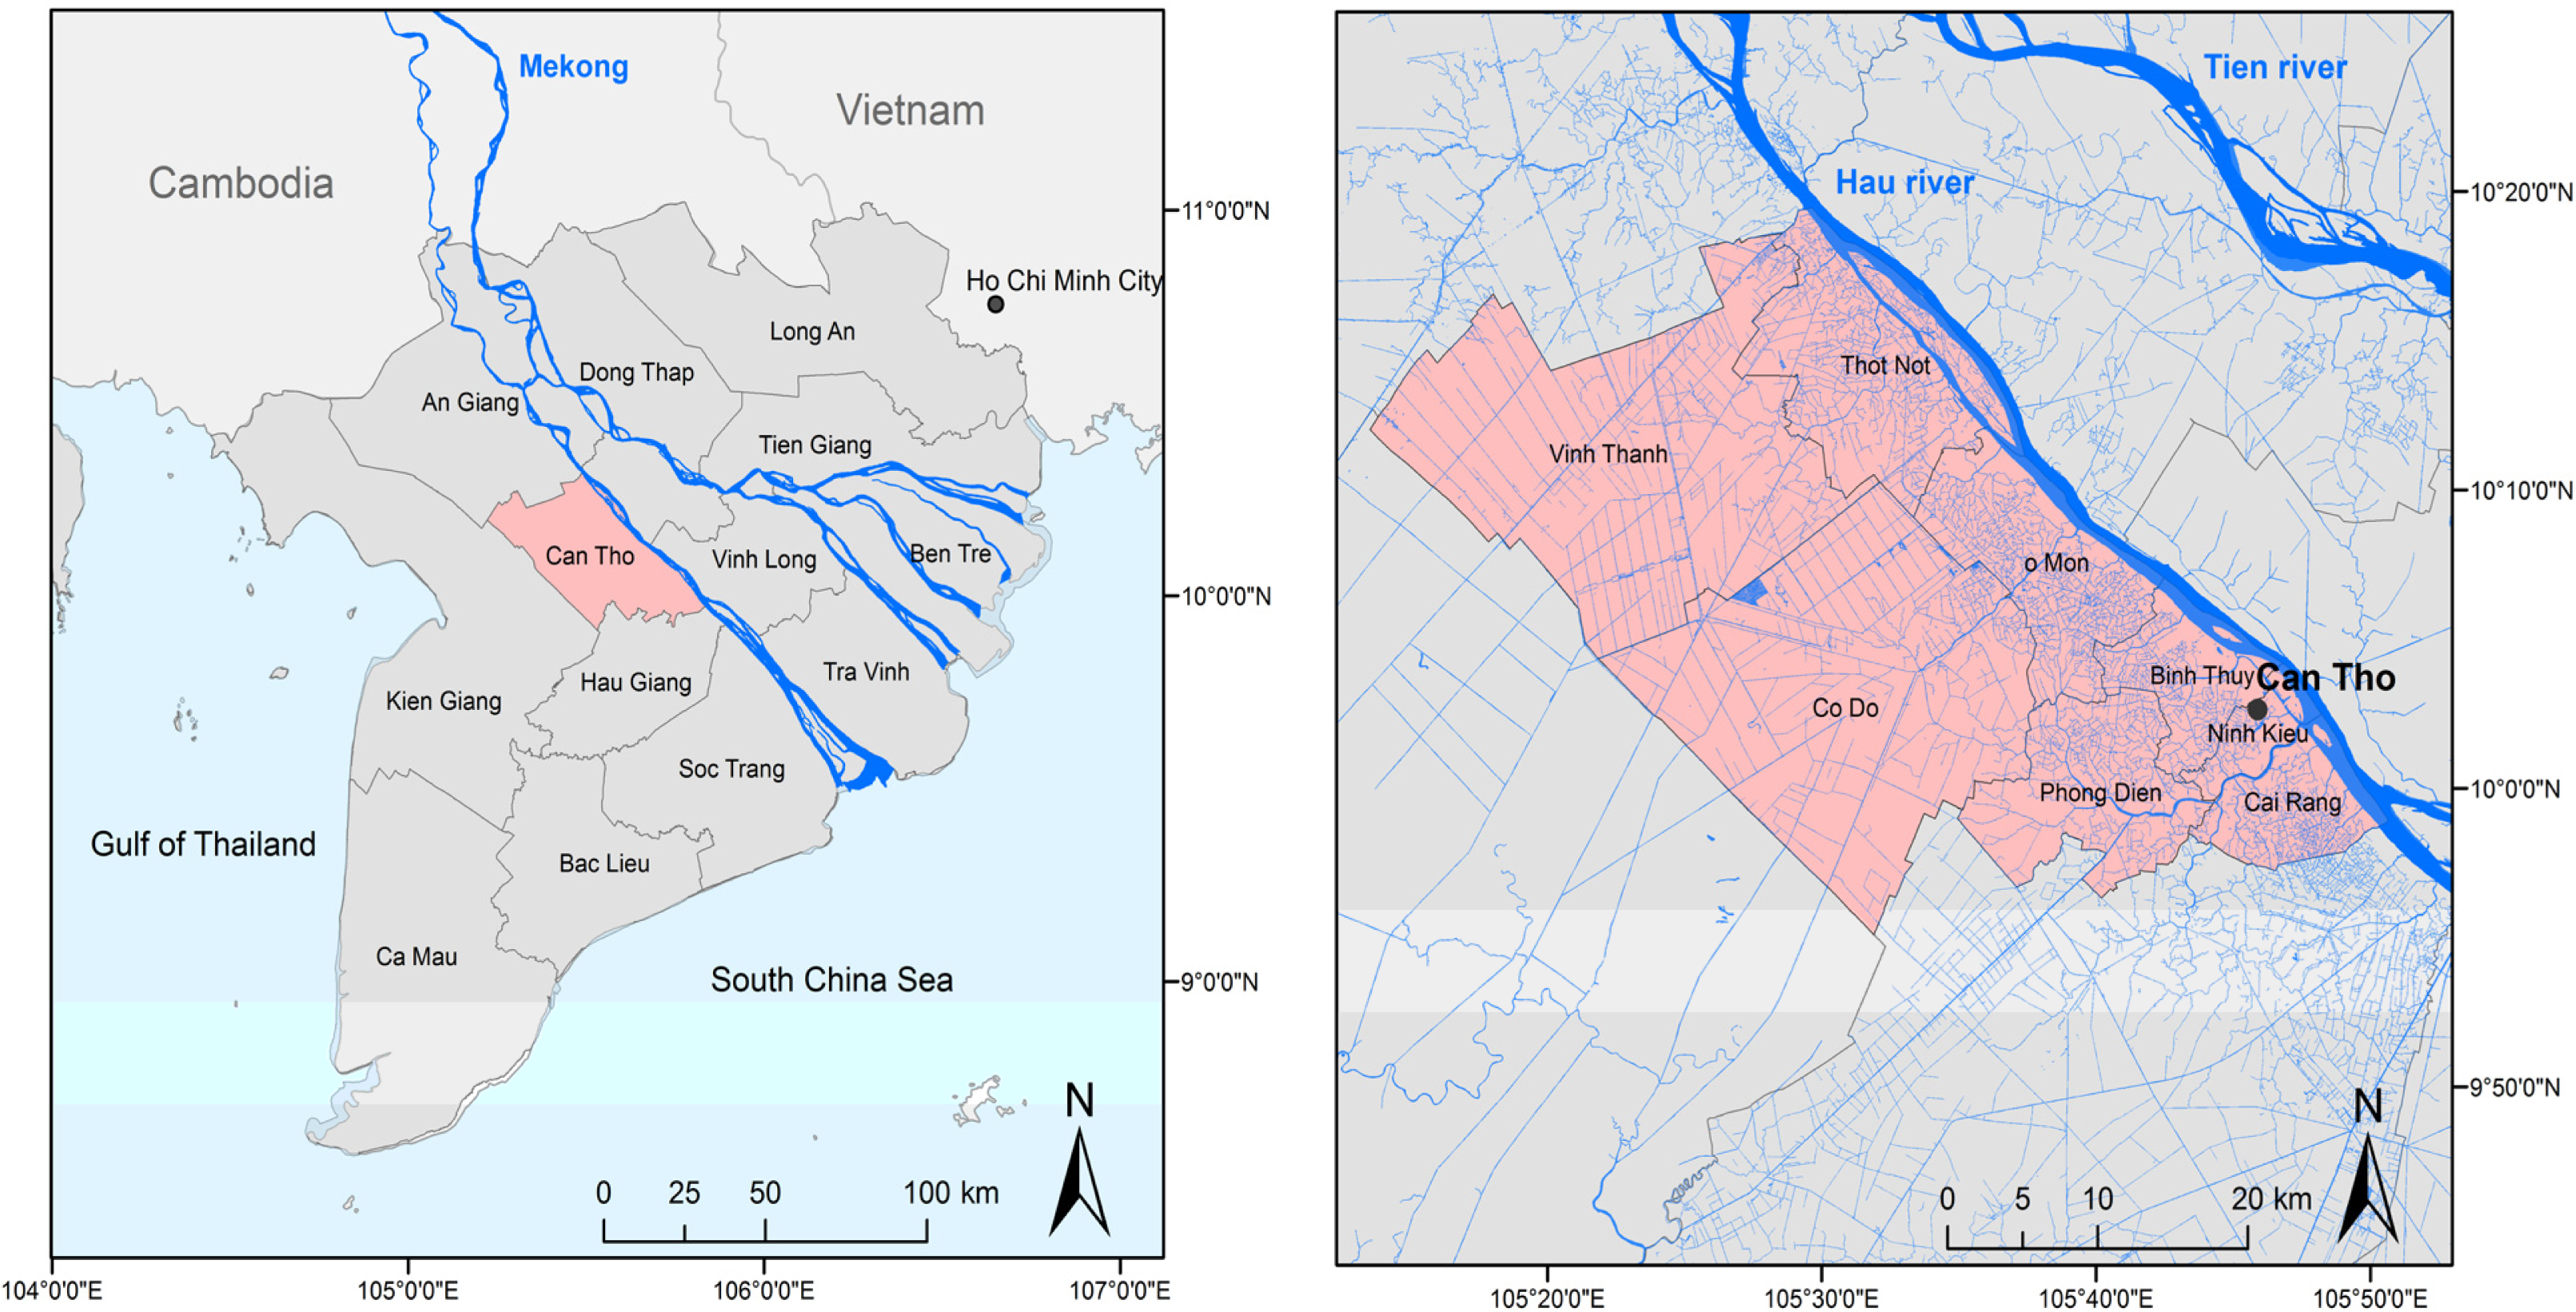
The Mekong Delta (see
Figure 1) spans an area of 39,000 km
2 and is therefore one of the largest river deltas on our planet. Located between 8°30′–11°30′N and 104°30′–106°50′E it is home to over 18 million residents. The delta is the final destination of the Mekong river, which originates at the Tibetan plateau and crosses China, Myanmar, Laos, Thailand, and Cambodia before entering Vietnam, where the Mekong (in Vietnamese termed Cuu Long) splits up into different branches, and empties into the South China Sea [
28]. The low lying Mekong delta is mainly a rural landscape. Rice fields [
29], vegetable fields, fruit tree orchards, and aquaculture ponds, as well as scattered small villages and towns, all dissected by a dense network of canals and dykes characterize the region. The region experiences a distinct rainy season, which lasts from June to December, while the dry season lasts from December to May. Annual flood waters arrive in the Delta from Cambodia via the northern border, and traverse southwards over the course of the rainy season. Especially the northern delta provinces of An Giang, Dong Thap, and Can Tho experience long term periods of flooding [
8,
30]. The flood regime is very complex and influenced by firstly river- and overland flow related flooding, secondly floods induced via human control (operation of sluice gates and dyking), thirdly floods induced via heavy local precipitation events, and last but not least tidal impacts. The latter are expected to aggravate with ongoing sea level rise [
31,
32].
Independent of flood origin: people have learned to live with the annual floods. The nutrient-rich sediments contained in the flood waters fertilize the fields. Overland flooding furthermore allows fishing activities in the rainy season. Thus, the Mekong delta flood is often termed ‘the beautiful flood’. However, extreme flood events may lead to casualties, such as in 1961, 1978, 2000, 2001, and 2002, where hundreds of people lost their lives.
Next to severe floods, further challenges in the delta are socio-economic transformation and urbanization processes [
33], accompanied by the loss of natural wetland habitats [
34–
36], and increasing water pollution.
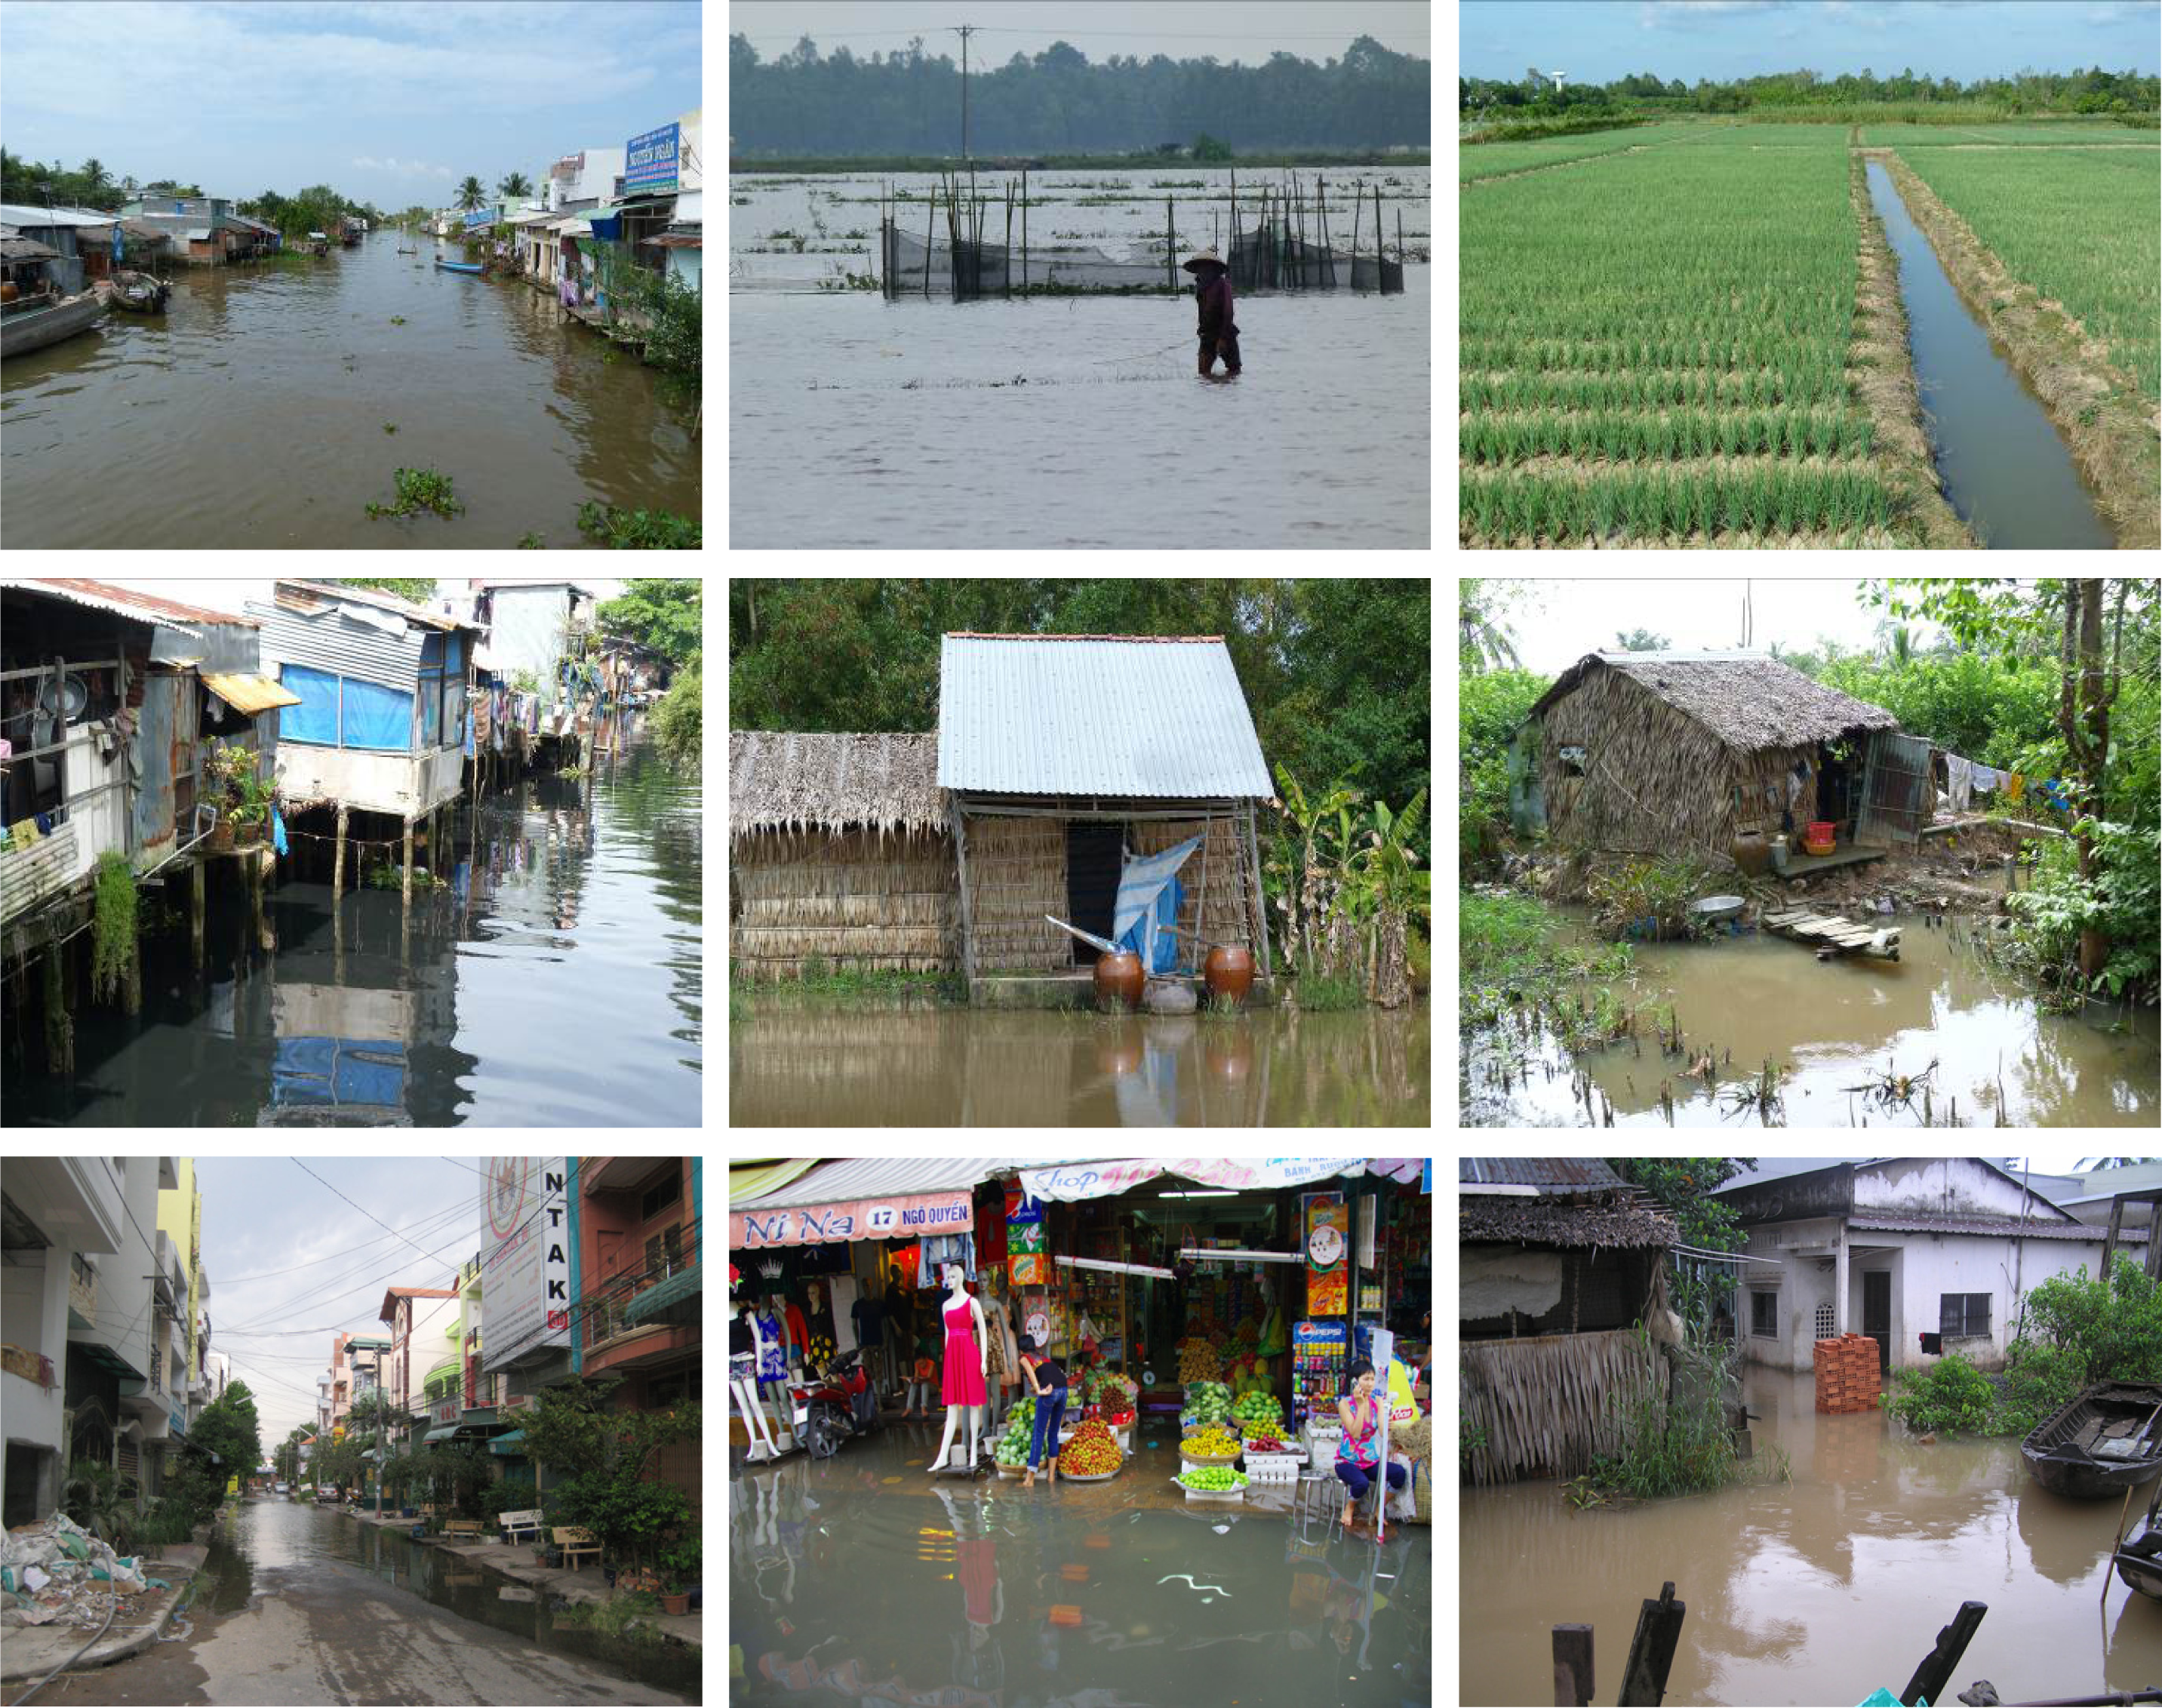
Can Tho province in the delta (see
Figure 1) has an average annual precipitation 2,024 mm and is home to over 1.2 million inhabitants. It is the most densely settled of the 13 provinces (825 persons/km
2) and home to the largest city in the delta: Can Tho City, CTC, located 170 km southwest of Ho Chi Minh City, HCMC. Flooded areas in the province are common during the rainy season, and also urban flooding occurs (
Figure 2).
3. SAR and Optical Data and Ancillary Data Employed for This Study
Three types of SAR data have been available for this study. Firstly, a time series of 60 observations of Envisat ASAR-WSM data spanning the rainy seasons from 2007 to 2011 and covering most of the Mekong Delta including Can Tho Province.
Data of the ASAR sensor (Advanced Synthetic Aperture Radar) operating at C-band has been available until Envisat operational services failed in April 2012. The spatial resolution of the Envisat ASAR-WSM data is about 150 m. All data existed in HH polarization mode, and incidence angles were nearly identical for all scenes, ranging between a minimum of 16.0 degrees and a maximum 42.84 degrees with a mean incidence angle in the center of the track of 30.47 degrees. Can Tho province has been covered completely by each of the 60 datasets. Secondly, we had five TerraSAR-X (TSX) Scansar data available for the rainy season of 2008. TSX Scansar data has a spatial resolution of 8.25 m and comes at a swath width of 100 km. Thirdly, four TerraSAR-X Stripmap data sets at a resolution of 2.5 m has been acquired as well (swath width usually 30 km).
Table 1 below depicts the SAR data employed for this study. The TSX data had also been acquired in HH polarization mode, and average scene center incidence angles were 36.28 degrees for Scansar data and 37.28 degrees for Stripmap data.
Additional data available for this study included a Quickbird scene at up to 0.6 m resolution in the panchromatic band from late 2007, as well as vector data such as province boundaries. The Quickbird dataset was the basis to generate a very valuable vector dataset: for the urban area of Can Tho located along the Bassac River and the Can Tho River, we digitized all existing houses. This dataset contains several thousand house polygons for the Can Tho City area.
Furthermore, the first author undertook field campaigns the Mekong Delta two times per year from 2008 onwards. Detailed knowledge of the region is therefore available [
31,
34]. We also contributed to the validation of the flood mask derivation algorithm presented by Gstaiger
et al. [
7]. Numerous interviews with locals—including scientists and farmers—were led over the course of this five year time span. The knowledge accumulated over these years is of valuable support for the interpretation of remote sensing results. The fourth author of the paper is a Can Tho resident and scientist at Can Tho University, CTU. His local knowledge is of great support for reasonable interpretation as well.
4. Methods and Data Analyses
Flooded areas were derived from the SAR amplitude data as elucidated in detail in Gstaiger
et al. [
7] and summarized in Kuenzer
et al. [
8] from which the following short passage is taken. This simple threshold method enables the extraction of water pixels with characteristic very low backscatter values against non-water pixels, whereas the latter usually have higher values in the image histogram depicting the backscatter distribution. “To firstly reduce the typical speckle characterizing SAR imagery, the first step of the algorithm is to apply a standard convolution median filter with a kernel size of 5 × 5 pixels, resulting in a filtered and speckle reduced image P1. After this pre-processing, two empirically chosen thresholds divide water from non-water pixels (processed image P5). Here, the first threshold, T1, which has a lower value than the final water threshold, defines confident water areas, leading to P2. The second threshold T2, which has a higher value than the land threshold, classifies confident land areas, leading to image product P3. Then buffer zones of two pixels, which are only generated via dilatation, are applied to P2”, which results in product P4. The buffers define the transition zone from water to land, also represented by mixed pixels. The second threshold now enables the inclusion of the water pixels within this zone in the initial binary water mask. The temporary results P3 and P4 are now compared, and if coincidence occurs, the value (water or land, 0 or 1) is written to P5. Otherwise, the value from P2 is written to P5 (P4 & P3 || P2). In this way overestimated water pixels are excluded. Proceeding further, isolated pixels are removed via morphological image closing (P6) [
7] (see
Figure 3). The removal of so-called ‘islands’ and ‘lakes’ according to a defined maximum size (T3,T4) is mainly of relevance for higher resolution SAR data (e.g., TerraSAR-X data also processed in the course of the project), but does not affect Envisat ASAR derived results at 150 m resolution.
The results of this algorithm have been compared with other flood mask derivation approaches, e.g., a histogram texture based approach, and a very interactive object based approach, and it was found that the accuracies of the approach which we use here (97.6%) and the very interactive object based approach (97.8%) were more or less the same, and exceeded the accuracy of a further texture based approach tested (95.6%) [
7,
8].
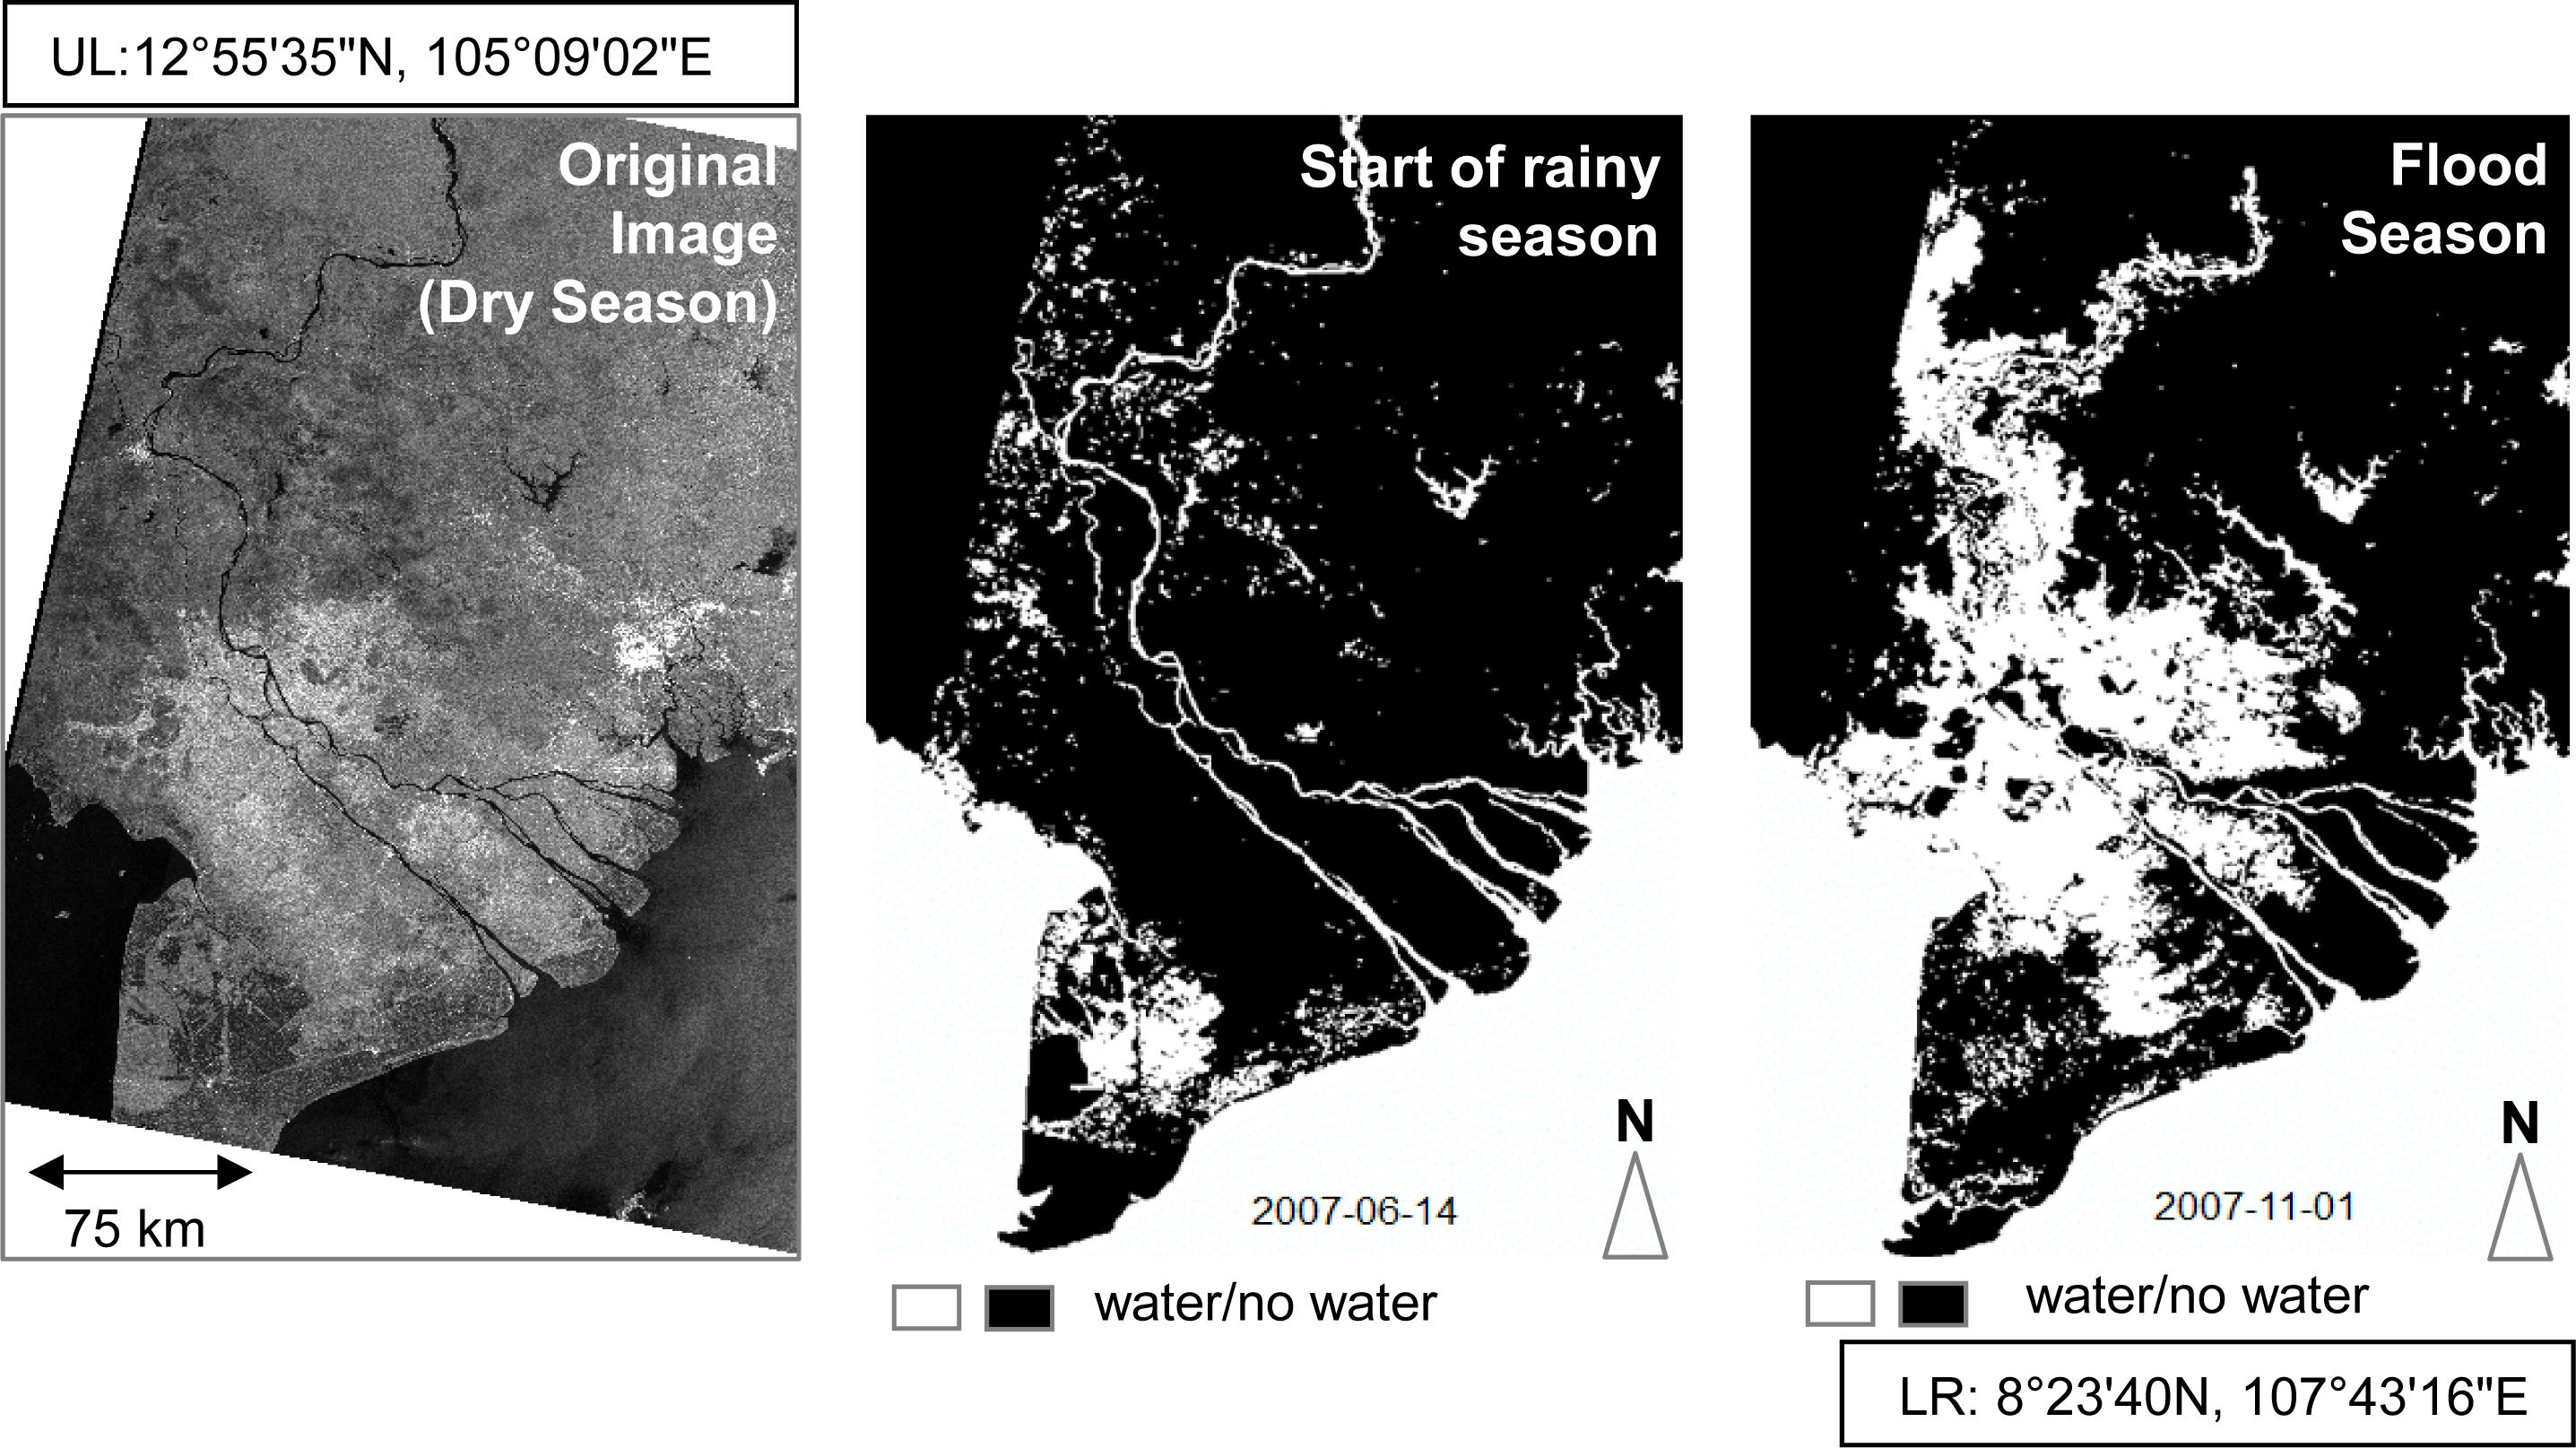
The output of the algorithm are binary images indicating water-covered areas versus non water-covered areas (see
Figure 3). The accuracy of extracted water surfaces is high. This was concluded based on indirect validation via comparison with higher resolution SAR data (e.g., validation of Envisat ASAR derived water masks with water masks derived from higher resolution TerrSAR-X imagery), validation with high resolution optical data, and
in situ ground surveying of water-land boundaries [
7]. We used this algorithm to derive so called ‘water masks’ for our study area, employing different types of SAR data.
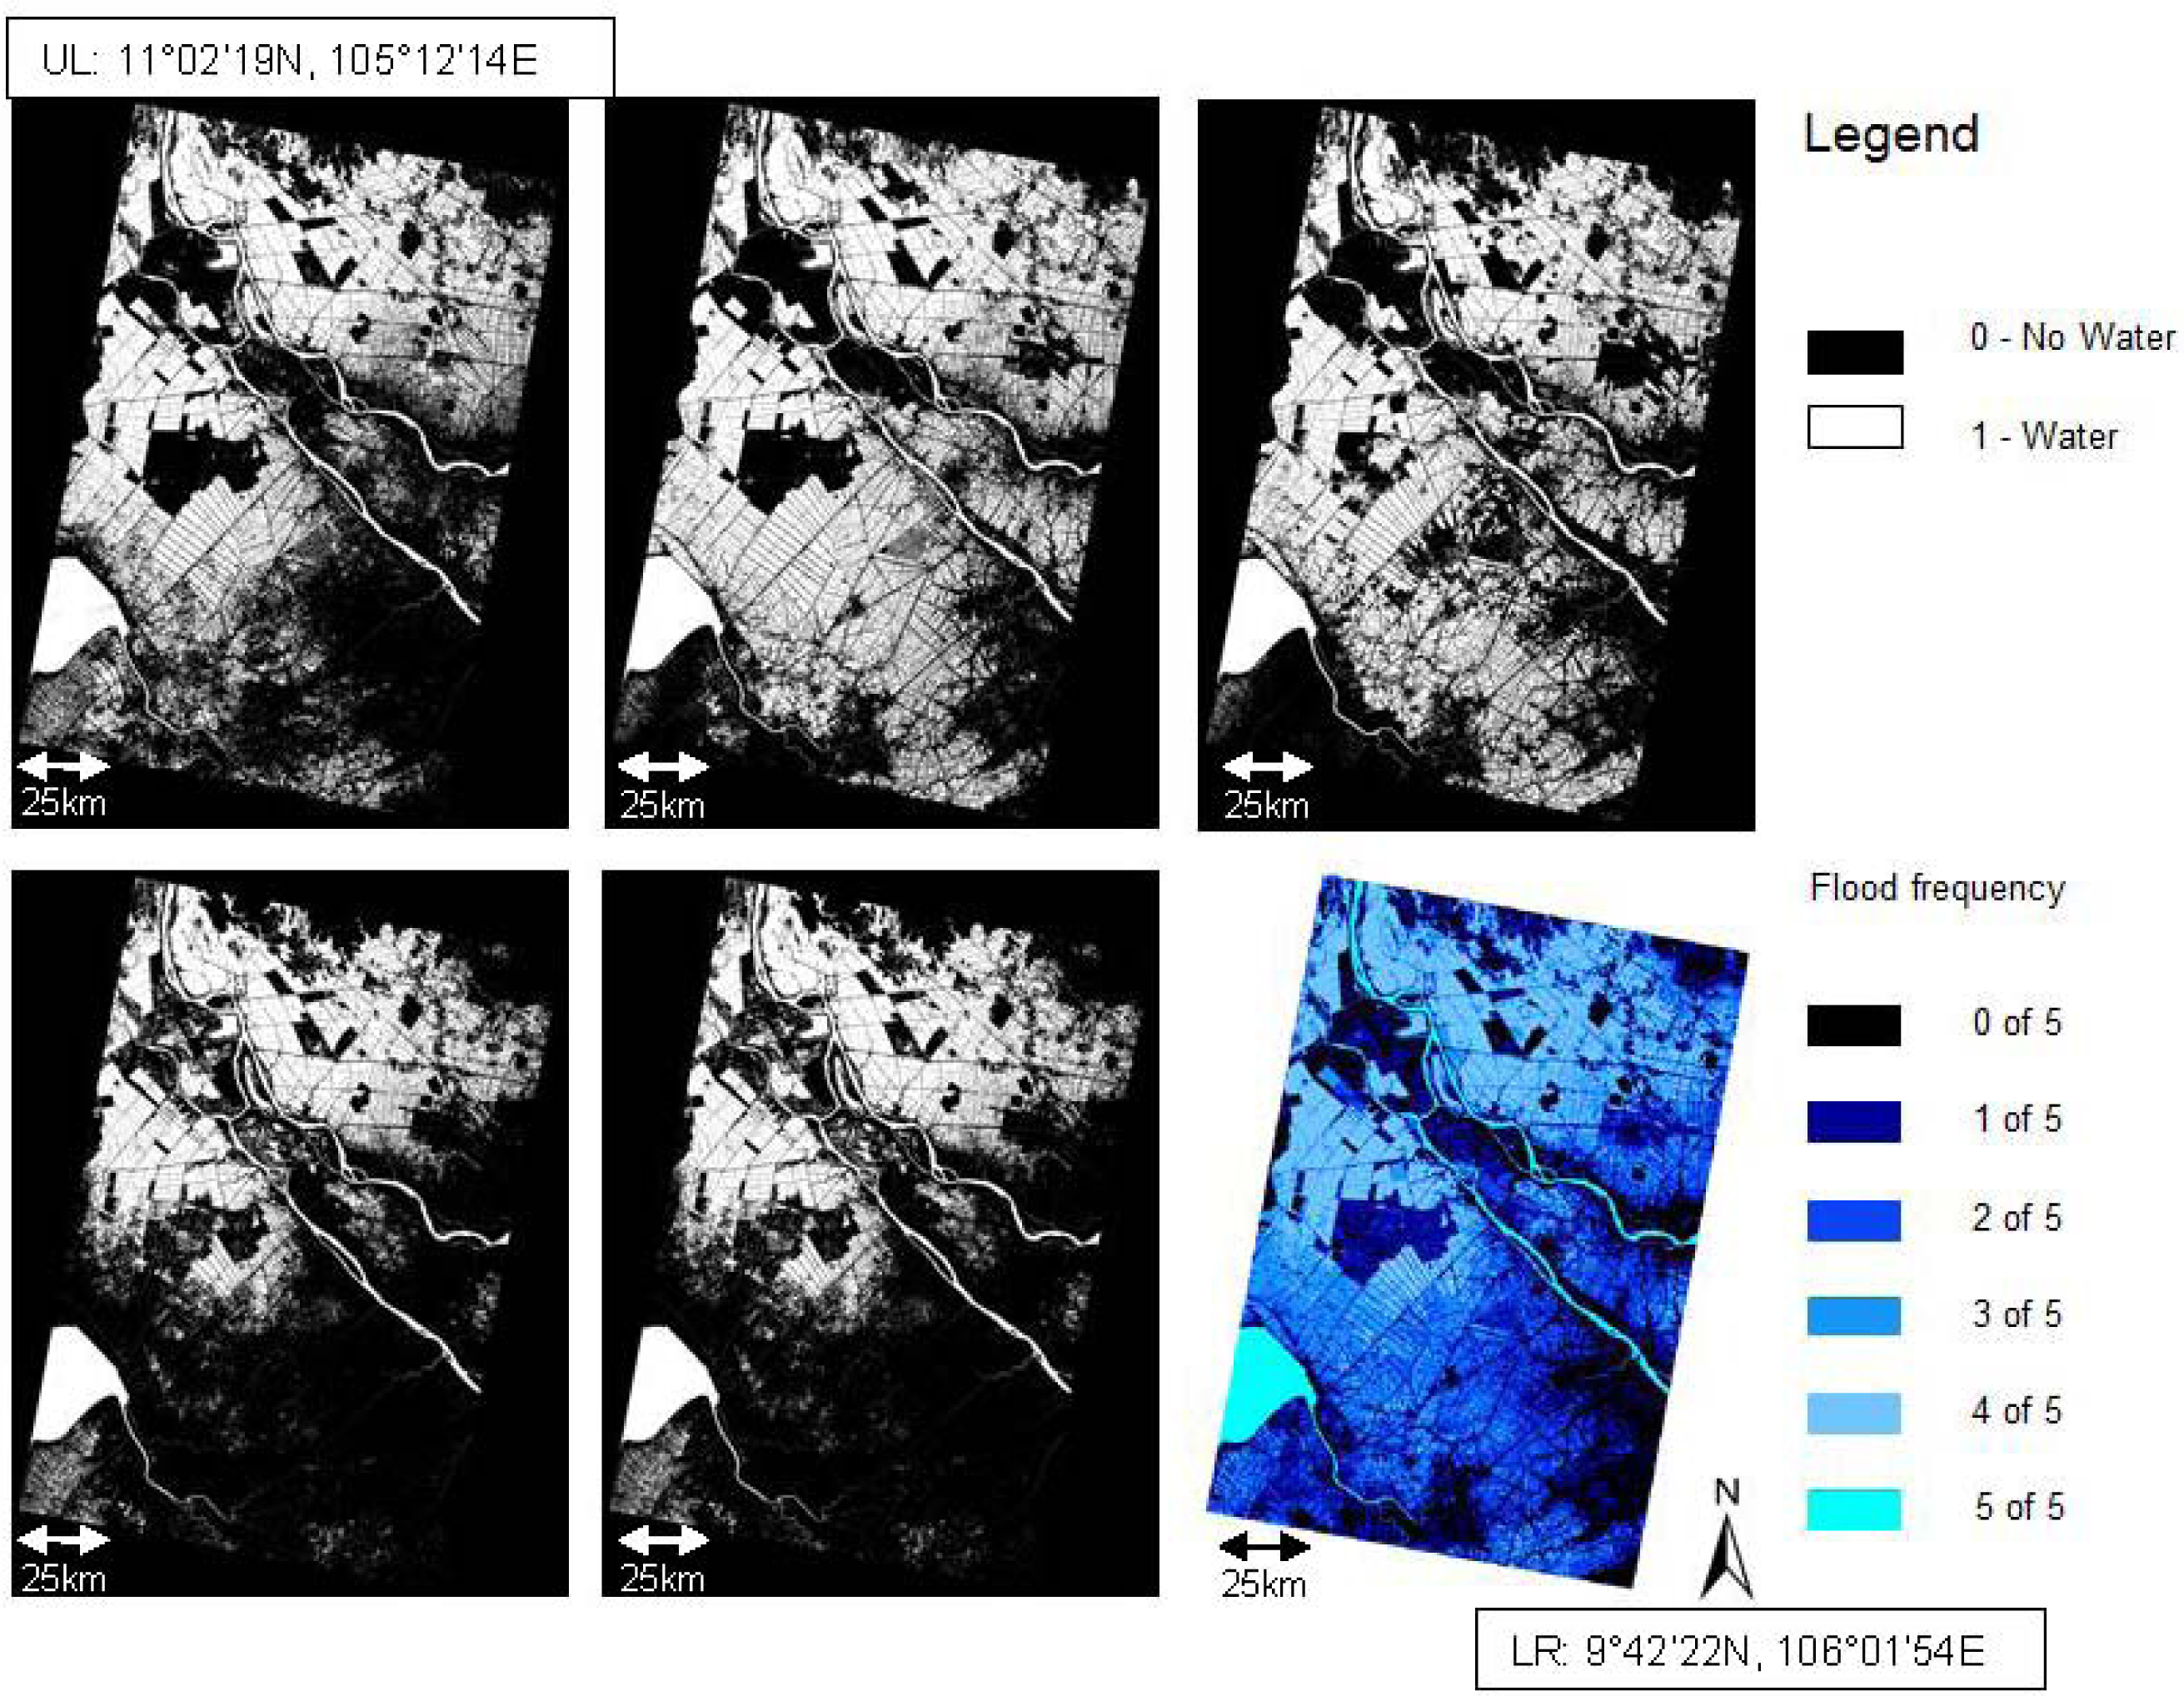
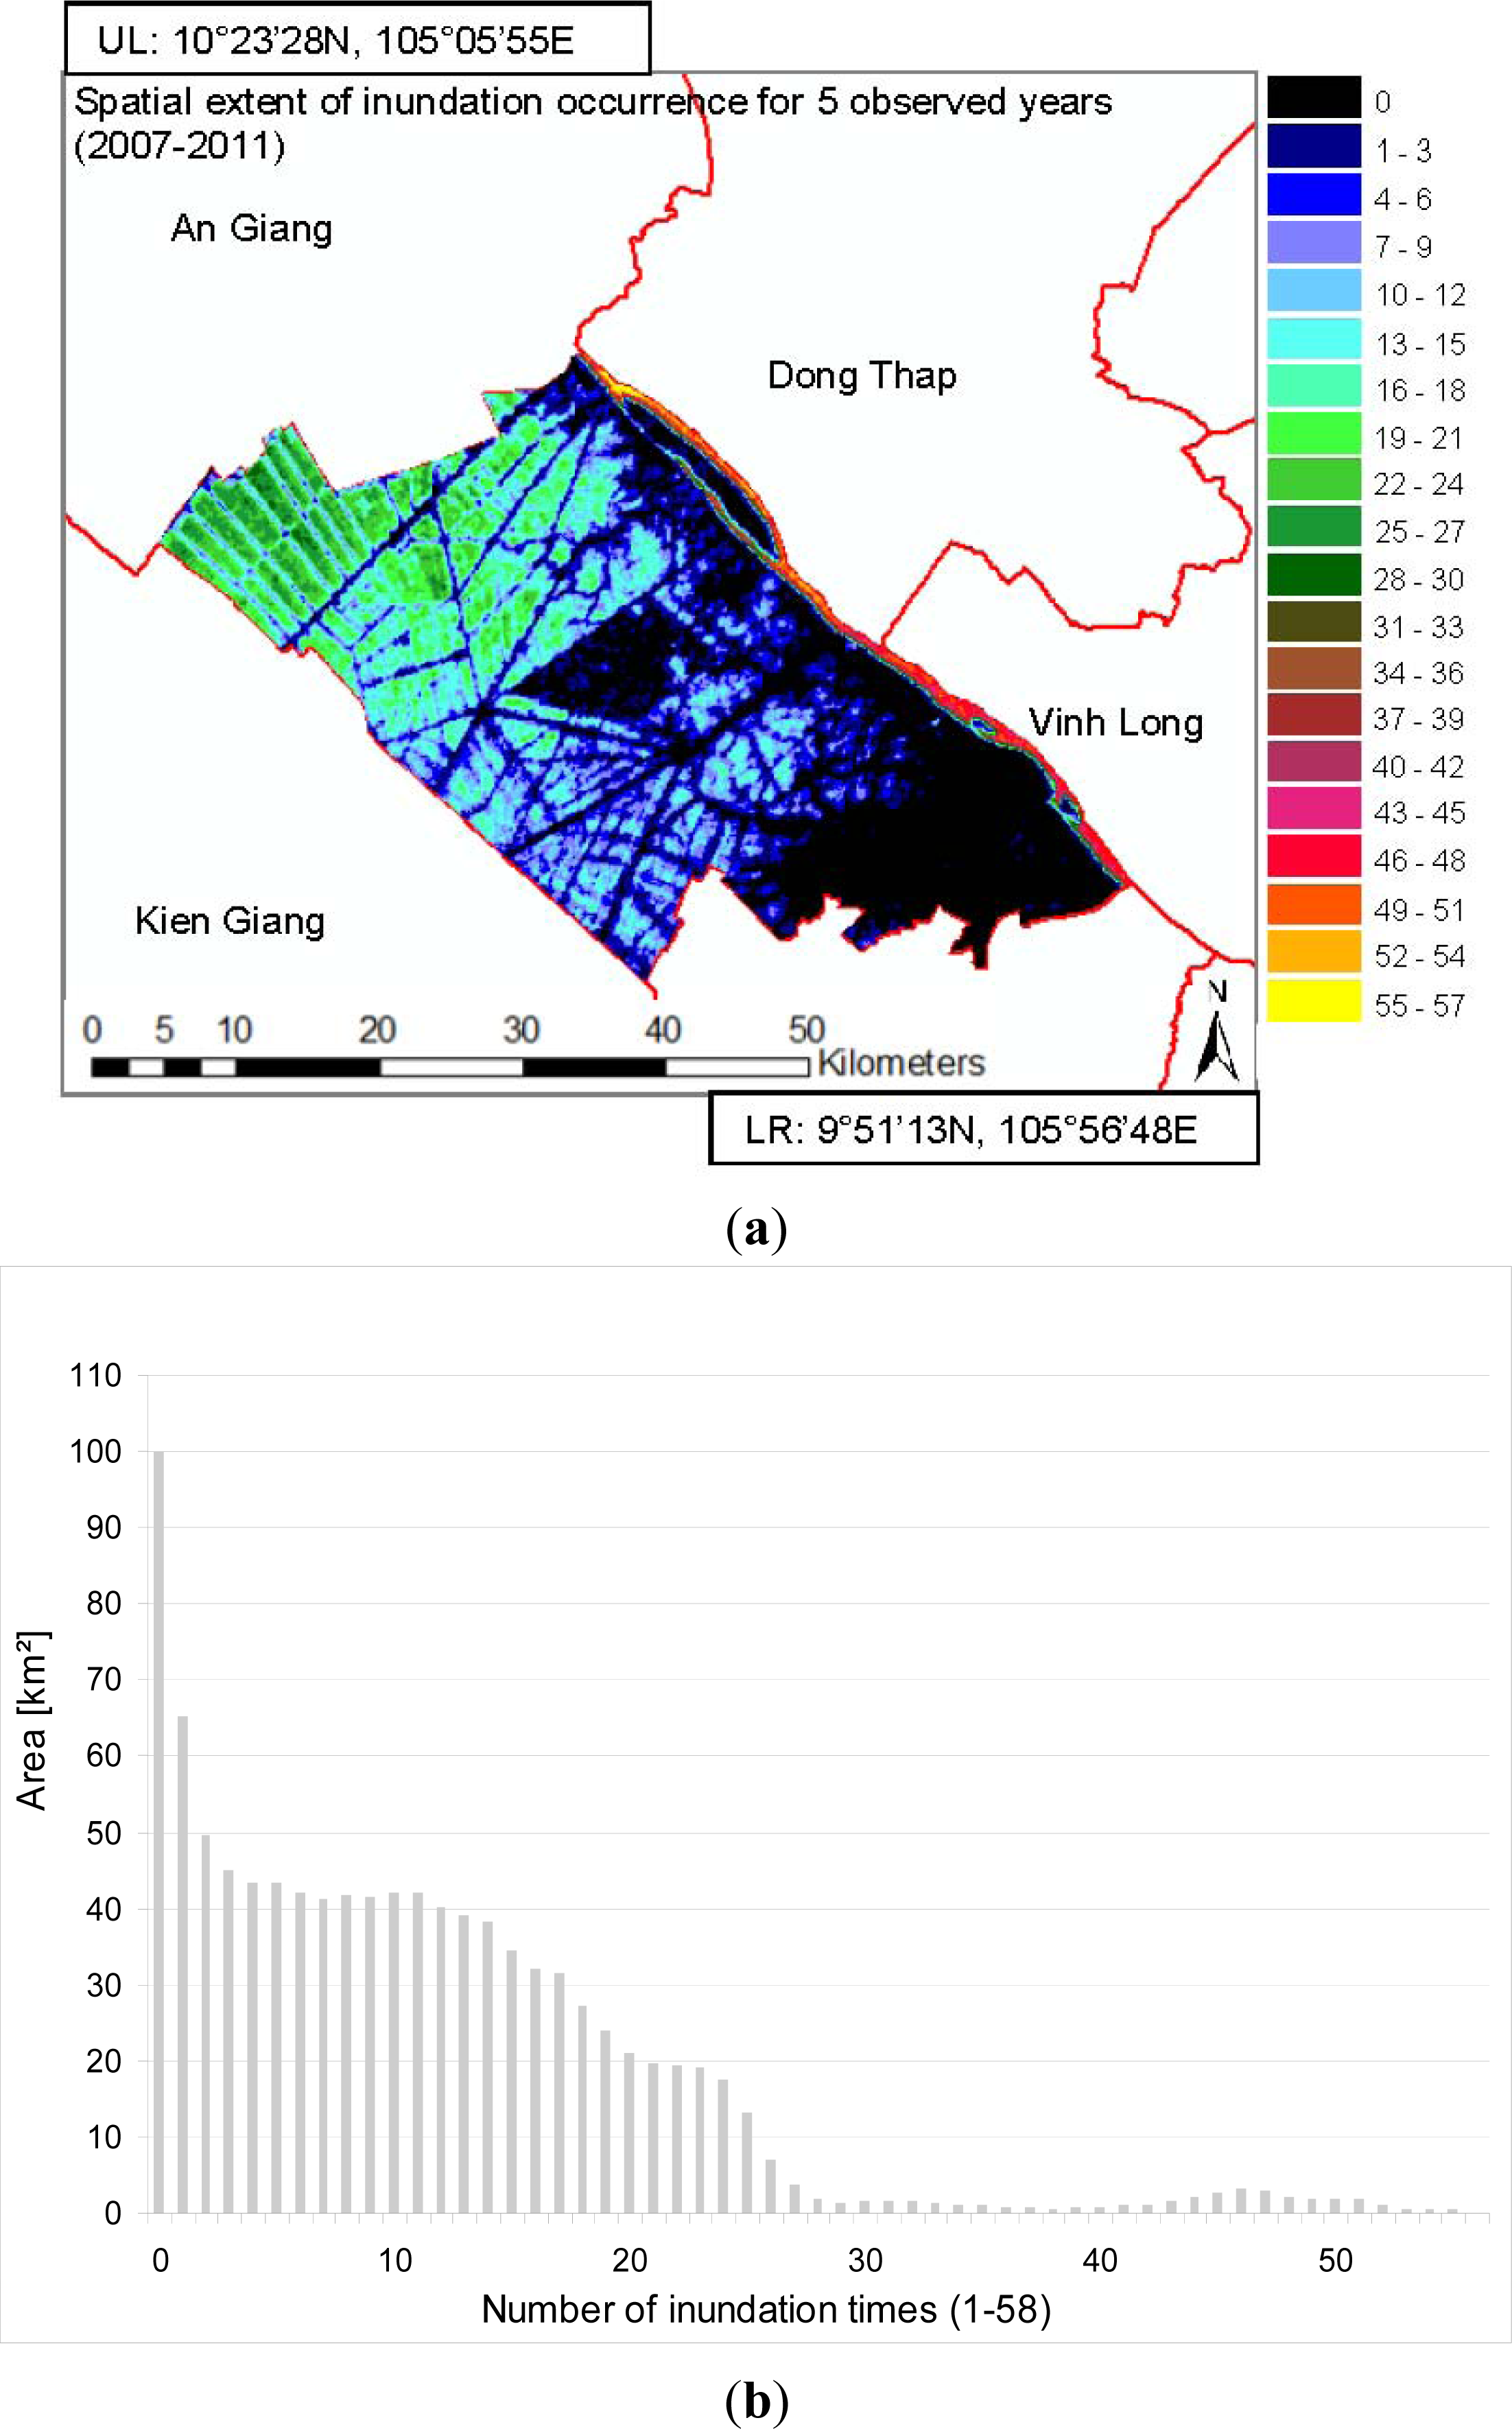
The water masks derived from the individual data sets were then added up as presented in
Figure 4. In this way, we receive a product depicting flood frequency (
Figure 4, bottom right, and
Figure 5). This product illuminates how many times a region was flooded during the observation period. So far, SAR data for the Mekong Delta has not been analyzed in this way, except for the study presented by Kuenzer
et al. [
8].
We then analyzed the general flood patterns in Can Tho province based in the Envisat ASAR-WSM time series, before investigation the city area of Can Tho province—Can Tho City—at greater detail. Here we assessed the relationship between settlement density and proximity to the main rivers, and then analyzed capabilities of different SAR data for urban flood mapping. The results are presented in the following section.
5. Results
5.1. General Flood Patterns in Can Tho Province
Can Tho province comprises an area of 1,457.29 km2. According to the ASAR WSM derived water masks for all five years 430.60 km2—so about one third—are never flooded or inundated during the observations we had available. However, about 100 km2 are flooded one time during the five year time span, about 65 km2 are inundated two times, and nearly 50 km2 are flooded three times. If areas are flooded rarely within five years, this must be the extent of larger flood events. Over 40 km2 each are flooded four to ten times. From there on the flooded area for the individual durations decreases. Regions flooded over 40 times are the rivers, larger canals, and permanent water bodies. In Can Tho province, flooding or inundation probability decreases from the Northwest towards the Southeast. Flood pulse waters reach Can Tho from the northern provinces of An Giang and Dong Thap, which are well known for intensive rice production, and which show longest inundation durations in the delta.
5.2. Relationship between Building Density and Proximity to Main Rivers and Canals
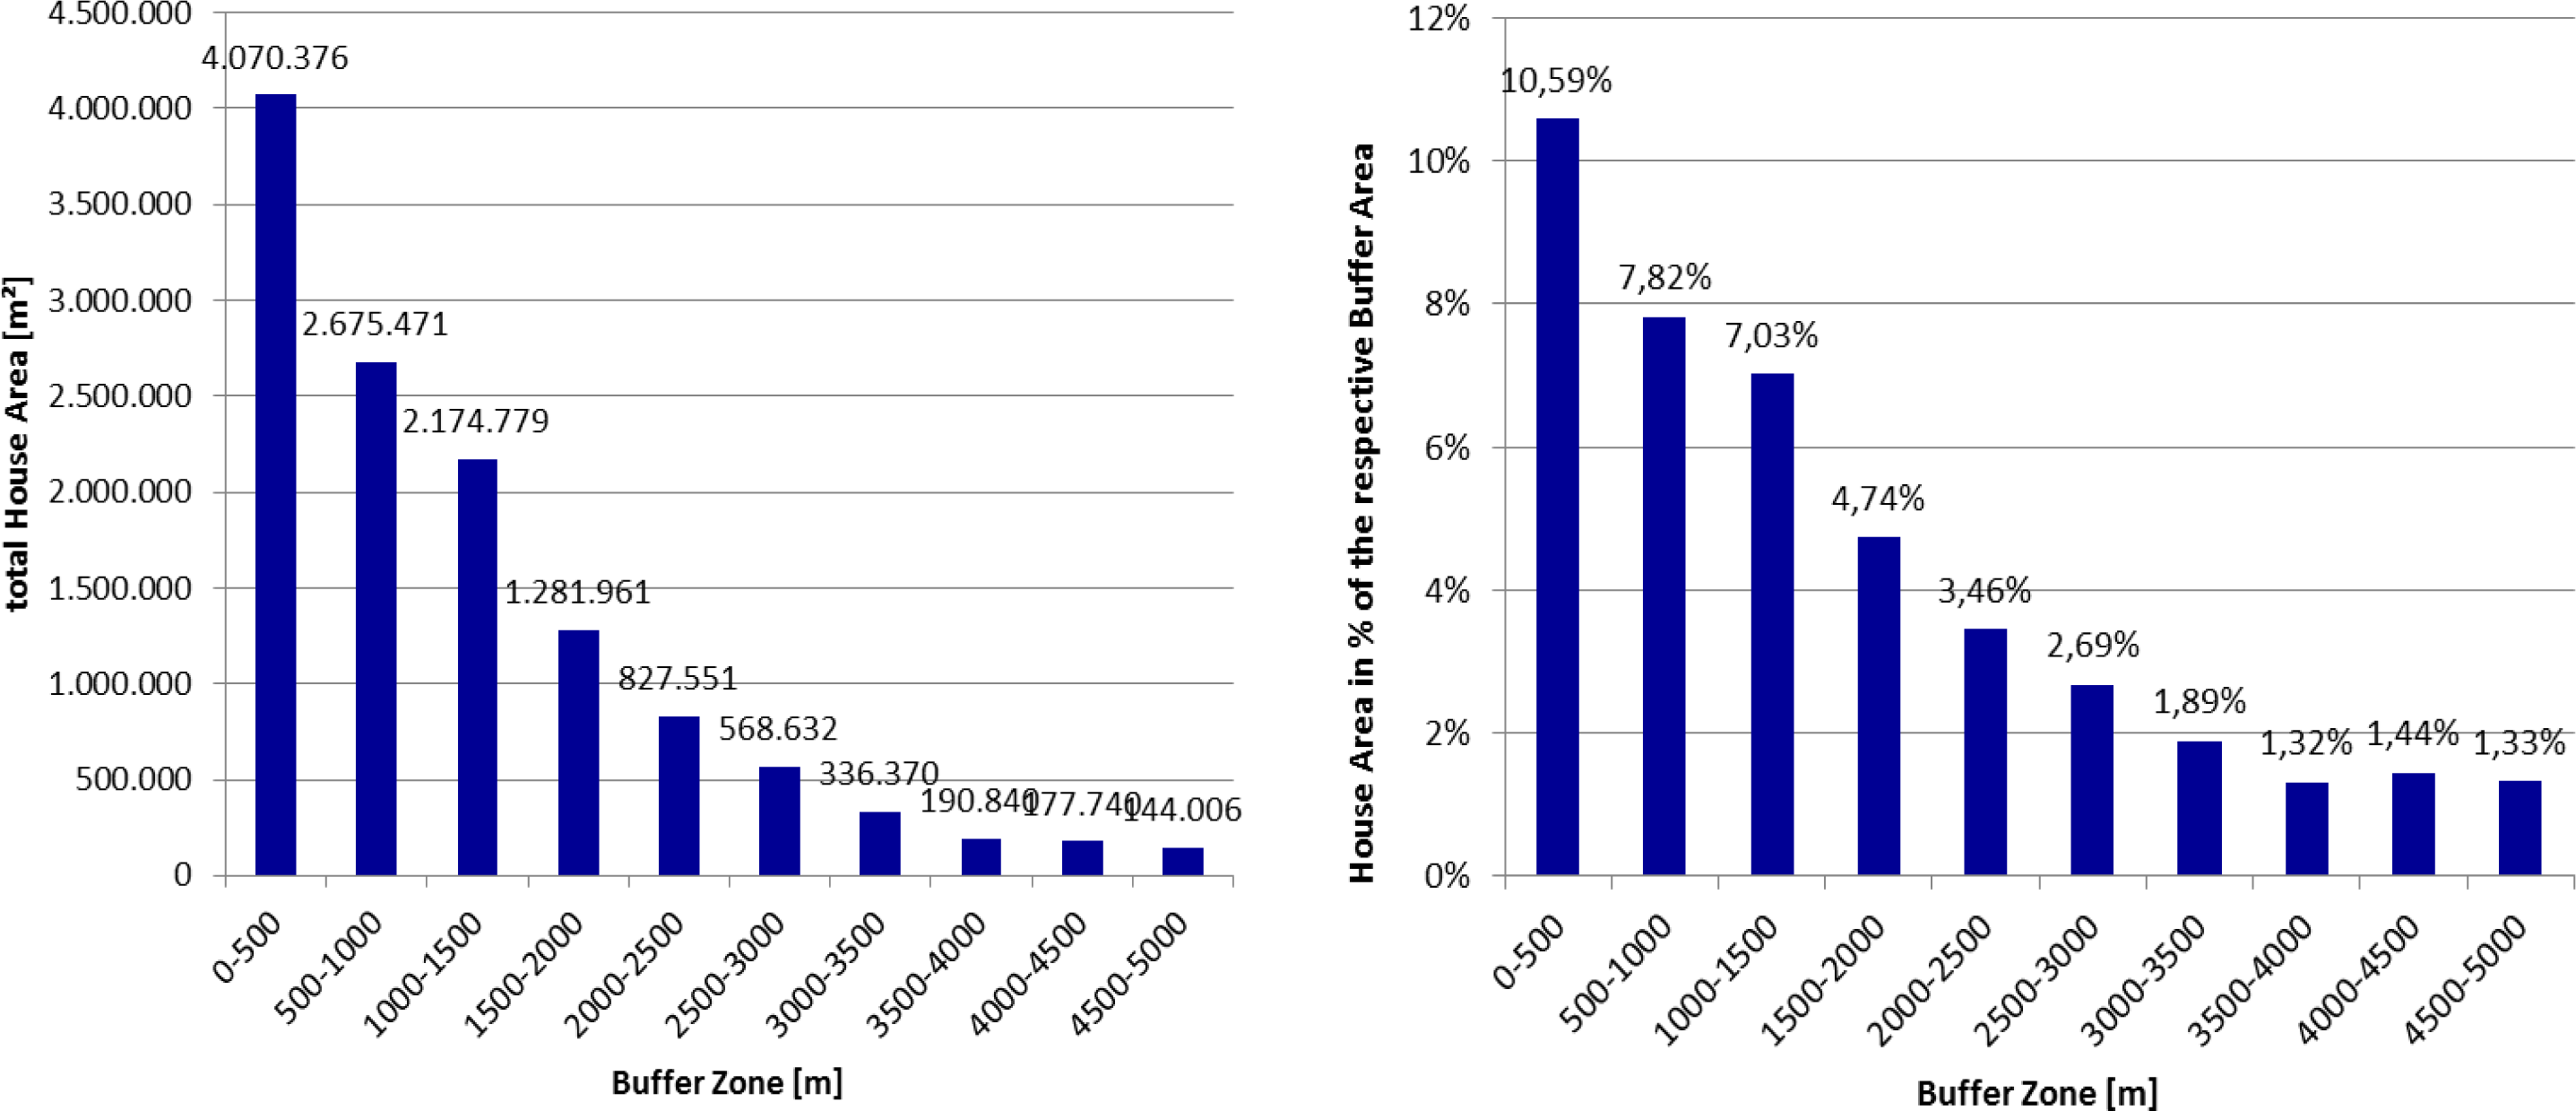
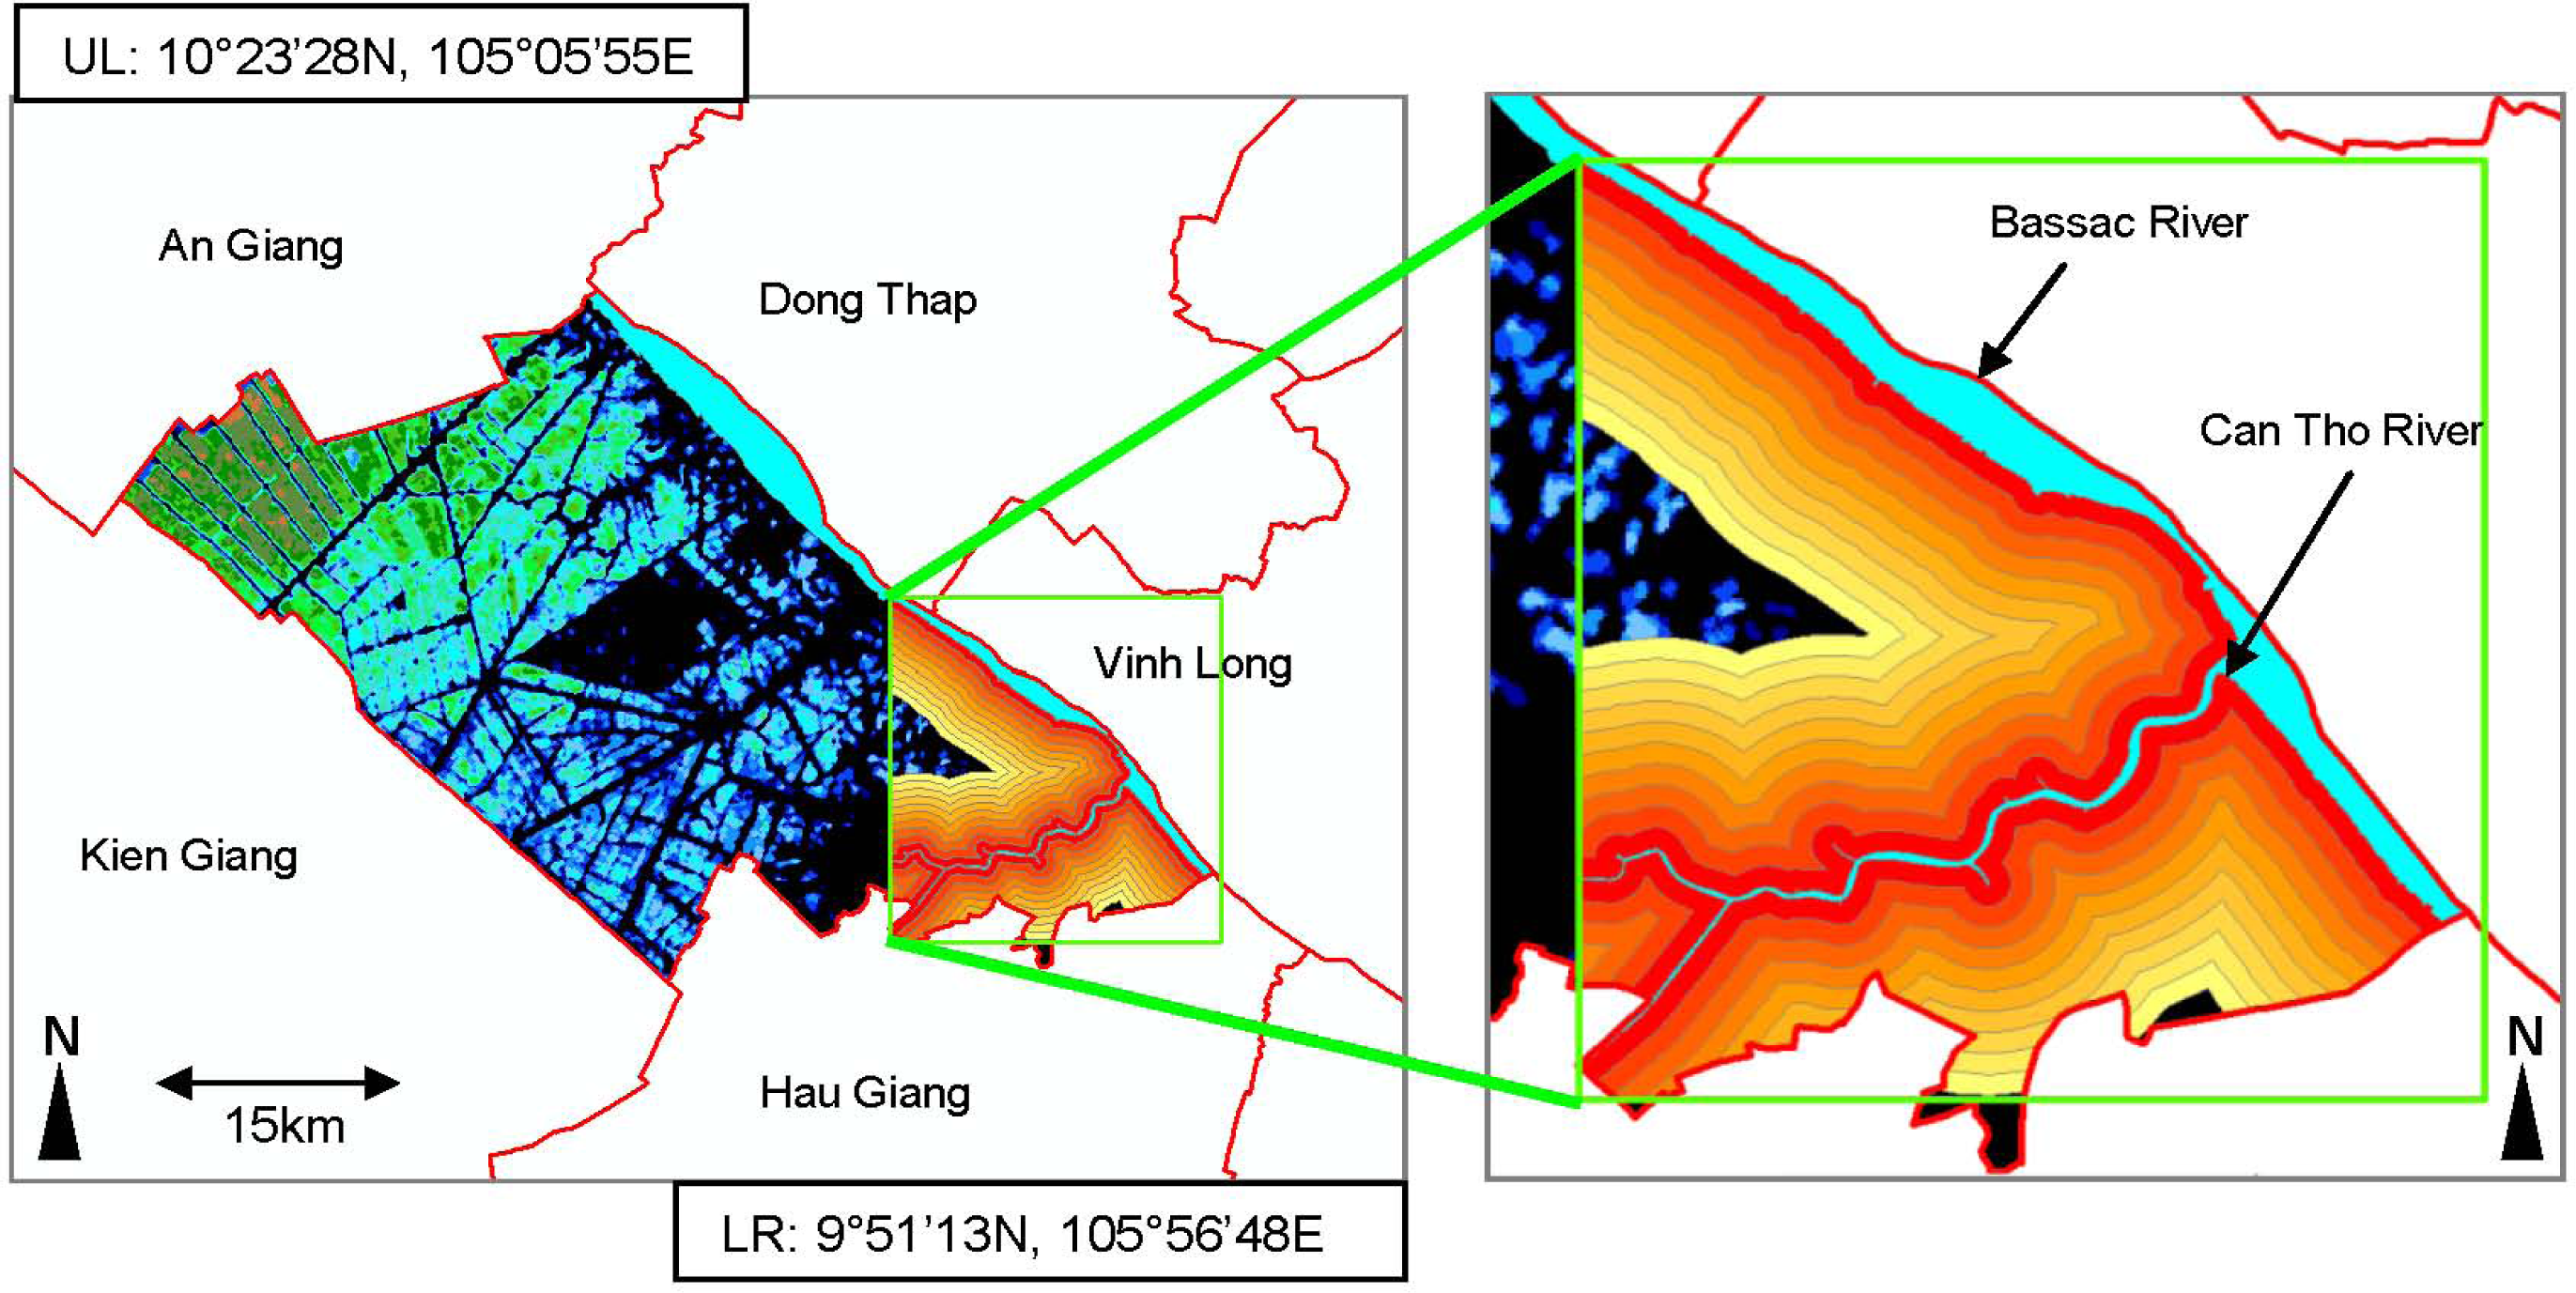
Figure 6 depicts Can Tho province (left) with its typical Envisat ASAR-WSM flood frequency patterns (decreasing flood frequency from the Northwest to the Southeast). The enlarged area framed in green is the Can Tho City region located along the Bassac and the Can Tho River. We generated 500 meter wide buffer zones perpendicular to the river. Within these zones, we had all building as digitized vector data available. We could now analyze building density within the individual buffer zones—so in relation to river proximity, as well as flood occurrence in these zones.
Figure 7 displays the result of the analyses of building density with respect to river proximity. Most buildings in Can Tho exist close to the Bassac and the Can Tho River. Here building density is highest. In buffer zone 1 (0–500 m distance from the rivers) 10.6% of the area are occupied by buildings, while in the buffer zones 8, 9, and 10 (3,500 m–4,000 m, 4,000 m–4,500 m, 4,500 m–5,000 m) less than 1.5% of the respective zones are occupied by buildings. Building density increases near-exponentially with proximity to the river. This goes in line with the general observation in the Delta: people settle near the Mekong main stem, or near other rivers, and canals, as proximity to water ways means access to transportation and trade, access to domestic water, access to food protein (fish), and water access is also an element of cultural identification.
It must be noted that a building density of 10.6% (e.g., in zone 1) is not equal with surface sealing, or imperviousness. Building density is purely the area covered by buildings, while surface sealing or imperviousness usually considers all sealed (cemented or the like) surfaces, including—next to building—streets, open squares, large industrial yards etc. as well [
33].
5.3. Scale Issues in Urban Flood Mapping with Multi Sensor SAR Data: Capabilities of Envisat-ASAR-WSM versus TerraSAR-X Scansar and Stripmap Data
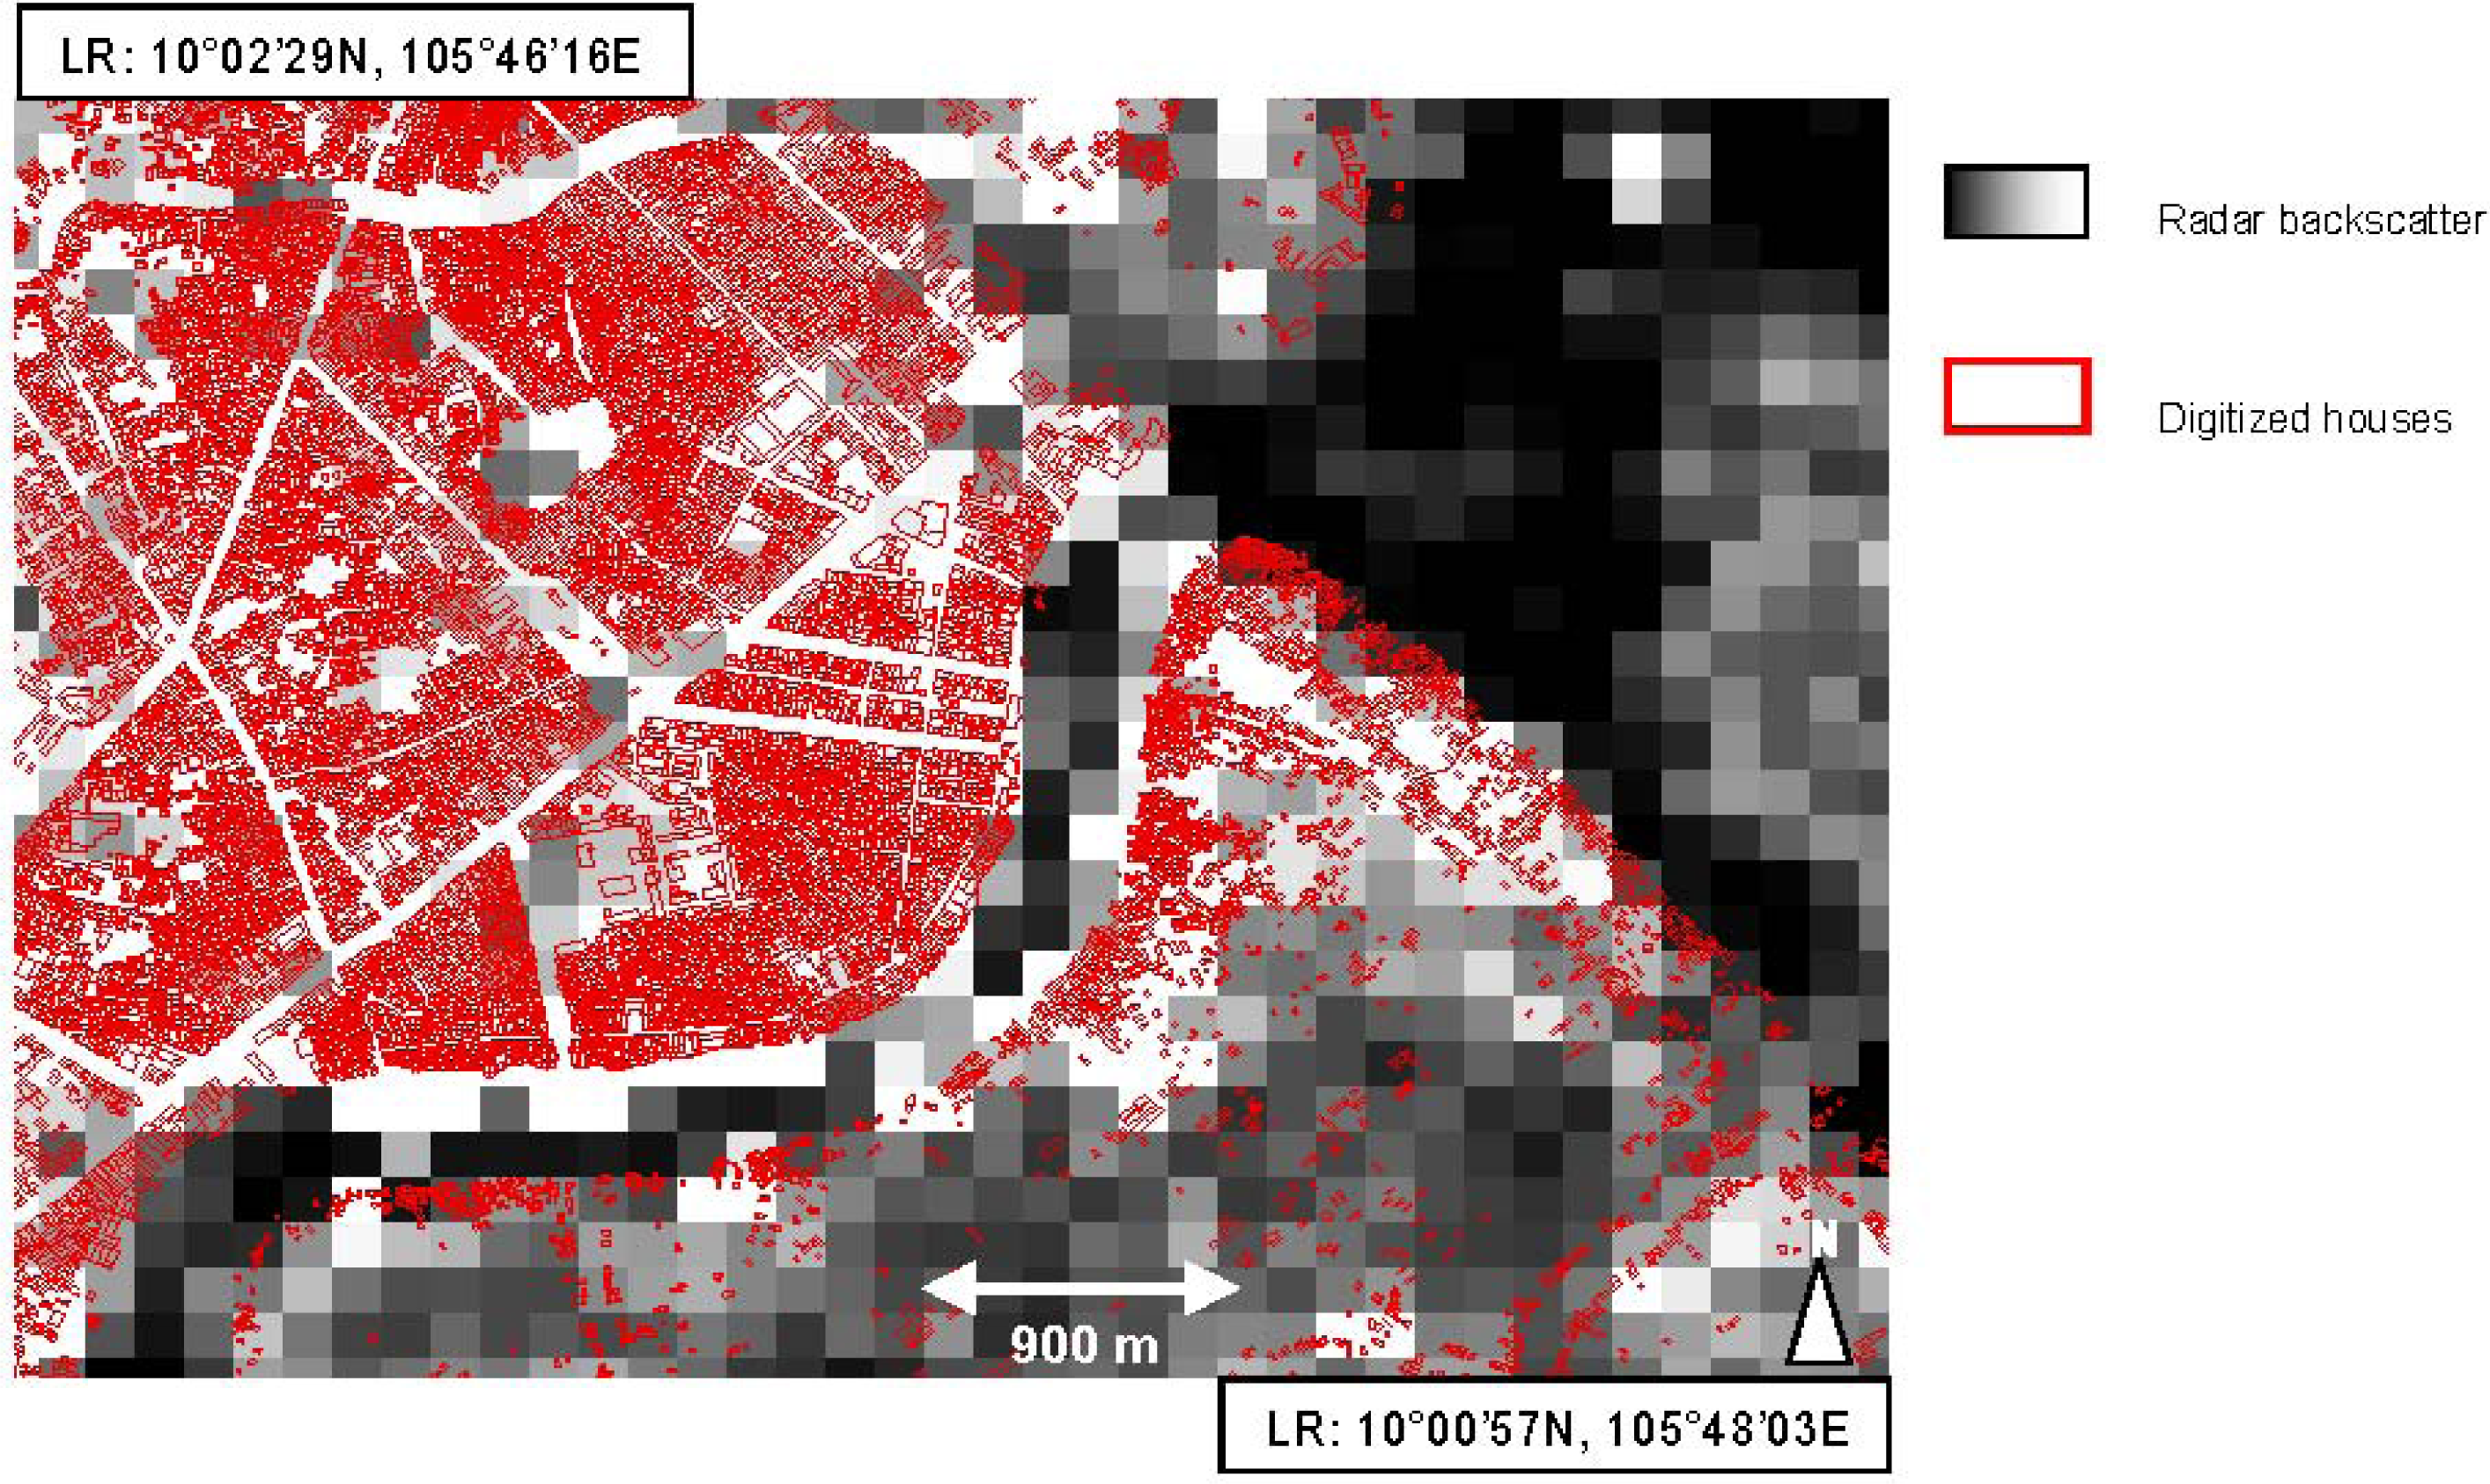
Investigating SAR data with three varying degrees of spatial resolution, it is obvious that with a higher degree of spatial resolution a higher degree of spatial detail can be resolved This also holds true for water extraction from 150 m, 8.25 m and 2.5 m SAR data respectively. However, just like for optical data, the problem of mixed pixels also occurs. Pixels that contain a mix of non-water and water surfaces might appear too bright to be identified as water by an automatic water detection algorithm. Water detection (no matter at which resolution) will be hampered, if a ground element does not yield a very low return pulse This can be the case for mixed pixels, layover effects and adjacency effects (leading to an “over illumination” of the pixel, as well as during strong wind periods (elevated surface roughness)) (see
Figure 8).
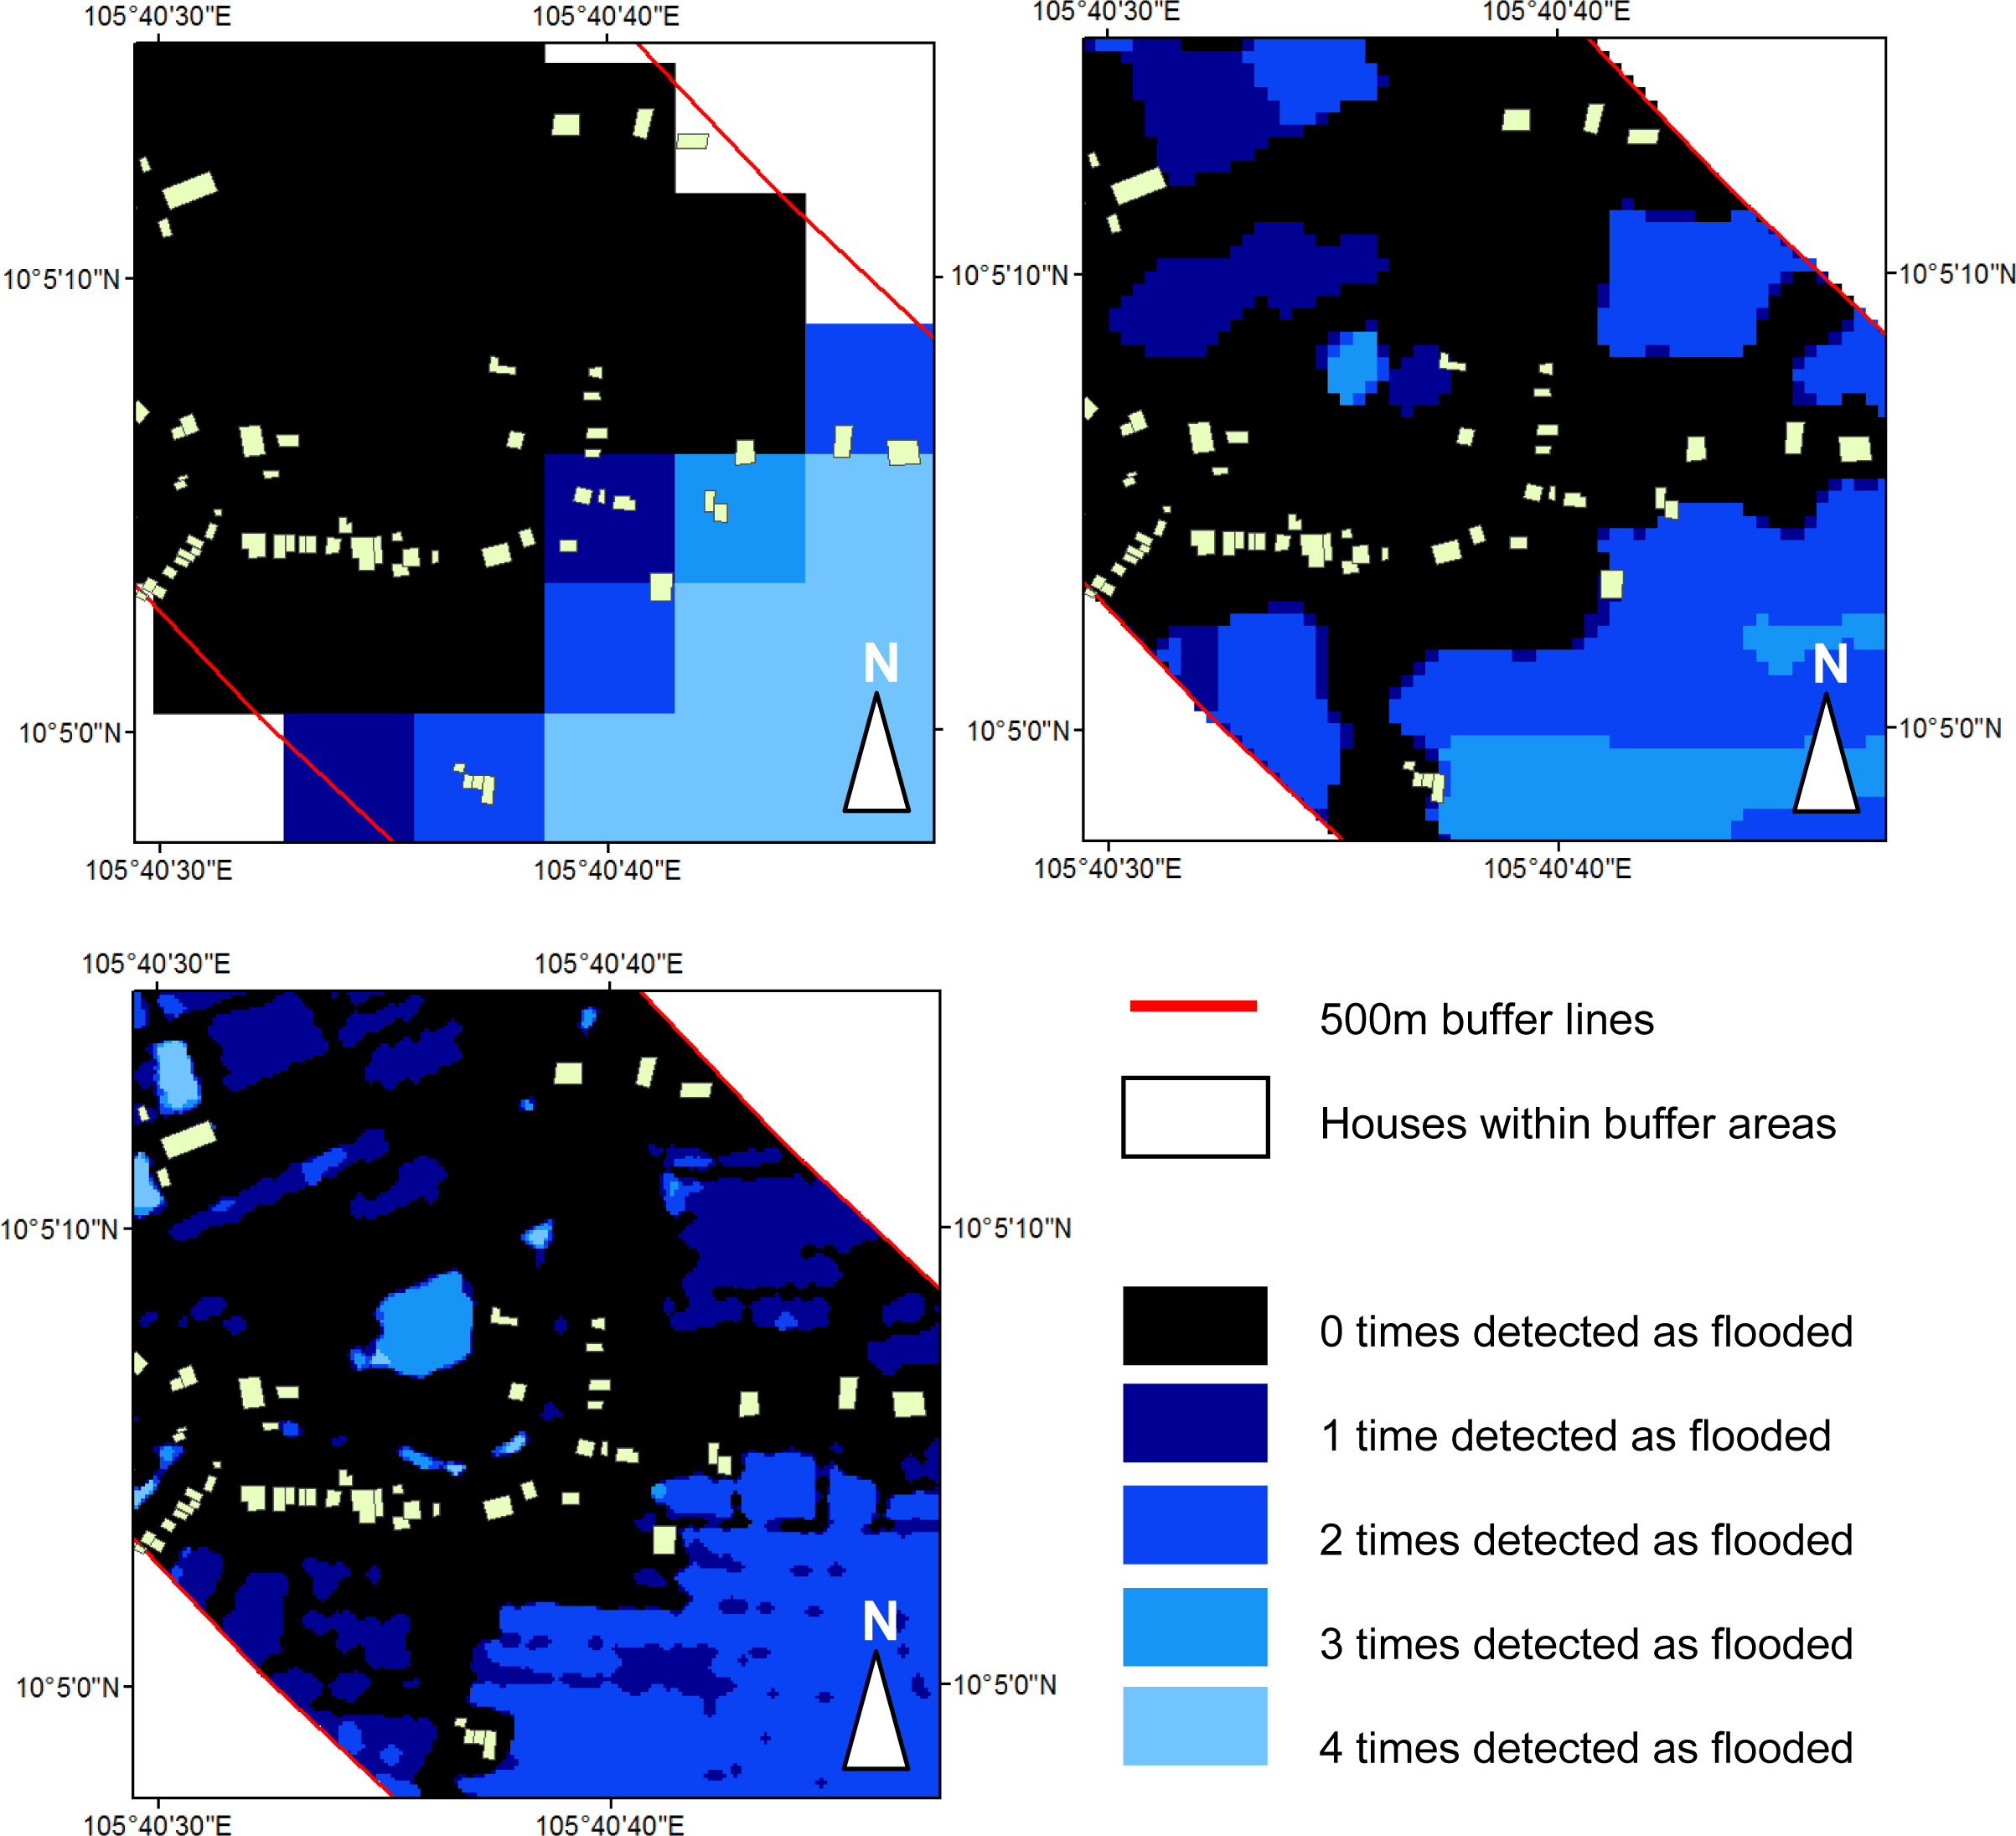
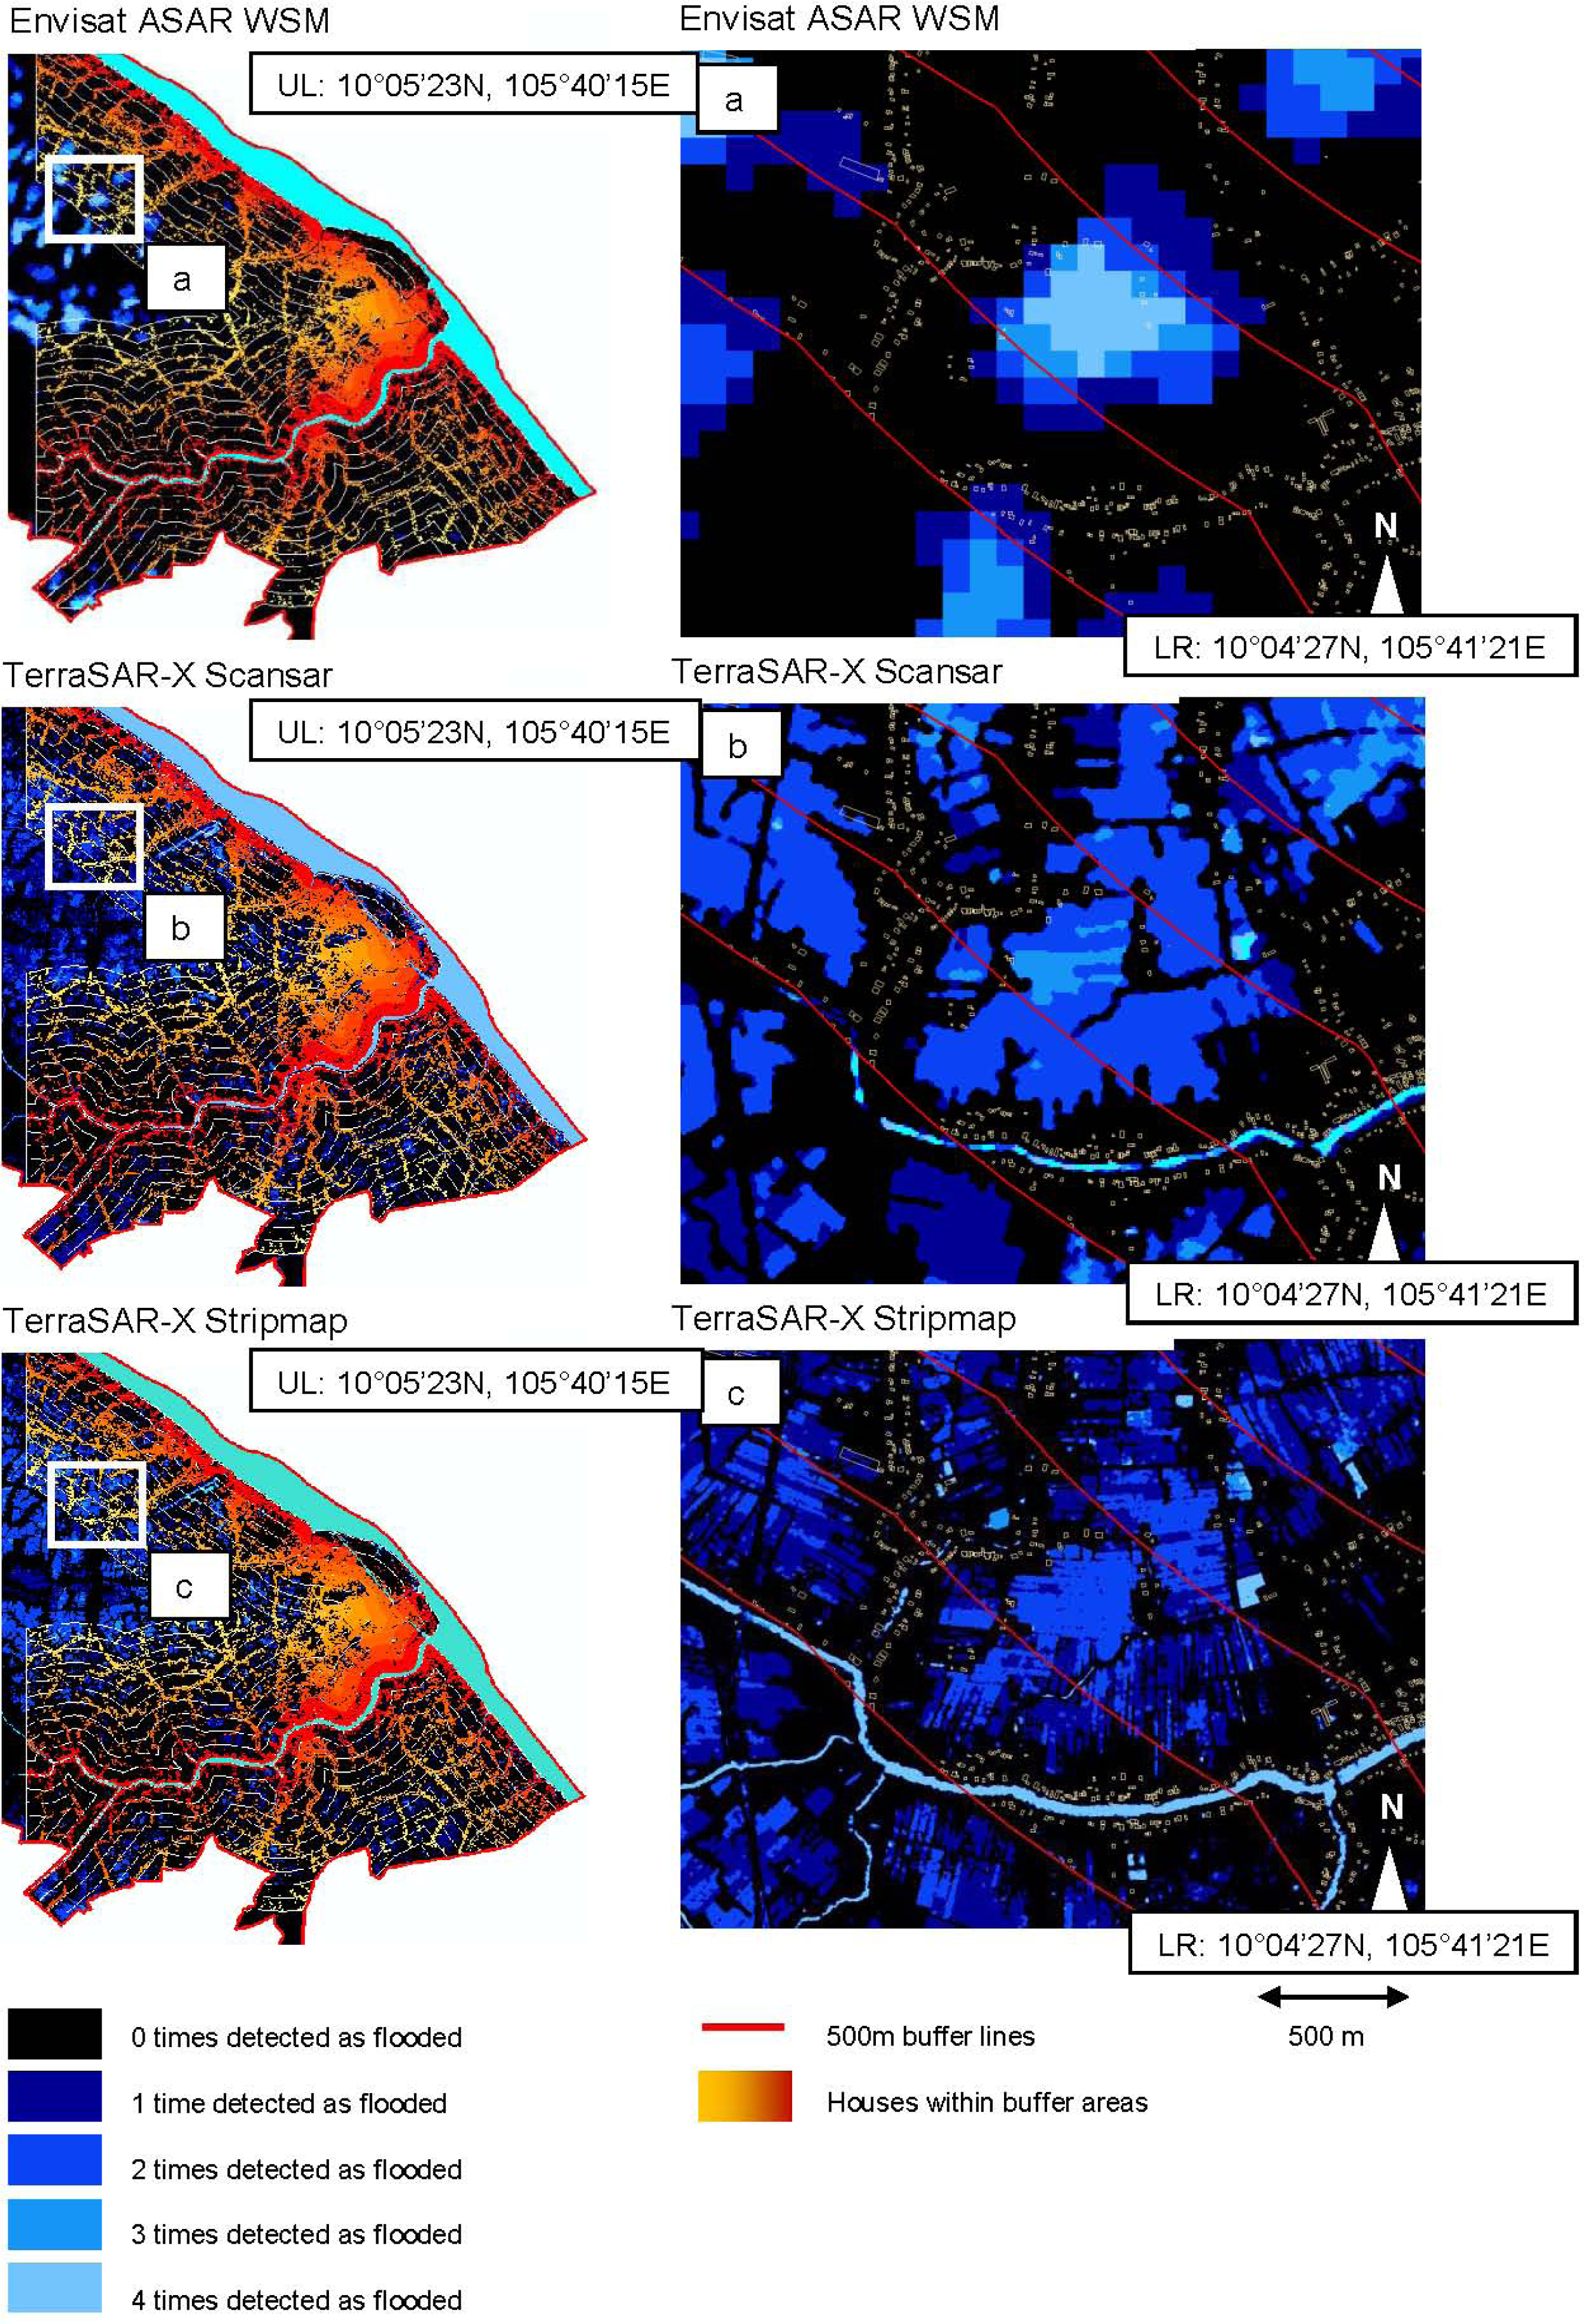
Figure 9 presents the differences in flood mapping extent and accuracy based on different sensors and varying spatial resolution. The three images on the left side of
Figure 9 give an overview of the city area of Can Tho. The available dataset of digitized houses is differently colored depending on the distance to the two main rivers (Bassac and Can Tho River) and is overlain on three flood sum images derived from Envisat ASAR-WSM, TerraSAR-X Scansar, and TerraSAR-X Stripmap data, respectively. The three lower images of
Figure 9a–c depict the situation in a selected rural outskirt region (white box).
The flooded area detected in Envisat ASAR WSM images is much smaller (
Figure 9a) than the flooded area derived based on TerraSAR-X data (
Figure 9b,c). In
Figure 9a, we see some flooded clusters, but the main canal in this region, was not extracted as a permanent water body. The canal simply is too narrow and thus the overall 150 m Envisat ASAR pixel is not influenced enough to lower the overall backscatter in a way that the pixels would be declared as flooded. In TerraSAR-X Scansar data at 8.25 m resolution the main canal of the subset presented can be extracted in some areas, while smaller side canals are not extracted. In
Figure 9c, the result of flood area extraction based on TerraSAR-X Stripmap data at 2.5 m resolution shows that most larger canals can be extracted as water areas and the outlines of flooded patches are very distinct. However, even in highest resolution TerraSAR-X Stripmap data not all water surfaces (e.g., very small canals) can be extracted. Here the bright over-radiating return pulses from houses and other objects ‘lighten’ pixels in a way that backscatter is above the threshold for water detection.
This observed behavior does not only apply to the small subset presented in
Figures 9 and
10, but to the whole area analyzed.
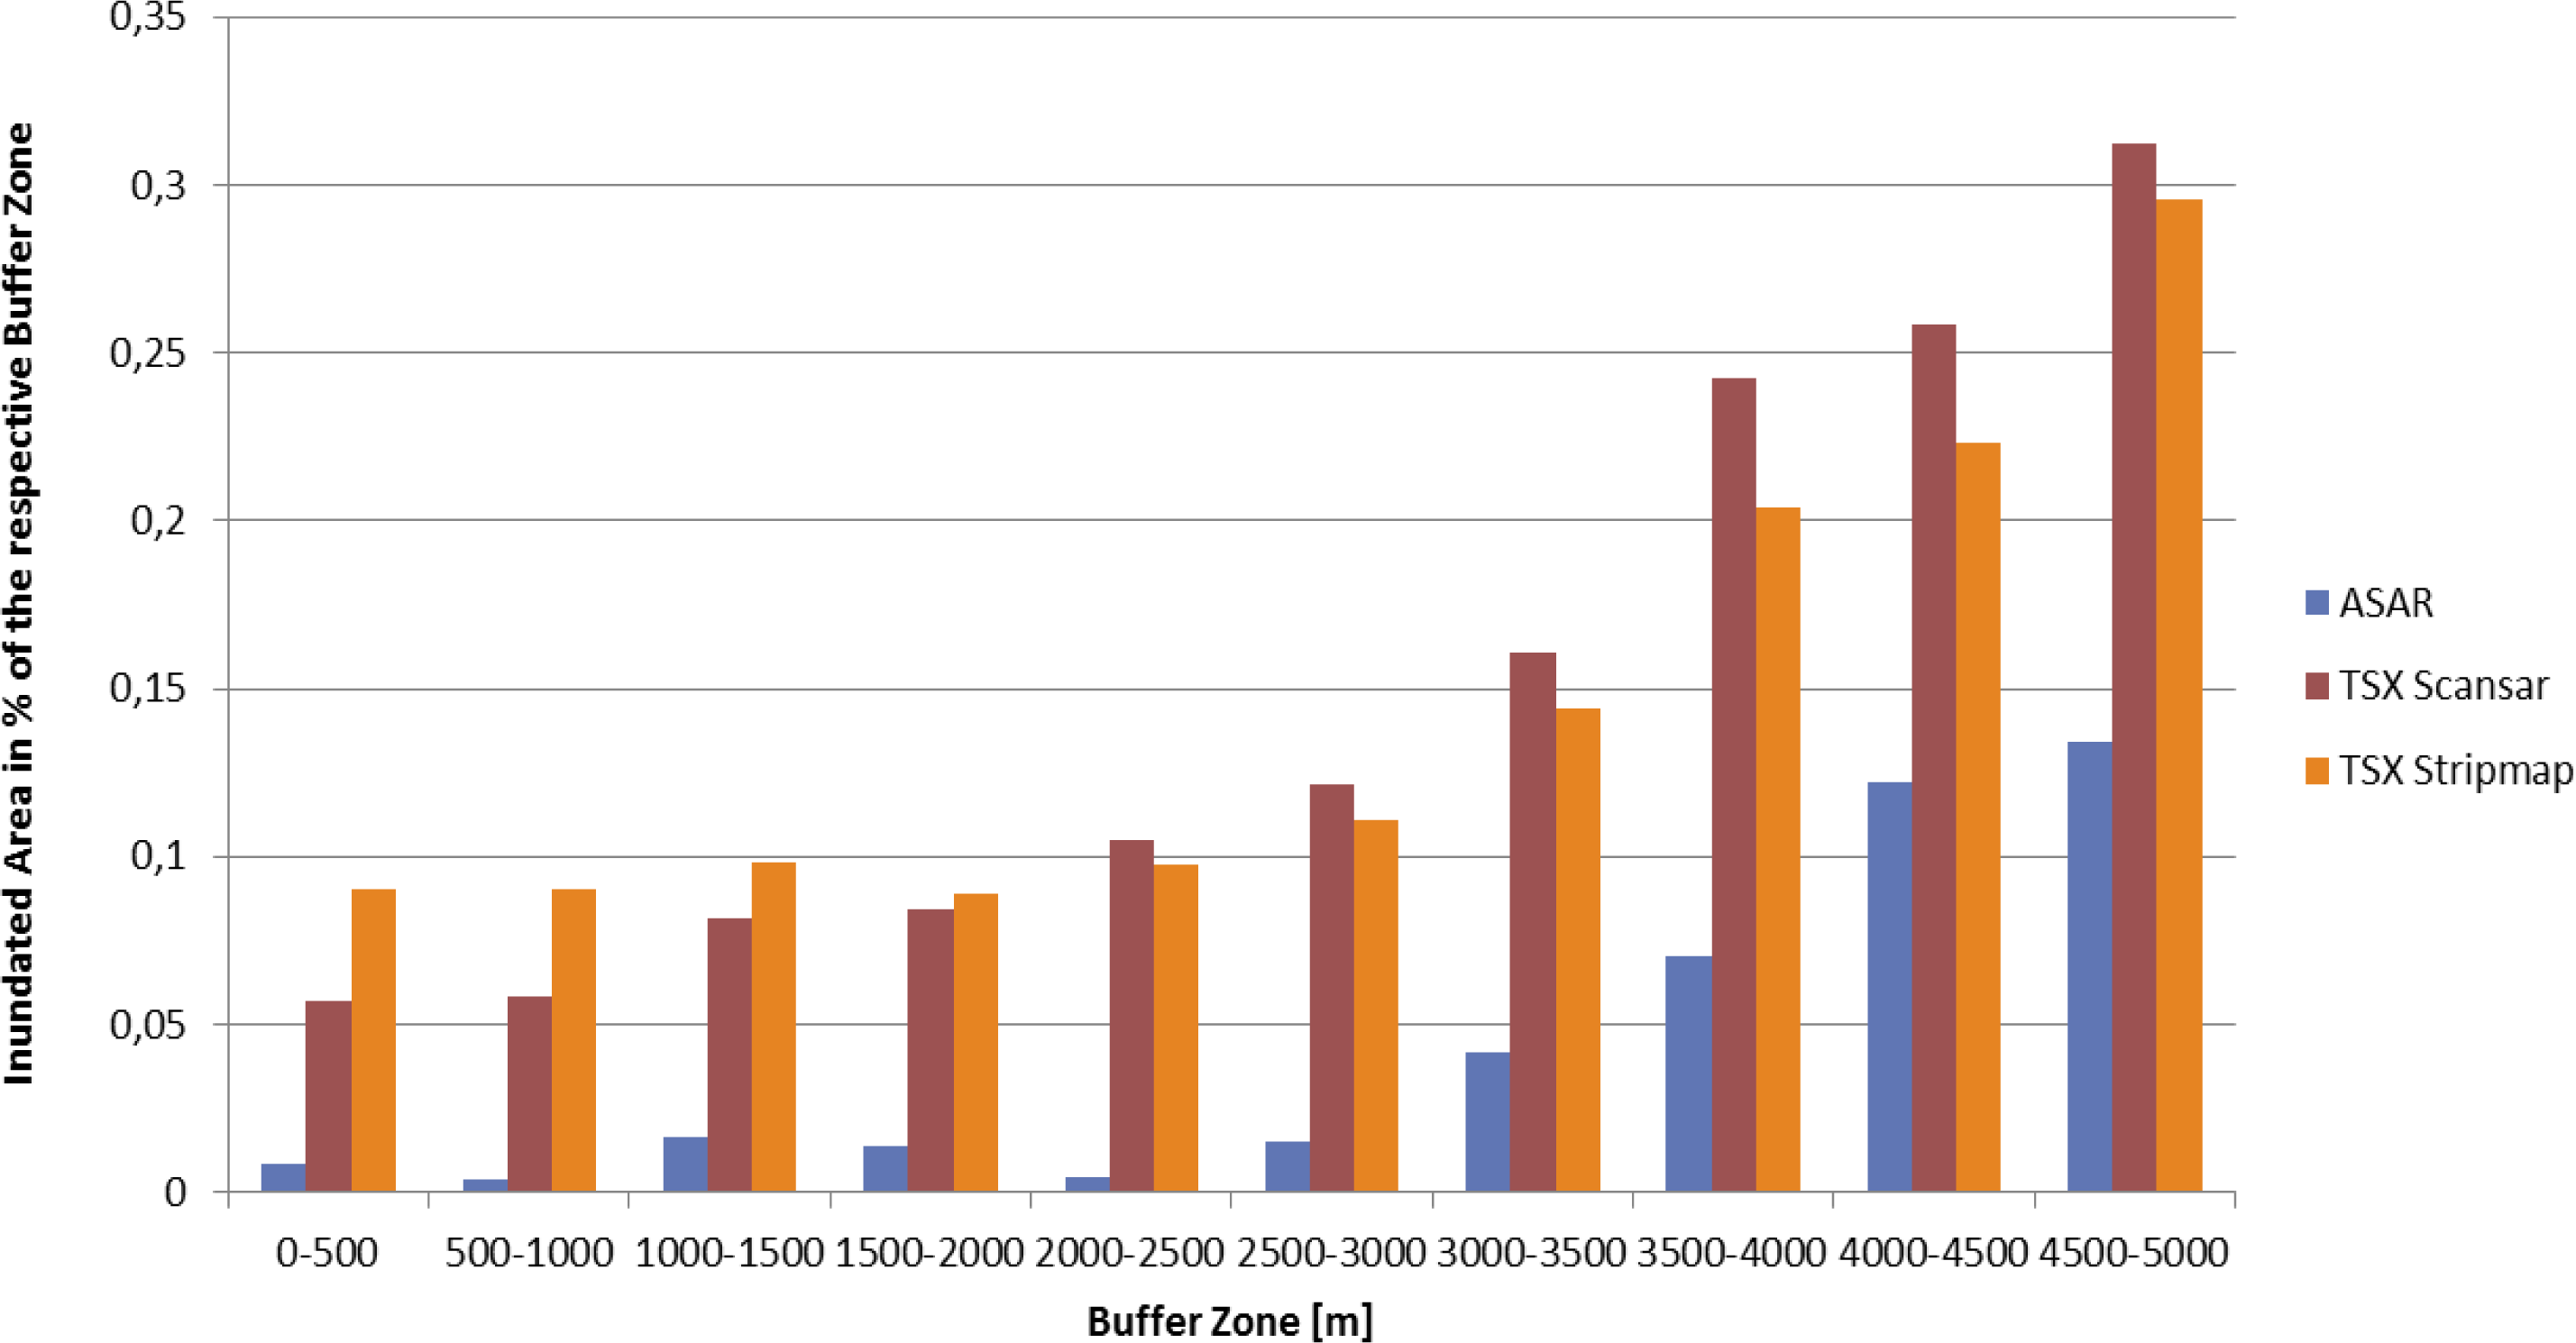
Figure 11 presents the flooded area in percent of the respective buffer area as derived from Envisat ASAR WSM, TerraSAR-X Scansar, and TerraSAR-X Stripmap data in 2008.
First of all, we can see that—for all three sensor observation scales—the area, which is extracted as flooded, increases with growing distance from the Bassac and Can Tho River. The further we move away from these two main waterways the larger the flood extent within the respective buffer zones.
This is an observation that might initially not be expected. For example, in many places in Europe, flooding is mainly river induced (a river that floods over its banks) and the flooded areas then occur close to the main river along its banks. However, in the Mekong Delta, as elucidated in Kuenzer
et al. [
8], flood waters can be of four origins (overland and river flow, tidal, heavy local precipitation, anthropogenic forcing) and thus flooding is not necessarily associated to a local river stepping over its banks.
Furthermore, we can see that the flooded area extracted based on TerraSAR-X data is much larger than the flooded area extracted with ASAR data. Based on ASAR data (blue) below 15% of the 4,500–5,000 m buffer zone is flooded. Based on TerraSAR-X data (red, orange) it is well above 30%. The flooded area extracted based on TerraSAR-X data is always more than double, in many cases even five times as large as the ASAR derived flood area.
While highest resolution TerraSAR-X Stripmap data yields the largest flooded areas in the densely settled buffer zones (see
Figure 11 left), Terra-SAR-X Scansar based extraction yields a slightly larger flood extent in the distant buffer zones. In heavily fragmented and densely settled TSX Stripmap data at highest resolution is of advantage for flood mapping, as it enables the extraction of even very small flooded patches, and canals, and thus yields a very accurate water extraction extent. Flood mapping based on TSX Scansar will still miss several local phenomena. Further away from the river, in rural areas characterized by agricultural fields flooded patches are larger. Here smaller non-flooded areas within flooded areas (trees, patches of land,
etc.) are—accurately—not extracted as flooded within Stripmap data, whilst they are ‘swallowed’ in a mixed pixel effect in Scansar data. However, Stripmap based flood extent derivation is the most accurate; no
t matter in which terrain. It is especially in heavily fragmented areas of large backscatter contrasts (e.g., urban areas) that the sensor with highest available spatial resolution should be employed.
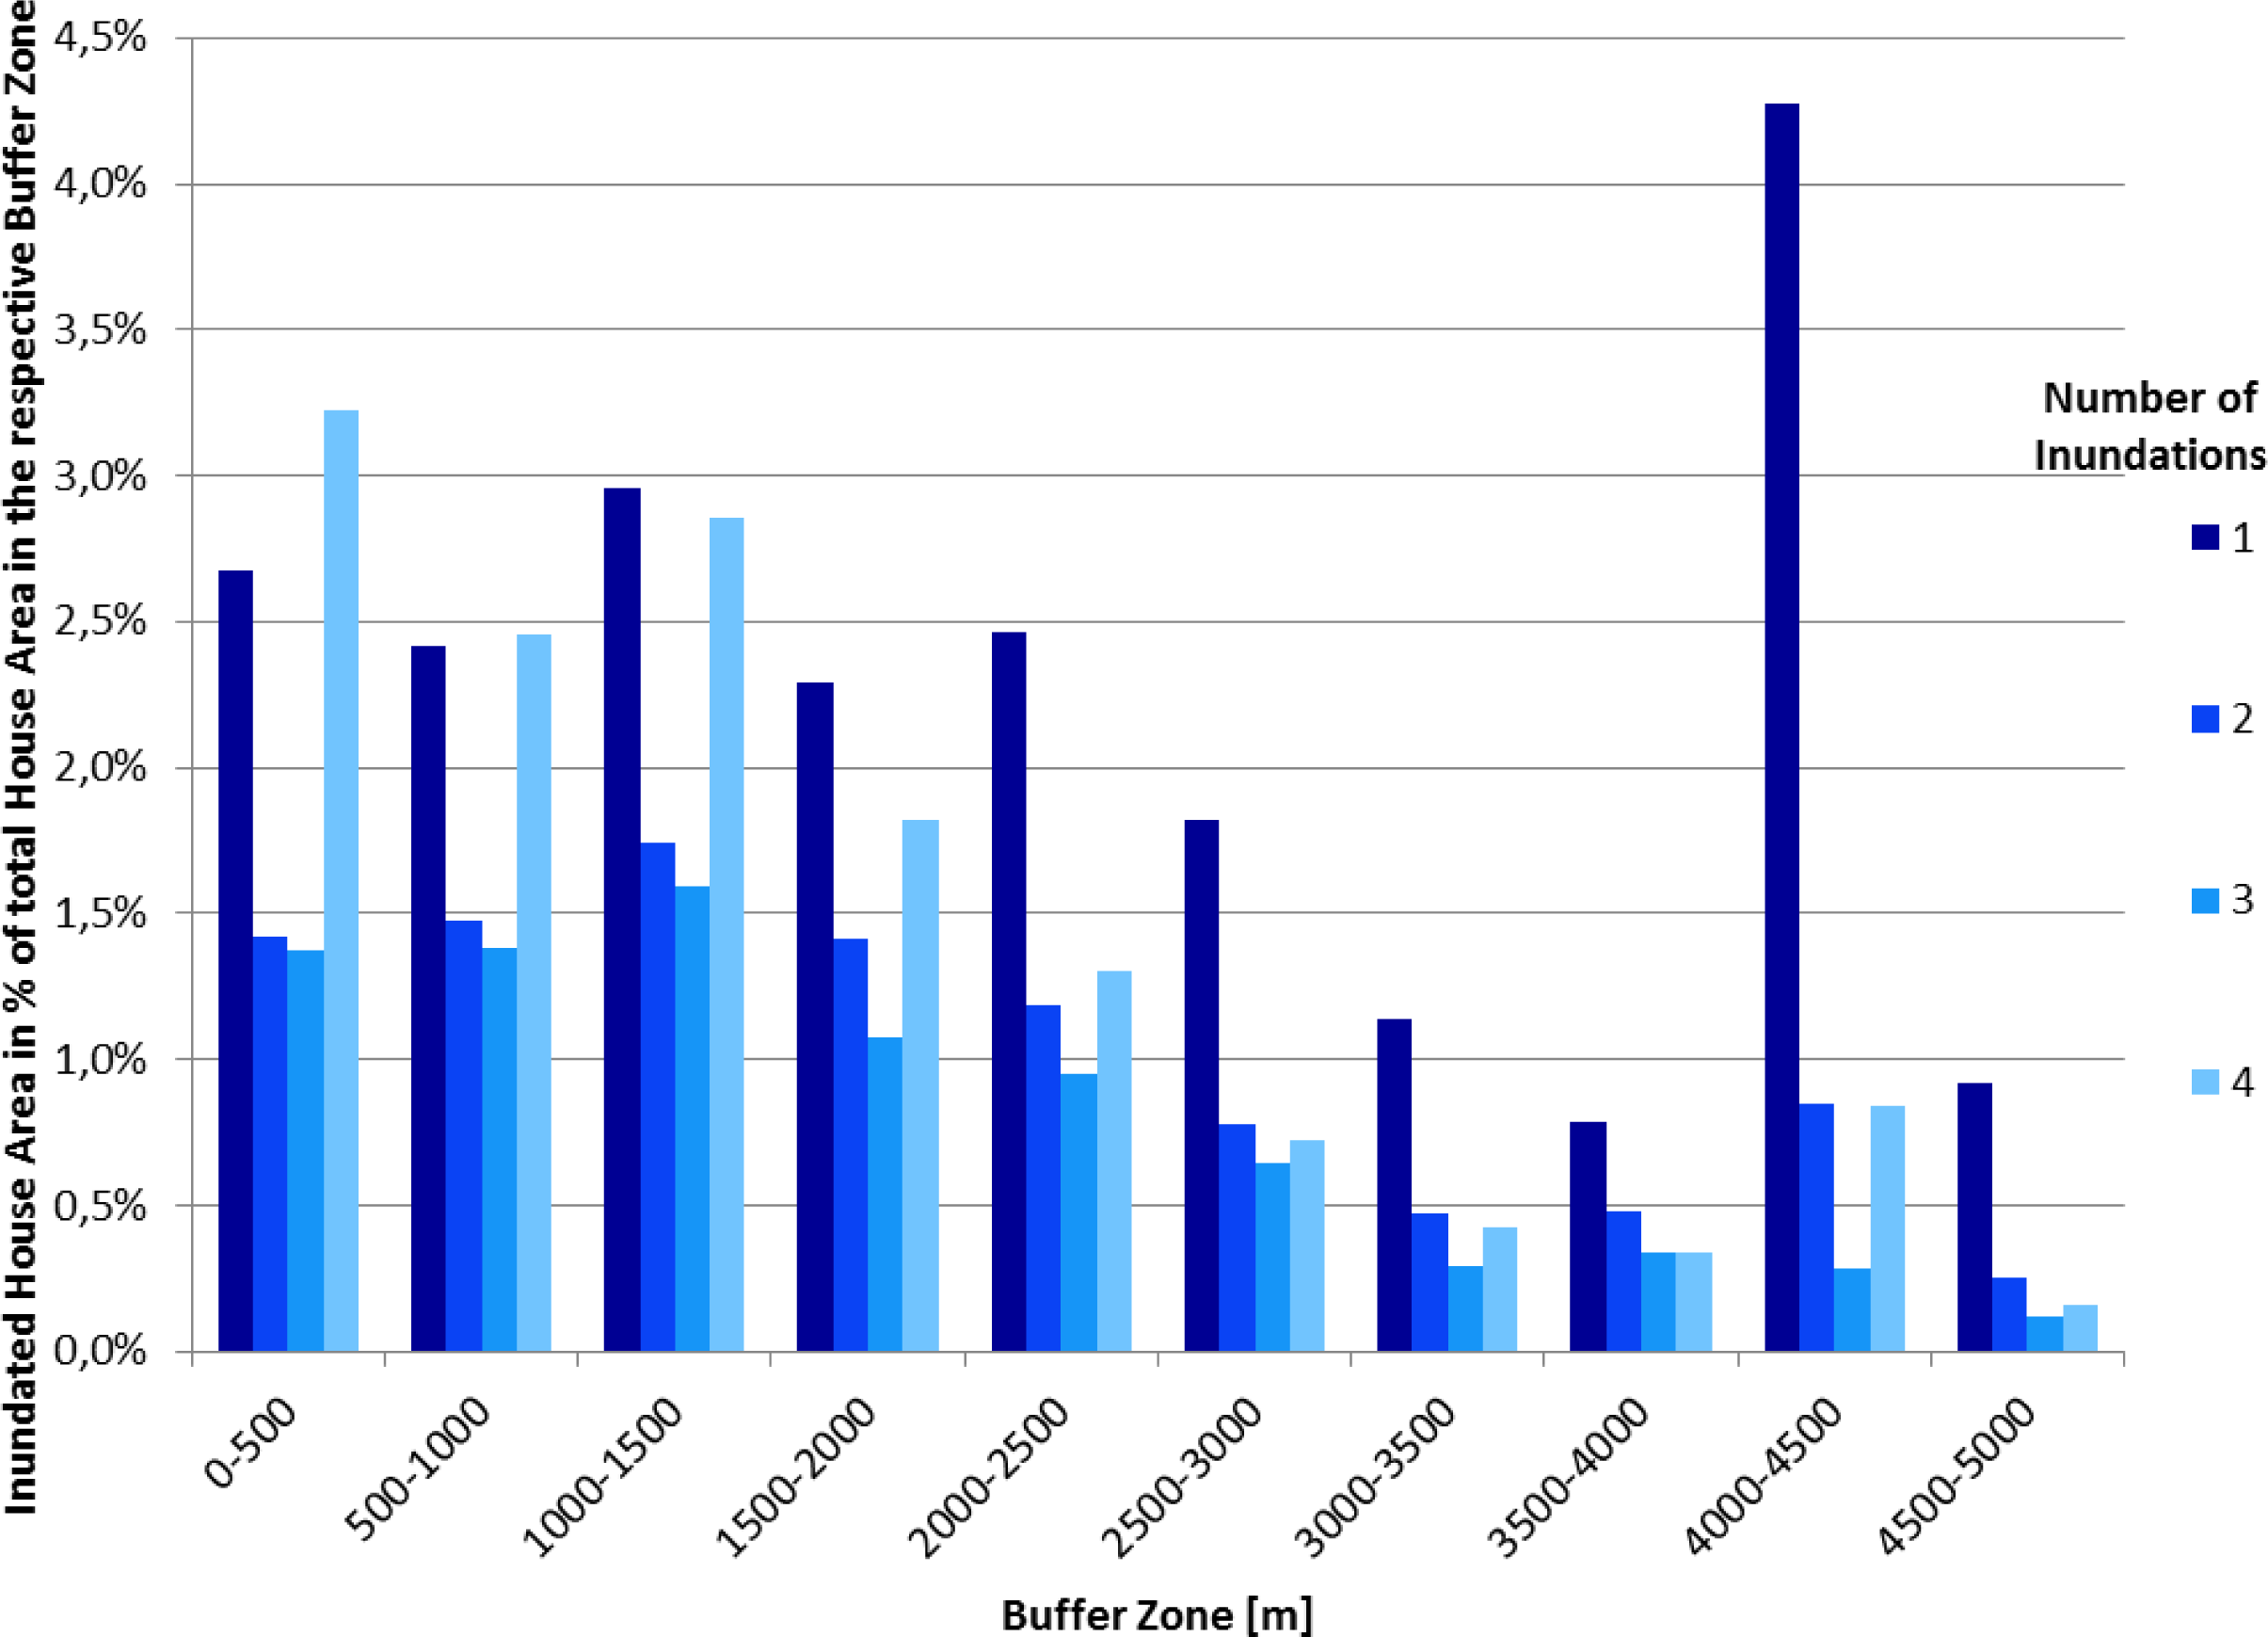
Figure 12 illuminates how many percent of houses in Can Tho city are really affected by floods. Here we used the highest resolution data for the assessment. During the four overpasses of TSX acquiring data in stripmap mode in the zone up to 500 m distance from the rivers 2.7% of houses were inundated one time, roughly 1.5% of houses were inundated 2–3 times and 3.2% of houses were inundated during all 4 observations. This means that at least 6.4% of houses are affected by flooding within this buffer zone. As we only had four observations in a rainy season spanning 4–5 months, it is probably much more than that. However, with increasing distance from the river the percentage of households, which are affected by flooding decreases. Note that we have normalized the data and the y-axis shows inundated house area in percent of the total house area in the respective buffer zone. Please also note that the outlier in the 4,000–4,500 m buffer zone is an extremely large industrial area complex, which was at time of acquisition under construction.
6. Discussion
River deltas are especially complex areas for flood mapping, as their topography is usually completely flat. Therefore, no current digital elevation model data—as often integrated into, e.g., flood risk or inundation depth studies—can support flood mapping. Even though we had a wealth of data available for our study area, a lot of open questions remain. We discuss in the following some major critical points with respect to this study.
6.1. Algorithm Selection
A variety of publications on water detection algorithms exist, and different authors have compared different approaches. However, most water detection algorithms achieve high accuracies and do not lead to strongly varying results. “For our study it was important to use an algorithm which was available to us (so we used one developed in our institution; sources are presented in the introduction). The flood maps derived based on our flood detection tool have been validated extensively via comparison with high resolution TerraSAR-X data, with Landsat and Quickbird data, as well as with water-land boundary maps. As accuracy of water detection exceeds 95% [
7], we refrained from presenting this data again [
8].
6.2. Flood Map Reliability
As already stated beforehand, external factors such as mixed pixels and corner reflecting objects within water surfaces (layover, foreshortening, shadowing), tree coverage, strong waves, as well as unfavorable incidence angles (which we did not encounter in this study), can all impact or even hamper water surface extraction from SAR data. For this study, mixed pixels definitely pose the greatest challenge. Urban areas are characterized by a mix of built up area, vegetation, water surfaces (in our case canals, and flooded areas within the urban environment). Furthermore, layover effects and especially the corner reflecting characteristics of houses and metal roofs will lead to the “over-radiation” of the return pulse. The flooded area we extract is therefore rather under- than over-estimated.
6.3. Temporal Coverage of the SAR Data
It can be seen that the data acquired in the three different modes does not always perfectly match in time. Although we compare data that was acquired mostly within the same week, some of the differences in flood extent might not be exclusively related to the phenomenon of varying spatial resolution, but might also result from slightly varying flood conditions. However, usually flood waters in the Mekong Delta vary over a larger course of time without very rapid changes (see [
8]), and therefore we are confident that most analyses still relates to the major challenge of scale.
6.4. Spatial Representativeness
Our digitized buildings were only available for Can Tho city, which is the largest city in the Mekong Delta. The analyses presented in this paper could be well expanded or continued at greater depth, if the following data were available: digitized houses for the whole province of Can Tho from the same time as the SAR observations, a LIDAR derived DEM—such as undertaken by Webster [
37], Terra-SAR-X data in Spotlight mode at 1 m resolution covering the whole province, or additional airborne data
etc. However, such a combination of datasets is unfortunately not available for the region. Nevertheless, we are aware that such additional data could greatly support and improve the present regionalized findings.
6.5. Comparison with Other Studies and Optical Flood Mapping Results
While most authors prefer radar data for the mapping of floods and inundation [
8,
38], also optical [
39,
40] and even thermal [
41] approaches exist to map inundated areas (permanent water bodies and flooded regions). Huth
et al. [
39] used 6.25 m resolved Rapid Eye data and an object oriented approach to derive 14 land cover and land use classes for the Mekong Delta—amongst them rivers, canals, and aquaculture ponds. However, this mapping was performed on data acquired at the start of the dry season end of January, when cloud cover was low. A flood progression mapping for the Mekong Delta, such as presented in Kuenzer
et al. [
8], especially when aiming at high resolution monitoring in the surrounding of urban areas such as presented in this paper, is simply not possible based on optical data. The area is too often cloud covered, such as elaborated by Leinenkugel
et al. [
9]. The only extensive time series of annual flooding performed for the Mekong Delta based on optical data has been presented by Sakamot
et al. [
21]. He employed 250 m resolved MODIS data for flood mapping. As MODIS data is available up to four times per 24 h cycle chances for cloud free acquisitions, even in the rainy season, are high. However, inundation maps have a spatial resolution of 250 m. Therefore this multispectral sensor is not suitable for detailed flood mapping within or close to urban areas. The scale dependence of water body detection depending on input data has been elaborated on by Muster
et al. [
41], who compared Landsat 5 TM derived water body maps with MODIS water masks (MOD44W) at 250 m resolution. In their extraction approach the number of detected water bodies decreased with coarser spatial resolution, while, at the same time, smaller water bodies were merged, leading to a local over estimation of surface water.
In addition, the interesting temperature-based approach presented by Allen
et al. [
41], who estimated coastal lagoon flooding and flood progression on multi temporal thermal ASTER images is not really feasible in the Mekong Delta. Just like visible and near infrared optical data, also thermal infrared data acquisition is impacted by clouds and not feasible during the Mekong Delta’s rainy season.
7. Conclusion
Flood occurrence in Can Tho province shows a distinct spatial pattern, as observed in five years of Envisat ASAR WSM derived water masks. Over the course of the rainy season, flood water progress from the Northwest to the Southeast. The northwestern parts of Can Tho are more frequently flooded than the southern and south-eastern parts. Only 100 km2 are flooded one time during the five year time span, 65 km2 are inundated two times, and 50 km2 are flooded three times. Areas, which are flooded so rarely, are most likely depicting the extent of extreme flood events. Over 40 km2 each are flooded four to ten times within the five year time span. Areas that are hardly ever inundated (at the ASAR WSM observation scale of 150 m resolution) are the settled center of Can Tho city, the distinct rice research farm of the Cuu Long Delta Rice Research Institute, as well as the fruit orchards in the Southeast.
Most buildings in Can Tho exist close to the Bassac and the Can Tho River. Here building density is highest. Based on buffer analyses assessing building density and flood extent (normalized) in buffer zones of growing distances from the main rivers, we elucidated that building density increases near-exponentially with proximity to the river. Against expectations for all three observation scales (Envisat ASAR WSM, TSX Scansar, TSX Stripmap), the area, which is extracted as water-covered/flooded, increases with growing distance from the Bassac River and the Can Tho River. The reason for this is that further away from the city agricultural land dominates the landscape, which is also flooded during the rainy season. Furthermore, the more open the land the less shading and corner reflecting objects disturb the signal, and the higher the precision of inundation detection.
Differences in spatial resolution strongly affect SAR based flood mapping results. Details, which cannot be resolved in ASAR based water masks, can be resolved in TSX derived flood products. In 2.5 m TSX Stripmap data also narrow canals and smaller flooded patches can be extracted. The flooded area extracted based on TerraSAR-X data is much larger than the flooded area extracted with ASAR data. Based on buffer zone analyses the flooded area extracted based on TerraSAR-X data is always more than double, in many cases even more than five times as large as the ASAR derived area. For all urban flood situations it is thus very important to choose the data type for flood analyses very carefully. While Envisat ASAR WSM is a good sensor for the assessment of general flood patterns in larger areas (such as all of Can Tho Province), it is definitely not the sensor of choice when aiming at detailed urban flood mapping. Here, data of high resolution sensors such as TerraSAR-X (but also COSMO-Skymed, Sarlupe, or highest resolution Radarsat) should be the preferred choice.
Envisat data is not available anymore since April 2012, and high resolution SAR data is either difficult or very costly to acquire. Free access to high resolution SAR sensors with long term acquisition plans is urgently needed. Thus, the launch of ESA’s sentinel fleet and free-access to other SAR archives is eagerly awaited. Future research should be undertaken on the impact of building density, cluster distribution, and building height with respect to its impact on the derivation of inundated areas from highest resolution SAR data.


