A Semi-Automated Object-Based Approach for Landslide Detection Validated by Persistent Scatterer Interferometry Measures and Landslide Inventories

 ,
, 
 ,
,  and
and
Abstract
:
1. Introduction
1.1. Background
1.2. OBIA for Landslide Mapping
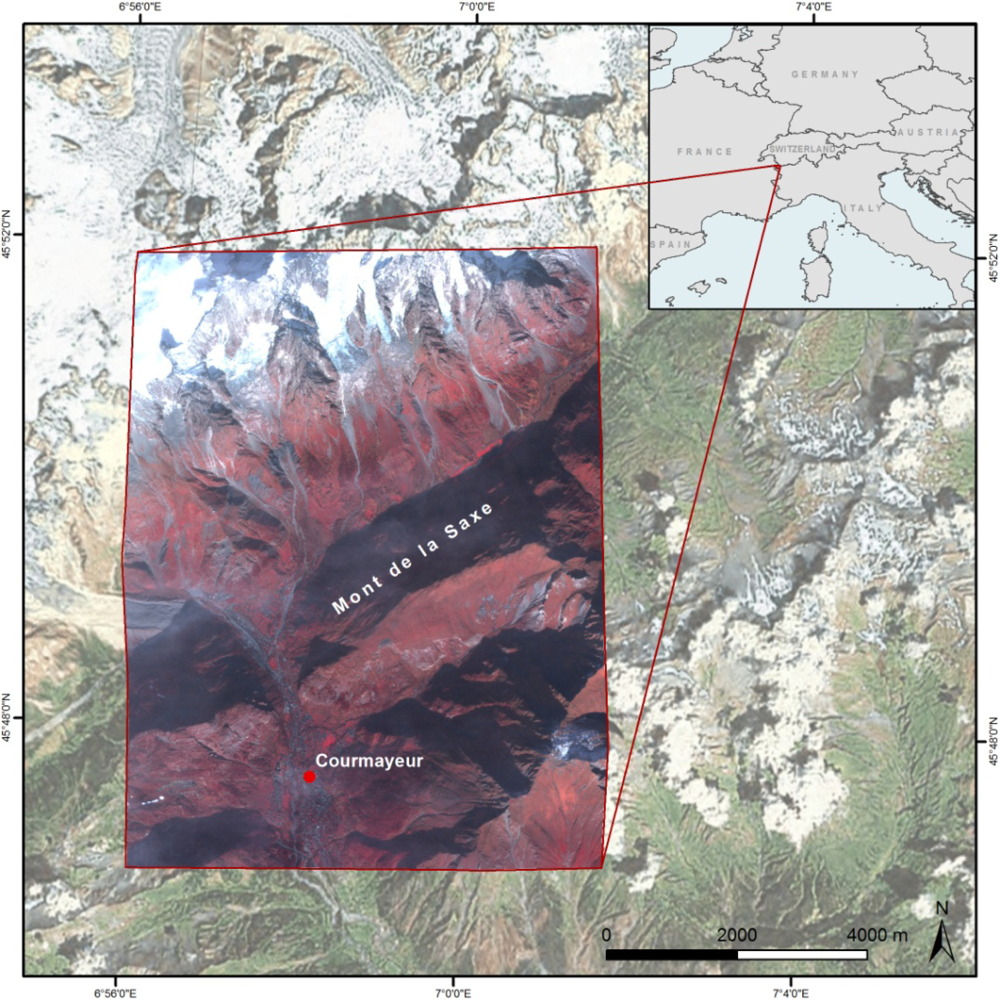
2. Study Area and Data
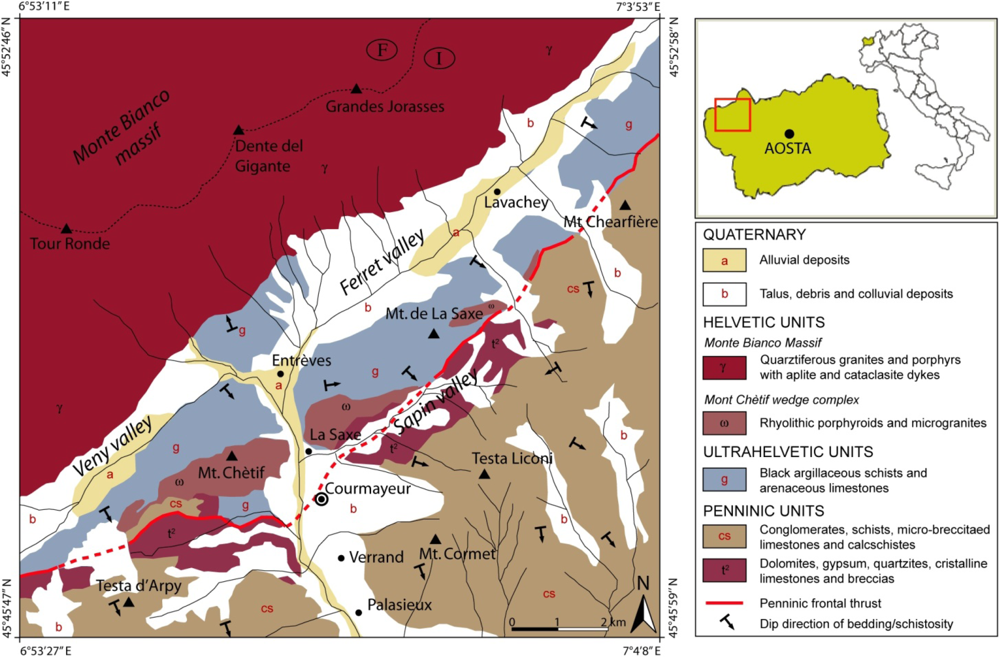
2.1. Geological Characterization of the Study Area
- Monte Bianco massif and Mont Chètif wedge complex, belonging to the Helvetic Domain, consist of paragneisses, migmatites, orthogneisses, granites and porphyries; in the SE part of the massif (Val Veny-Val Ferret) the contact with surrounding units is tectonic.
- Ultrahelvetic units, a meta-sedimentary sequence which predominantly consist of closely foliated carbonate-bearing argillaceous schists and arenaceous limestones with quartz arenites levels. The age of the sequence can be referred to as the Middle Jurassic.
2.2. Data
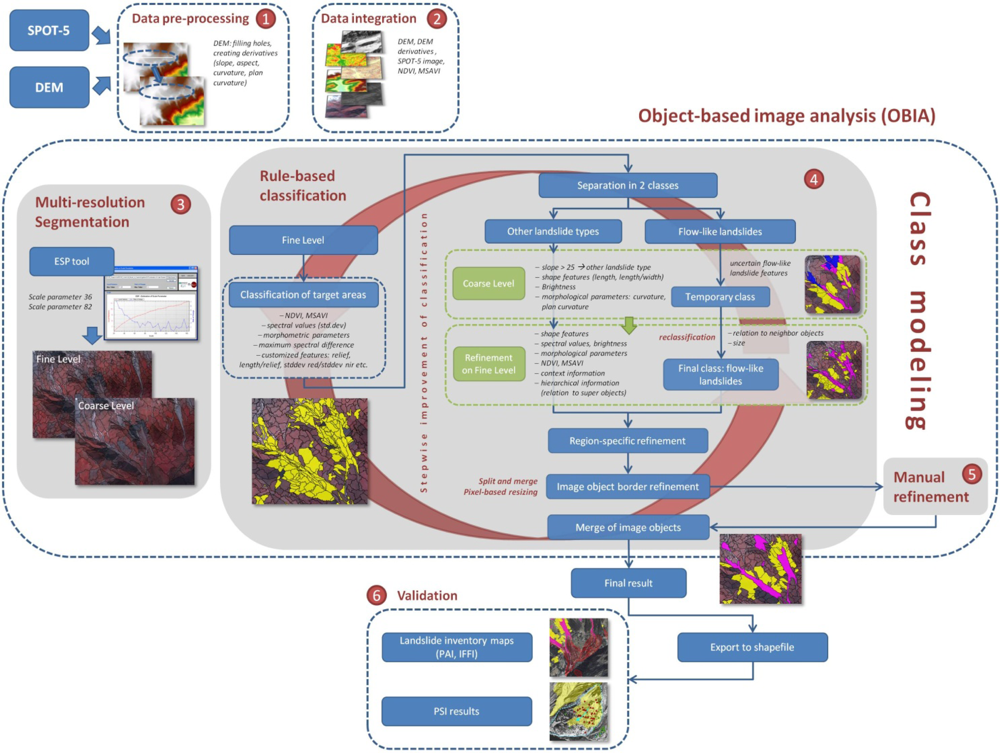
3. Methodology
3.1. Object-Based Class Modeling
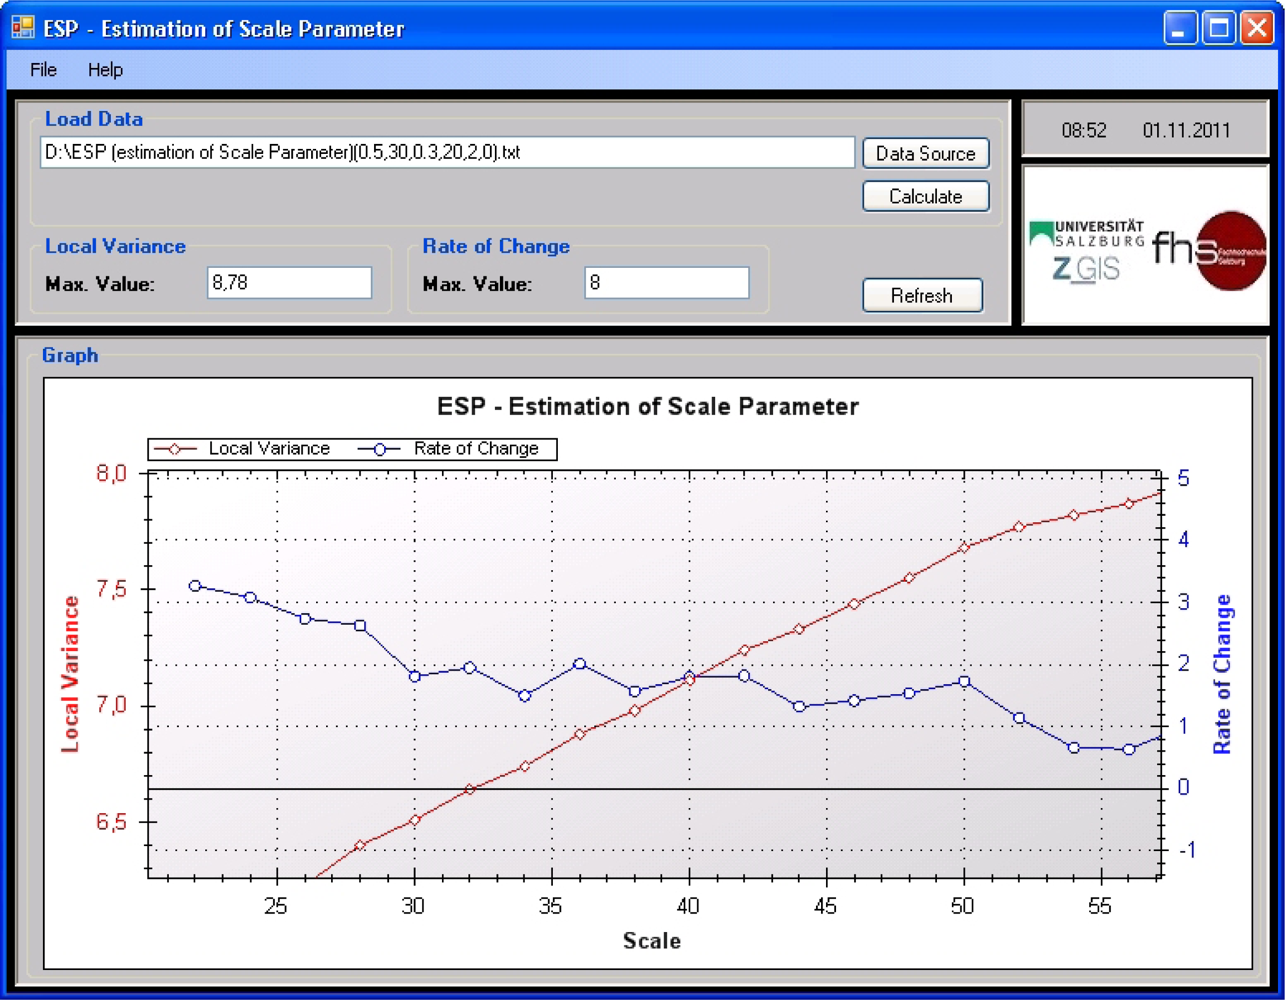
3.2. Estimation of Appropriate Scale Parameter
3.3. Rule-Based Classification
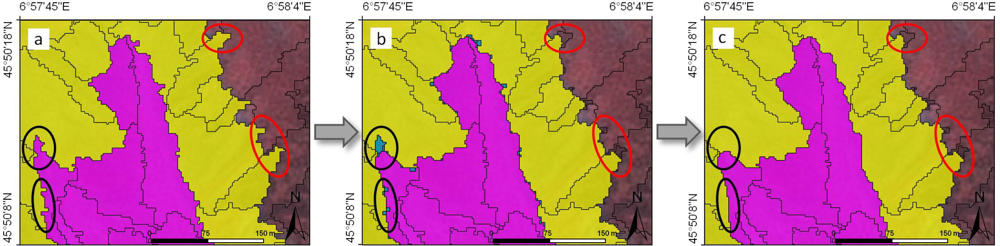
3.4. Region-Specific Refinement
3.5. Image-Object Border Refinement for Deriving Meaningful Image-Objects
4. Results and Discussion
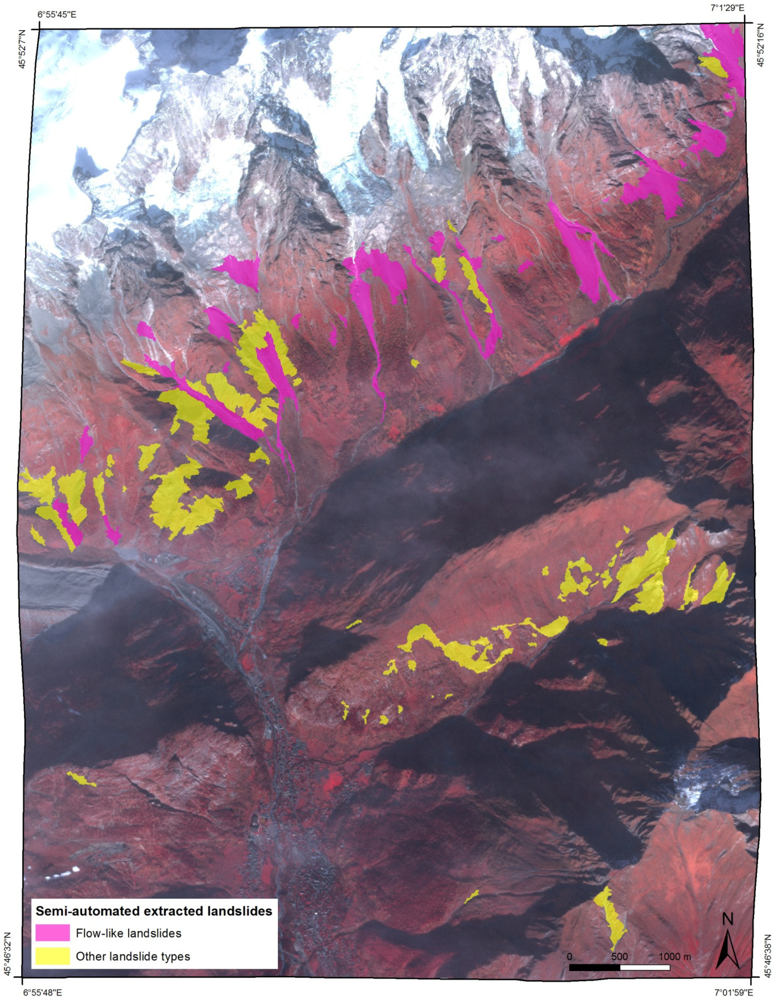
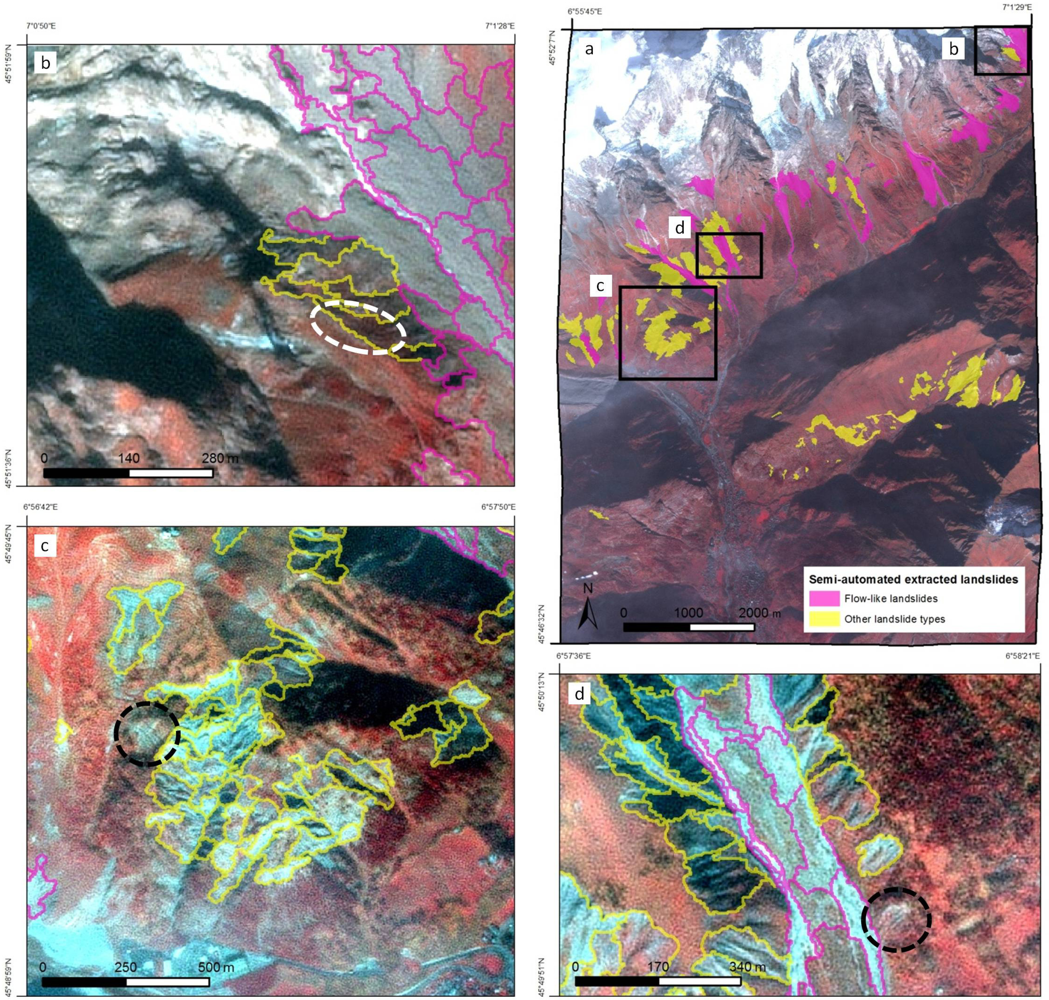
4.1. Results of Object-Based Landslide Detection
4.2. Validation
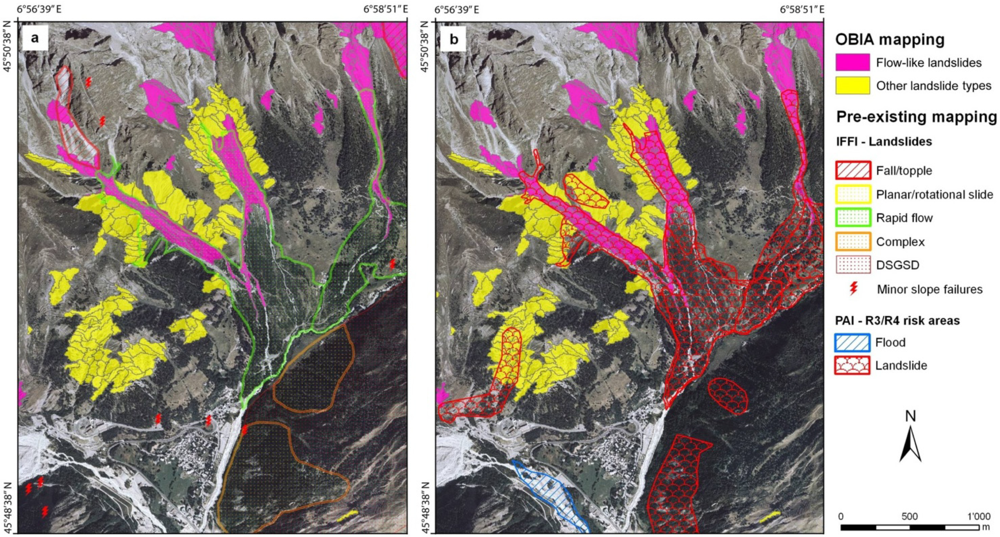
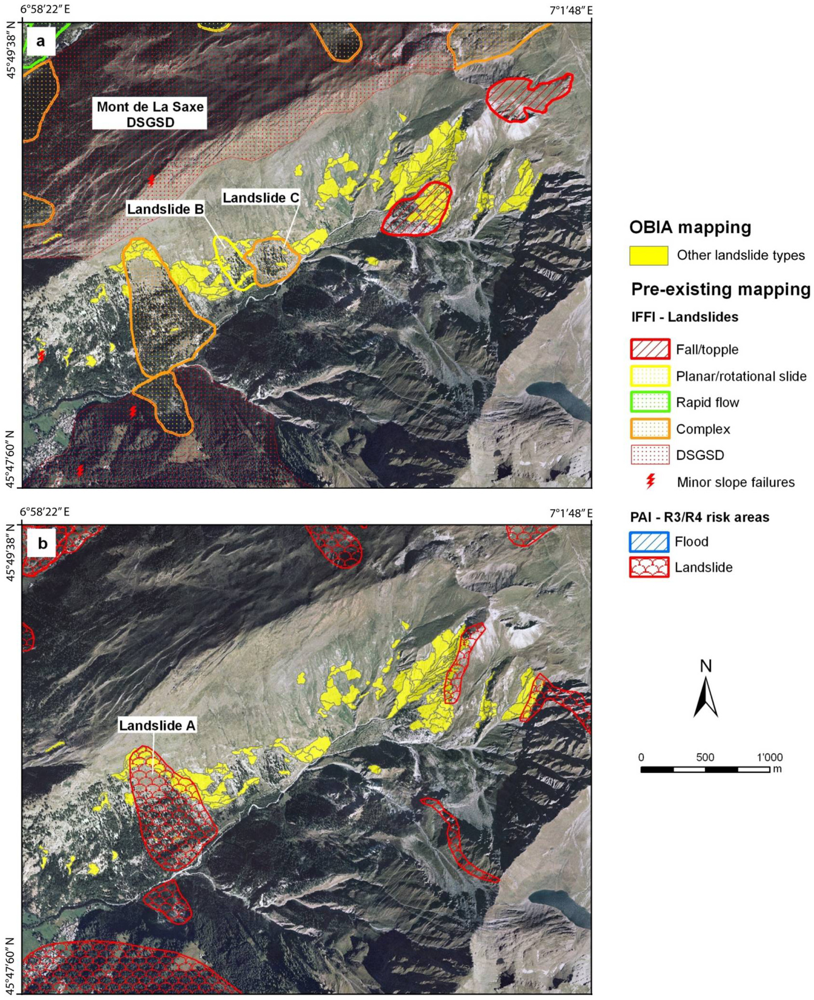
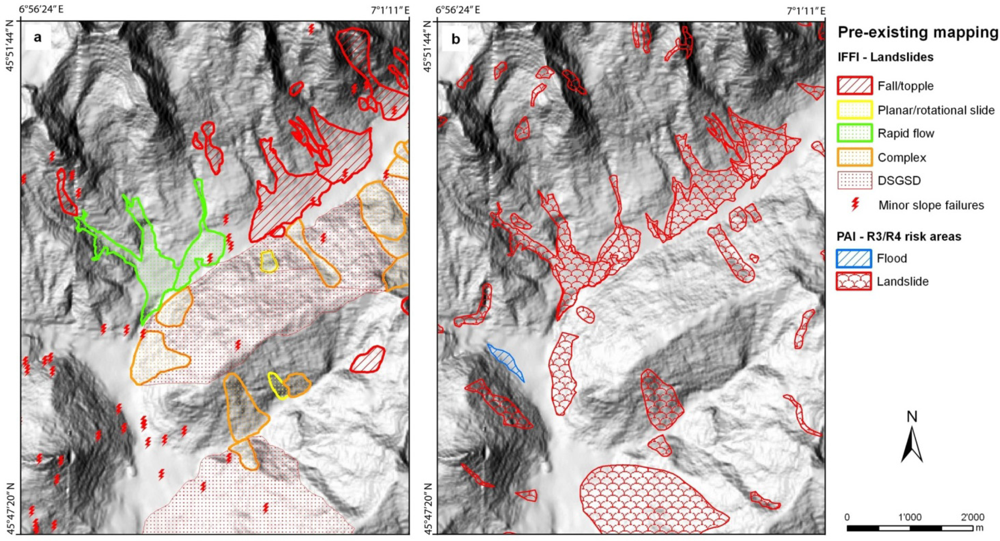
4.2.1. Cross-Comparison with Pre-Existing Landslide Inventories
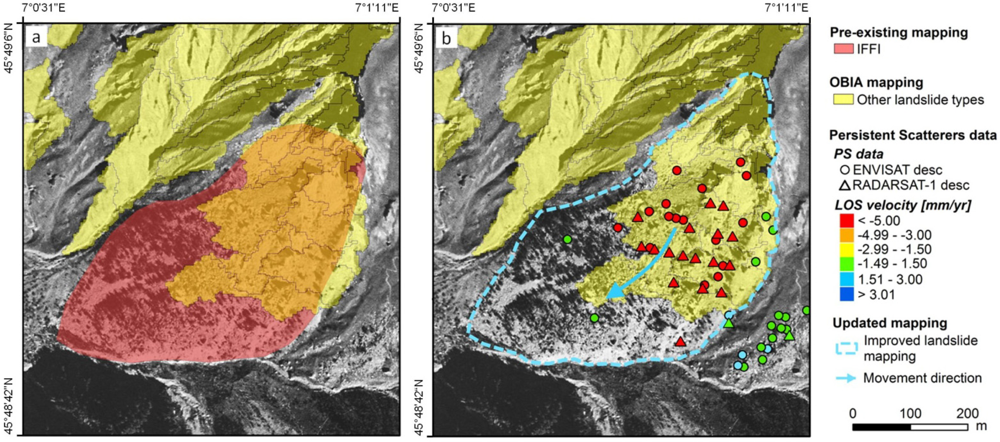
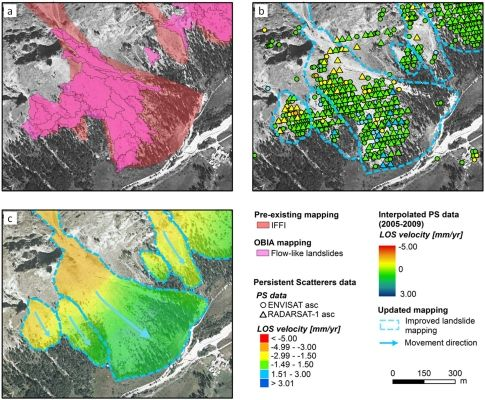
4.2.2. Advanced Interpretation of Persistent Scatterers Data in 1992–2009
4.3. Combined Use of OBIA and PS Interpretation for Integrated Landslide Mapping
5. Conclusions
Acknowledgments
References
- Guha-Sapir, D.; Vos, F.; Below, R.; Ponserre, S. Annual Disaster Statistical Review 2010: The Numbers and Trends; Centre for Research on the Epidemiology of Disasters (CRED), Université catholique de Louvain: Brussels, Belgium, 2011; p. 41. [Google Scholar]
- Tsai, F.; Hwang, J.-H.; Chen, L.C.; Lin, T.H. Post-disaster assessment of landslides in southern Taiwan after 2009 Typhoon Morakot using remote sensing and spatial analysis. Nat. Hazards Earth. Syst 2010, 10, 2179–2190. [Google Scholar]
- Barlow, J.; Franklin, S.; Martin, Y. High spatial resolution satellite imagery, DEM derivatives, and image segmentation for the detection of mass wasting processes. Photogramm. Eng. Remote Sensing 2006, 72, 687–692. [Google Scholar]
- Lu, P.; Stumpf, A.; Kerle, N.; Casagli, N. Object-oriented change detection for landslide rapid mapping. IEEE Geosci. Remote Sens. Lett 2011, 8, 701–705. [Google Scholar]
- Stumpf, A.; Kerle, N. Object-oriented mapping of landslides using Random Forests. Remote Sens. Environ 2011, 115, 2564–2577. [Google Scholar]
- Debella-Gilo, M.; Kääb, A. Measurement of surface displacement and deformation of mass movements using least squares matching of repeat high resolution satellite and aerial images. Remote Sens 2012, 4, 43–67. [Google Scholar]
- Borghuis, A.M.; Chang, K.T.; Lee, H.Y. Comparison between automated and manual mapping of typhoon-triggered landslides from SPOT-5 imagery. Int. J. Remote Sens 2007, 28, 1843–1856. [Google Scholar]
- Nichol, J.E.; Wong, M.S. Satellite remote sensing for detailed landslide inventories using change detection and image fusion. Int. J. Remote Sens 2005, 26, 1913–1926. [Google Scholar]
- Mondini, A.C.; Chang, K.T.; Yin, H.Y. Combining multiple change detection indices for mapping landslides triggered by typhoons. Geomorphology 2011, 134, 440–451. [Google Scholar]
- Martha, T.R.; Kerle, N.; Jetten, V.; van Westen, C.J.; Kumar, K.V. Characterising spectral, spatial and morphometric properties of landslides for semi-automatic detection using object-oriented methods. Geomorphology 2010, 116, 24–36. [Google Scholar]
- Blaschke, T. Object based image analysis for remote sensing. ISPRS J. Photogramm 2010, 65, 2–16. [Google Scholar]
- Lang, S. Object-Based Image Analysis for Remote Sensing Applications: Modeling Reality—Dealing with Complexity. In Object-Based Image Analysis: Spatial Concepts for Knowledge-Driven Remote Sensing Applications; Blaschke, T., Lang, S., Hay, G.J., Eds.; Springer: Berlin/Heidelberg, Germany, 2008; pp. 3–28. [Google Scholar]
- Cruden, D.M.; Varnes, D.J. Landslide Types and Processes. In Landslides: Investigation and Mitigation; Turner, A.K., Schuster, R.L., Eds.; Sp. Rep. 247; Transportation Research Board, National research Council, National Academy Press: Washington, DC, USA, 1996; pp. 36–75. [Google Scholar]
- Lahousse, T.; Chang, K.T.; Lin, Y.H. Landslide mapping with multi-scale object-based imaged analysis- a case study in the Baichi watershed, Taiwan. Nat. Hazards Earth. Syst 2011, 11, 1–12. [Google Scholar]
- Martha, T.R.; Kerle, N.; van Westen, C.J.; Jetten, V.; Kumar, K.V. Segment optimization and data-driven thresholding for knowledge-based landslide detection by object-based image analysis. IEEE Trans. Geosci. Remote Sens 2011, 49, 4928–4943. [Google Scholar]
- Martin, Y.E.; Franklin, S.E. Classification of soil and bedrock-dominated landslides in British Columbia using segmentation of satellite imagery and DEM data. Int. J. Remote Sens 2005, 26, 1505–1509. [Google Scholar]
- Moine, M.; Puissant, A.; Malet, J.P. Detection of Landslides from Aerial and Satellite Images with a Semi-Automatic Method. Application to the Barcelonnette Basin (Alps-de-Haute-Provence). In Landslide Processes: From Geomorphological Mapping to Dynamic Modelling; Malet, J.-P., Remaitre, A., Bogaard, T., Eds.; CERG: Strasbourg, France, 2009; pp. 63–68. [Google Scholar]
- Rau, J.Y.; Jhan, J.P.; Lo, C.F.; Lin, Y.S. Landslide Mapping Using Imagery Acquired by a Fixed-Wing UAV. In International Archives of the Photogrammetry, Remote Sensing and Spatial Information Sciences, Proceedings of the International Conference on Unmanned Aerial Vehicle in Geomatics (UAV-g), Zurich, Switzerland, 14–16 September 2011; 2011; XXXVIII, p. 6. [Google Scholar]
- Hölbling, D.; Füreder, P. A (semi-)automated object-based approach for landslide detection based on SPOT-5 imagery and digital elevation data. Geophys. Res. Abs 2011, 13. EGU 2011-6786.. [Google Scholar]
- Aksoy, B.; Ercanoglu, M. Landslide identification and classification by object-based image analysis and fuzzy logic: An example from the Azdavay region (Kastamonu, Turkey). Comput. Geosci 2012, 38, 87–98. [Google Scholar]
- Drǎgut, L.; Blaschke, T. Automated classification of landform elements using object-based image analysis. Geomorphology 2006, 81, 330–344. [Google Scholar]
- Drǎgut, L.; Eisank, C. Automated object-based classification of topography from SRTM data. Geomorphology 2012, 141–142, 21–33. [Google Scholar]
- Lang, S.; Albrecht, F.; Kienberger, S.; Tiede, D. Object validity for operational tasks in a policy context. J. Spatial Sci 2010, 55, 9–22. [Google Scholar]
- Dal Piaz, G.V.; Bistacchi, A.; Massironi, M. Geological outline of the Alps. Episodes 2004, 28, 174–179. [Google Scholar]
- Roure, F.; Bergerat, F.; Damotte, B.; Mugnier, J.L.; Polino, R. The ECORS-CROP Alpine seismic traverse. Memoires de la Societe Geologique de France 1996, 170, 1–113. [Google Scholar]
- Bernabini, M.; Polino, R.; Nicolich, R. Seismic lines CROP-ECORS across the Western Alps. Mem. Descr. Carta Geol. d’It 2003, LXII, 89–96. [Google Scholar]
- Bucher, S.; Ulardic, C.; Bousquet, R.; Ceriani, S.; Fügenschuh, B.; Gouffon, Y.; Schmid, S.M. Tectonic evolution of the Briançonnais units along a transect (ECORS-CROP) through the Italian-French Western Alps. Eclogae. Geol. Helv 2004, 97, 321–345. [Google Scholar]
- Deline, P.; Broccolato, M.; Noetzli, J.; Ravanel, L.; Tamburini, A. The December 2008 Crammont rock avalanche, Mont Blanc massif area, Italy. Geophys. Res. Abs 2010, 12. EGU 2010-10388.. [Google Scholar]
- Arnaud, A.; Adam, N.; Hanssen, R.; Inglada, J.; Duro, J.; Closa, J.; Eineder, M. ASAR ERS Interferometric Phase Continuity. Proceedings of the International Geoscience and Remote Sensing Symposium (IGARSS’03), Toulouse, France, 21–25 July 2003; pp. 1133–1135.
- Duro, J.; Inglada, J.; Closa, J.; Adam, N.; Arnaud, A. High Resolution Differential Interferometry Using Time Series of ERS and ENVISAT SAR Data. Proceedings of FRINGE 2003 Workshop, Frascati, Italy, 1–5 December 2003; p. 6.
- Tiede, D.; Lang, S.; Albrecht, F.; Hölbling, D. Object-based class modeling for cadastre-constrained delineation of geo-objects. Photogramm. Eng. Remote Sensing 2010, 76, 193–202. [Google Scholar]
- Tiede, D.; Lang, S.; Hoffmann, C. Type-Specific Class Modelling for One-Level Representation of Single Trees. In Object-Based Image Analysis: Spatial Concepts for Knowledge-Driven Remote Sensing Applications; Blaschke, T., Lang, S., Hay, G.J., Eds.; Springer: Berlin, German, 2008; pp. 133–151. [Google Scholar]
- Drǎguţ, L.; Tiede, D.; Levick, S.R. ESP: A tool to estimate scale parameter for multiresolution image segmentation of remotely sensed data. Int. J. Geogr. Inf. Sci 2010, 24, 859–871. [Google Scholar]
- Trimble Documentation. eCognition® Developer 8.64.0 Reference Book; Trimble Germany GmbH: Munich, Germany, 2010. [Google Scholar]
- Varnes, D.J. Slope Movements: Types and Processes. In Landslides: Analysis and Control; Schuster, R.L., Krizek, R.J., Eds.; Special Report 176; Transportation Research Board, National Academy of Sciences: Washington, DC, USA, 1978; pp. 11–33. [Google Scholar]
- Agenzia per la Protezione dell’Ambiente e per i Servizi Tecnici (APAT). Rapporto Sulle Frane in Italia, Il Progetto IFFI: Metodologia, Risultati e Rapporti Regionali; APAT Report 78; APAT: Rome, Italy, 2007. [Google Scholar]
- Crosetto, M.; Monserrat, O.; Cuevas, M.; Crippa, B. Spaceborne differential SAR interferometry: Data analysis tools for deformation measurement. Remote Sens 2011, 3, 305–318. [Google Scholar]
- Zhou, X.; Chang, N.-B.; Li, S. Applications of SAR Interferometry in earth and environmental science research. Sensors 2009, 9, 1876–1912. [Google Scholar]
- Meisina, C.; Zucca, F.; Notti, D.; Colombo, A.; Cucchi, A.; Savio, G.; Giannico, C.; Bianchi, M. Geological interpretation of PSInSAR data at regional scale. Sensors 2008, 8, 7469–7492. [Google Scholar]
- Delacourt, C.; Raucoules, D.; Le Mouélic, S.; Carnec, C.; Feurer, D.; Allemand, P.; Cruchet, M. Observation of a large landslide on La Reunion Island using differential SAR Interferometry (JERS and Radarsat) and correlation of optical (Spot5 and Aerial) images. Sensors 2009, 9, 616–630. [Google Scholar]
- Farina, P.; Casagli, N.; Ferretti, A. Radar-interpretation of InSAR Measurements for Landslide Investigations in Civil Protection Practices. Proceedings of the 1st North American Landslide Conference, Vail, CO, USA, 3–8 June 2007; pp. 272–283.
- Cigna, F.; Del Ventisette, C.; Liguori, V.; Casagli, N. Advanced radar-interpretation of InSAR time series for mapping and characterization of geological processes. Nat. Hazards. Earth. Syst 2011, 11, 865–881. [Google Scholar] [Green Version]


| OBIA | No of Features | Area [km2] |
|---|---|---|
| Flow-like landslides | 275 | 1.68 |
| Other landslide types | 357 | 2.09 |
| Total | 632 | 3.77 |
| Spatial overlap with IFFI | ||
| Flow-like landslides | 181 | 1.16 |
| Other landslide types | 89 | 0.53 |
| Total | 270 | 1.69 |
| Spatial overlap with PAI | ||
| Flow-like landslides | 178 | 1.16 |
| Other landslide types | 104 | 0.74 |
| Total | 282 | 1.90 |
| IFFI | ||
| Fall/topple | 15 | 2.83 |
| Planar/rotation slide | 2 | 0.14 |
| Rapid flow | 2 | 1.18 |
| Complex | 12 | 3.18 |
| DSGSD | 6 | 10.79 |
| Total | 37 | 18.12 |
| PAI | ||
| R3 and R4 areas | 50 | 12.26 |
Share and Cite
Hölbling, D.; Füreder, P.; Antolini, F.; Cigna, F.; Casagli, N.; Lang, S. A Semi-Automated Object-Based Approach for Landslide Detection Validated by Persistent Scatterer Interferometry Measures and Landslide Inventories. Remote Sens. 2012, 4, 1310-1336. https://doi.org/10.3390/rs4051310
Hölbling D, Füreder P, Antolini F, Cigna F, Casagli N, Lang S. A Semi-Automated Object-Based Approach for Landslide Detection Validated by Persistent Scatterer Interferometry Measures and Landslide Inventories. Remote Sensing. 2012; 4(5):1310-1336. https://doi.org/10.3390/rs4051310
Chicago/Turabian StyleHölbling, Daniel, Petra Füreder, Francesco Antolini, Francesca Cigna, Nicola Casagli, and Stefan Lang. 2012. "A Semi-Automated Object-Based Approach for Landslide Detection Validated by Persistent Scatterer Interferometry Measures and Landslide Inventories" Remote Sensing 4, no. 5: 1310-1336. https://doi.org/10.3390/rs4051310
APA StyleHölbling, D., Füreder, P., Antolini, F., Cigna, F., Casagli, N., & Lang, S. (2012). A Semi-Automated Object-Based Approach for Landslide Detection Validated by Persistent Scatterer Interferometry Measures and Landslide Inventories. Remote Sensing, 4(5), 1310-1336. https://doi.org/10.3390/rs4051310