Urban Heat Island Analysis Using the Landsat TM Data and ASTER Data: A Case Study in Hong Kong


Abstract
:1. Introduction
2. Study Area and Data
2.1. Study Area
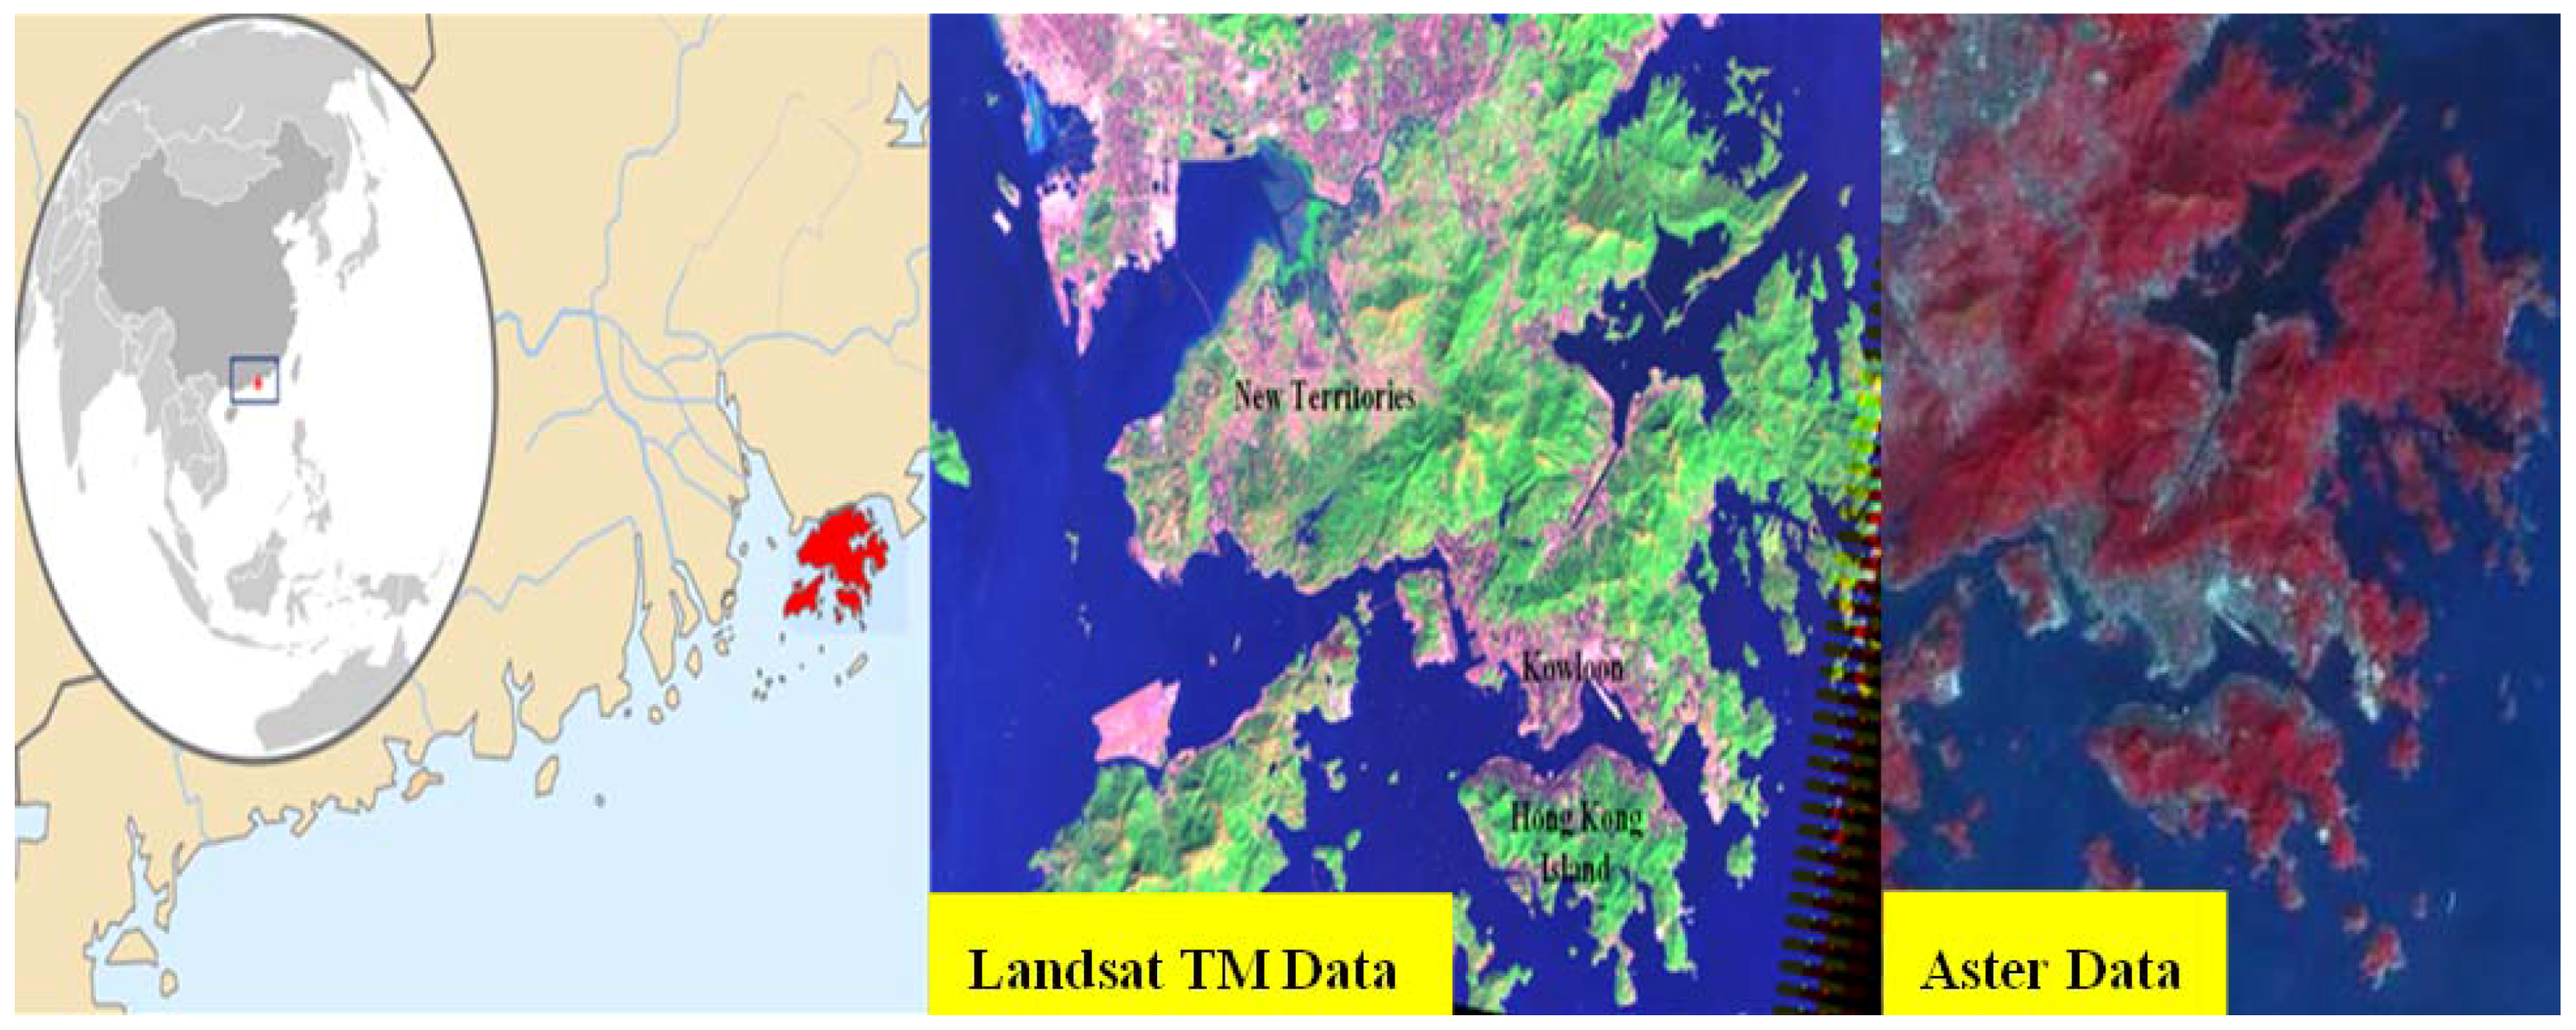
2.2. Data
2.2.1. Satellite Image Data

| Data | Resolution (m) | Time | Date |
|---|---|---|---|
| Landsat TM | 120 × 120 | 02:40 | 23 November 2005 |
| ASTER L1A | 90 × 90 | 03:08 | 1 December 2005 |
2.2.2. Other Auxiliary Data
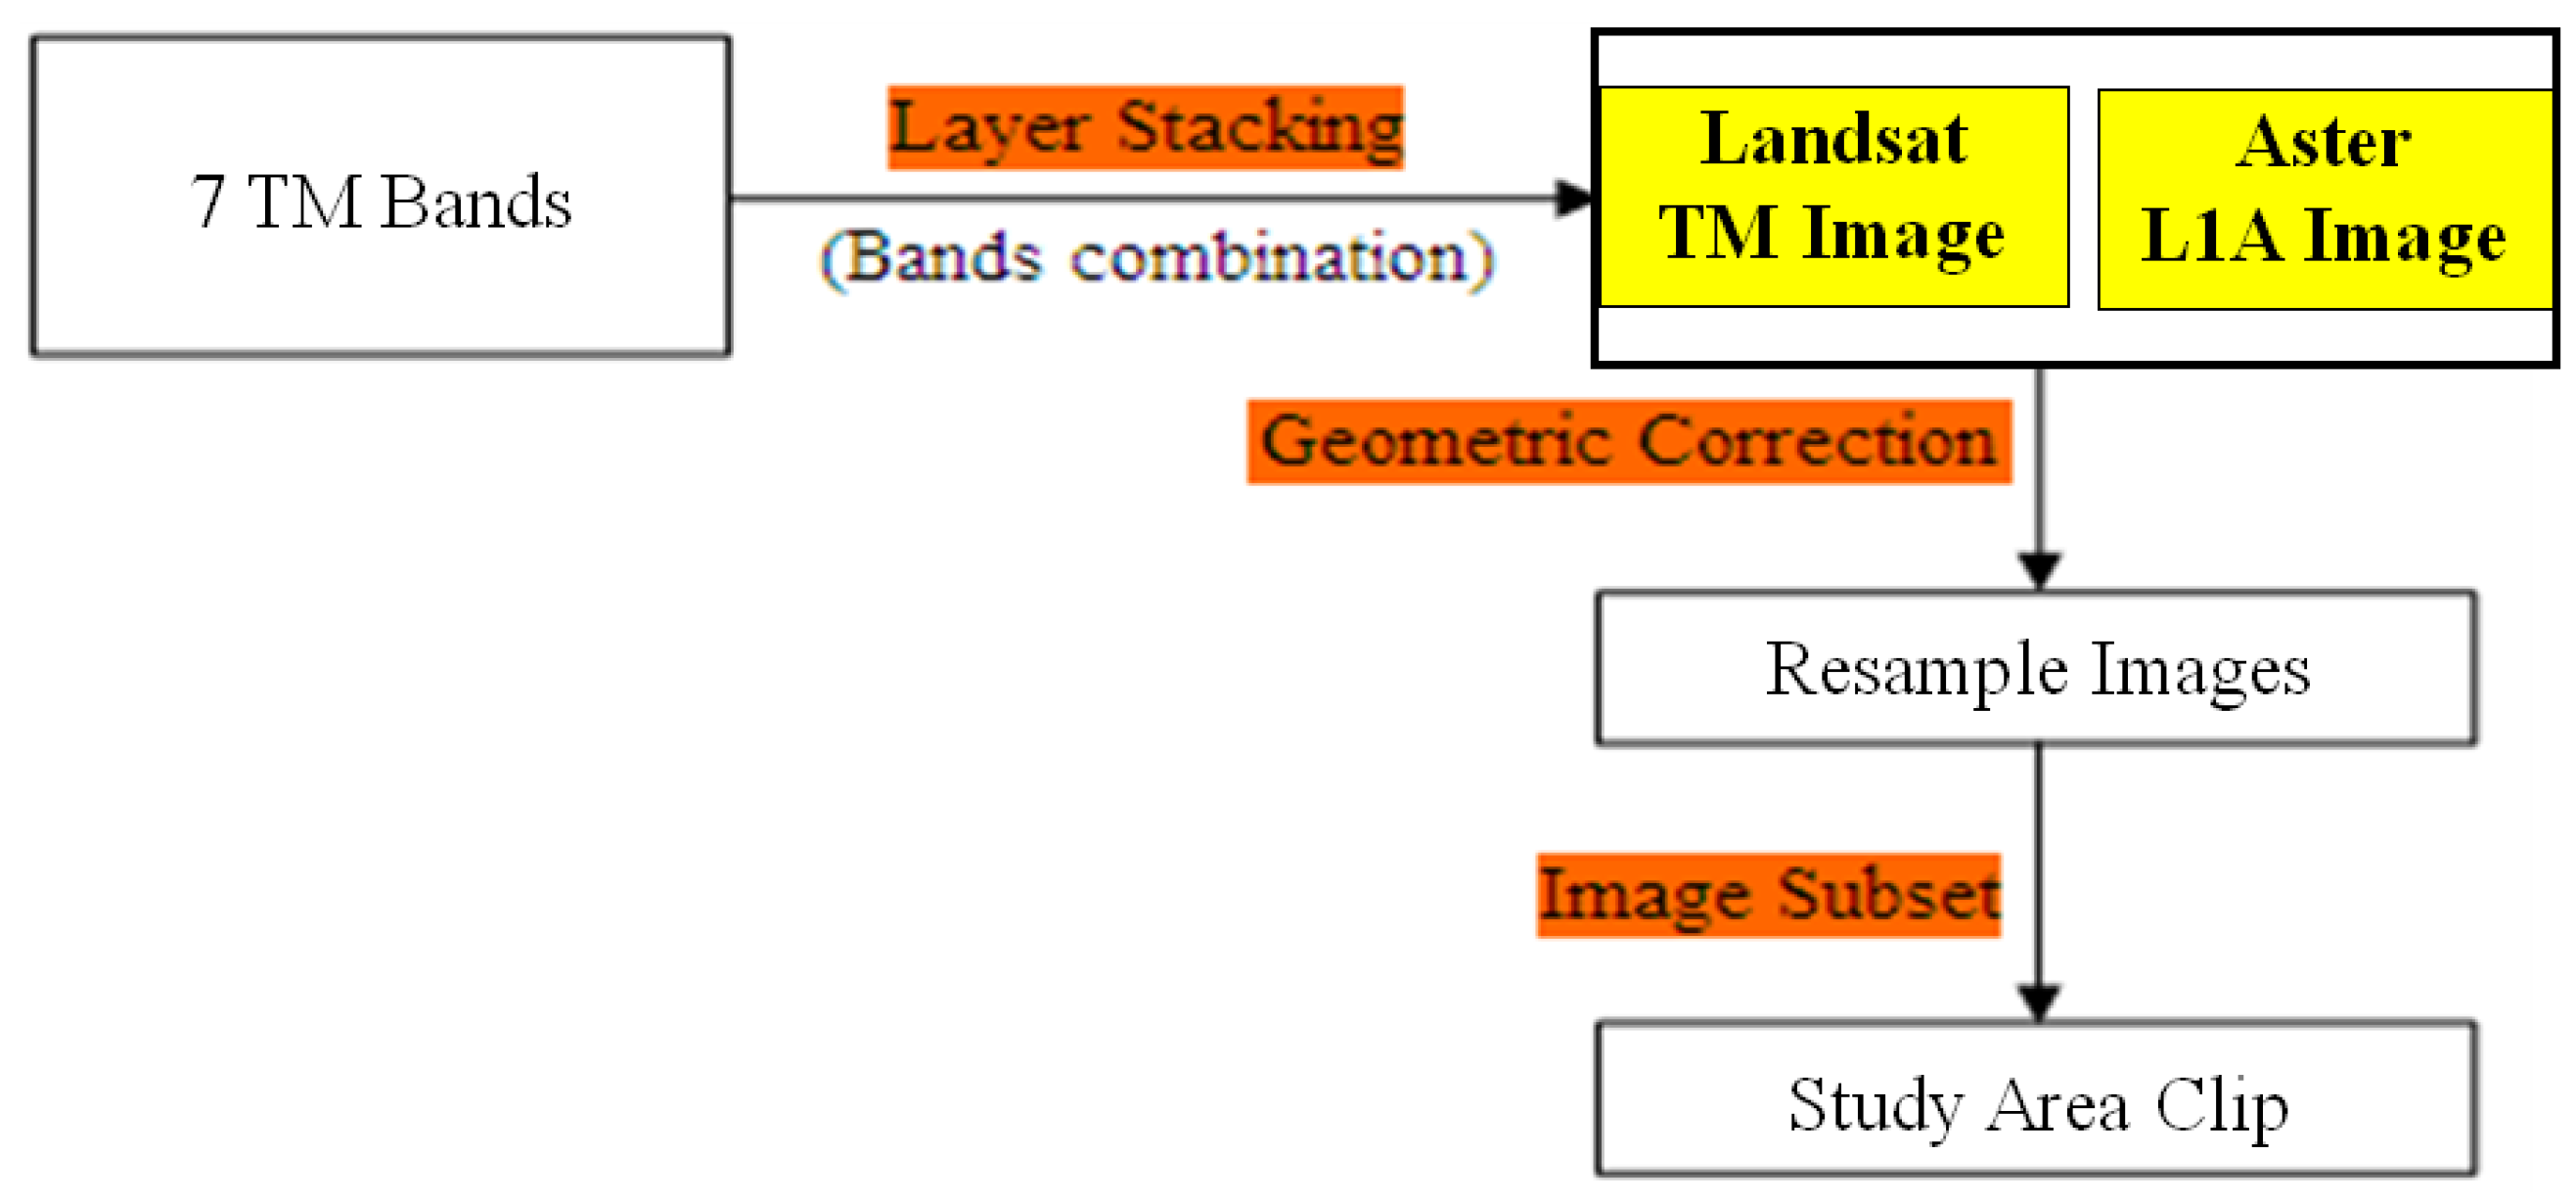
2.2.3. Data Pre-Processing

3. LST Retrieval Methodology
3.1. Brief Introduction to Different LST Retrieval Methods
| Algorithm | Temperature/Emissivity Separation | Single-Channel | Mono-Window | Split-Window | Multi-Window | |
|---|---|---|---|---|---|---|
| Data | ||||||
| Landsat TM (1 thermal band) | √ (in situ parameters required) | √ (lower accuracy) | √ (higher accuracy) | |||
| ASTER L1A (5 thermal bands) | √ | √ | √ | √ | √ | |
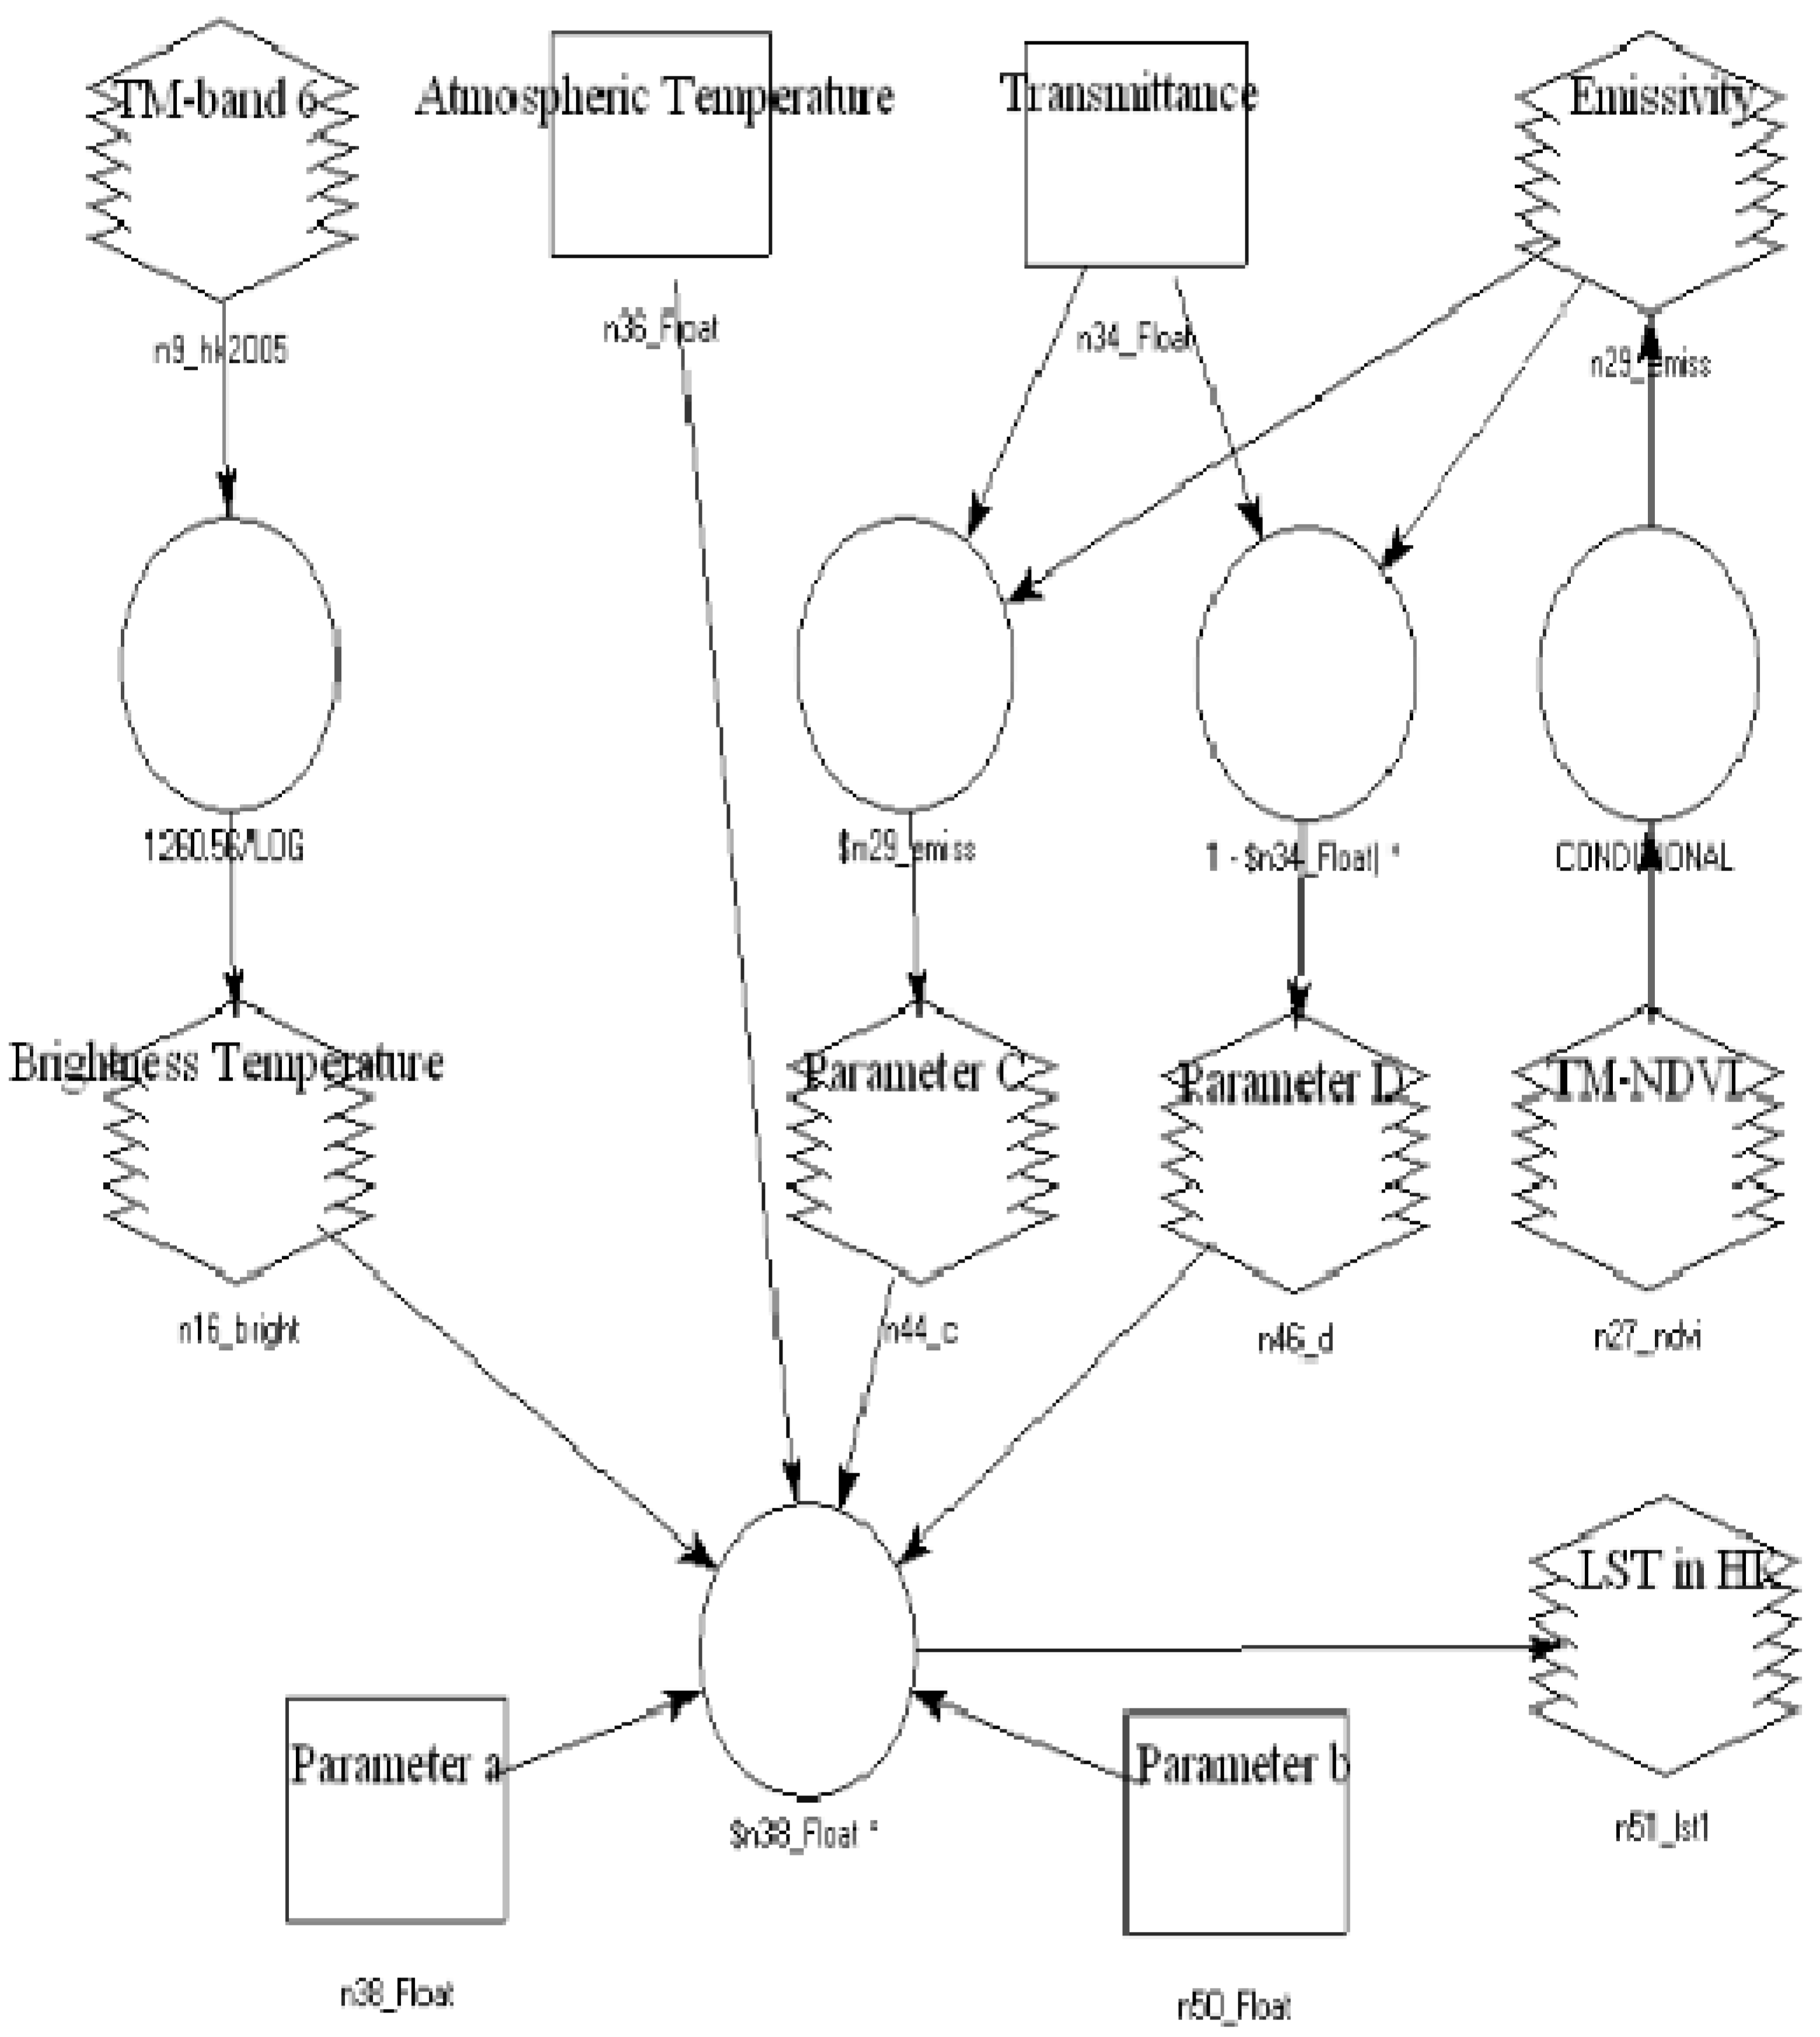
3.2. Mono-Window Algorithm and Split-Window Algorithm

- (1)
- Convert the digital number (DN) into spectral radiance:
- (2)
- Convert the spectral radiance into at-sensor brightness temperature:
- (3)
- Calculation of land surface emissivity:
- (i)
- Precise calculation of NDVI
- (ii)
- Estimation of emissivity
| NDVI | Land surface emissivity () |
| NDVI < −0.185 | 0.995 |
| −0.185 ≤ NDVI < 0.157 | 0.970 |
| 0.157 ≤ NDVI ≤ 0.727 | 1.009 4 + 0.047ln(NDVI) |
| NDVI > 0.727 | 0.990 |
- (4)
- Calculation of atmospheric transmittance:
- (i)
- Calculation of water vapor content
- (ii)
- Estimation of atmospheric transmittance
| Profiles | Water vapor () (g/cm2) | Transmittance estimation equation () | Squared correction | Standard error |
|---|---|---|---|---|
| High air temperature | 0.4–1.6 | 0.974290−0.08007 | 0.99611 | 0.002368 |
| 1.6–3.0 | 1.031412−0.115 36 | 0.99827 | 0.002539 | |
| Low air temperature | 0.4–1.6 | 0.982007−0.09611 | 0.99563 | 0.003340 |
| 1.6–3.0 | 1.053710−0.14142 | 0.99899 | 0.002375 |
- (5)
- Calculation of mean atmospheric temperature:
| Area | Atmospheric temperature equation () (K) |
|---|---|
| For USA 1976 | 25.9396 + 0.88045 × |
| For tropical | 17.9769 + 0.91715 × |
| For mid-latitude summer | 16.0110 + 0.92621 × |
| For mid-latitude winter | 19.2704 + 0.91118 × |
- (6)
- LST retrievals of the two algorithms:temperature:
| Parameters | Values | ||||||
|---|---|---|---|---|---|---|---|
| Land surface emissivity | (ε6) | NDVI | |||||
| (ε13) | <−0.185 | [−0.185,0.157] | [0.157,0.727] | >0.727 | |||
| (ε14) | 0.995 | 0.970 | 1.0094 + 0.047ln(NDVI) | 0.990 | |||
| Atmospheric transmittance | (τ6) | 23 November 2005 | |||||
| T0 | RH | w6 | |||||
| 20.9 °C | 65% | 1.75 g/cm2 | |||||
| 0.83 | |||||||
| (τ13) | 1 December 2005 | ||||||
| T0 | RH | w13 | |||||
| 21.1 °C | 79% | 2.11 g/cm2 | |||||
| 0.80 | |||||||
| (τ14) | 1 December 2005 | ||||||
| T0 | RH | w14 | |||||
| 21.1 °C | 79% | 2.11 g/cm2 | |||||
| 0.76 | |||||||
| Mean atmospheric temperature | (Ta) | 23 November 2005 | |||||
| T0 | |||||||
| 20.9 °C | |||||||
| 14.5 °C | |||||||
| (Tb) | 1 December 2005 | ||||||
| T0 | |||||||
| 21.1 °C | |||||||
| 14.7 °C | |||||||
4. Results and Discussion
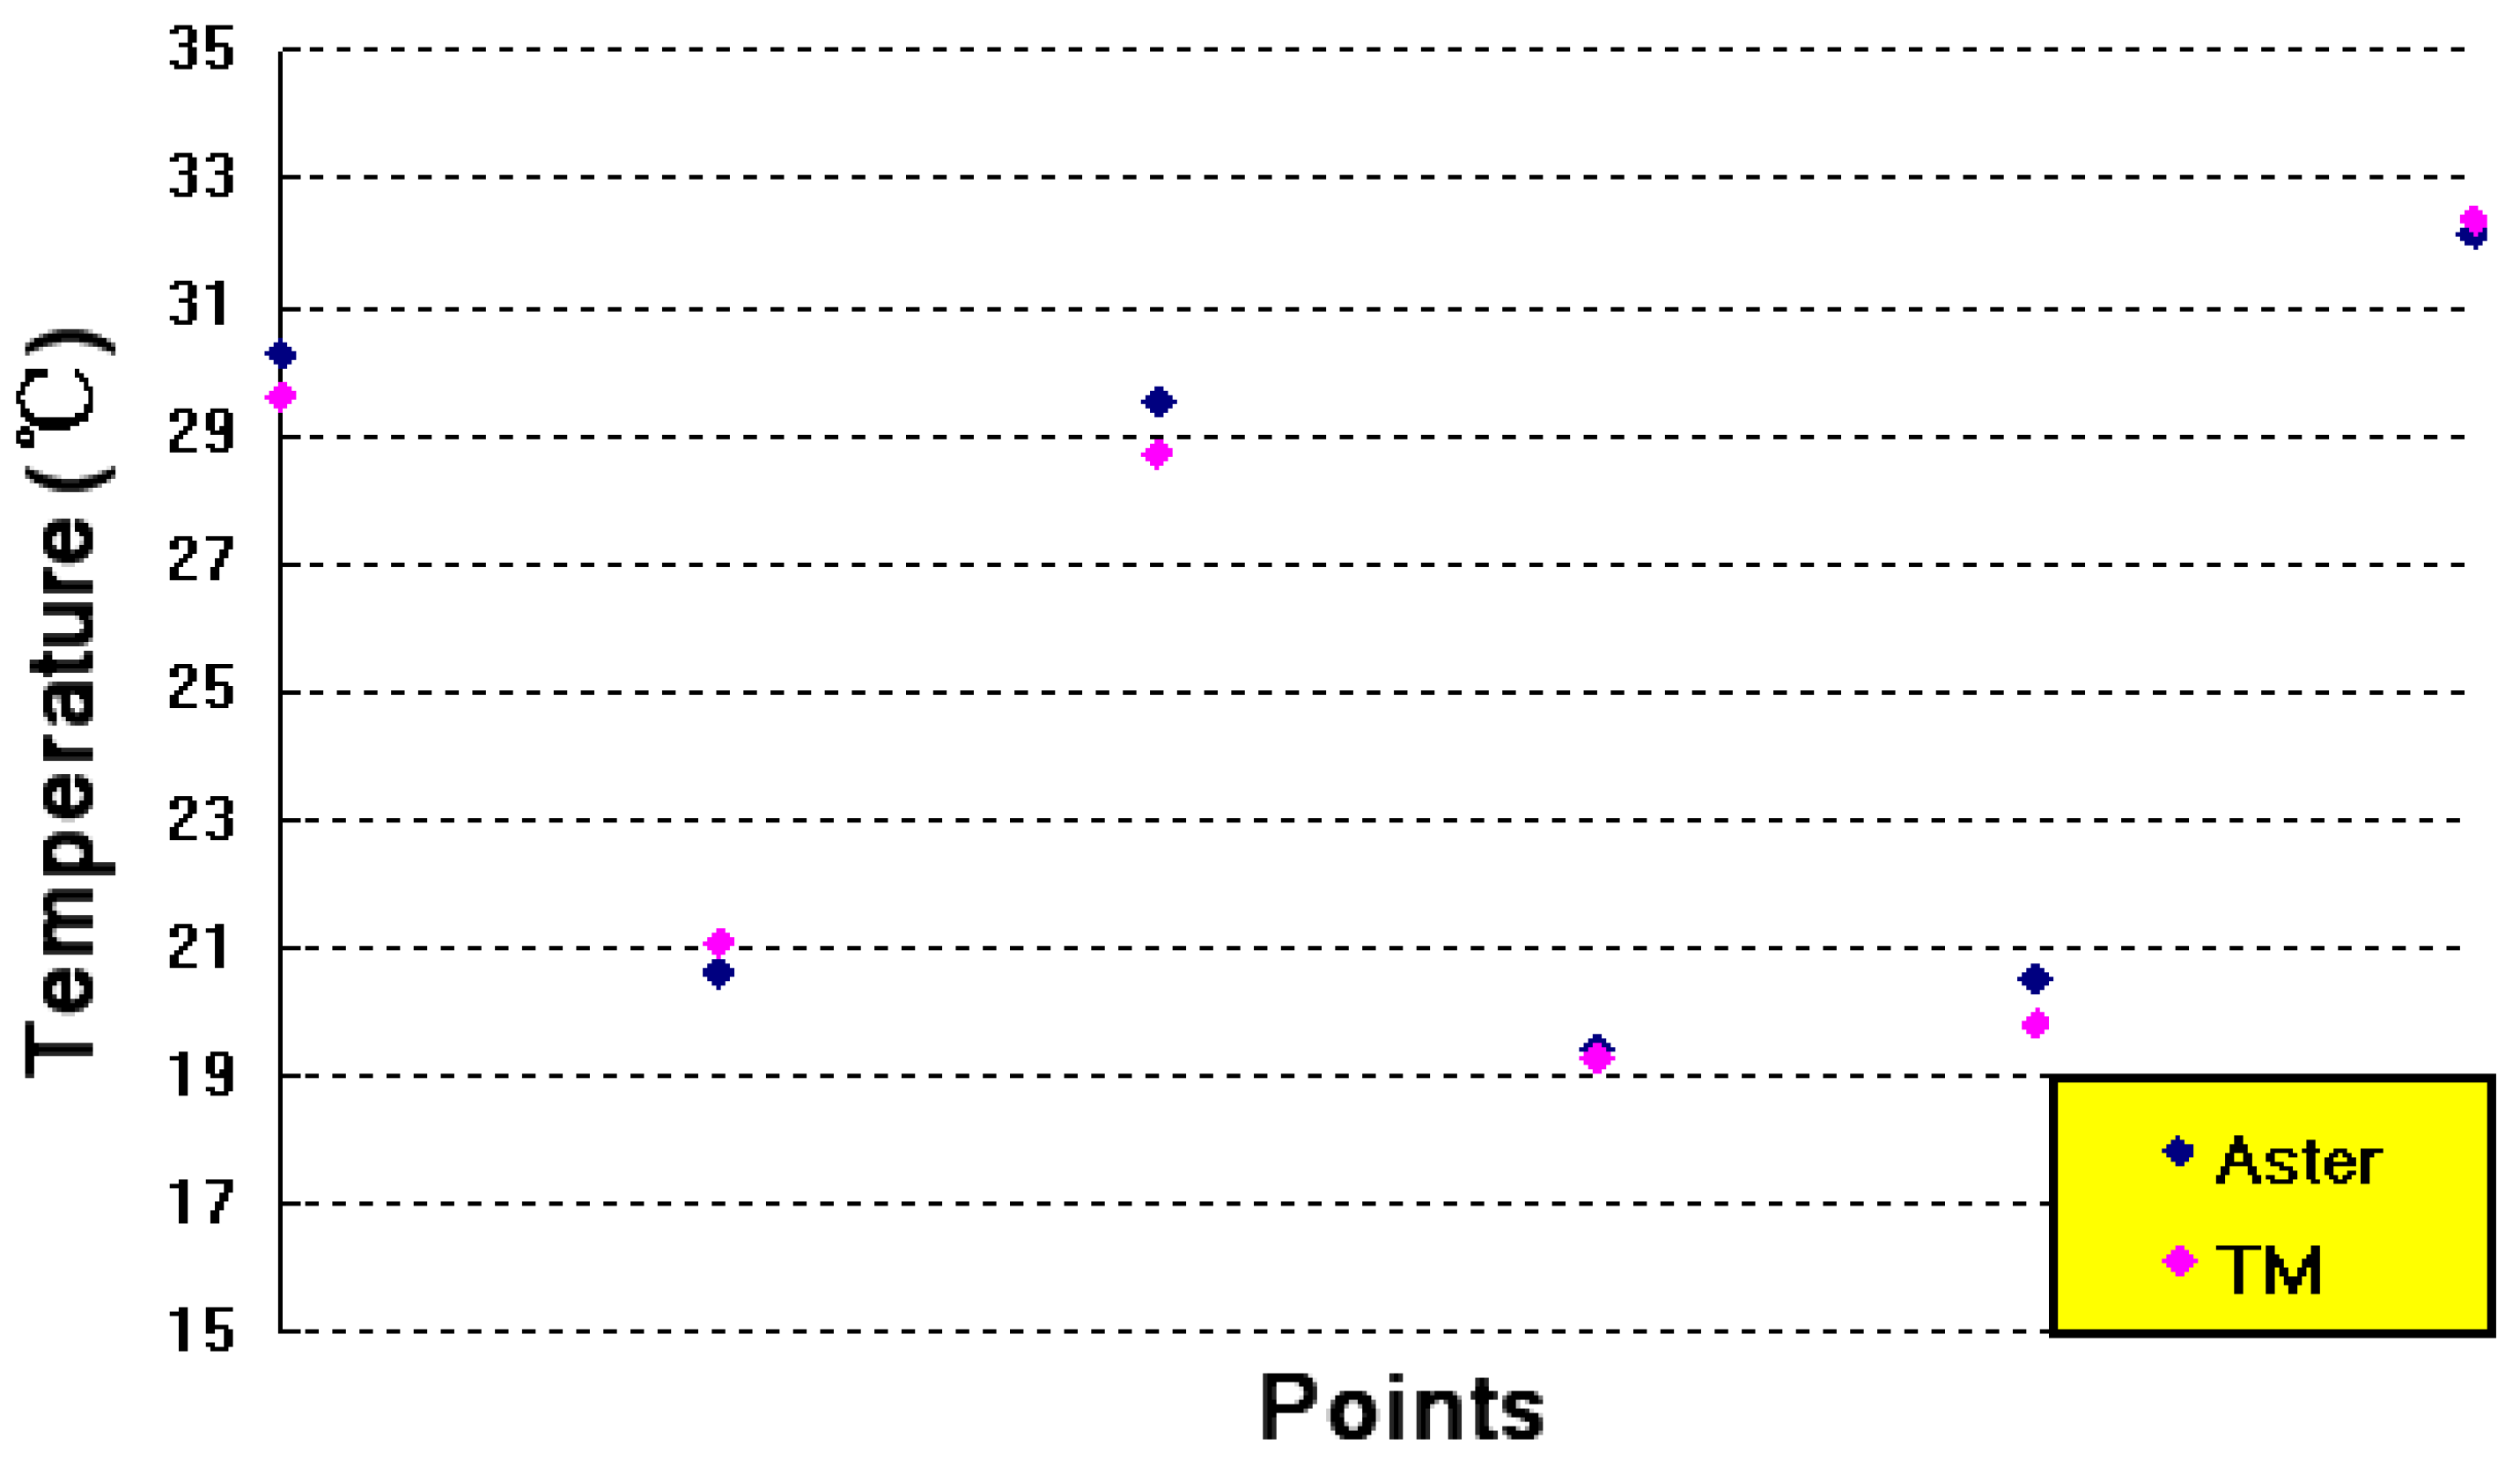
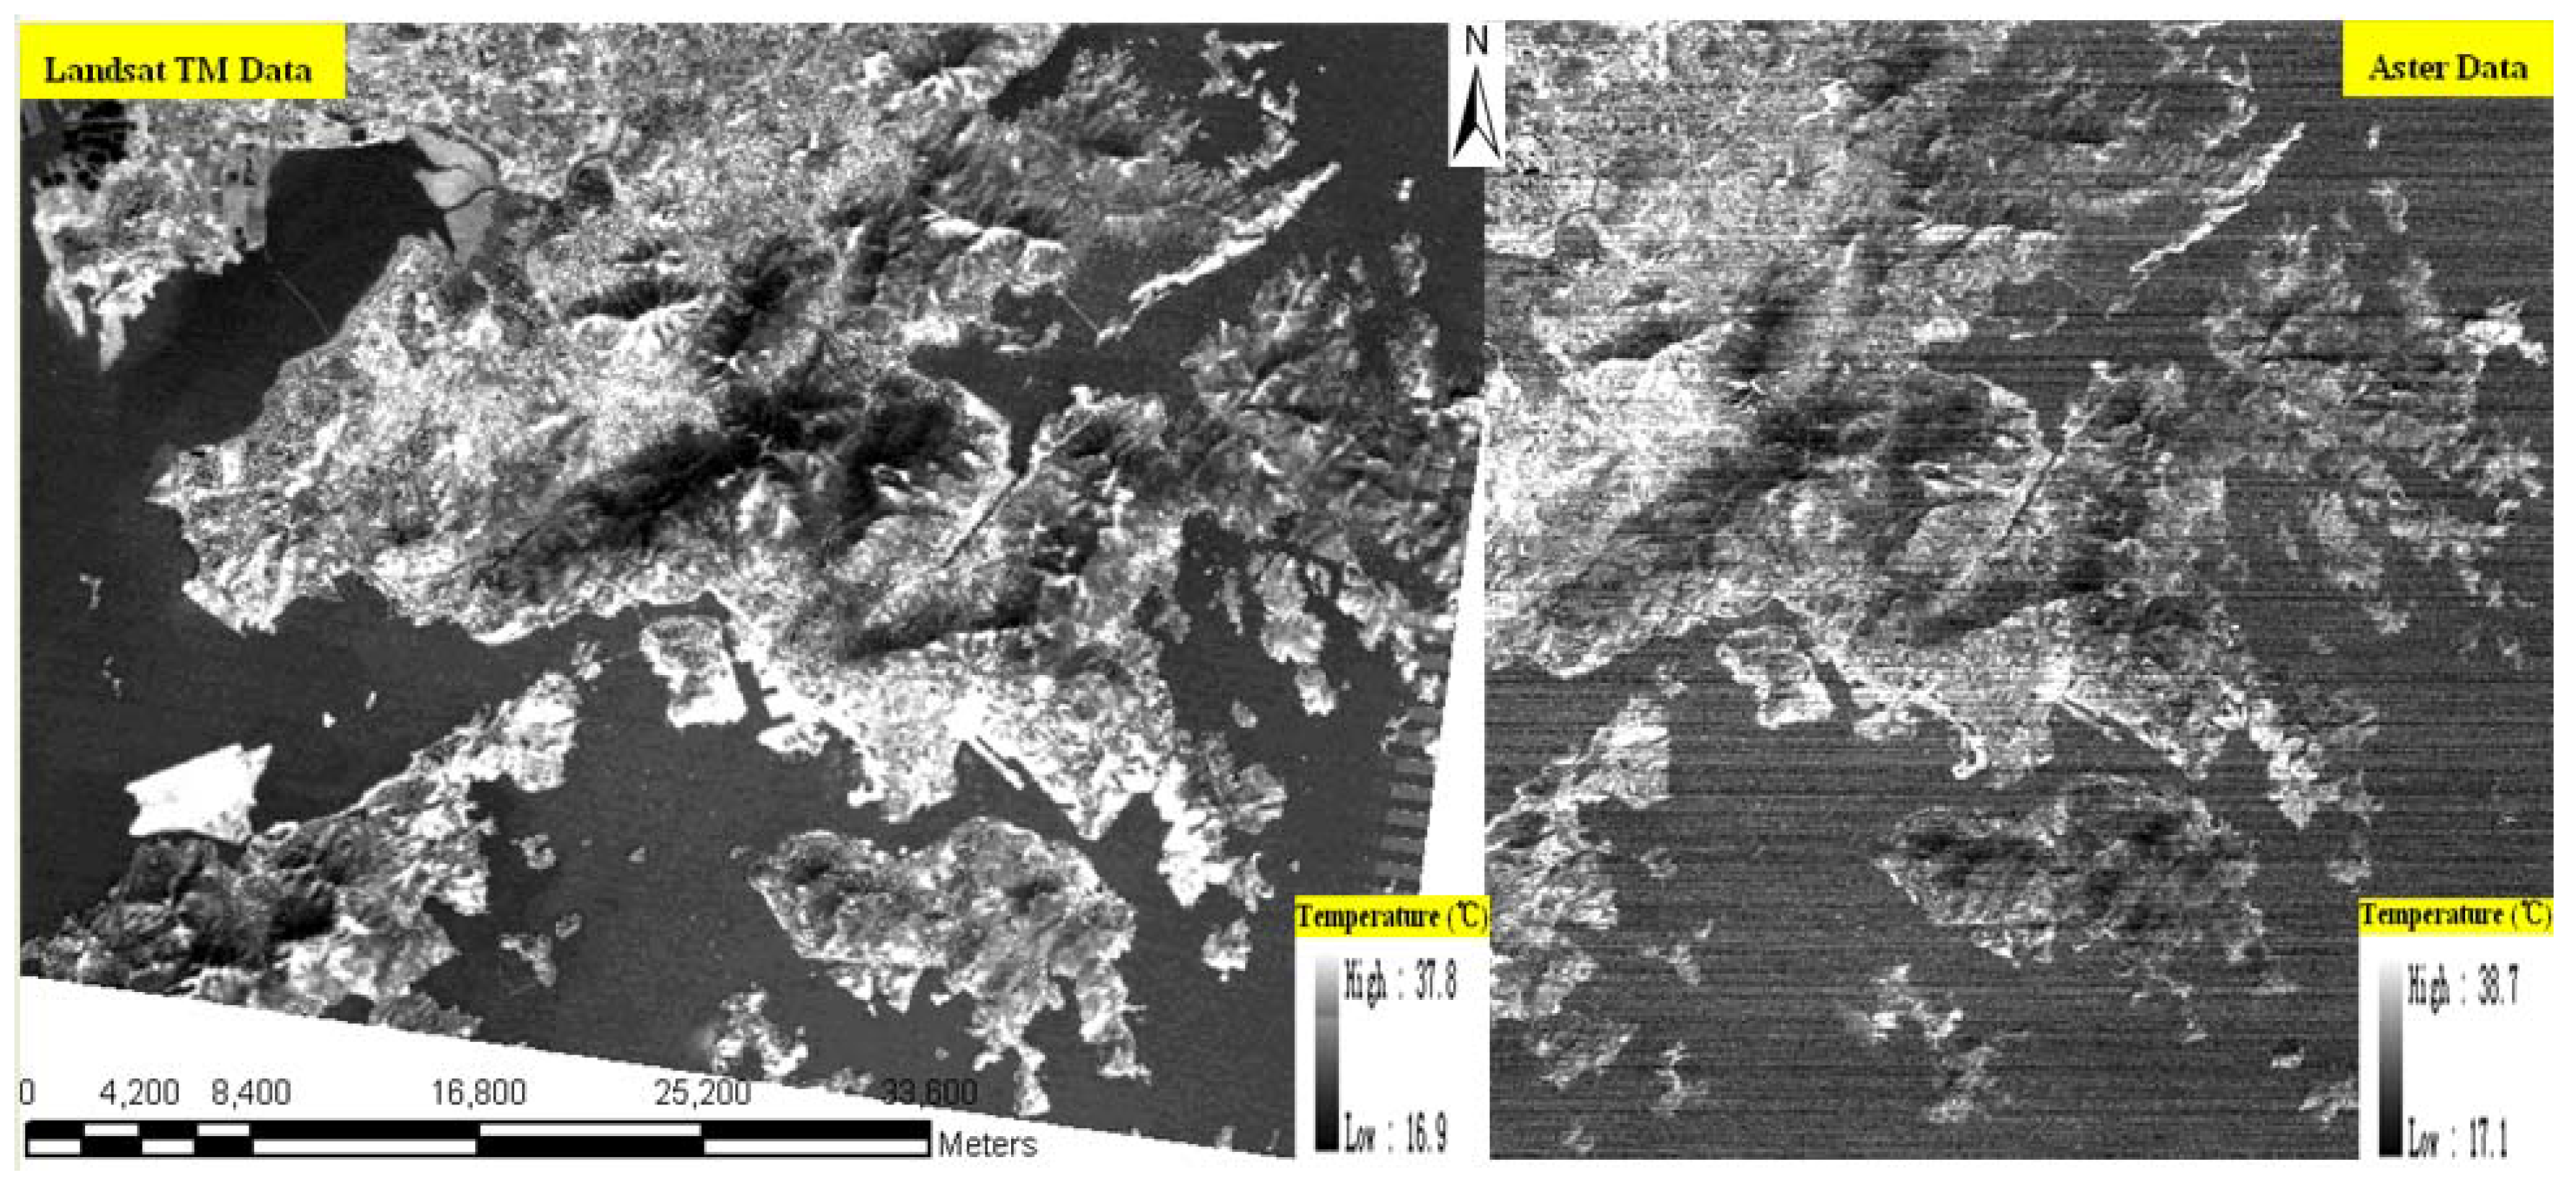
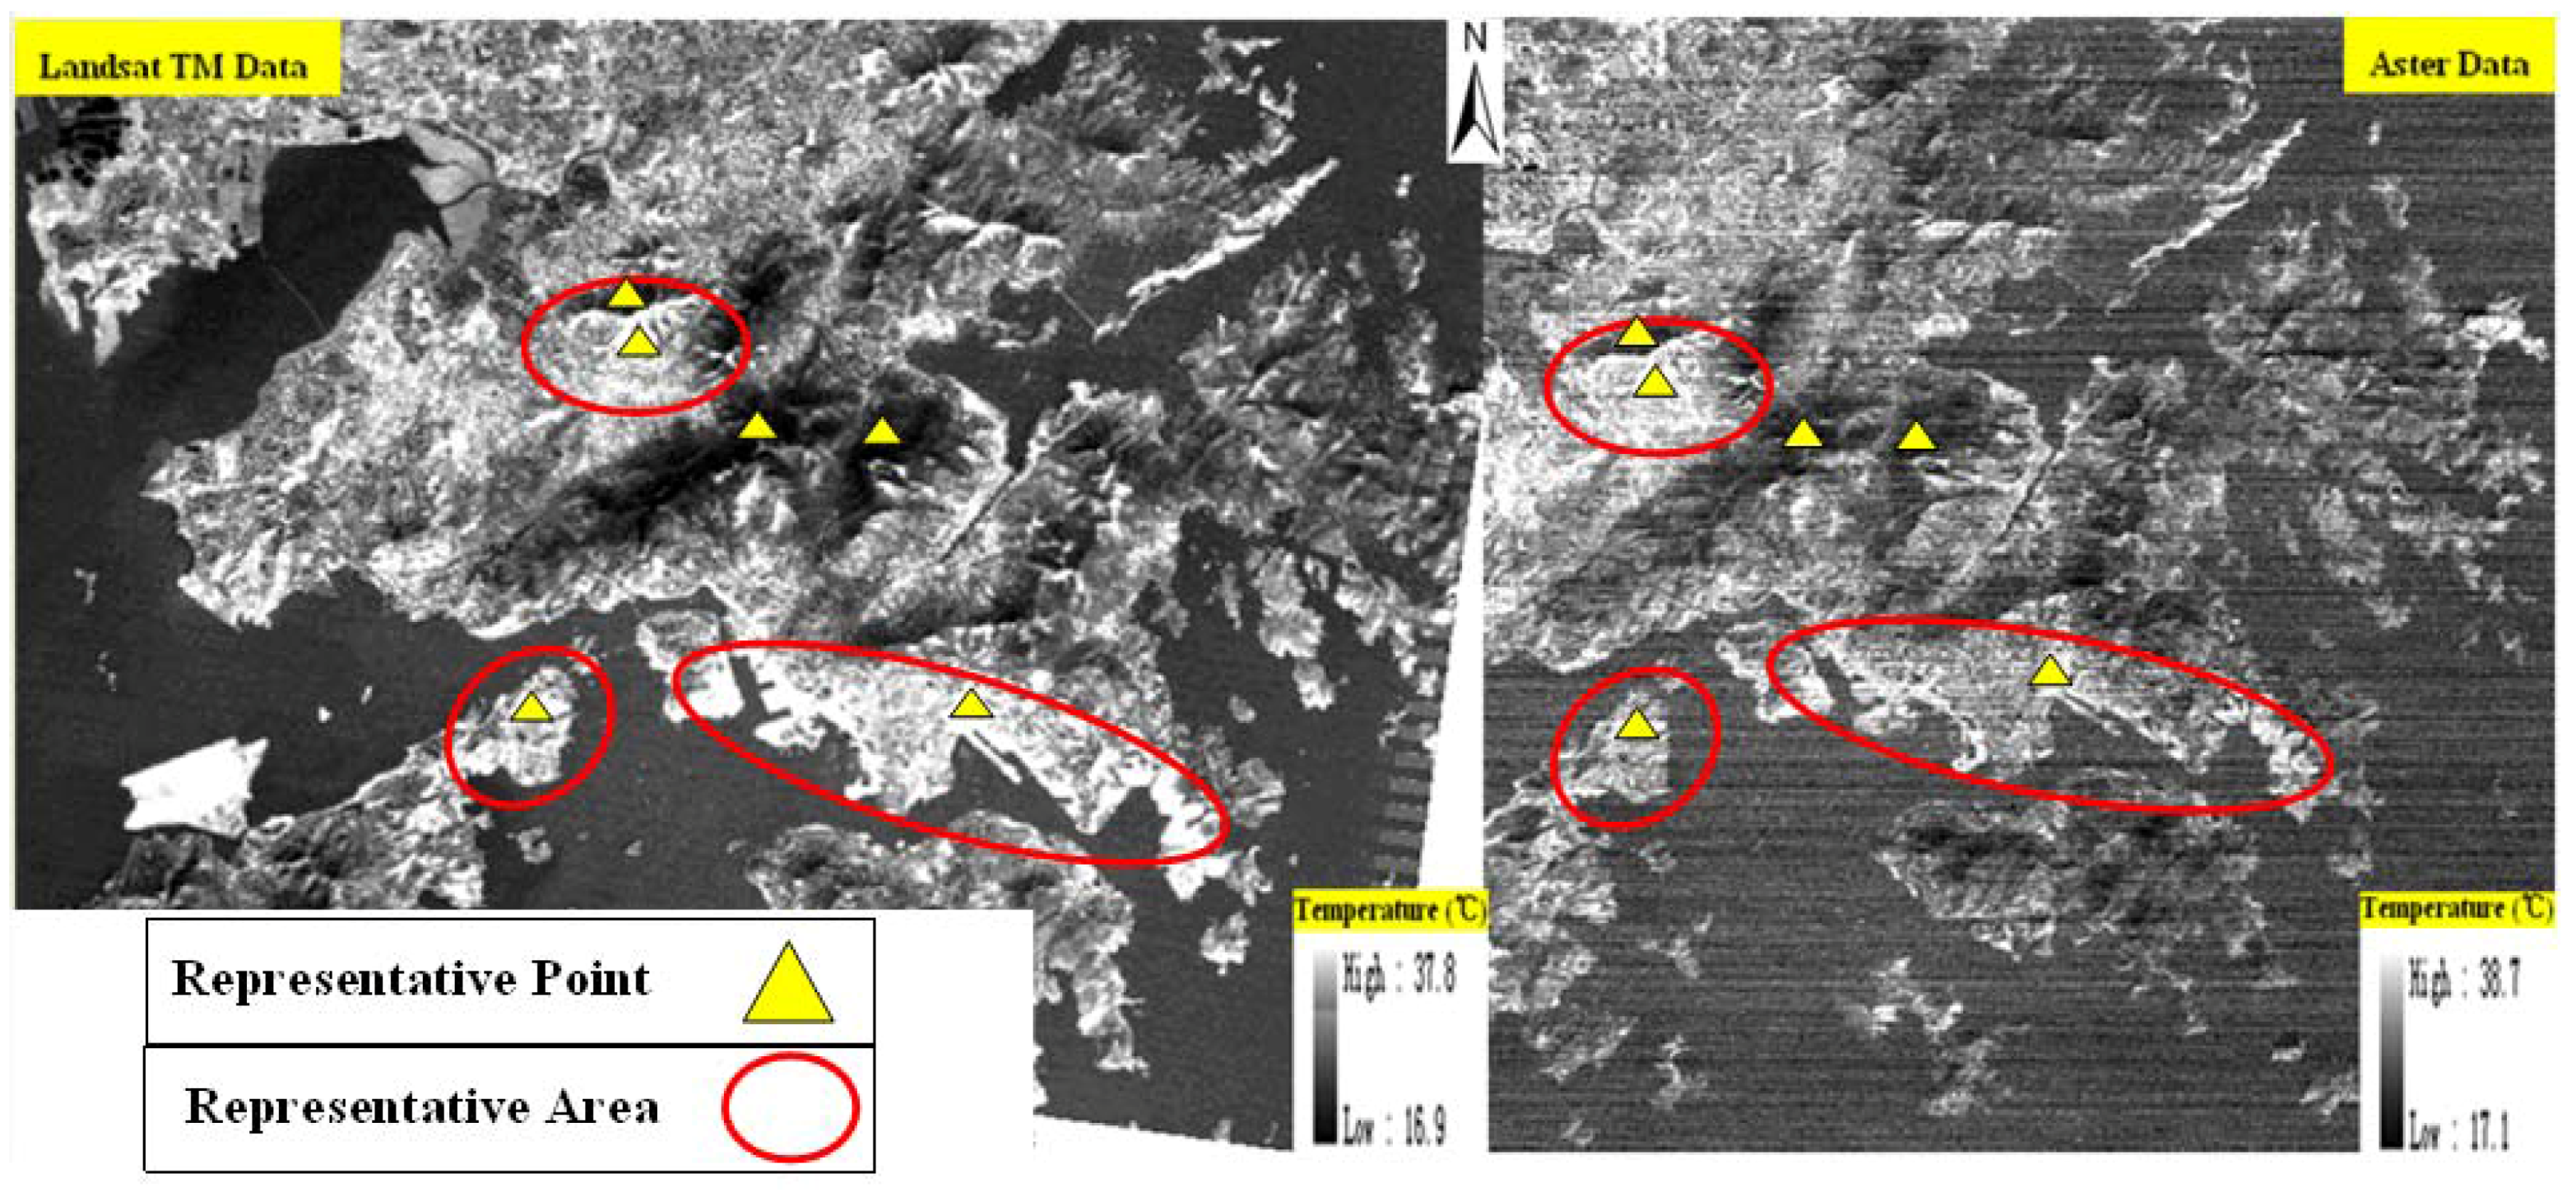
4.1. The Accuracy Verification of LST Retrieval

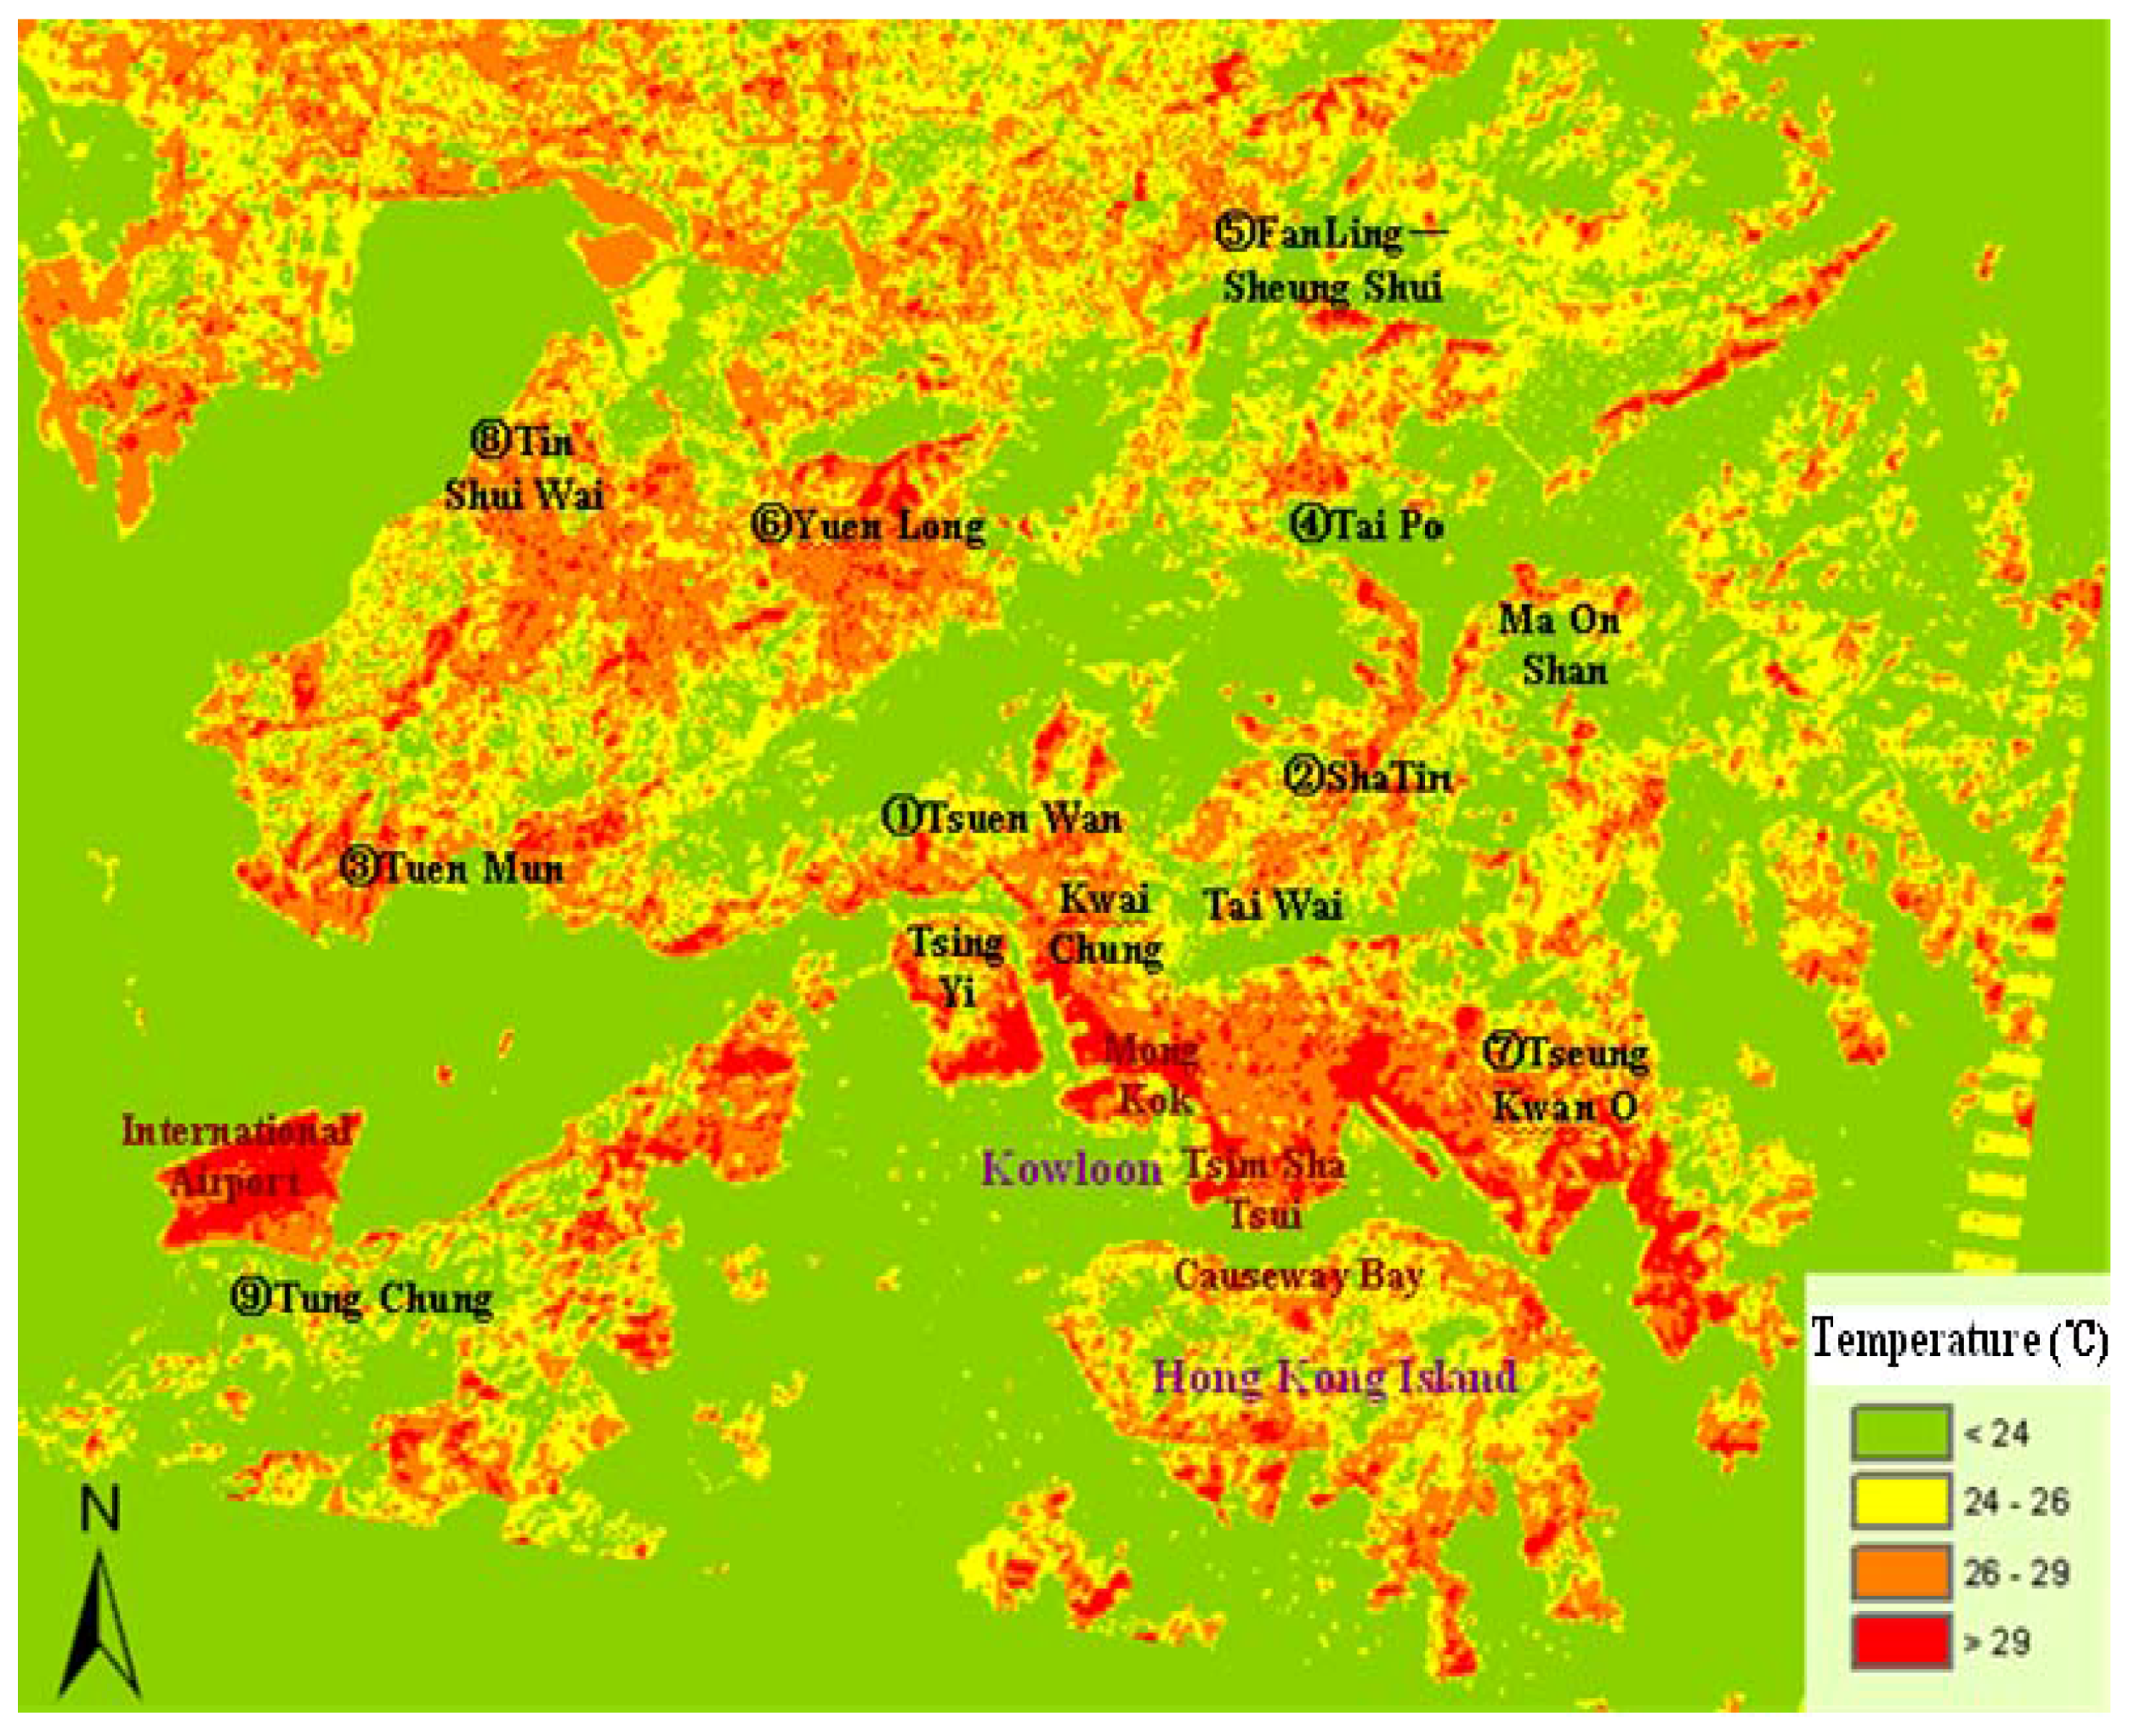
4.2. The Distribution of Urban Heat Islands in Hong Kong
4.3. The Correlation Analysis between Urban Heat Island, NDVI and NDBI
| LST | NDVI | NDBI | |
|---|---|---|---|
| LST | 1 | ||
| NDVI | −0.41 | 1 | |
| NDBI | 0.71 | −0.56 | 1 |
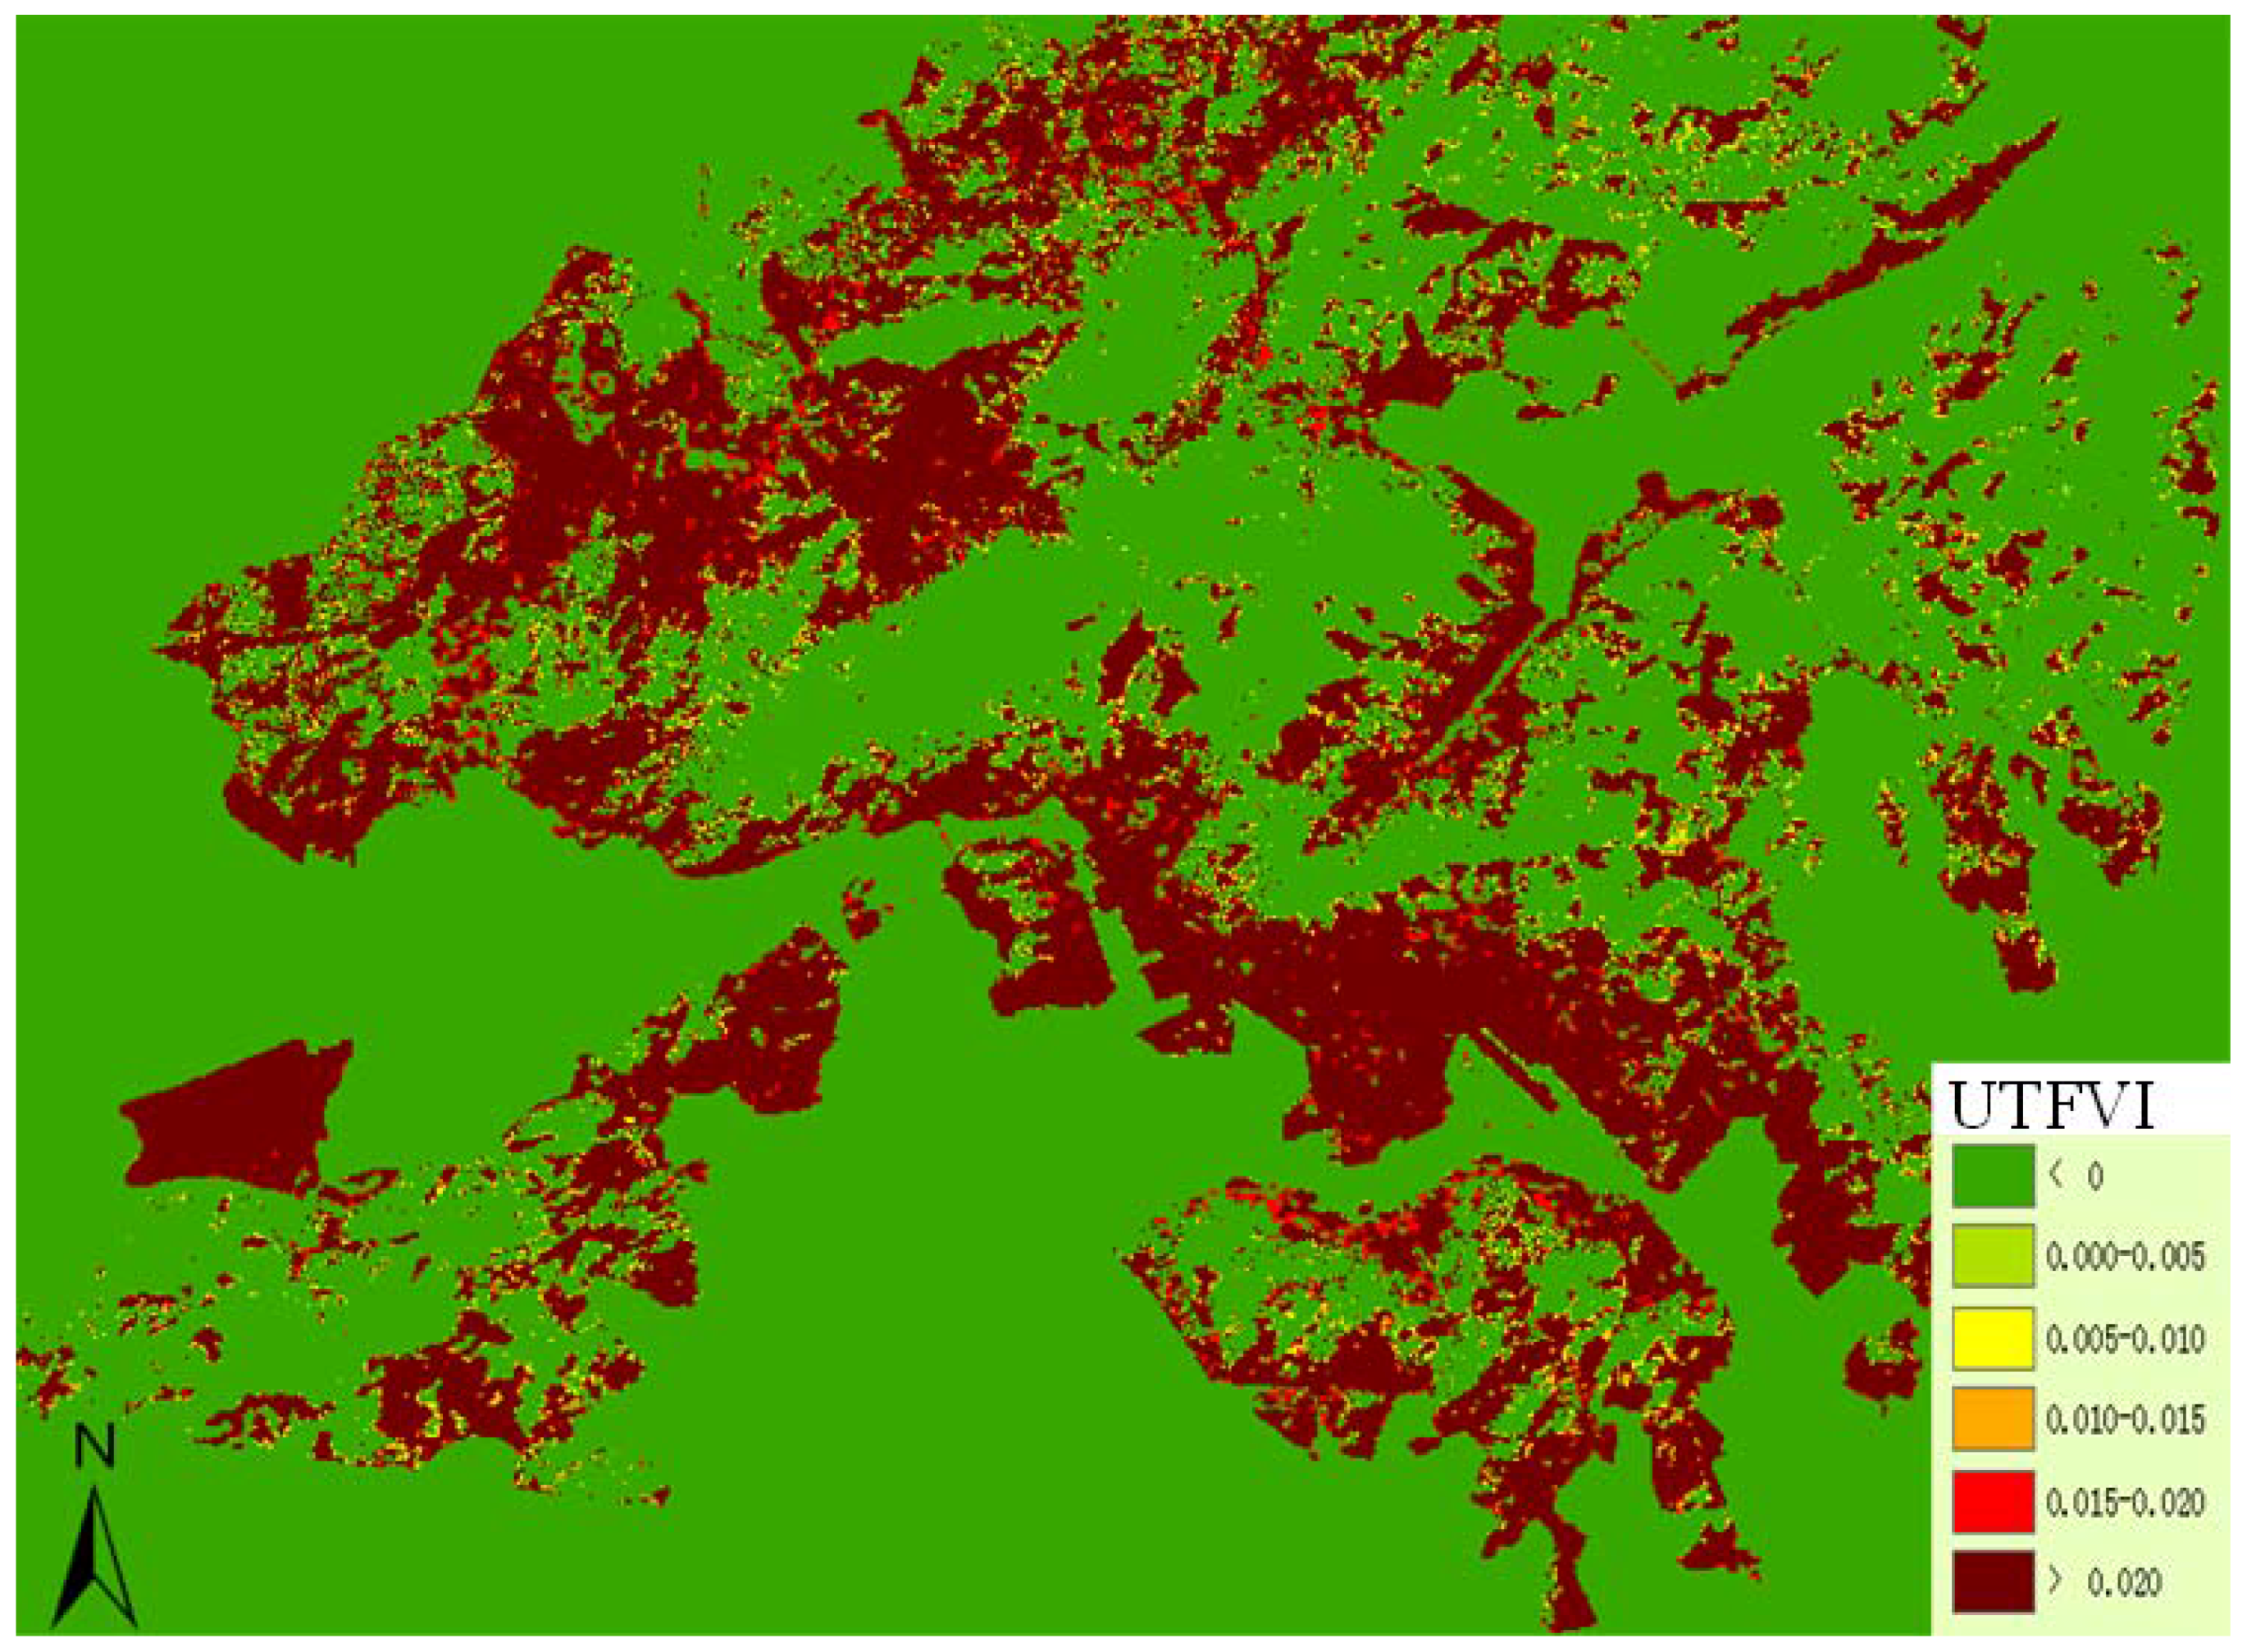
4.4. The Ecological Valuation of Hong Kong Urban Heat Island
| Urban thermal field variance index | Urban heat island phenomenon | Ecological evaluation index |
|---|---|---|
| <0 | None | Excellent |
| 0.000–0.005 | Weak | Good |
| 0.005–0.010 | Middle | Normal |
| 0.015–0.015 | Strong | Bad |
| 0.015–0.020 | Stronger | Worse |
| >0.020 | Strongest | Worst |

5. Conclusion
Acknowledgements
References
- Landsberg, H.E. The Urban Climate; Academic Press: New York, NY, USA, 1981; pp. 84–89. [Google Scholar]
- Streutker, D.R. A remote sensing study of the urban heat island of Houston, Texas. Int. J. Remote Sens. 2002, 23, 2595–2608. [Google Scholar] [CrossRef]
- Lu, Y.; Feng, P.; Shen, C.; Sun, J. Urban Heat Island in Summer of Nanjing Based on TM Data. In Proceedings of 2009 Joint Urban Remote Sensing Event, Shanghai, China, 20–22 May 2009; pp. 1–5.
- Howard, L. The Climate of London; London Harvey and Dorton: London, UK, 1833; Volume 2, pp. 1818–1820. [Google Scholar]
- Detwiller, J. Deep soil temperature trends and urban effects at Paris. J. Appl. Meteorol. 1970, 9, 178–180. [Google Scholar] [CrossRef]
- Fukui, E. The recent rise of temperature in Japan. In Japanese Progress in Climatology; Tokyo University of Education: Tokyo, Japan, 1970; pp. 46–65. [Google Scholar]
- Katsoulis, B.D.; Theoharatos, G.A. Indications of the urban heat island in Athens, Greece. J. Clim. Appl. Meteorol. 1985, 24, 1296–1302. [Google Scholar] [CrossRef]
- Wang, W.; Zheng, Z.; Karl, T.R. Urban Heat Islands in China. Geophys. Res. Lett. 1990, 17, 2377–2380. [Google Scholar] [CrossRef]
- Kim, H.H. Urban Heat Island. Int. J. Remote Sens. 1992, 13, 2319–2336. [Google Scholar] [CrossRef]
- Lee, H. An application of NOAA AVHRR thermal data to the study of urban heat Islands. Atmos. Environ. 1993, 27, 1–13. [Google Scholar] [CrossRef]
- Johnson, G.L.; Davis, J.M.; Karl, T.R.; McNab, A.L.; Gallo, K.P.; Tarpley, J.D.; Bloomfield, P. Estimating urban temperature bias using polar-orbiting satellite data. J. Appl. Meteorol. 1994, 33, 358–369. [Google Scholar] [CrossRef]
- Tso, C.P. A survey of urban heat island studies in two tropical cities. Atmos. Environ. 1996, 30, 507–519. [Google Scholar] [CrossRef]
- Camilloni, I.; Barros, V. On the urban heat island effect dependence on temperature trends. Clim. Change 1997, 37, 665–681. [Google Scholar] [CrossRef]
- Chen, Q.; Ren, J.; Li, Z.; Ni, C. Urban Heat Island Effect Research in Chengdu City Based on MODIS Data. In Proceedings of 3rd International Conference on Bioinformatics and Biomedical Engineering, ICBBE 2009, Beijing, China, 11–13 June 2009; pp. 1–5.
- Dousset, B.; Gourmelon, F. Satellite multi-sensor data analysis of urban surface temperatures and landcover. ISPRS J. Photogram. Remote Sens. 2003, 58, 43–54. [Google Scholar] [CrossRef]
- Sun, Q.; Tan, J.; Xu, Y. An ERDAS image processing method for retrieving LST and describing urban heat evolution: A case study in the Pearl River Delta Region in South China. Environ. Earth Sci. 2010, 59, 1047–1055. [Google Scholar] [CrossRef]
- Qin, Z.; Zhang, M.; Amon, K.; Pedro, B. Mono-window Algorithm for retrieving land surface temperature from Landsat TM 6 data. Acta Geogr. Sinica 2001, 56, 456–466. [Google Scholar]
- Sobrino, J.A.; Li, Z.L.; Stoll, M.P.; Becker, F. Multi-channel and multi-angle algorithms for estimating sea and land surface temperature with ATSR data. Int. J. Remote Sens. 1996, 17, 2089–2114. [Google Scholar] [CrossRef]
- Gillespie, A.R.; Rokugawa, S.; Matsunaga, T.; Cothern, J.S.; Hook, S.J.; Kahle, A.B. A temperature and emissivity separation algorithm for advanced spaceborne thermal emission and reflection radiometer (ASTER) images. IEEE Trans. Geosci. Remote Sens. 1998, 36, 1113–1126. [Google Scholar] [CrossRef]
- Jimenez-Munoz, J.C.; Sobrino, J.A. A generalized single-channel method for retrieving land surface temperature from remote sensing data. J. Geophys. Res. 2003, 108, 4688–4694. [Google Scholar] [CrossRef]
- Sobrino, J.A.; Jimenez-Munoz, J.C.; Paolini, L. Land surface temperature retrieval from LANDSAT TM 5. Remote Sens. Environ. 2004, 90, 434–440. [Google Scholar] [CrossRef]
- Van de Griend, A.A.; Owe, M. On the relationship between thermal emissivity and the normalized difference vegetation index for natural surfaces. Int. J. Remote Sens. 2003, 14, 1119–1131. [Google Scholar] [CrossRef]
- Zhang, J.; Wang, Y.; Li, Y. A C++ program for retrieving land surface temperature from the data of Landsat TM/ETM Band 6. Comput. Geosci. 2006, 32, 1796–1805. [Google Scholar] [CrossRef]
- Yang, J.; Qiu, J. The empirical expressions of the relation between precipitable water and ground water vapor pressure for some areas in China. Sci. Atmos. Sinica 1996, 20, 620–626. [Google Scholar]
- Li, J. Estimating land surface temperature from Landsat-5 TM. Remote Sens. Technol. Appl. 2006, 21, 322–326. [Google Scholar]
- Mao, K.; Tang, H.; Chen, Z.; Qiu, Y.; Qin, Z.; Li, M. A split-window algorithm for retrieving land-surface temperature from ASTER data. Remote Sens. Inf. 2006, 5, 7–11. [Google Scholar]
- Mao, K.; Qin, Z.; Xu, B. Method for land surface temperature from retrieval from ASTER data. J. Inst. Surv. Mapp. 2005, 22, 40–42. [Google Scholar]
- Zhang, Y. Land surface temperature retrieval from CBERS-02 IRMSS thermal infrared data and its applications in quantitative analysis of urban heat island effect. J. Remote Sens. 2006, 10, 789–797. [Google Scholar]
© 2011 by the authors; licensee MDPI, Basel, Switzerland. This article is an open access article distributed under the terms and conditions of the Creative Commons Attribution license (http://creativecommons.org/licenses/by/3.0/).
Share and Cite
Liu, L.; Zhang, Y. Urban Heat Island Analysis Using the Landsat TM Data and ASTER Data: A Case Study in Hong Kong. Remote Sens. 2011, 3, 1535-1552. https://doi.org/10.3390/rs3071535
Liu L, Zhang Y. Urban Heat Island Analysis Using the Landsat TM Data and ASTER Data: A Case Study in Hong Kong. Remote Sensing. 2011; 3(7):1535-1552. https://doi.org/10.3390/rs3071535
Chicago/Turabian StyleLiu, Lin, and Yuanzhi Zhang. 2011. "Urban Heat Island Analysis Using the Landsat TM Data and ASTER Data: A Case Study in Hong Kong" Remote Sensing 3, no. 7: 1535-1552. https://doi.org/10.3390/rs3071535
APA StyleLiu, L., & Zhang, Y. (2011). Urban Heat Island Analysis Using the Landsat TM Data and ASTER Data: A Case Study in Hong Kong. Remote Sensing, 3(7), 1535-1552. https://doi.org/10.3390/rs3071535