Article

Remote Sensing-Based Characterization of Settlement Structures for Assessing Local Potential of District Heat

1
German Remote Sensing Data Center, German Aerospace Center (DLR), 82234 Weßling-Oberpfaffenhofen, Germany
2
Department of Remote Sensing, Institute of Geography, Julius-Maximilians University Würzburg, 97074 Würzburg, Germany
3
Institute of Technical Thermodynamics, German Aerospace Center (DLR), 70569 Stuttgart, Germany
4
Z_GIS Centre for Geoinformatics and Department for Geography and Geology, University of Salzburg, Hellbrunner Street 34, A-5020 Salzburg, Austria
*
Author to whom correspondence should be addressed.
Remote Sens. 2011, 3(7), 1447-1471; https://doi.org/10.3390/rs3071447
Submission received: 12 May 2011 / Revised: 28 June 2011 / Accepted: 30 June 2011 / Published: 8 July 2011
(This article belongs to the Special Issue Urban Remote Sensing)

Abstract

:
In Europe, heating of houses and commercial areas is one of the major contributors to greenhouse gas emissions. When considering the drastic impact of an increasing emission of greenhouse gases as well as the finiteness of fossil resources, the usage of efficient and renewable energy generation technologies has to be increased. In this context, small-scale heating networks are an important technical component, which enable the efficient and sustainable usage of various heat generation technologies. This paper investigates how the potential of district heating for different settlement structures can be assessed. In particular, we analyze in which way remote sensing and GIS data can assist the planning of optimized heat allocation systems. In order to identify the best suited locations, a spatial model is defined to assess the potential for small district heating networks. Within the spatial model, the local heat demand and the economic costs of the necessary heat allocation infrastructure are compared. Therefore, a first and major step is the detailed characterization of the settlement structure by means of remote sensing data. The method is developed on the basis of a test area in the town of Oberhaching in the South of Germany. The results are validated through detailed in situ data sets and demonstrate that the model facilitates both the calculation of the required input parameters and an accurate assessment of the district heating potential. The described method can be transferred to other investigation areas with a larger spatial extent. The study underlines the range of applications for remote sensing-based analyses with respect to energy-related planning issues.

Graphical Abstract

1. Introduction

The heat supply for residential houses as well as for buildings of the public and private service sector is often based on the use of fossil energy sources. These are still burned in old boilers with relatively low efficiency and high emissions [1]. In contrast, renewable energy resources and efficient energy generation technologies like cogeneration consider the finiteness of fossil resources as well as the drastic impact of increasing greenhouse gas emission. Therefore, a sustainable adjustment of energy systems is a high priority for national and international political agendas. In a study for the German Ministry for the Environment, Nature Conservation and Nuclear Safety (BMU), a shift towards a more sustainable energy system for Germany is proposed [2]. By the year 2050, 50% of the heat supply should be provided by renewable energy resources. In this scenario, 60% of the renewable energy-based heat consumption is made available by (district and small-scale) heating networks. For that reason, an increase of pipeline-bound heat allocation systems is mandatory. To accommodate the outlined scenarios for regional planning and the search for best suited locations for district heating networks, spatially detailed analyses are needed to evaluate and identify feasible settlement structures. This information will also be useful when comparing settlement structures that already have an efficient district heating system with undeveloped areas to identify possible implementation scenarios and to assess the economic usage potential in general.
Therefore, our goal is to show how physical-structural potentials for district heating can be assessed by means of a transferable and robust approach that allows for area-wide analyses with a high spatial and thematic detail. We utilize very high and medium resolution remote sensing data including a digital surface model (DSM), multispectral IKONOS imagery, Landsat and TerraSAR-X data, and ancillary street vectors from the OpenStreetMap (OSM) project. The data is used to characterize settlement structures and to derive energy-relevant infrastructural parameters. The information is combined within a spatial model to quantitatively assess potentials for district heating.

1.1. State of the Art

Remote sensing applications for urban areas are manifold. Due to limited space we refer to [3,4,5] for an overview of the range of sensors and methods deployed. Interestingly, remote sensing energy applications are relatively rare. The majority of energy-related remote sensing applications are devoted to medium to small-scale applications for bioenergy, solar radiation and wind energy potential. Since biomass can supplement coal or in some cases gas in conventional power plants, regional and national forest inventories have increasingly been recognized as powerful and appropriate data for calculating forest biomass on a large scale. Remotely sensed data have become the primary source for biomass estimation. A literature review for remote sensing based biomass estimation is, e.g., provided by [6] and values of remote sensing platforms to buyers and sellers of energy is shown by [7].
For solar energy applications two foci may be identified: (a) wide-ranging overview estimations of solar radiation and solar energy potentials; and (b) spatially detailed applications, for example aiming at single houses and potentials for photovoltaic installations. Page et al. [8] published a European Solar Radiation Atlas which is widely used by architects, engineers, meteorologists, agronomists, and local authorities. This product is just one example of the first category of general information provided by remote sensing data.
Urban applications mostly deal with planning of energy-efficient buildings and cities, but in addition to this intelligent operation of their energy supply systems will become of primary importance in the future. It is clear that both planning and operation strongly depend on the availability of accurate information on the governing boundary conditions. The increased use of solar energy technologies leads to more and more applications modeling individual rooftop potentials. The concept is not new (see [9]) but the numbers of methods and applications published has sharply increased over the last few years.
Less commonly found in urban areas are remote sensing based wind energy applications. Several authors have classified wind fields at different scales (e.g., [10]) and wind speed maps are produced for many regions of the world, both for onshore and offshore usage (e.g., [11]).
The methods presented in this paper are based on the premise that data may be combined from two disparate data streams: remote sensing and GIS data. In fact, in a spatially enabled society [12] it is unlikely that any project needs to rely exclusively on remote sensing data. Geographic information such as settlements and/or socio-economic data, boundaries for administrative areas, digital terrain models, street networks, and urban extents can all be found. Today, all of this information is organized with redundancy in spatial data infrastructure where remotely sensed data is often the source of some of these data sets (e.g., settlements identified by night-time imagery). We may conclude that the integration of remote sensing and GIS technologies has been applied widely and is recognized as an effective tool in urban analysis and modeling ([13,14]). Today, GIS systems can sufficiently display and query raster images, while remote sensing digital image processing systems offer the similar capability for handling vector data. While some good examples lead the way (see e.g., [15,16]) we may therefore critically ask why energy applications are not so widespread.
For Germany, several interdisciplinary research concepts and methodological approaches emerged to assess the potential of district heating systems or their crucial parameters and aspects. The relation of settlement structures and heat distribution systems was already described by [17,18]. Winkens [19] adapts this relation and characterizes several settlement structures with affiliated specific cost of the necessary heat infrastructure. Different settlement structure types are identified by manual cartographic methods. For these structure types, idealized specific values for the present and future heat demand and costs for the heat allocation are appointed by building-to-building estimations, then subdivided according to different power generation systems.
In the context of a study about strategies and technologies of pluralistic district heating systems in Germany [20], several approaches are presented to gain spatially disaggregated statements about perspectives and scenarios of pipeline-bound heat supply systems. Blesl et al. [21] characterize several built-up structures to define exemplary supply areas. Aerial images are interpreted manually and processed using a GIS. Eickmeier and Schulz [22] use regional statistics for selected model-cities and communities with more than 20,000 inhabitants to show perspectives of heating networks in Germany on a regional scale. For a more detailed assessment of the district heat demand [23] reconstructed buildings by combining airborne laser scanning data with building geometries of the German Official Land Registry (ALK), followed by a classification of the building inventory using a building typology with physical building characteristics (see also [24,25]). Based on digital topographic maps (scale 1:25,000) and authoritative digital maps, Meinel et al. [26,27] automatically extract building footprints and delineate settlement structures by means of digital image processing techniques and GIS functionalities. Additionally, parameters on the settlement structure such as apartment numbers, etc., are calculated from a spatial disaggregation approach using statistical data at municipality level. Comparing maps of the building inventory from different periods of time enables the development of the built environment to be analyzed and therefore derive periods of construction on an individual building level [28].
Fischedick et al. and Schillings et al. [29,30] combine land use information extracted from Landsat data, DSM’s, topographic maps and additional information about transport infrastructure (Land25, ©Infoterra 2001) with commercial geo data (Local®Haus, Infas) in order to regionalize the local heat demand, to calculate affiliated infrastructure costs and to assess endogenous potentials of renewable energy resources. These analyses are performed on municipality level for Germany with the limitation that valid statements can only be made for more aggregated administrative units, e.g., provinces or counties.

1.2. Research Questions

As briefly described, the cited studies are primarily embedded in an interdisciplinary research environment and consider several aspects of the evaluation of urban structures for district heating systems at different spatial scales and based on diverse methodological approaches. Therefore, a theoretical spatial model must be defined with justification from the underlying implicit and explicit assumptions and preconditions. In this context, it is has to be evaluated how comprehensive the range of applications and significance of remote sensing in this energy-related research environment is in principle. Hence a first research question is:
(1) What can remote sensing-based analysis contribute to the assessment of local potentials of district heat?
The focus of this paper is to show the range of capabilities of remote sensing to quantify the relevant parameters. In this context the central challenge is to evaluate the potential of very high (such as Ikonos) and medium geometric resolution (such as Landsat) remote sensing data to the suitability for an implementation of district heating systems on local building block level. Therefore, the second research question is:
(2) Is it possible to identify local potentials for district heat based on remote sensing data area-wide which is reliable?
Especially for planning questions, it is crucial to allocate resources efficiently. This leads to the third research question:
(3) Is it possible to categorize and prioritize appropriate settlement structures for the implementation of district heating systems?
All these questions should be discussed under the framing conditions that the method to be developed should be applicable for area-wide analysis in a standardized way, independent of administrative boundaries and proprietary data.

2. Characteristics of Small District Heating Systems, Study Area and Data Base

District heating systems represent the technical infrastructure for the pipeline-bound allocation of thermal energy between a heat source and the consumers. The thermal energy is produced in a heat station directly or is released as a by-product during the generation of electric power (usage of waste heat). Generally, water or water steam is used as a transport medium to conduct the heat in insulated pipes to the buildings. Small-scale heating networks are typically constructed as closed circuits to conduct the heated transport medium to the consumers, revert it cooled, and reheat it again. The main network is normally laid along existing streets with individual house connections to the buildings. Within the buildings the heat pipe is connected by a consumer station to the water pipes of the internal distribution system in order to supply the building with heat and hot water [31].
District heating systems have several advantages that make them almost indispensable for a sustainable heat supply. The technical and economical advantages are primarily due to the aggregation of multiple consumers to one big heat consumer. On this basis, several energy generation technologies like cogeneration as well as renewable energies can be used efficiently. This is especially true for large cogeneration stations that are more efficient and economic than small stations, for large solar systems that are by far cheaper than small installations, as well as for geothermal stations that provide a huge amount of heat. For the usage of biomass district heating systems enable efficient combustion of problematic fuels like straw in large systems without extensive transformation processes ([30,32]).

2.1. Study Area and Data Base

The test site comprises an area of about 12 km2 of the municipal area of Oberhaching which is located in the South of Munich, Germany. For a detailed characterization of build-up structures and urban environments with respect to energy-relevant parameters a combination of very high and medium resolution remote sensing data is required. Built-up structures in general are characterized by a high variability of objects and their surface. To reconstruct the urban environment, to derive physical parameters and to describe structural characteristics a combination of multispectral optical Ikonos imagery, and a DSM based on stereoscopic airborne remote sensing images (3K) are utilized. Ancillary street vectors from the OSM project [33] are used to define building blocks, to enhance the land cover classification and to calculate infrastructural parameters such as network lengths. In Germany, the OSM data is often more detailed than commercial products, although the worldwide coverage and the level of detail are variable [34]. For spatiotemporal analyses of the settlement development we classify three Landsat images from 1973, 1989, and 2000 and a TerraSAR-X strip map image from 2009. Based on the classification results the periods of building construction are estimated.
Besides the remote sensing and ancillary geo-data, several ground truth data and reference information are also included to validate the results. The ALK includes building geometries based on high accuracy terrestrial measurements. Additionally, legal boundaries are included, for example small multi-family houses are represented by separated polygons [24]. The German Official Topographic Cartographic Information System (ATKIS) includes thematic information about built-up areas (ATKIS code 2100), subdivided into residential areas (2111), industry and trade (2112), mixed use (2113) and areas with special functions (2114) at building block level [35]. For the validation of a structural type classification the class codes 2112 and 2114 are combined to non-residential because an energy-relevant distinction of the building inventory is made between residential, mixed, and non-residential buildings. Detailed in situ field survey data concerning the annual heat demand of the buildings located in the test site are provided by an engineering company [36]. The buildings’ heat demand is estimated by a building-to-building evaluation of the heated building area, architectural components, and location of the building within the building structure. Additionally, network lengths are calculated that consider all buildings within the test site. The generated network graph also considers individual solutions for respective buildings. Table 1 gives an overview on the acquired remote sensing data, ancillary geo-data, and in situ information that cover the test site.
Table 1. Overview of the used remote sensing data, ancillary geo data, and in situ information.
Dataset/ SensorCharacteristicsGeometric Resolution/AccuracyAcquisition DateReference
3K-camera remote sensing system3 non-metric stereoscopic cameras; imagery used for the derivation of a digital surface model; airborneGeometric resolution 0.5 meter; vertical resolution 1 meter2007[37,38,39]
IkonosMultispectral optical imagery (4 bands); space borne1 meter2008[40,41]
OSMStreet vectorsVariable, cm–meter2010[33,34]
Landsat MSSMultispectral optical imagery (7 bands); space borne59 meter1973[42]
Landsat TMMultispectral optical imagery (7 bands); space borne30 meter1989[43]
Landsat ETM+Multispectral optical imagery (7 bands); space borne30 meter2000[44]
TerraSAR-XSAR data; Strip Map Mode; space borne3 meter2009[45]
ALKGerman official land registry–automatic real estate map; terrestrial measurementVariable, cm–meter2010[46,47]
ATKISGerman Official Topographic Cartographic Information SystemVariable, meter2006[35]
PlanGManual terrestrial evaluation of the buildings’ heat demand and estimation of heat network lengthsBuilding-by-building estimation2010[36]

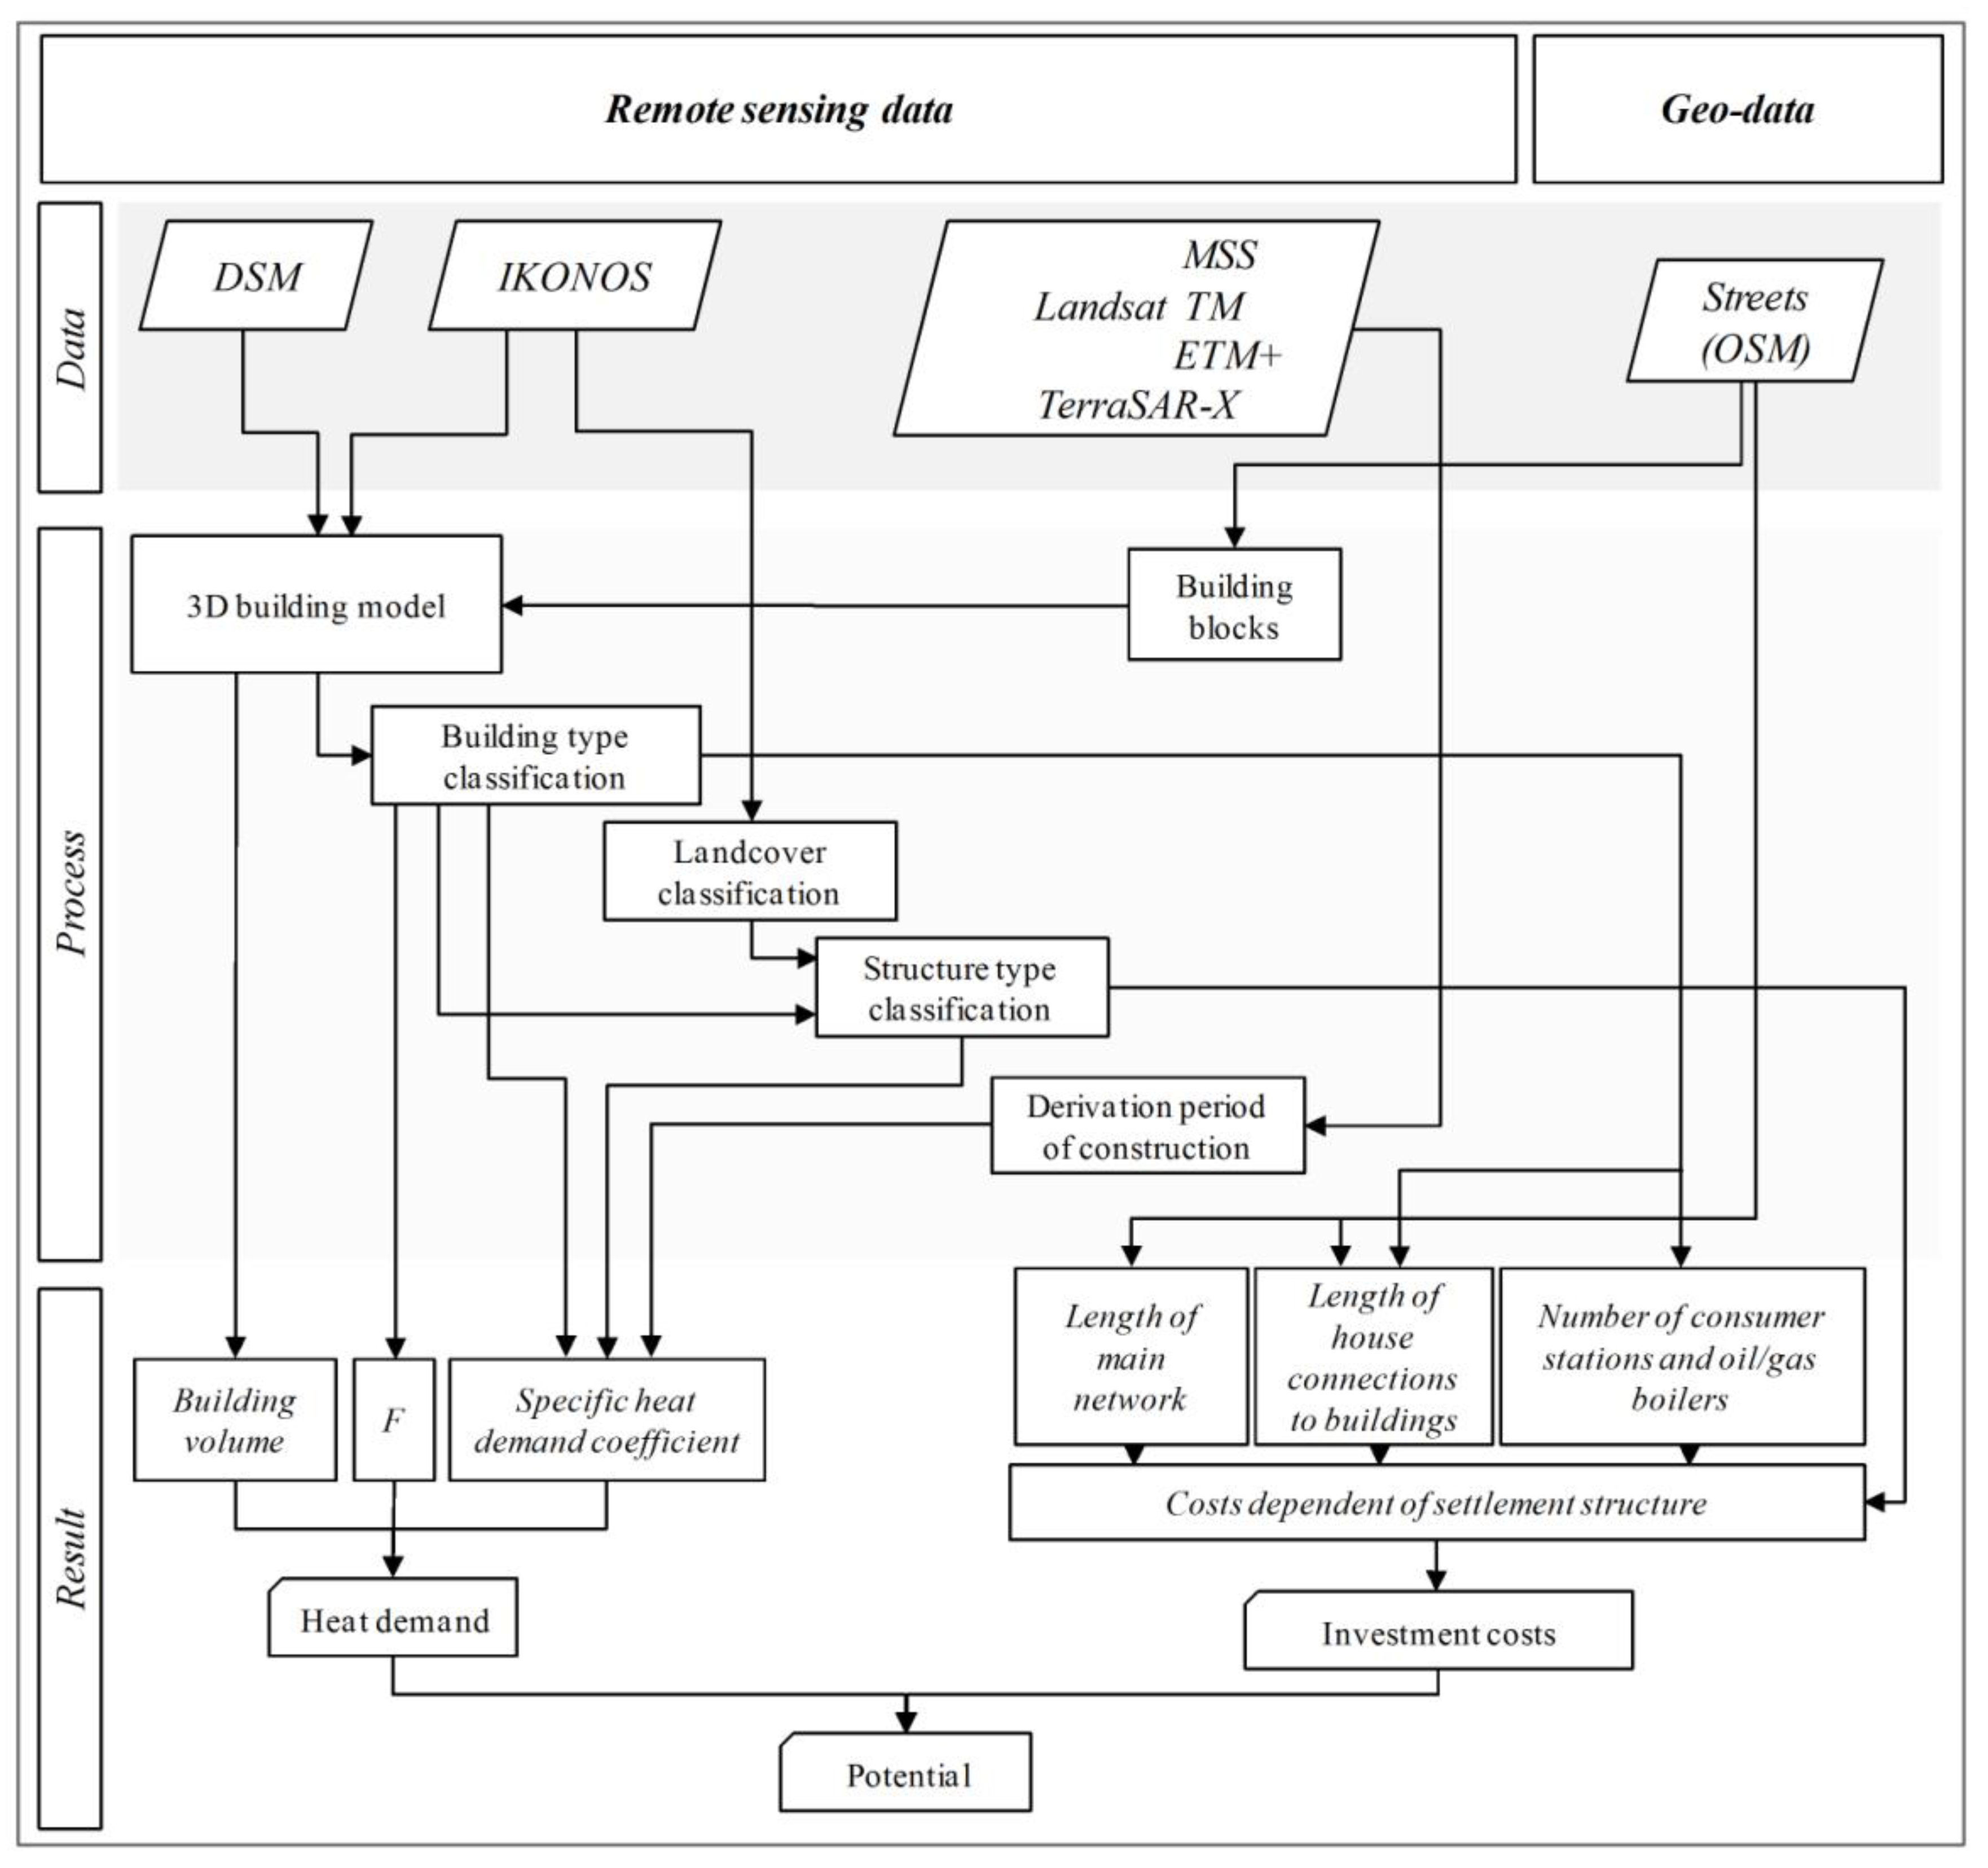
3. Theoretical Model for the Assessment of Small District Heating Systems

To evaluate settlement areas with respect to district heating potentials, a detailed characterization of the building inventory in terms of the building types and structure as well as the spatial distribution of buildings is necessary [21]. Therefore, the evaluation of settlement structures for heating systems is based on several physical-structural components of built-up structures. In this context, the possibility to use pipeline-bound heating supply systems is primarily dependent on the amount of the local heat demand due to high monetary investments for the necessary heat infrastructure.
The main parameter for the assessment is the annual heat demand of the buildings. The heat demand correlates with the heated building volume and a specific heat demand coefficient that depends on the level of insulation. The heat demand coefficient represents an idealized value, that can be described by the combination of building type, usage and age of a building ([24,29,48]).
Additionally, the economic costs of the necessary heat allocation infrastructure are estimated: costs for the heating network, house connections to the buildings, and consumer stations for every building. To quantify only the additional costs for a district heating system, costs for a conventional heat supply (oil or gas boilers) are subtracted. With this information a specific value (P) can be determined, which characterizes the local conditions for district heating on building block level. By dividing the annual heat demand of the buildings by the required infrastructure investment costs, the achievable kWh/year per invested monetary unit [€] can be quantified:
P = i = 1 n V i F i q i C N E T + i = 1 n C C O N i + C C S i + 1 2 C C H S i
where n represents the number of buildings per block, V [m3] the building volume, F a constant value which is dependent on the building type to reduce the whole building volume V to the heated volume, and q [kWh/(m3 year)] a specific heat demand coefficient which is determined by building type, usage and age of a building (see Section 5.1). The infrastructure costs for the small-scale heating network (CNET, [€]) are calculated on block level, while the house connections to the buildings (CCON, [€]), consumer stations (CCS, [€]), and cost of a conventional heat supply (CCHS, [€]) are calculated separately for each building. As the analyses are primarily performed on building structures that already have heat supply, the residual values of the existing boilers are considered. This is based on the assumption that the money that must be invested for a new conventional heat supply can be substituted in order to install the infrastructure for a district heating network. For the residual values an estimated value of 0.5 is assumed. This value represents an averaged value for the whole building inventory and implies that the existing oil and gas boilers have reached half of their technical life expectancy.
For a more detailed economic assessment of the infrastructural components listed in Equation (1), different technical life expectancies of the respective components could be considered. However, as we primarily aim for a characterization of settlement structures such a differentiation is not essential. Furthermore, we do not focus on specific heat generation technologies therefore the evaluation is based on the physical structural components of individual settlement structures without considering the location and cost of virtual heating stations. This is significant because biogas plants are more likely to be installed outside of settlement areas, whereas cogeneration stations are already used to revitalize inner-city fallow areas [49].

4. Characterization of Settlement Structures by Means of Remote Sensing and Geo-Data

For the calculation of the model parameters several methodological steps based on different remote sensing and geo-data are performed. Figure 1 gives an overview of the data used in this study, the processing steps and the combination of the derived information for defining the district heating potential. The main processing steps are subsequently described in more detail.
Figure 1. Data base and processes for the calculation of district heating potentials.
Remotesensing 03 01447 g001

4.1. Derivation of 3D City Model and Physical Parameters of the Urban Environment

The latest generation of optical satellites—e.g., Ikonos—provide data with a very high geometric resolution that makes it possible to identify even small urban structures such as single buildings or streets. Nonetheless, monoscopic spaceborne satellite imagery is mostly limited to 2-D analyses. Albeit methods exist that estimate the building heights through the lengths of their shadows [50], these methods are restricted by various limitations such as building density, sun angle and sun azimuth. DSM’s provide detailed information about the third dimension of a study area.
The following workflow describes an approach for extracting sufficient information about urban objects. While highly detailed land cover information can be extracted by optical satellite imagery, further differentiation of the urban morphology is achieved by utilizing 3-D information. An object-based image segmentation and classification approach is developed to retrieve such information on a very high level of detail based on very high geometric resolution optical satellite imagery and a DSM. This approach can be transferred to analyze area-wide large regions. The methodology is implemented as a modular solution, which allows analysis of multisensoral data to a proper representation of the urban fabric in terms of a 3-D city model. In general, an object-based framework is applied to the optical satellite imagery and the DSM for a detailed description of the urban landscape. The method for the extraction of the relevant information in terms of land use/land cover (LU/LC) classification is presented in detail by [51]. Data pre-processing was done applying geometric and atmospheric correction to the satellite imagery followed by orthorectification using digital aerial orthoimages as a spatial reference for ground control point measurements.
The first image analysis step focuses on the extraction of building footprints by means of image segmentation and object-based image classification of the DSM. To achieve this goal, the geometries of individual building blocks are derived from the OSM street geometries. For each of the building blocks, segmentation is applied to generate ‘real world’ image objects representing individual buildings. In this manner, the derived building blocks are used to calculate small-scale statistical values on the height information of the DSM to individually adjust the segmentation parameters. Subsequently, image objects which represent buildings are identified based on shape, neighborhood and height criteria. For each of the buildings the relative height information is retrieved as a relationship between the absolute, average height of the building object and the surrounding area.
The result of the processing steps is a ‘building mask’ representing individual building objects including their heights. This building mask is integrated into the second analysis step where the optical data are first segmented into image objects by means of an image segmentation optimization workflow developed by [52] and then classified based on a method presented by [53]. The result of the combined analysis of spectral information and height information is a detailed LU/LC classification of the covered area of Oberhaching. Additionally, ancillary data are integrated into the workflow in terms of imported information about ‘streets’ from OSM for enhancing the classification accuracy. The derived LU/LC classes are ‘buildings’, ‘bare soil’, ‘grassland/meadow’, ‘streets’, ‘other impervious surfaces’, ‘trees/shrubs’, and ‘surface water’.
Subsequently, the LU/LC classes are utilized to determine characteristic structural parameters on block level namely ‘percentage of imperviousness’ (ratio of respective areas of the relevant thematic LU/LC classes ‘buildings’, ‘streets’, and ‘other impervious surfaces’ and affiliated block area), ‘building density’ (ratio of respective areas of building footprints and affiliated block area) and ‘floor-space index’ (product of estimated floor number [51] and area of respective building footprint divided by area of affiliated block area), which are integrated in the structure type classification in the next section.

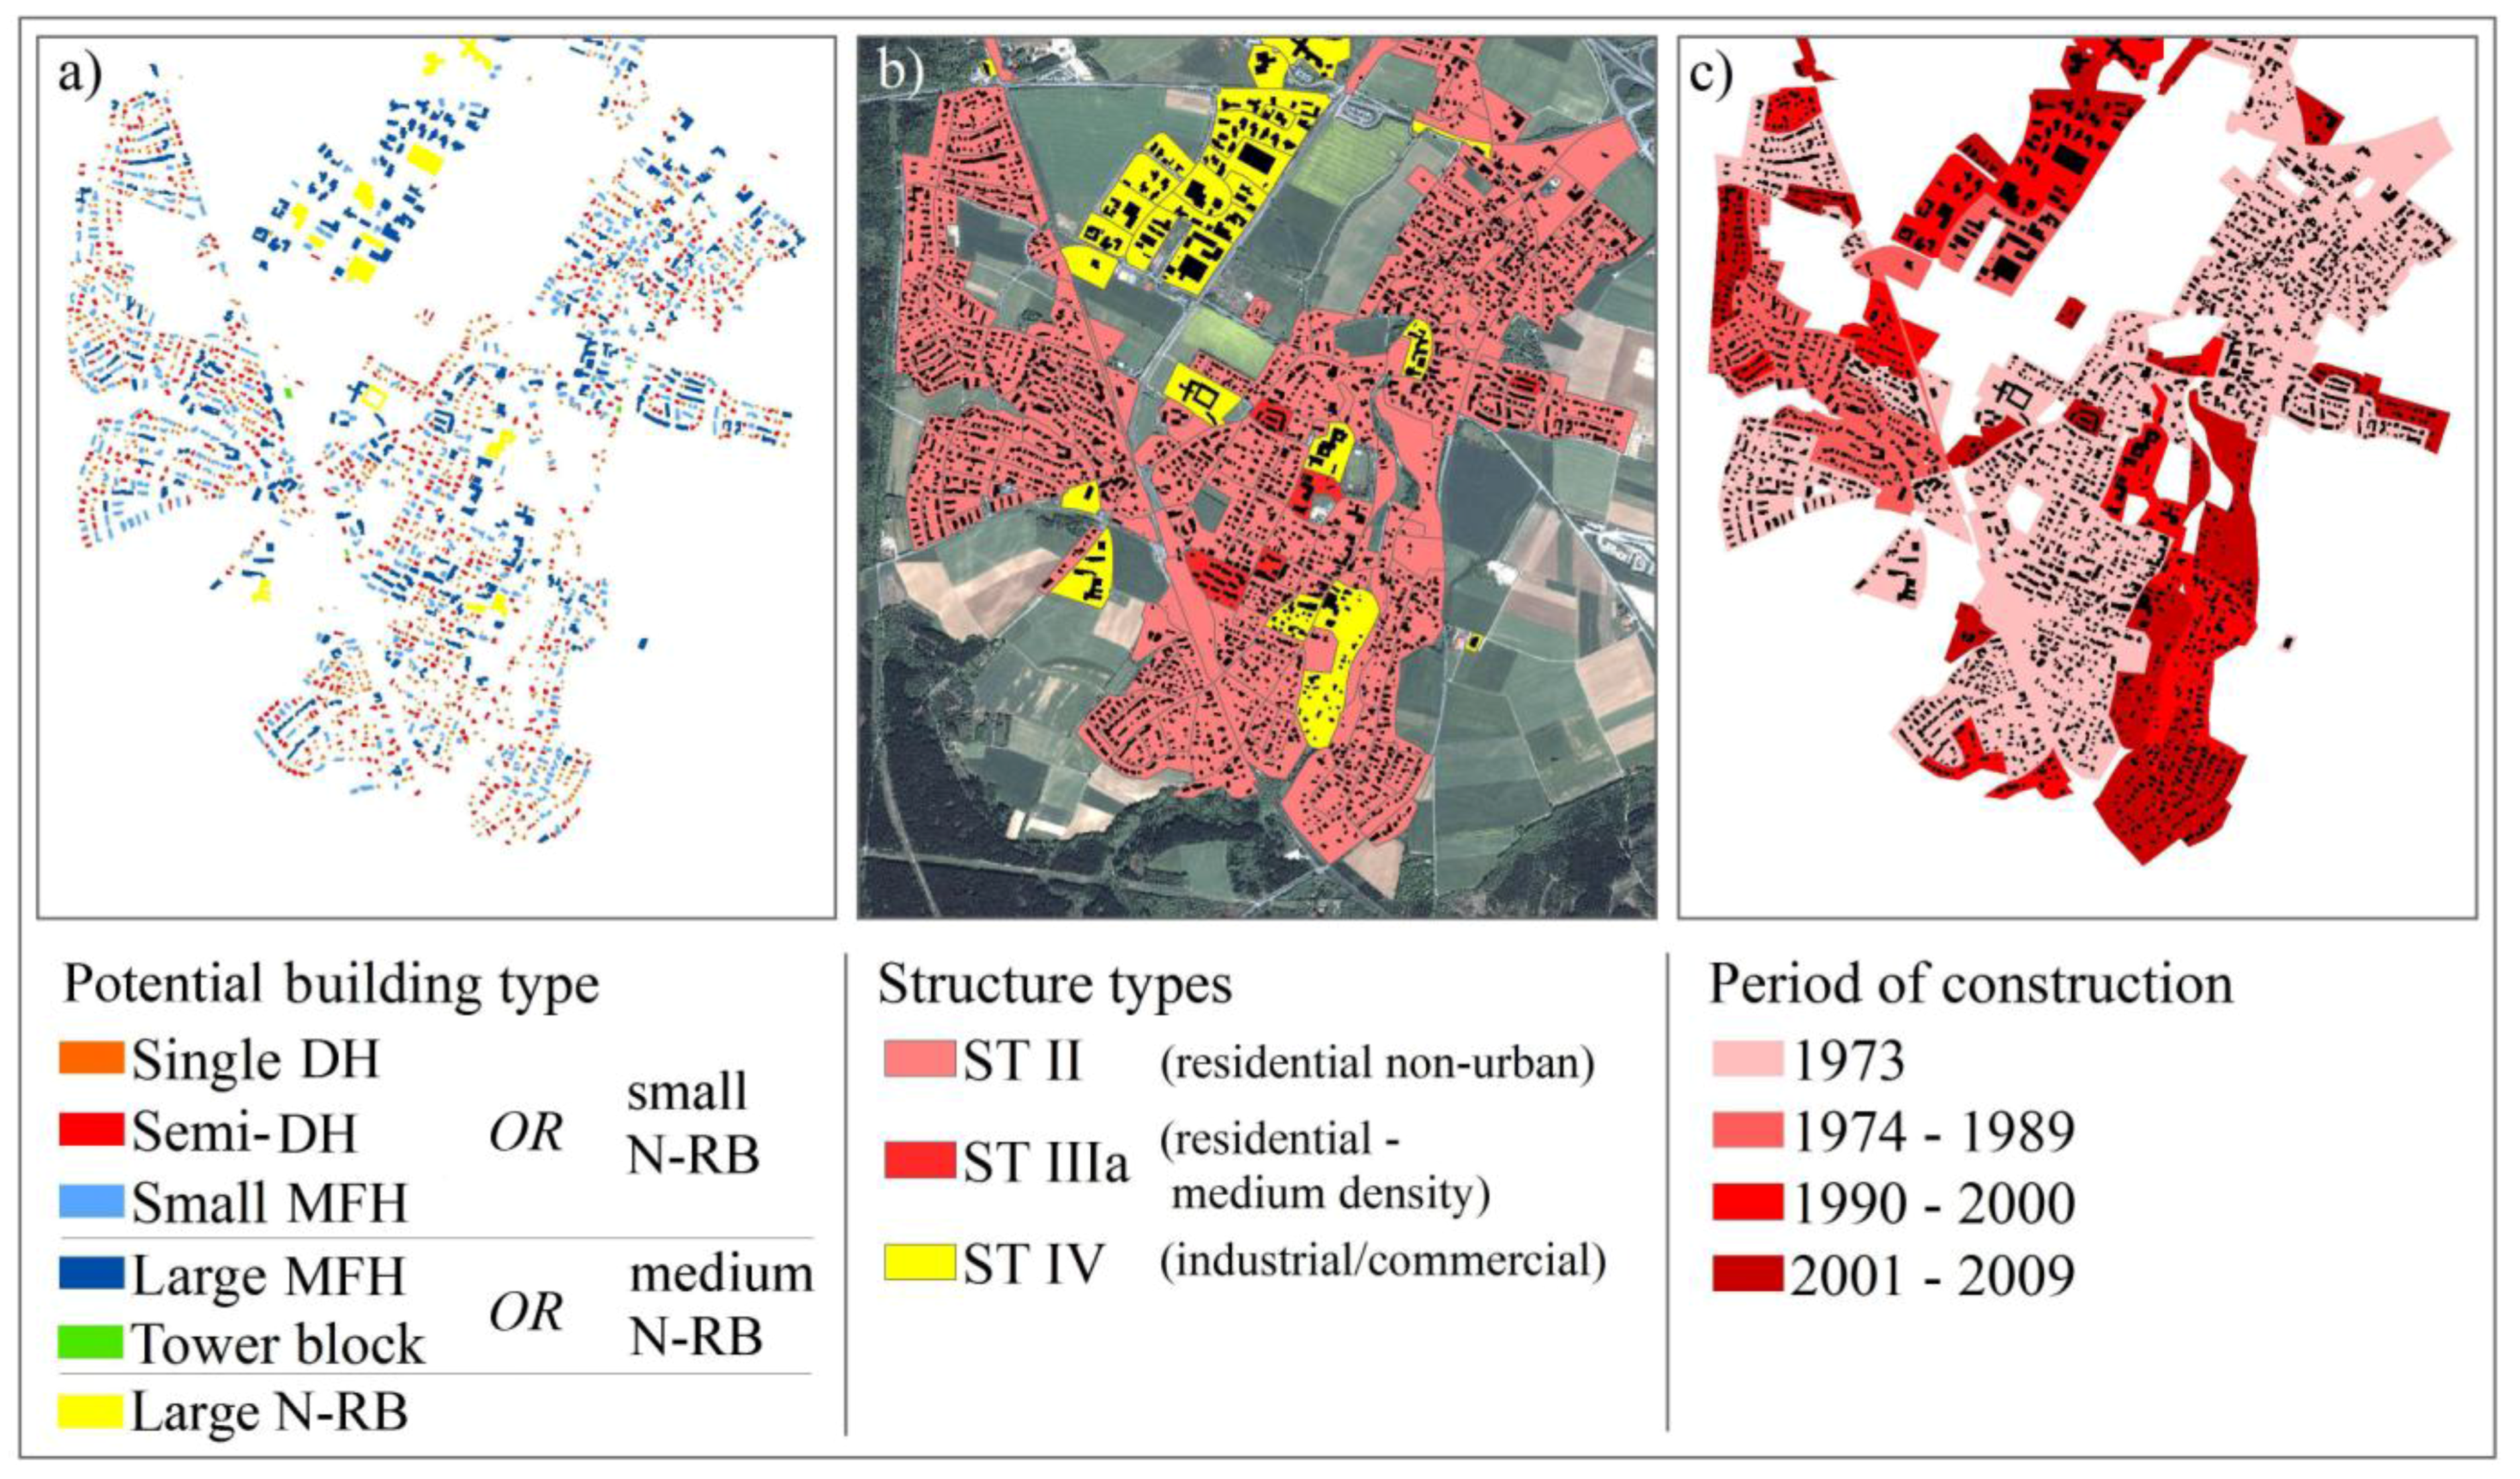
4.2. Derivation of Building Types and Structure Types

The volume specific heat demand of a building correlates with physiognomic building characteristics as well as the usage of a building ([24,29]). The dependency of the heat demand with respect to physiognomic characteristics is primarily due to building size and shape. In principle the heat loss of a building is lower for large buildings than for smaller buildings with the same shape [54]. Also compact buildings with a small ratio between surface and volume have a relatively low heat loss [48]. Additionally, a distinction between residential and non-residential buildings due to the characteristic heat demand has to be made [29]. In this manner, the effective areas of buildings like office, industrial, and administration buildings have primarily a non-residential usage in contrast to buildings that are primarily used for residential purposes like detached houses, etc.
Therefore, a functional separation between physiognomic building characteristics and usage components is performed, to ensure that buildings initially get identical heat demand coefficients if they have a similar geometry. Then, this value is altered in dependence of assigned usage components. This separation is necessary because a discrete separation of the building inventory due to usage characteristics for individual buildings can hardly be predicted with remote sensing data, but it can be described when combining structural characteristics on building block level.
To subdivide the building inventory with regard to energy-relevant physiognomic building characteristics such as area, height and compactness and to determine characteristic values of these building parameters for individual building types an unsupervised classification is performed [25]. This is done separately for each of these parameters using the expectation–maximization algorithm (EM) of the open source software WEKA [55]. The EM cluster algorithm represents an iterative approach and analyzes the probability of membership of the individual values of the parameters to initial cluster centers. Following this, the clusters are altered to increase the probability of membership [56]. To reach a high level of detail the generated clusters are combined and this results in 26 clusters. Subsequently, the derived building clusters are aggregated to potential building types (residential or non-residential usage; Figure 2(a)) by manual inspection utilizing information from the ALK, in order to distinguish whether the extracted building polygons represent one or more single buildings (see also Section 4.4), and in situ information from the engineering office. The potential building types and the affiliated semantic annotation are an initial categorization of the building inventory in order to link the extracted building polygons to distinctive building types revealed in the reference studies which consist of single and semi-detached houses (DH), small and large multi-family houses (MFH), tower blocks and small, medium, and large non-residential buildings (N-RB) [24,29,48]. In this regard, the affiliated heat demand coefficients of the buildings are later determined in combination with assigned usage components (see next paragraph and Section 5.1). However, based on the distinctive building geometry large non-residential buildings can be identified at this point.
As described, the specific heat demand is also significantly affected by the use of a building. Analogous to [29] a differentiation between residential and non-residential buildings is performed. In Germany, buildings that are solely used for residential purposes can be found in almost all types of settlement areas but the share is lowest for industrial areas and inner city structures and highest for outer residential areas. Buildings with mixed use (residential, commercial) can often be found in dense urban areas, for example with commercial usage on the ground floors and apartments on the top floors [22]. To consider such complex usage components, structure types that represent characteristic built-up structures have been derived and which form spatial units that can be described by e.g., characteristic land cover and type of urban fabric [57].
Figure 2. Derived information layers for an energy-relevant characterization of the settlement area. (a) Classified potential building types for individual buildings, (b) classified structure types on building block level, (c) derived periods of construction on building block level.
Remotesensing 03 01447 g002
The structure type classification and the parameterization of the utilized features (dominating building types, percentage of imperviousness, building density and floor-space index) adapts the structure types, which are revealed by [29,58]. The structure types of [29,58] in turn are based on the initial studies of [17,18,19]. For characterization of the settlement structure, four basic types are differentiated: residential built-up structures for non-urban (ST II), e.g., villages and suburbs, and urban (STIII) areas, further divided into areas of medium density (STIIIa) and areas dominated by dense and very dense built-up structures (ST IIIb). Additionally, areas of industrial and commercial usage (ST IV) are characterized. The affiliated characteristic shares of usage are shown in Table 2 and the specific costs for the infrastructure are revealed in Table 4.
Table 2. Characteristic shares of residential and non-residential buildings for the structure types. Source: [29].
UsageST IIST IIIaST IIIbST IV
Residential buildings0.970.710.700.10
Non-residential buildings0.030.290.300.90
The classification for the study area reveals that non-urban structures are dominating the settlement area. Noticeable are also the related industrial and commercial areas in the North West, while dense and very dense built-up structures (ST IIIb) are not classified within the test area (Figure 2(b)).

4.3. Period of Construction

The volume specific heat demand of a building correlates strongly with its age. For Germany, the heat demand of older buildings is in general higher than the heat demand of younger buildings. This is primarily due to missing legal thermal insulation regulations, which were first established in 1978 [48]. The lack of appropriate construction material, in combination with a high demand in the construction sector in the years after the Second World War, entailed disproportionately high heat demands for buildings constructed in this period. Induced by the oil price crises in the 1970s, better insulated houses were built. Hence, for the subsequent construction periods a constant decrease in the buildings’ heat demand can be assumed [29].
As high geometric resolution satellite data are only available from 1999, long-time time-series for classification of building ages is dependent on medium geometric resolution data such as Landsat. An object-based classification algorithm was developed using a decision tree ([59,60]) to extract urbanized areas from Landsat imagery. After a multi-resolution segmentation, the classes are identified hierarchically, starting with classes of significant separability from other classes (such as water and vegetation) and ending with those of lower separability (urban and soil). In addition to this the classification algorithm uses a temporal hierarchical scheme. This means that the classified urban footprint for a past time step is used as a spatial condition when classifying urbanized areas for the most recent time steps. Subsequently, change detection is applied to spatially and temporally identify urban growth on a maximum scale of blocks or quarters since the geometric resolution of the utilized Landsat images restricts analyses on building level. Often, building blocks and quarters represent spatial units with a homogenous construction period [24] which compensates the limitations that are induced by the geometric resolution of the sensors. The result of the described post-classification change detection method is shown in Figure 2(c).
The classified periods of construction only partially correspond with usual building age typologies [24,29,48], since these categories implement various additional characteristics which cannot be reflected or gained by means of remote sensing data. To use the reference values of the specific heat demand coefficients for the analysis, the weighted arithmetic mean between the heat demand in the different periods of construction and the absolute number of buildings in Germany is calculated to get new specific heat demand values for the four derived periods of construction.

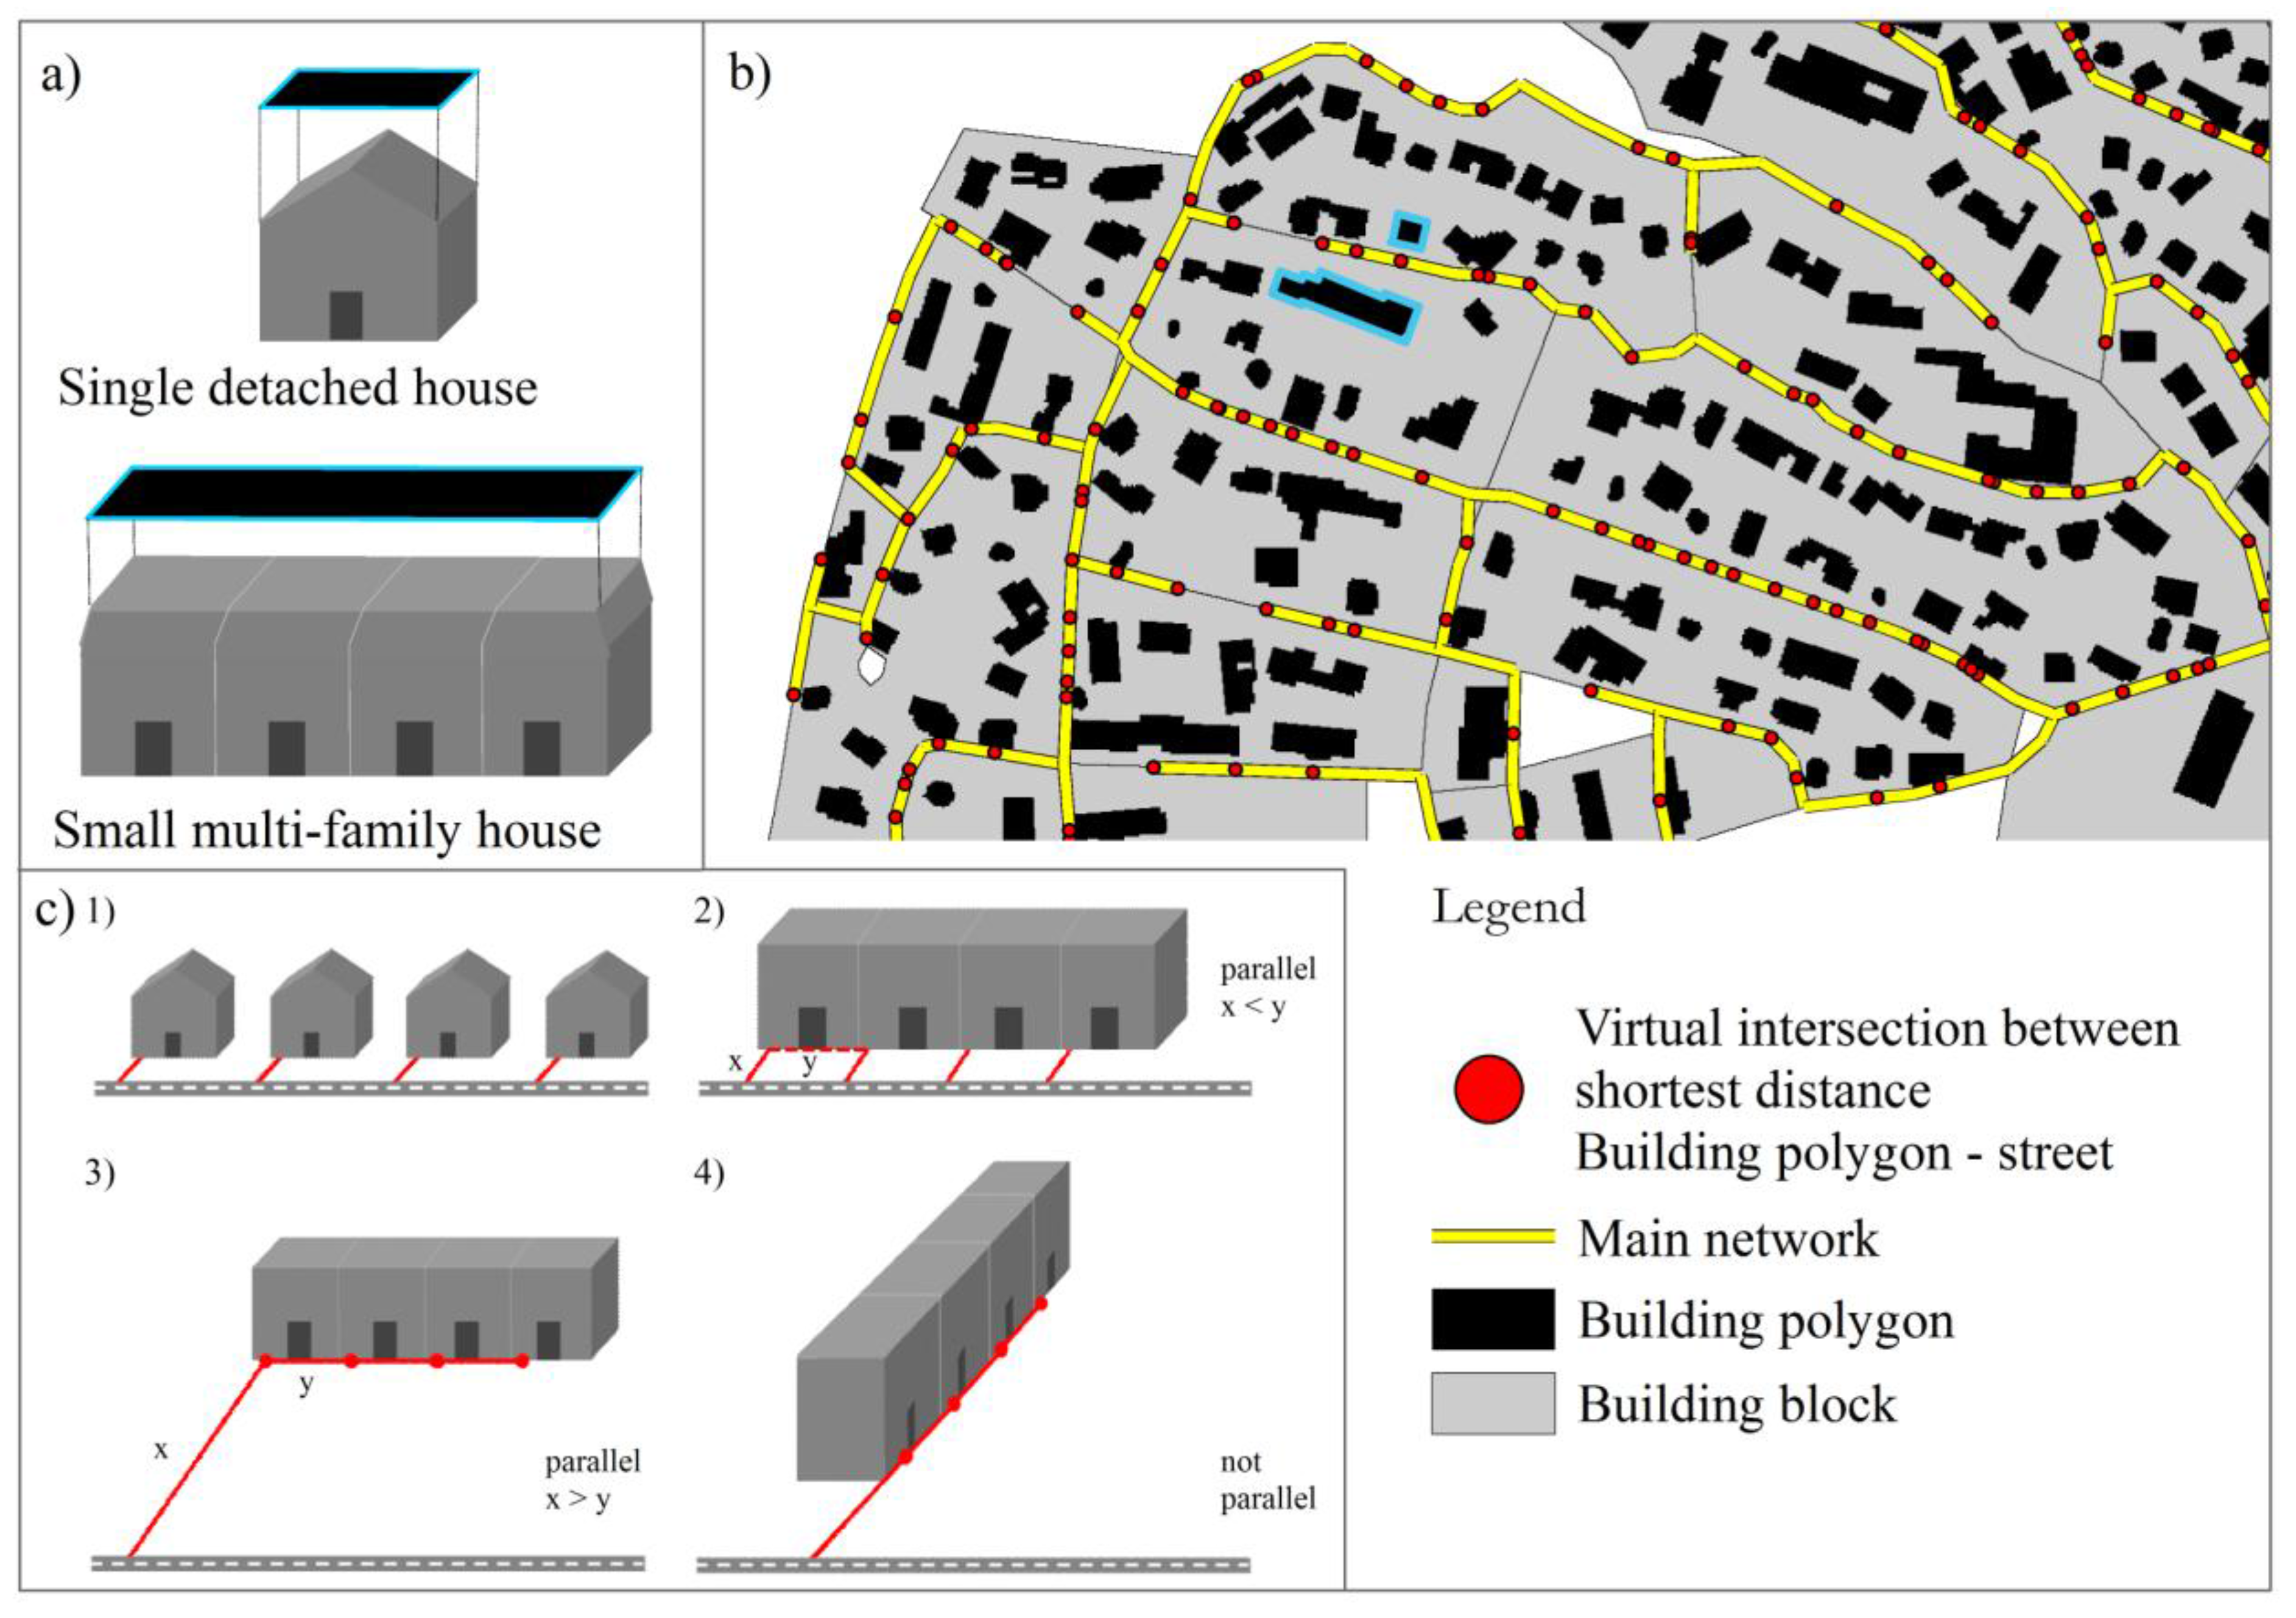
4.4. Derivation of Infrastructural Parameters

To calculate the number of consumer stations and the amount of conventional heat supply infrastructure elements (oil or gas boilers), an estimation of the legal number of houses based on the extracted building polygons has to be made. This is due to the finding, that the extracted building polygons derived from remote sensing data do not necessarily represent the legal number of houses. For example, in contrast to single detached houses the legal boarders of small multi-family houses are not represented by the extracted building polygons (Figure 3(a)). The legal numbers are estimated by selecting random polygons of the different building types and annotating the legal number of houses based on the ALK data. In a second step the average number for each building type is calculated and converted to the curvature/length ratios [61] of the polygons. This parameter turned out to be robust for strongly and less strongly structured buildings.
Figure 3. Calculation of infrastructural parameters. (a) Polygons of different buildings types that do not necessarily represent legal building borders; (b) Network graph generated by using a minimum spanning tree; (c) Calculation rules for several building types and location/orientation constellations.
Remotesensing 03 01447 g003
For the calculation of the length of the district heating network, street vectors can be utilized since district heating pipes are normally installed along existing streets [29]. To generate a graph that represents the shortest connection for all buildings along the streets a euclidean minimum spanning tree is utilized. First, points that represent virtual intersections of the shortest connection from every building to the nearest street sections are generated based on an Euclidean distance metric. Then, a graph is generated that connects all virtual intersections within the test area, minimizing the distance [Figure 3(b)]. To calculate the necessary network length per building block, the graph is spatially disaggregated based on topological relations. If blocks share a network section, the length of the network section is equally divided. Network sections that are only tangent to one building block are completely ascribed to it. Network sections that represent connections between non built-up areas are not considered for further analysis. At the same time this approach implies that all buildings within a study area are considered and a consistent network graph is generated for related built-up areas.
Based on the Euclidean distance from each building to the closest street section the house connections for each building are calculated. Additionally, the orientation of buildings are considered to implement several calculation rules dependent on building type, orientation and location within the building structure (Figure 3(c)). Polygons that represent only one building (e.g., all polygons of the building class ‘single detached house’) are assigned the shortest distance between building and street section (1). For all polygons that represent more than one building, the following rules are applied: If a polygon is located parallel to a street and if its distance to the street (x) is shorter than the distance to the estimated next legal building border (y), the shortest distance between building and street is used (2). If the buildings distance to the street (x) is longer than the distance to the estimated next legal building border (y), the distances between the estimated building borders are added to the distance between building and street (3). Analogously, this calculation rule is also used if the building is not parallel to the street (4).

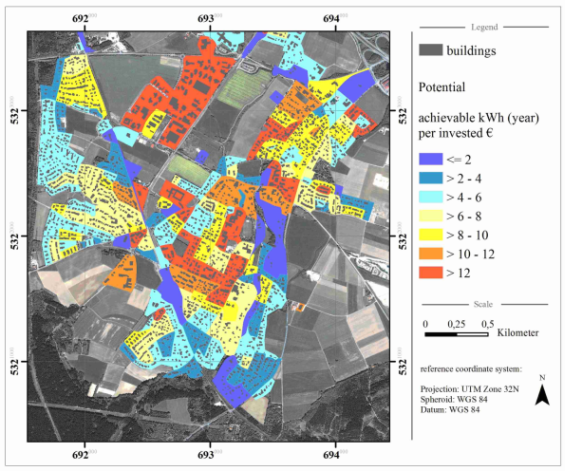
5. Evaluation of the Local Potential for District Heat

5.1. Heat Demand of the Buildings

For the calculation of the buildings’ heat demand the extracted information layers are combined. First the buildings’ volume (V) is reduced to the heated volume by multiplying a constant value (F; see Formula 1). The estimated values adapt the values used in [24] and imply that for smaller buildings—in relation—less volume is heated as compared to larger buildings. The following values for F are assumed: 0.7 for detached and semi detached buildings, 0.75 for small multi-family houses, 0.8 for large more family houses and large non-residential buildings, and 0.85 for tower blocks.
The heated volume is multiplied with a specific heat demand coefficient, which is dependent of building type, structure type and period of construction. To use the specific heat demand coefficients of several reference studies [24,29,48] the values have to be converted from area [kWh/(m2 year)] to volume [kWh/(m3 year)]. Hence, a factor based on official statistical references [62] is calculated: for residential buildings 1 m2 living area corresponds to 4.56 m3 building volume and for non-residential buildings 1 m2 effective area corresponds to 6.12 m3 building volume. The composed heat demand values are shown in Table 3. Only large non-residential buildings are not further differentiated because a valid differentiation due to building age is limited, since large non-residential buildings have quite heterogeneous heat demand characteristics [63]. Therefore, an idealized and averaged value is assumed [29]. In order to illustrate the derivation of the residual respective heat demand coefficients an example calculation is performed: If a potential “single detached house” respective “small non-residential building” is located in an area classified as “industrial/commercial” (ST IV) and was constructed before 1974, the specific heat demand coefficient is composed of the product of the specific heat demand coefficient of a single detached house (45.6 [kWh/(m3 year)]) and the share of residential buildings in this structure type (0.1; Table 2), and the product of the specific heat demand coefficient of a small non-residential building (24.8 [kWh/(m3 year)]) and the share of non-residential buildings in this structure type (0.9; Table 2): 45.6 [kWh/(m3 year)] × 0.1 + 24.8 [kWh/(m3 year)] × 0.9 = 26.9 [kWh/(m3 year)]. This value is quite similar to the initial heat demand coefficient of a “small non-residential building”. In contrast, the heat demand coefficient for structure type ST II is very close to the initial value of a “single detached house” since this structure type is primarily characterized by residential usage (0.97; Table 2).
Table 3. Specific heat demand coefficients vary as a function of building type, structural type and period of construction.
Single detached house/small non-residential building
Period of constructionSpecific heat demand coefficient [kWh/(m3 year)] for structure type ST IISpecific heat demand coefficient [kWh/(m3 year)] for structure type ST IIIaSpecific heat demand coefficient [kWh/(m3 year)] for structure type ST IIIbSpecific heat demand coefficient [kWh/(m3 year)] for structure type ST IV
≤197345.039.639.426.9
1974–198936.733.533.426.1
1990–200027.727.026.925.1
2001–200915.618.118.223.8
Semi-detached house/small non-residential building
≤197342.637.937.726.7
1974–198940.236.136.026.5
1990–200026.025.725.724.9
2001–200915.618.118.223.8
Small multi-family house/small non-residential building
≤197336.733.533.426.1
1974–198932.030.130.025.6
1990–200026.025.725.724.9
2001–200914.517.317.423.7
Large multi-family house/medium non-residential building
≤197336.532.732.523.7
1974–198930.728,428.423.1
1990–200019.620.320.321.9
2001–200914.516.516.621.4
Tower block/medium non-residential building
≤197324.624.024.022.5
1974–198925.624.724.722.6
1990–200024.123.623.622.4
2001–200921.922.022.022.2
Large non-residential buildings
≤200921.621.621.621.6

5.2. Investment Costs

The costs for the calculated absolute number of consumer stations and for conventional oil/gas boilers are differentiated due to the structure types with the linked usage components of the buildings. For the costs of oil/gas boilers the estimated residual value of 0.5 is already considered (Table 4). Analogously, the mean installation costs for the main heating network and house connections to the buildings are calculated depending on the structure type, whereas the installation costs are higher for dense than for less dense settlement structures. The revealed costs also depict supply cases with a characteristic nominal diameter for several structure types and are differentiated by main heating network and house connections [29].
Table 4. Costs per structural type for consumer stations and conventional oil/gas boilers, main heating network, and house connections. Source: [29].
Structure typeConsumer station [€]Conventional oil/gas boiler [€]Main heating network [€/m]House connections [€/m]
ST II2,6023,281260233
ST IIIa4,1634,862311270
ST IIIb4,2905,364316270
ST IV4,4006,648286186
Residual costs for gas networks that possibly exist are not considered. Their costs are only about 15% of the cost of a new heating network, if assumed that the installation cost of a gas network is about half of the installation cost of a district heating network and the gas network is already depreciated by two thirds. Nevertheless, an existing gas network would inhibit the installation of a district heating network in practice.

6. Result and Discussion

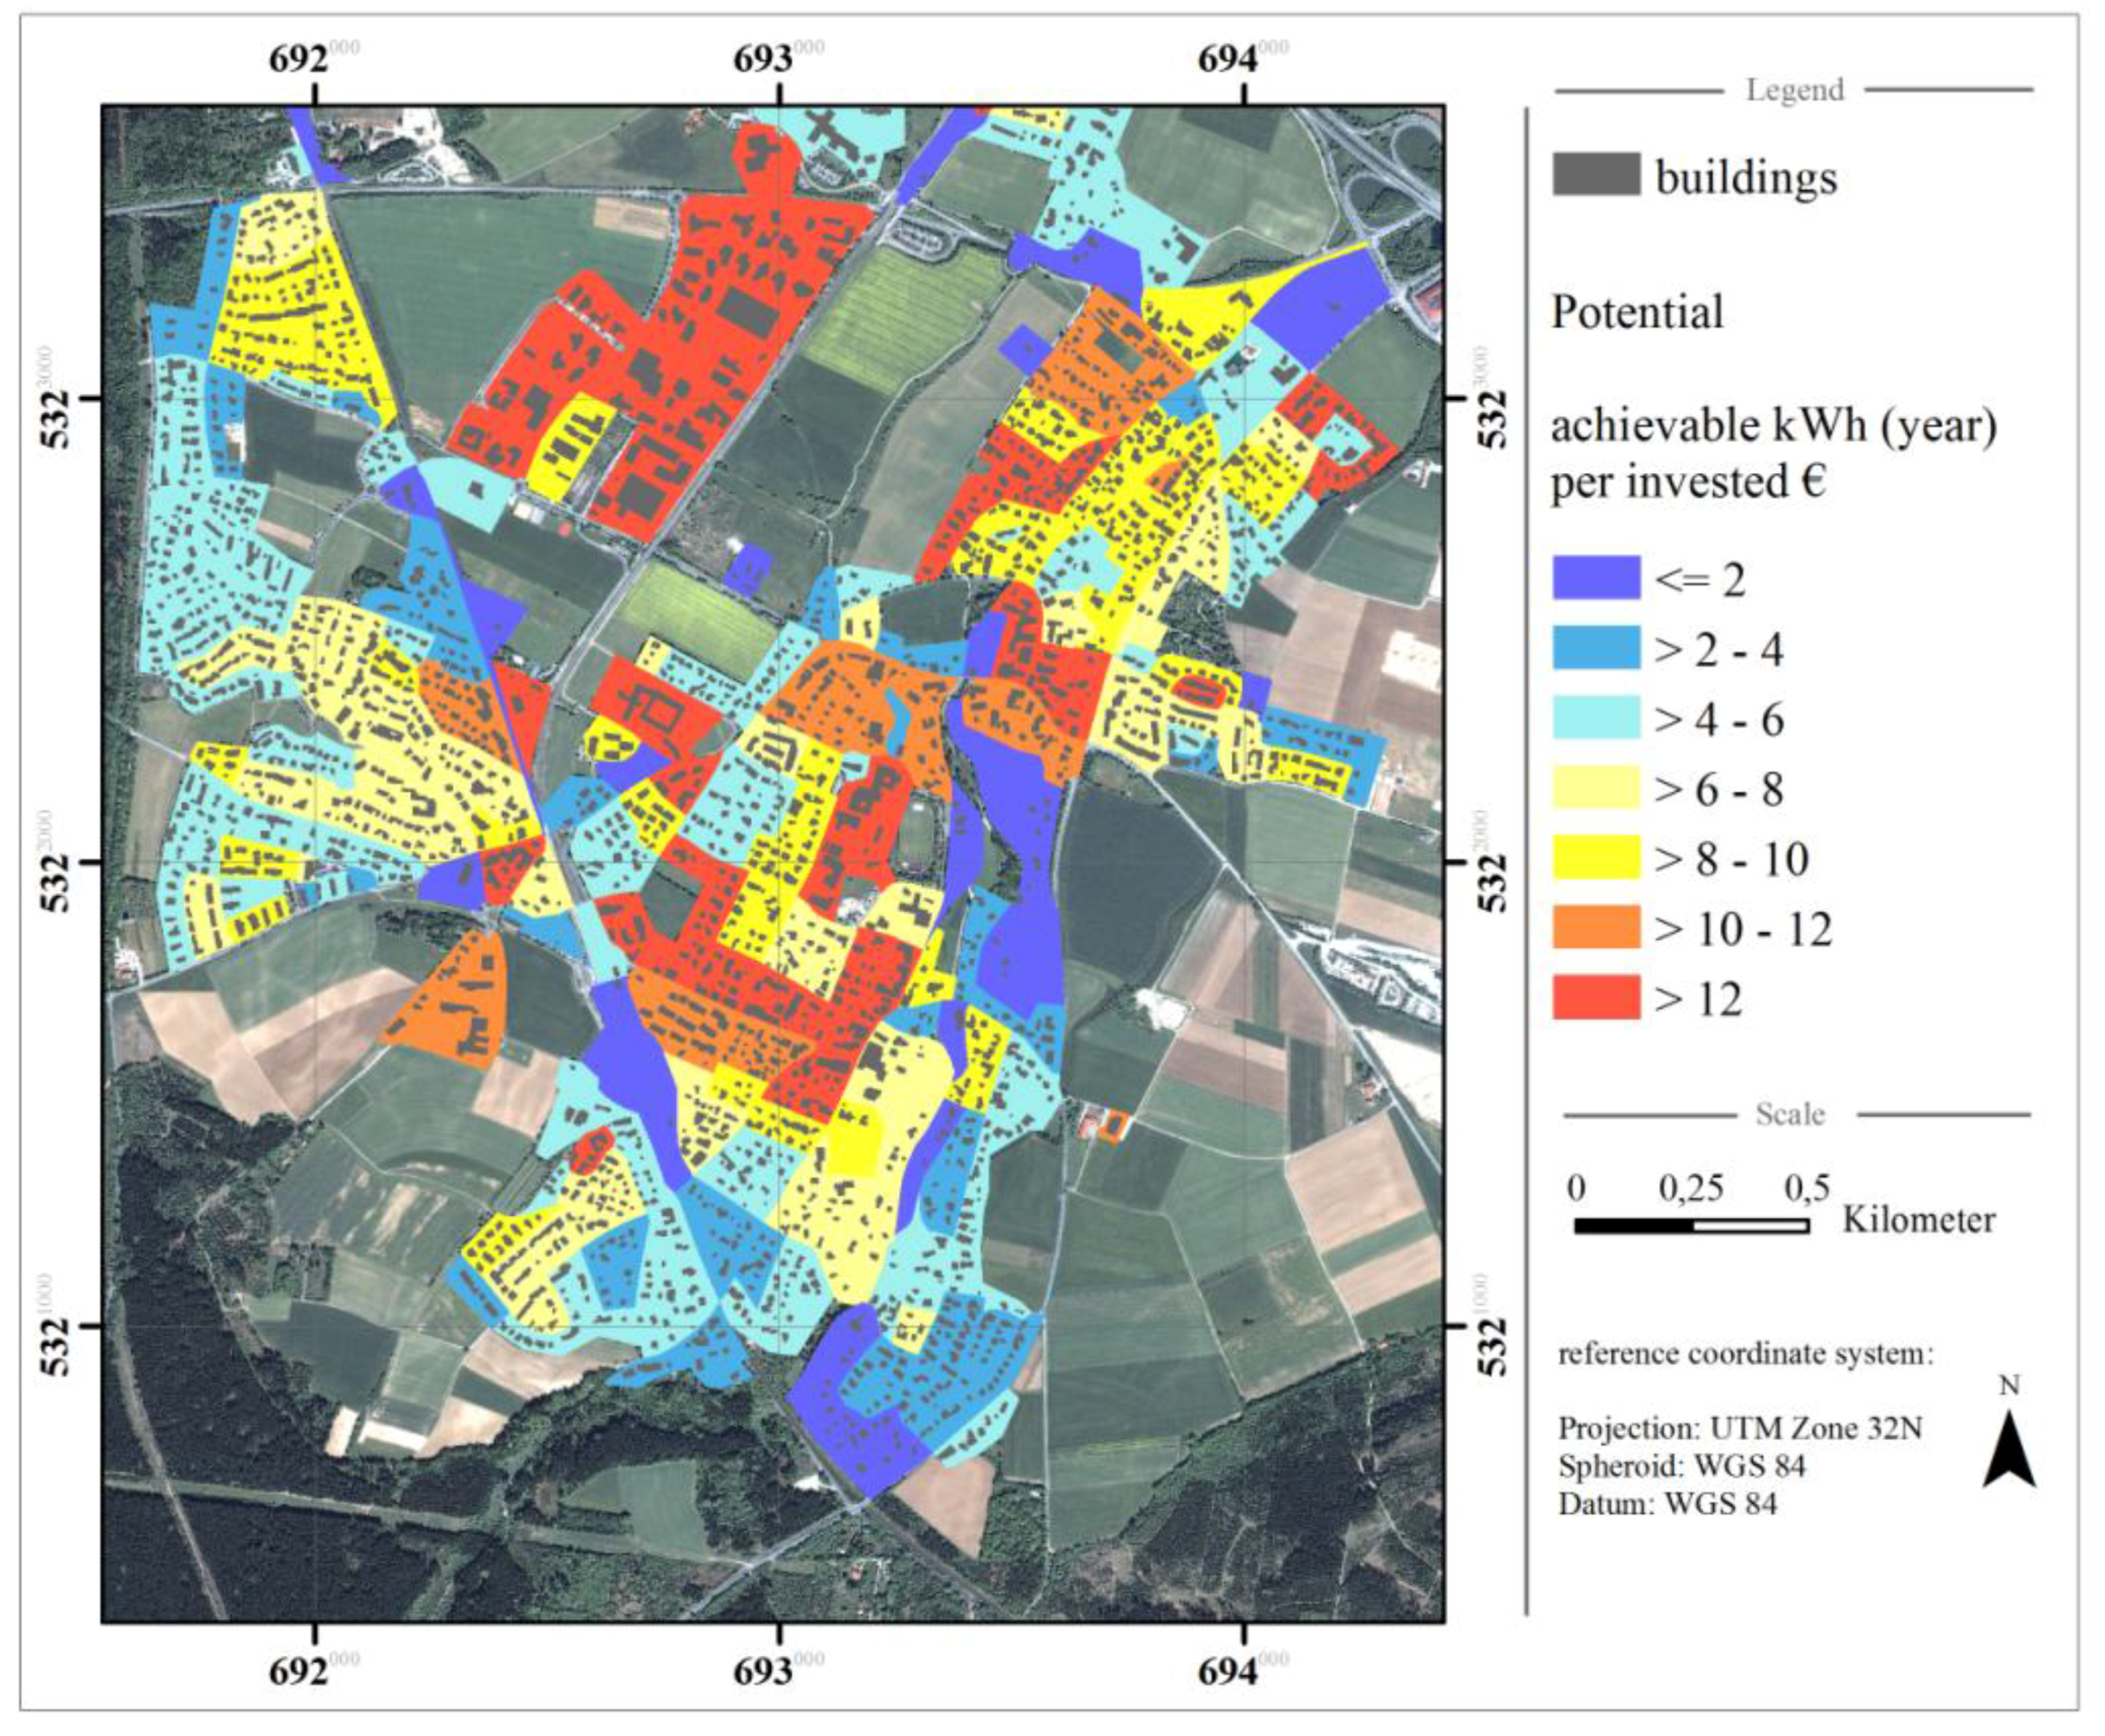
6.1. Evaluation of the Potential for District Heating

The result of the analysis is a spatially differentiated evaluation of physical-structural potentials for district heating systems based on remote sensing data (Figure 4). On building block level built-up structures are identified which are more suitable for the installation of district heating systems than others.
Figure 4. Assessed potentials for district heating for the test site (Oberhaching, Germany).
Remotesensing 03 01447 g004
The settlement area of the test site is characterized by areas that have homogenous potentials as well as areas that have a heterogeneous structure in terms of their district heating suitability. In particular, blocks with very large and commercially used buildings (industrial and commercial areas in the North West) have the highest potentials. These are supplemented by blocks in the core of the settlement area. The potentials are several times higher than for blocks at the border of the settlement area, which are dominated by detached and semi-detached houses. When also considering blocks in the second or third highest classes, related areas can be identified and prioritized for planning applications. Analogously, areas can be identified that show comparatively unfavorable characteristics due to their built-up structure. Based on the quantitative potential, decision-making can be substantially supported enabling decision makers to decide whether to supply these structures in a reasonable cost-value ratio.

6.2. Accuracy Assessment

The accuracy assessments of several classifications, derived information layers and model parameters are based on different reference data. The respective reference data and the results are compared as seen in Table 5.
Table 5. Results and respective reference data set.
ResultBuilding AreaBuilding HeightLand coverBuilding TypeStructural Type
Reference dataIkonos, ALKIn situ; Floor number of 150 buildingsIkonosALK; In situ information engineering officeATKIS
ResultPeriod of constructionHeat demandLegal building numberLength of main networkLength of house connections of buildings
Reference dataRespective input imageIn situ information engineering officeALKIn situ information engineering officeIn situ information engineering office
The automatically generated building mask achieved a producer accuracy of 82.0% and a user accuracy of 88.2%. Thus, whilst the buildings can be detected reliably, a reclassification of false or unclassified building segments was performed due to the assumption that the highly detailed building-related analyses need a higher accuracy. Compared to building areas of the ALK, the areas of building polygons based on the remotely sensed data are approximately 8% overestimated. This is due to the fact that building areas of the ALK represent building footprints, while the extracted building polygons primarily represent the roof area.
For assessing the accuracy of the building height estimation, in situ data was collected detailing the number of floors of 150 buildings. Overall the in situ data for 36.3% of the buildings completely corresponded with the estimated heights; however, it was observed that for 17.5% of buildings were overestimated by one floor and 32.4% were underestimated by one floor. Hence, with a maximum deviation of one floor an overall accuracy of 86.2% can be achieved. The overall underestimation of the building heights can especially be observed for small buildings with one or two floors. The estimated heights of these buildings correspond completely for 44.3%, while for 11.5% an overestimation of one floor and for 42.6% an underestimation of one floor, is observed. These deviations are primarily due to the variable quality of the DSM, since matching errors of the stereoscopic images occurred at the border regions of the test site.
The remaining thematic classes of the land cover classification, except ‘surface water’, are used to derive structural parameters on building block level. The achieved user’s and producer’s accuracies of the land cover classes ‘bare soil’, ‘grassland/meadow’, ‘streets’, ‘other impervious surfaces’, trees/shrubs’, and ‘surface water’ are 86.9%/89.5%, 90.4%/98.5%, 84.1%/90.0%, 76.8%/86.0%, 97.1%/82.5%, and 100.0%/100.0% respectively. The overall accuracy is 88.6% with a kappa coefficient of 0.86.
The overall accuracy achieved for the building type classification is 85.0% with a kappa coefficient of 0.81. Separated for the different building types ‘single detached house’, ‘semi-detached house’, ‘small multi-family house’, ‘large multi-family house’, ‘tower block’, and ‘large non-residential building’ the user’s and producer’s accuracies are 85.4%/88.0%, 85.7%/78.0%, 82.7%/91.0%, 91.4%/85.0%, 66.7%/50.0%, and 69.2%/81.8% respectively. It should be noted that a valid assessment for the building class ‘tower block’ is limited due to a small sample number and the errors are primarily induced by errors of the DSM. In addition, most of the misclassifications of the remaining building types are in favor of similar building types (e.g., classification “single detached house”; reference “semi-detached house”).
The accuracy of the structure type classification has an overall accuracy of 95.0% and a kappa coefficient of 0.86. Thus, the validity of the accuracies especially for the types “STIIIa”and “STIV” are limited due to the small sample size of the test site. The user’s accuracy and producer’s accuracy of the structure types “STII”, “STIIIa”, and “STIV” are 97.0%/96.0, 80.0%/80.0, and 92.0%/94.4 respectively. In this context, a reliable characterization of the settlement structure on the basis of the defined structure types is observed. It should be noted that the quality of the structure type classification is linked to the quality of the building type classification, as the building types are an important structural feature used for the classification.
The user’s and producer’s accuracies of the ‘urban footprint’ classifications for the time steps 1973 (Landsat MSS), 1987 (Landsat TM), 2000 (Landsat ETM+), and 2009 (TerraSAR-X) are 89.0%/87.3%, 91.0%/88.1%, 85.0%/89.7%, and 87.8%/81.8 respectively.
The absolute value of the estimated heat demand (HDest) for 1,700 building polygons is 112.3 GWh/year. This can be compared to a reference value (HDref) based on in situ information from the engineering company of 80.4 GWh/year [36]. This represents an overall overestimation of approximately 39.7%. A linear regression shows that for smaller buildings an underestimation and for larger buildings an overestimation can be observed. An inspection of buildings with strongly underestimated heat demand values shows that primarily an inexact acquisition of the building geometry leads to these deviations (especially the building height—see accuracy ‘height estimation’). Contrary to this, the overestimation is primarily due to different assumptions for the specific heat demand coefficients, especially for older periods of construction, when compared to the specific heat demand coefficients used by the engineering company. Additionally, unheated parts of buildings such as garages cannot be identified with the presented method. Thus, the correlation coefficient (rHDest,HDref) of 0.74 shows a clear positive linear correlation of both data sets and would allow a calibration. For a relative, spatial assessment, both data sets are classified according to their respective deciles on building block level, so that one class represents 10% of the respective value range. Then, the classified intervals are subtracted. The results show, that for 38% of the building blocks a relative correspondence can be stated. For 25% of the building blocks an underestimation of one class is observed, while for 19% an overestimation of one class is found. Hence, a relative spatial correspondence with a tolerance of one class is reached for 81% of the building blocks.
The legal number of buildings and associated absolute number of consumer stations and oil/gas boilers, which are represented by a building polygon, is assessed based on information of the ALK. For the 1,951 building polygons of the test site 3,772 legal buildings were calculated, which is 15.5% higher than the building number of the reference data set (ALK: 3267). The inspection of 265 building polygons of several building types reveals a complete correspondence for 73.6%, an underestimation of one building for 7.2%, and an underestimation of two or more buildings for 1.9%. Correspondingly, for 14% an overestimation of one building, and for 3% an overestimation of two or more buildings, can be observed which reflects the moderate overall overestimation of the calculated legal number.
The lengths of the calculated main network and house connections are compared to the estimated length of the engineering company [36]. The calculated length for the main network is 54.9 km and the associated reference value is 51.8 km. This represents an overestimation of 6%. The calculated length for the house connections is 39.8 km and the associated reference value is 41.9 km. This represents an underestimation of 5%.

7. Conclusion and Outlook

Remote sensing and geo-data offers an extensive information base to evaluate the potential of different settlement structures for district heating systems. Based on high geometric resolution optical satellite data in combination with high-resolution digital surface models, a detailed source of information for the characterization and analysis of settlement structures is available. These sources of information are supplemented by medium geometric resolution data from the Landsat program and SAR data from TerraSAR-X for temporal analysis. Ancillary street geometries are integrated in order to calculate parameters of the small-scale heating network.
Concerning the spatial coverage of the utilized data sets, it is possible to assess large area settlement structures. For country-wide analysis there can be limitations in terms of availability of the required input data. Based on the used data sources realistic quantitative potentials can be assessed and a relative evaluation can be performed with a high accuracy, respectively. Hence, settlement structures can be prioritized in terms of their usage potential for district heating systems.
This study could demonstrate an efficient integrated use of remote sensing and GIS in the field of district heating analysis and shows the derivation of all relevant parameters at the presented level of detail by means of remote sensing and geospatial vector data. While the general paradigm—local decentralized community energy system, minimizing heat transportation distance, use of waste heat—is widely acknowledged and various individual studies exist, the methodology developed in this paper is one of the few which aims for a high transferability and applicability even for very large areas. We believe that this methodology can be applied to a complete country such as Germany and we are currently undertaking efforts to tackle such a mega-project [64]. Only such an ambitious project may put forward a massive replacement of unsustainable heating systems, the wide spread use of renewable energies and a reduction of the high losses of process heat. This research contributes to Germany’s energy mission in tackling the issue of an improved infrastructure for the German heat market. Although the detailed assessment of the methodology for the test site revealed over- and underestimations as compared to expensive engineering level data, this methodology will be further developed to exploit the potential benefits of increasing the proportion of energy provided through optimized energy systems. For a large-area application of this approach, a sensitivity analysis should be performed in advance in order to evaluate the required accuracy of the respective model parameters and consider the results for the choice of the basic input data. This could lead to a discussion about whether single parameters derived from remote sensing data can be substituted or gained by other geospatial data for reasons of data costs or accuracy. Nevertheless, the approach presented is independent of country-specific data, the basic data can be gained up-to-date and numerous new energy-related applications can be developed on a data base as deployed such as the assessment of endogenous energy potentials (biomass, solar potential, etc.) for a region.
Therefore, it seems to be possible to optimize the planning for cities, towns and villages and to aim for a high proportion of renewable energy to improve efficiency and reduce CO2 emissions. In the medium term, district heat might become a more viable option for a sustainable future than it is today—GIS and remote sensing will contribute to this development.

Acknowledgments

The authors would like to thank Franz Kurz (German Aerospace Center (DLR)-Remote Sensing Technology Institute (IMF)) for providing the digital surface model of the test site. We would like to thank European Space Imaging (EUSI) for providing the Ikonos imagery and Ralf Schobries and Carsten Delfs from the engineering office “Plan-G” for providing reference information of the test site’s heat demand and heat infrastructure. We also want to thank the three anonymous reviewers for their very fruitful remarks and comments.

References

  1. Böhnisch, H.; Erbas, K.; Nast, M.; Schreitmüller, K. Nahwärme im Gebäudebestand—Anlagenaspekte und Umsetzung. In Integration Erneuerbarer Energien in Versorgungsstrukturen, Forschungsverbund Sonnenenergie, Potsdam, Germany, 20–21 September 2001; pp. 82–91.
  2. Nitsch, J. Weiterentwicklung der “Ausbaustrategie erneuerbare Energie” vor dem Hintergrund der aktuellen Klimaschutzziele Deutschlands und Europas; Untersuchung im Auftrag des BMU: Stuttgart, Germany, 2008; p. 191. [Google Scholar]
  3. Weng, Q.; Quattrochi, D.A. Urban Remote Sensing; CRC Press/Taylor and Francis: Boca Raton, FL, USA, 2006; p. 432. [Google Scholar]
  4. Weng, Q. Remote Sensing and GIS Integration: Theories, Methods, and Applications; McGraw-Hill: New York, NY, USA, 2010; p. 397. [Google Scholar]
  5. Taubenböck, H.; Dech, S. Fernerkundung im urbanen Raum; WBG: Darmstadt, Germany, 2010; p. 192. [Google Scholar]
  6. Lu, D. The potential and challenge of remote sensing-based biomass estimation. Int. J. Remote Sens. 2006, 7, 1297–1328. [Google Scholar] [CrossRef]
  7. Sen, A. The benefits of remote sensing for energy policy. Space Policy 2004, 20, 17–24. [Google Scholar] [CrossRef]
  8. Page, J.; Albuisson, M.; Wald, L. The European solar radiation atlas: A valuable digital tool. Solar Energy 2001, 71, 81–83. [Google Scholar] [CrossRef]
  9. Clayton, C.; Estes, J.E. Distributed parameter modeling of urban residential energy demand. Photogramm. Eng. Remote Sensing 1979, 45, 106–115. [Google Scholar]
  10. Weber, R.O.; Kaufmann, P. Automated classification scheme for wind fields. J. Appl. Meteorol. 1995, 34, 1133–1142. [Google Scholar] [CrossRef]
  11. Barthelmie, R.J.; Pryor, S.C. Can satellite sampling of offshore wind speeds realistically represent wind speed distributions. J. Appl. Meteorol. 2003, 42, 83–94. [Google Scholar] [CrossRef]
  12. Rajabifard, A.; Crompvoets, J.; Kalantari, M.; Kok, B. Spatially Enabling Society; Leuven University Press: Leuven, Belgium, 2010; p. 248. [Google Scholar]
  13. Harris, P.M.; Ventura, S.J. The integration of geographic data with remotely sensed imagery to improve classification in an urban area. Photogramm. Eng. Remote Sensing 1995, 61, 993–998. [Google Scholar]
  14. Weng, Q. Land use change analysis in the Zhujiang Delta of China using satellite remote sensing, GIS and stochastic modelling. J. Environ. Manag. 2002, 64, 273–284. [Google Scholar] [CrossRef]
  15. Wang, S.; Leduc, S.; Wang, S.; Obersteiner, M.; Schill, C.; Koch, B. A new thinking for renewable energy model: Remote sensing-based renewable energy model. Int. J. Energy Res. 2009, 33, 778–786. [Google Scholar] [CrossRef]
  16. Angelis-Dimakis, A.; Biberacher, M.; Dominguez, J.; Fiorese, G.; Gadocha, S.; Gnansounou, E. Methods and tools to evaluate the availability of renewable energy sources. Renew. Sustain. Energy Rev. 2011, 15, 1182–1200. [Google Scholar] [CrossRef]
  17. Roth, U.; Ginsburg, T.; Ledergerber, E.; Martin, W.; Seunig, G.; Kasel, H.; Deucher, A. Auswirkungen von Entwicklungen im Energiesektor auf die Raum- und Siedlungsstruktur. In Schriftenreihe, „Raumordnung“ des Bundesministers für Raumordnung, Bauwesen und Städtebau, Städtebauliche Forschung 06.011; Bundesministerium für Raumordnung, Bauwesen und Städtebau: Bonn, Germany, 1977; p. 112. [Google Scholar]
  18. Roth, U.; Häubli, F.; Albrecht, L. Wechselwirkungen zwischen der Siedlungsstruktur und Wärmeversorgungssystemen. In Schriftenreihe „Raumordnung“ des Bundesministers für Raumordnung, Bauwesen und Städtebau, Bauwesen und Städtebau 06.044; Bundesministerium für Raumordnung, Bauwesen und Städtebau: Bonn, Germany, 1980. [Google Scholar]
  19. Winkens, H.P. Untersuchung einer zum Heizöl alternativen Wärmebedarfsdeckung für den Rhein-Neckar-Raum. In Örtliche und regionale Versorgungskonzepte; Mannheim, Germany, 1985; Volume 4. [Google Scholar]
  20. Lutsch, W.; Witterhold, F.G. Perspektiven der Fernwärme und Kraft-Wärme-Kopplung. In Ergebnisse und Schlussfolgerungen der AGFW-Studie Pluralistische Wärmeversorgung; AGFW: Frankfurt, Germany, 2005. [Google Scholar]
  21. Blesl, M.; Fahl, U.; Voß, A. Wärmeversorgung des Gebäudebestandes. In Strategien und Technologien einer pluralistischen Fern- und Nahwärmeversorgung in einem liberalisiertem Energiemarkt unter besonderer Berücksichtigung der Kraft-Wärme-Kopplung und erneuerbarer Technologien. AGFW-Bericht zur pluralistischen Wärmeversorgung; Neuffer, H., Witterhold, F.G., Eds.; AGFW-Hauptstudie–Erster Bearbeitungsband, Band 2; AGFW: Frankfurt, Germany, 2001; pp. 19–145. [Google Scholar]
  22. Eickmeier, B.; Schulz, W. Digitale Wärmekarte Deutschlands. Aufbereitung, Konvertierung und Ergänzung von Gebäude- und Siedlungsdaten durch ein auf Statistiken und örtlichen Daten beruhenden Verfahren. Methodische Vorgehensweise und Ergebnisse. In Strategien und Technologien einer pluralistischen Fern- und Nahwärmeversorgung in einem liberalisierten Energiemarkt unter besonderer Berücksichtigung der Kraft-Wärme-Kopplung und regenerativer Energien; Lutsch, W., Neuffer, H., Witterhold, F.G., Eds.; AGFW-Hauptstudie-Erster Bearbeitungsschritt, Band 1: Frankfurt am Main, Germany, 2004; pp. 135–234. [Google Scholar]
  23. Neidhart, H.; Brenner, C. Automatic Calculation of Building Volumes for an Area-Wide Determination of Heat Requirements. In Proceedings of ISPRS Commission IV Joint Workshop ‘Challenges in Geospatial Analysis, Integration and Visualization II’, Stuttgart, Germany, 8–9 September 2003; pp. 137–142.
  24. Sester, M.; Neidhart, H.; Schulz, W.; Eikmeier, B. Verfahrensentwicklung zur Bestimmung einer digitalen Wärmebedarfskarte aus Laserscanning- und GIS-Daten. In Strategien und Technologien einer pluralistischen Fern- und Nahwärmeversorgung in einem liberalisierten Energiemarkt unter besonderer Berücksichtigung der Kraft-Wärme-Kopplung und regenerativer Energien; Lutsch, W., Neuffer, H., Witterhold, F.G., Eds.; AGFW-Hauptstudie-Erster Bearbeitungsschritt, Band 1: Frankfurt am Main, Germany, 2004; pp. 235–301. [Google Scholar]
  25. Neidhart, H.; Sester, M. Creating a Digital Thermal Map Using Laser Scanning and GIS. In Proceedings of the District Heat and Cooling Symposium, Hannover, Germany, 3–5 September 2006.
  26. Meinel, G.; Hecht, R.; Herold, H. Analyzing building stock using topographic maps and GIS. Build. Res. Inf. 2009, 37, 468–482. [Google Scholar] [CrossRef]
  27. Meinel, G.; Hecht, R.; Herold, H.; Schiller, G. Automatische Ableitung von stadtstrukturellen Grundlagendaten und Integration in einem Geographischen Informationssystem; Forschungen/BBR: Bonn, Germany, 2008; pp. 1–98. [Google Scholar]
  28. Hecht, R.; Herold, H.; Meinel, G. Gebäudescharfe Analyse der Siedlungsentwicklung auf Grundlage mittelmaßstäbiger Karten. In Angewandte Geoinformatik 2008. Beiträge zum 20. AGIT-Symposium Salzburg; Strobl, J., Blaschke, T., Griesebner, G., Eds.; Wichmann Verlag: Heidelberg, Germany, 2008; pp. 11–17. [Google Scholar]
  29. Fischedick, M.; Schüwer, D.; Venjakob, J.; Merten, F.; Mitze, D.; Nast, M.; Schillings, C.; Krewitt, W.; Bohnenschäfer, W.; Lindner, K. Potenziale von Nah- und Fernwärmenetzen für den Klimaschutz bis zum Jahr 2020; Sonstiger Bericht; UBA-FB 001074/1; 2007; p. 232. [Google Scholar]
  30. Schillings, C.; Nast, M.; Fischedick, M.; Venjakob, J. Nutzung von Satellitendaten für die Regionalisierung des regenerativen Nahwärmepotenzials in Deutschland. In Energiewirtschaftliche Tagesfragen; Etv GmbH: Essen, Germany, 2007; pp. 84–88. [Google Scholar]
  31. Blesl, M. Räumlich hoch aufgelöste Modellierung leitungsgebundener Energieversorgung zur Deckung des Niedertemperaturwärmebedarfs. Ph.D. Thesis, Universität Stuttgart, Stuttgart, Germany, 2002. [Google Scholar]
  32. Nast, M. Chancen und Perspektiven der Nahwärme im zukünftigen Energiemarkt. In Fachtagung „Nahwärme 2004“, Osnabrück, Germany, 15–16 September 2004.
  33. Ramm, F.; Tropf, J. OpenStreetMap–die freie Weltkarte Nutzen und Mitgestalten; Lehmanns Media: Berlin, Germany, 2008. [Google Scholar]
  34. Neis, P.; Zipf, A. OpenStreetMap–Grundlagen und Potentiale der freien Wiki-Weltkarte; GIS Report 2008/2009; Harzer Verlag: Karlsruhe, Germany, 2008. [Google Scholar]
  35. Arbeitsgemeinschaft der Vermessungsverwaltungen der Länder der Bundesrepublik Deutschland (AdV). ATKIS–Objektartenkatalog. Available online: http://www.atkis.de/dstinfo/dstinfo2.dst_gliederung (accessed on 5 March 2011).
  36. Plan-G; Planungsgesellschaft für Energie- und Anlagentechnik mbH: Flensburg, Germany.
  37. Kurz, F. Accuracy assessment of the DLR 3K camera system. In DGPF Tagungsband, 18. Deutsche Gesellschaft für Photogrammetrie, Fernerkundung und Geoinformation Jahrestagung; Jena, Germany, 23 March 2009. [Google Scholar]
  38. Kurz, F.; Rosenbaum, D.; Thomas, U.; Leitloff, J.; Palubinskas, G.; Zeller, K.; Reinartz, P. Near Real Time Airborne Monitoring Systems for Disaster and Traffic Applications. In Proceedings of ISPRS Hannover Workshop, Hannover, Germany, 2–5 June 2009.
  39. Kurz, F.; Ebner, V.; Rosenbaum, D.; Thomas, U.; Reinartz, P. Near Real Time Processing of DSM from Airborne Digital Camera System for Disaster Monitoring. In Proceedings of XXI Congress of the ISPRS 2008, Commission IV, Beijing, China, 3–11 July 2008; Volume XXXVII. Part B4.
  40. GeoEye. Imagery sources–Ikonos. Available online: http://www.geoeye.com/CorpSite/products-and-services/imagery-sources/ (accessed on 3 March 2011).
  41. Richards, J.A.; Jia, X. Remote Sensing Digital Image Analysis, 4th ed.; Springer-Verlag: Berlin/Heidelberg, Germany, 2006. [Google Scholar]
  42. Irons, J.R. Landsat-The Multispectral Scanner System. Available online: http://landsat.gsfc.nasa.gov/about/mss.html (accessed on 9 March 2011).
  43. Irons, J.R. Landsat-The Thematic Mapper. Available online: http://landsat.gsfc.nasa.gov/about/tm.html (accessed on 9 March 2011).
  44. Irons, J.R. Landsat-The Enhanced Thematic Mapper Plus. Available online: http://landsat.gsfc.nasa.gov/about/etm+.html (accessed on 9 March 2011).
  45. Fritz, T.; Mittermayer, J.; Schättler, B.; Balzer, W.; Buckreuß, S.; Werninghaus, R. TerraSAR-X Ground Segment—Level 1b Product Format Specification; 2007; p. 257. Available online: http://sss.terrasar-x.dlr.de/ (accessed on 17 April 2010).
  46. Schmidt, T. Terra Bavaria“-Amtliche Geodaten in digitaler Form für die Landwirtschaft über das Internet verfügbar. In Referate der 21. GIL-Jahrestagung in Freising-Weihenstephan; Birkner, U., Amon, H., Ohmayer, G., Reiner, L., Eds.; 2000; Volume 13, pp. 286–289. [Google Scholar]
  47. Geoinformatik Service–Uni-Rostock. Automatisierte Liegenschaftskarte. Available online: http://www.geoinformatik.uni-rostock.de/einzel.asp?ID=59 (accessed on 10 February 2011).
  48. Kleemann, M.; Krüger, B.; Heckler, R. Verbrauchskennzahlen für Wohn- und Nichtwohngebäude in Städten. In Strategien und Technologien einer pluralistischen Fern- und Nahwärmeversorgung in einem liberalisierten Energiemarkt unter besonderer Berücksichtigung der Kraft-Wärme-Kopplung und regenerativer Energien; Lutsch, W., Neuffer, H., Witterhold, F.G., Eds.; AGFW-Hauptstudie-Erster Bearbeitungsschritt, Band 1: Frankfurt am Main, Germany, 2004; pp. 25–131. [Google Scholar]
  49. Genske, D.; Jödecke, T.; Ruff, A.; Porsche, L. Nutzung städtischer Freiflächen für erneuerbare Energien; Bundesinstitut für Bau-, Stadt- und Raumforschung (BBSR) im Bundesamt für Bauwesen und Raumordnung (BBR), Bundesministerium für Verkehr, Bau und Stadtentwicklung (BMVBS): Bonn/Berlin, Germany, 2009; p. 150. [Google Scholar]
  50. Taubenböck, H.; Roth, A.; Dech, S. Linking structural urban characteristics derived from high resolution satellite data to population distribution. In Urban and Regional Data Management; Rumor, M., Coors, V., Fendel, E.M., Zlatanova, S., Eds.; Taylor & Francis Group: London, UK, 2007; pp. 35–45. [Google Scholar]
  51. Wurm, M.; Taubenböck, H.; Schardt, M.; Esch, T.; Dech, S. Object-based image information fusion using multisensor earth observation data over urban areas. Int. J. Image Data Fusion 2011, 2, 121–147. [Google Scholar] [CrossRef]
  52. Esch, T.; Thiel, M.; Bock, M.; Dech, S. Improvement of image segmentation accuracy based on multi-scale optimization procedure. IEEE Geosci. Remote Sens. Lett. 2008, 5, 463–467. [Google Scholar] [CrossRef]
  53. Taubenböck, H.; Esch, T.; Wurm, M.; Roth, A.; Dech, S. Object based feature extraction using high spatial resolution satellite data of urban areas. J. Spat. Sci. 2010, 55, 111–126. [Google Scholar] [CrossRef]
  54. Marquardt, H. Energiesparendes Bauen. Von der Europäischen Normung zur Energiesparverordnung; Vieweg & Teubner: Stuttgart, Germany, 2004. [Google Scholar]
  55. Hall, M.; Eibe, F.; Holmes, G.; Pfahringer, B.; Reutemann, P.; Witten, I. The WEKA data mining software: An Update. SIGKDD Explorations 2009, 11, 10–18. Available online: http://www.cs.waikato.ac.nz/~ml/weka/ (accessed on 23 February 2010). [Google Scholar] [CrossRef]
  56. Witten, M.; Frank, E. Data Mining: Practical Machine Learning Tools and Techniques with java Implementations; Morgan Kaufmann: San Francisco, CA, USA, 2000. [Google Scholar]
  57. Breuste, J.; Wächter, M.; Bauer, B. Beitrage zur umwelt- und sozialverträglichen Entwicklung von Stadtregionen; CD-ROM, UFZ Umweltforschungszentrum Leipzig, Germany. Available online: http://www.ufz.de/index.php?de=4912 (accessed on 14 June 2010).
  58. Nast, M. Klimaschutzkonzept für das Saarland. Materialband 2 „Potenzial der Kraft- Wärme/Kälte-Kopplung und Nutzung regenerativer Energien“. Studie von Prognos, DLR und Wuppertal Institut im Auftrag des saarländischen Ministeriums für Umwelt, Energie und Verkehr: Stuttgart, Germany, 1997. [Google Scholar]
  59. Taubenböck, H. Vulnerabilitätsabschätzung der Megacity Istanbul mit Methoden der Fernerkundung. Ph.D. Thesis, University of Würzburg, Würzburg, Germany, 2008; p. 178. [Google Scholar]
  60. Abelen, S.; Taubenböck, H.; Stilla, U. Multi-scene Urban Area Classification via Decision Tree Adjustment. In Proceedings of JURSE Conference 2011: Joint Urban Remote Sensing Event, Munich, Germany, 11–13 April 2011.
  61. Definiens. Definiens eCognition Developer 8; Reference Book; Definiens: Munich, Germany, 2009. [Google Scholar]
  62. STJB. Statistisches Jahrbuch. In Statistisches Jahrbuch für die Bundesrepublik Deutschland; STJB: Wiesbaden, Germany, 1991; 1998, 2004. [Google Scholar]
  63. Diefenbach, N.; Enseling, A. Potentiale zur Reduzierung der CO2-Emissionen bei der Wärmeversorgung von Gebäuden in Hessen bis 2012; Studie im Rahmen von INKLIM 2012. 2007. [Google Scholar]
  64. Esch, T.; Taubenböck, H.; Geiss, C.; Nast, M.; Schillings, C.; Metz, A.; Heldens, W.; Keil, M.; Dech, S. Potenzialanalyse zum Aufbau von Wärmenetzen unter Auswertung siedlungsstruktureller Merkmale. Bundesinstitut für Bau-, Stadt-, und Raumforschung im Bundesamt für Bauwesen und Raumordnung: Berlin, Germany, 2011. [Google Scholar]

