1.1. Context
Mangroves are an assemblage of tropical and sub-tropical halophytes (
i.e., salt tolerant) woody plants. Mangrove forests are among the most productive forest ecosystems in the world and unique in linking terrestrial and marine systems through the inter-tidal zone [
1]. Despite the low tree species diversity and simple canopy structure, mangroves provide many valuable ecosystems goods and services such as carbon sequestration, habitat for terrestrial fauna as well as economically important fisheries, and coastal hazard mitigation [
2]. Mangrove forests can range from vast swamps across large estuarine systems such as the Ganges River Delta to strips of vegetation along the fringe of arid coastlines.
Globally, satellite remote sensing has played an important role in mapping and monitoring mangroves [
3,
4]. Mapping and monitoring mangrove forests is critically important for numerous scientific areas such as carbon stock estimates of tropical coastal nations, effectively managing commercial fisheries and their mangrove nurseries, and understanding the dynamics of vegetation-coastal geomorphology and coastal hazard mitigation. Furthermore, mangroves can provide unique habitat for rare species such as the mangrove finch in the Galapagos Islands of Ecuador.
Previous studies have reported remote sensing classification accuracies between mangroves and other landcover ranging from 75% to 90%, though many studies have omitted accuracy assessments (see [
4] for an in-depth review of satellite remote sensing or [
5] for a more general review). There remain a number of challenges to accurately detect mangroves including spectral similarity between mangroves and nearby landward tropical vegetation including in arid or marginal environments [
6,
7,
8,
9] and the effect of mixed pixels for fringe mangroves [
10]. Detection of individual mangrove species presents an even greater challenge. Traditional remote sensing approaches generally have failed to detect individual species [
11]. While Vaiphasa
et al. [
12] and Wang and Sousa [
13] were able to discriminate between mangrove species in hyperspectral laboratory studies, real-world results have been mixed. Almost all recent studies utilize very high resolution imagery, though a wide variety of different techniques have been tested including fuzzy classifications [
14], neural networks [
15,
16], support machine vectors [
17], post-classification data fusion [
18] and OBIA [
15,
19,
20,
21]. Studies using only multispectral data have generally reported moderate to poor results. For example, Neukermans
et al. [
14] report an overall accuracy of 72 percent based on the mapping of four mangrove species and the surrounding land cover using Quickbird multispectral imagery and a fuzzy classification scheme. Similarly, Wang
et al. [
19] report an overall classification accuracy of nearly 75 percent or less for each of three mangrove species using Quickbird or IKONOS imagery with a maximum likelihood classification (MLC) technique.
The incorporation of spatial information either in the form of OBIA or pixel-based image texture (e.g., grey-level co-occurrence matrix or lacunarity) improves the classification accuracy [
15,
16,
17,
19,
20]. Spatial information seeks to extract repeated patterns in canopy structure that can be indirectly related to species. This approach has merit as mangrove genera often differ greatly in form and structure [
22]. Spatial metrics are very sensitive to edge effects and work best over continuous canopies. In the case of fringe or basin mangroves, mangrove species zonation is often not as distinct as in other environments, and high edge length to area ratio makes edge effects a serious challenge. Thus, to effectively map and monitor fringe mangrove forests, especially at local and regional scales, the challenges of spectral confusion and likely limited effectiveness of spatial metrics are constraining factors. Previous studies have reported a range of classification accuracies. Wang
et al. [
15] report that a hybrid OBIA-MLC classification outperforms either individual approach, but accuracy for individual species still ranged from 74% to 98%. Both Huang
et al. [
17] and Myint
et al. [
20] report accuracies greater than 90% using spatial data as part of the classification, or as an input into the image object segmentation process.
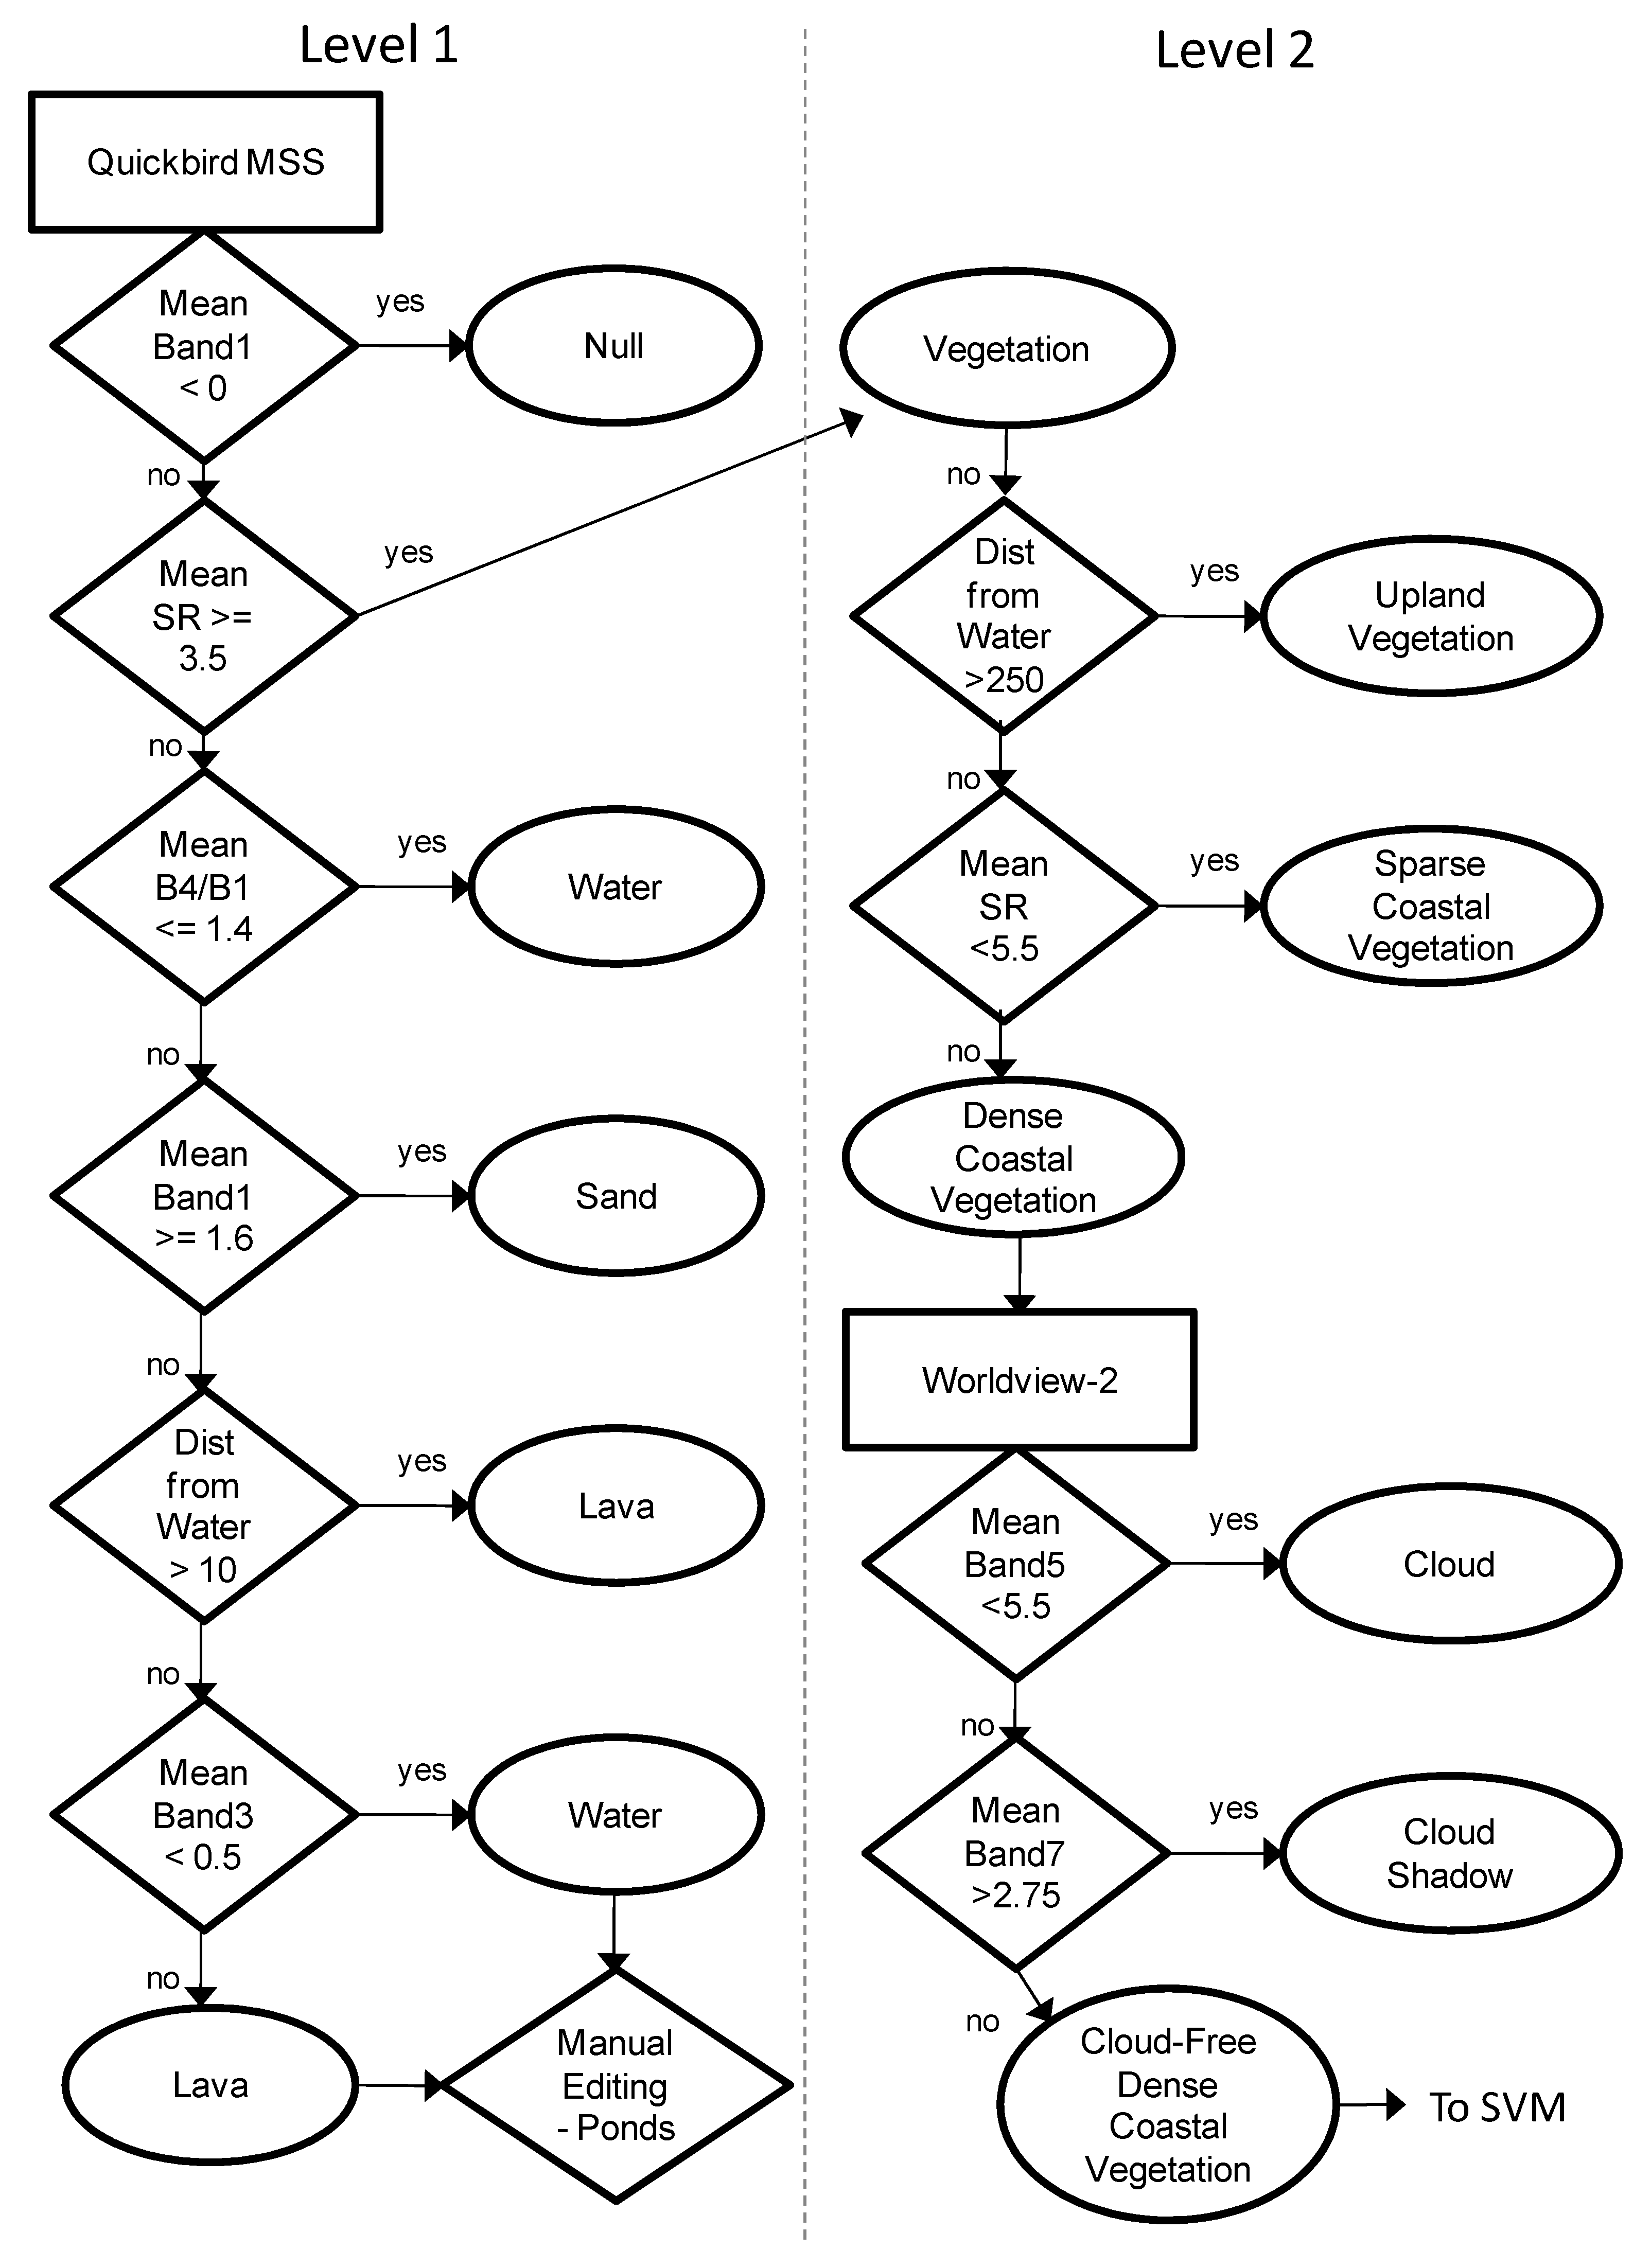
1.3. Background—Object Based Image Analysis
Pixel-based analysis is generally conceptually simple and methods are generic across sensors. However, pixels are often not the unit of interests, but rather the default unit of measurement. For example, individual crowns and canopy gaps consist of multiple pixels and produce spatial-autocorrelation within objects that can be detected using high resolution imagery [
23]. OBIA seeks to create “meaningful” objects by segmenting an image into groups of pixels with similar characteristics based on spectral and spatial properties [
24]. In OBIA, segmented objects become the unit of analysis, from which spectral statistics, such as spectral band means and standard deviation, or spatial information, such as image texture, can be used for further analysis including image classification. In the software eCognition, user-defined scale, shape, and compactness parameters make OBIA particularly useful for creating objects with heterogeneous pixels such as desert with sparse vegetation. OBIA has been widely applied for forest remote sensing studies [
25,
26,
27,
28] and has been successfully applied to mangrove studies [
15,
20,
29]. However, OBIA has not been explicitly applied to fringe mangroves.
1.4. Background—Support Vector Machine
SVM is a machine-learning technique that is well adapted to solving non-linear, high dimensional space classifications [
30]. For remote sensing, SVM is a useful tool for multispectral and hyperspectral classifications in which spectral separability is less than perfect. The mathematical formulation of SVM is described by Vapnik [
31] and a detailed assessment of SVM for remote sensing is described by Huang
et al. [
32]. Though still a novel method for remote sensing, SVM has been applied in many other fields such as biology, biochemistry, and economics. SVM differs from traditional classification approaches by identifying the boundary between classes in n-dimensional spectral-space rather that assigning points to a class based on mean values. SVM creates a hyperplane through n-dimensional spectral-space that separates classes based on a user defined kernel function and parameters that are optimized using machine-learning to maximize the margin from the closest point to the hyperplane.
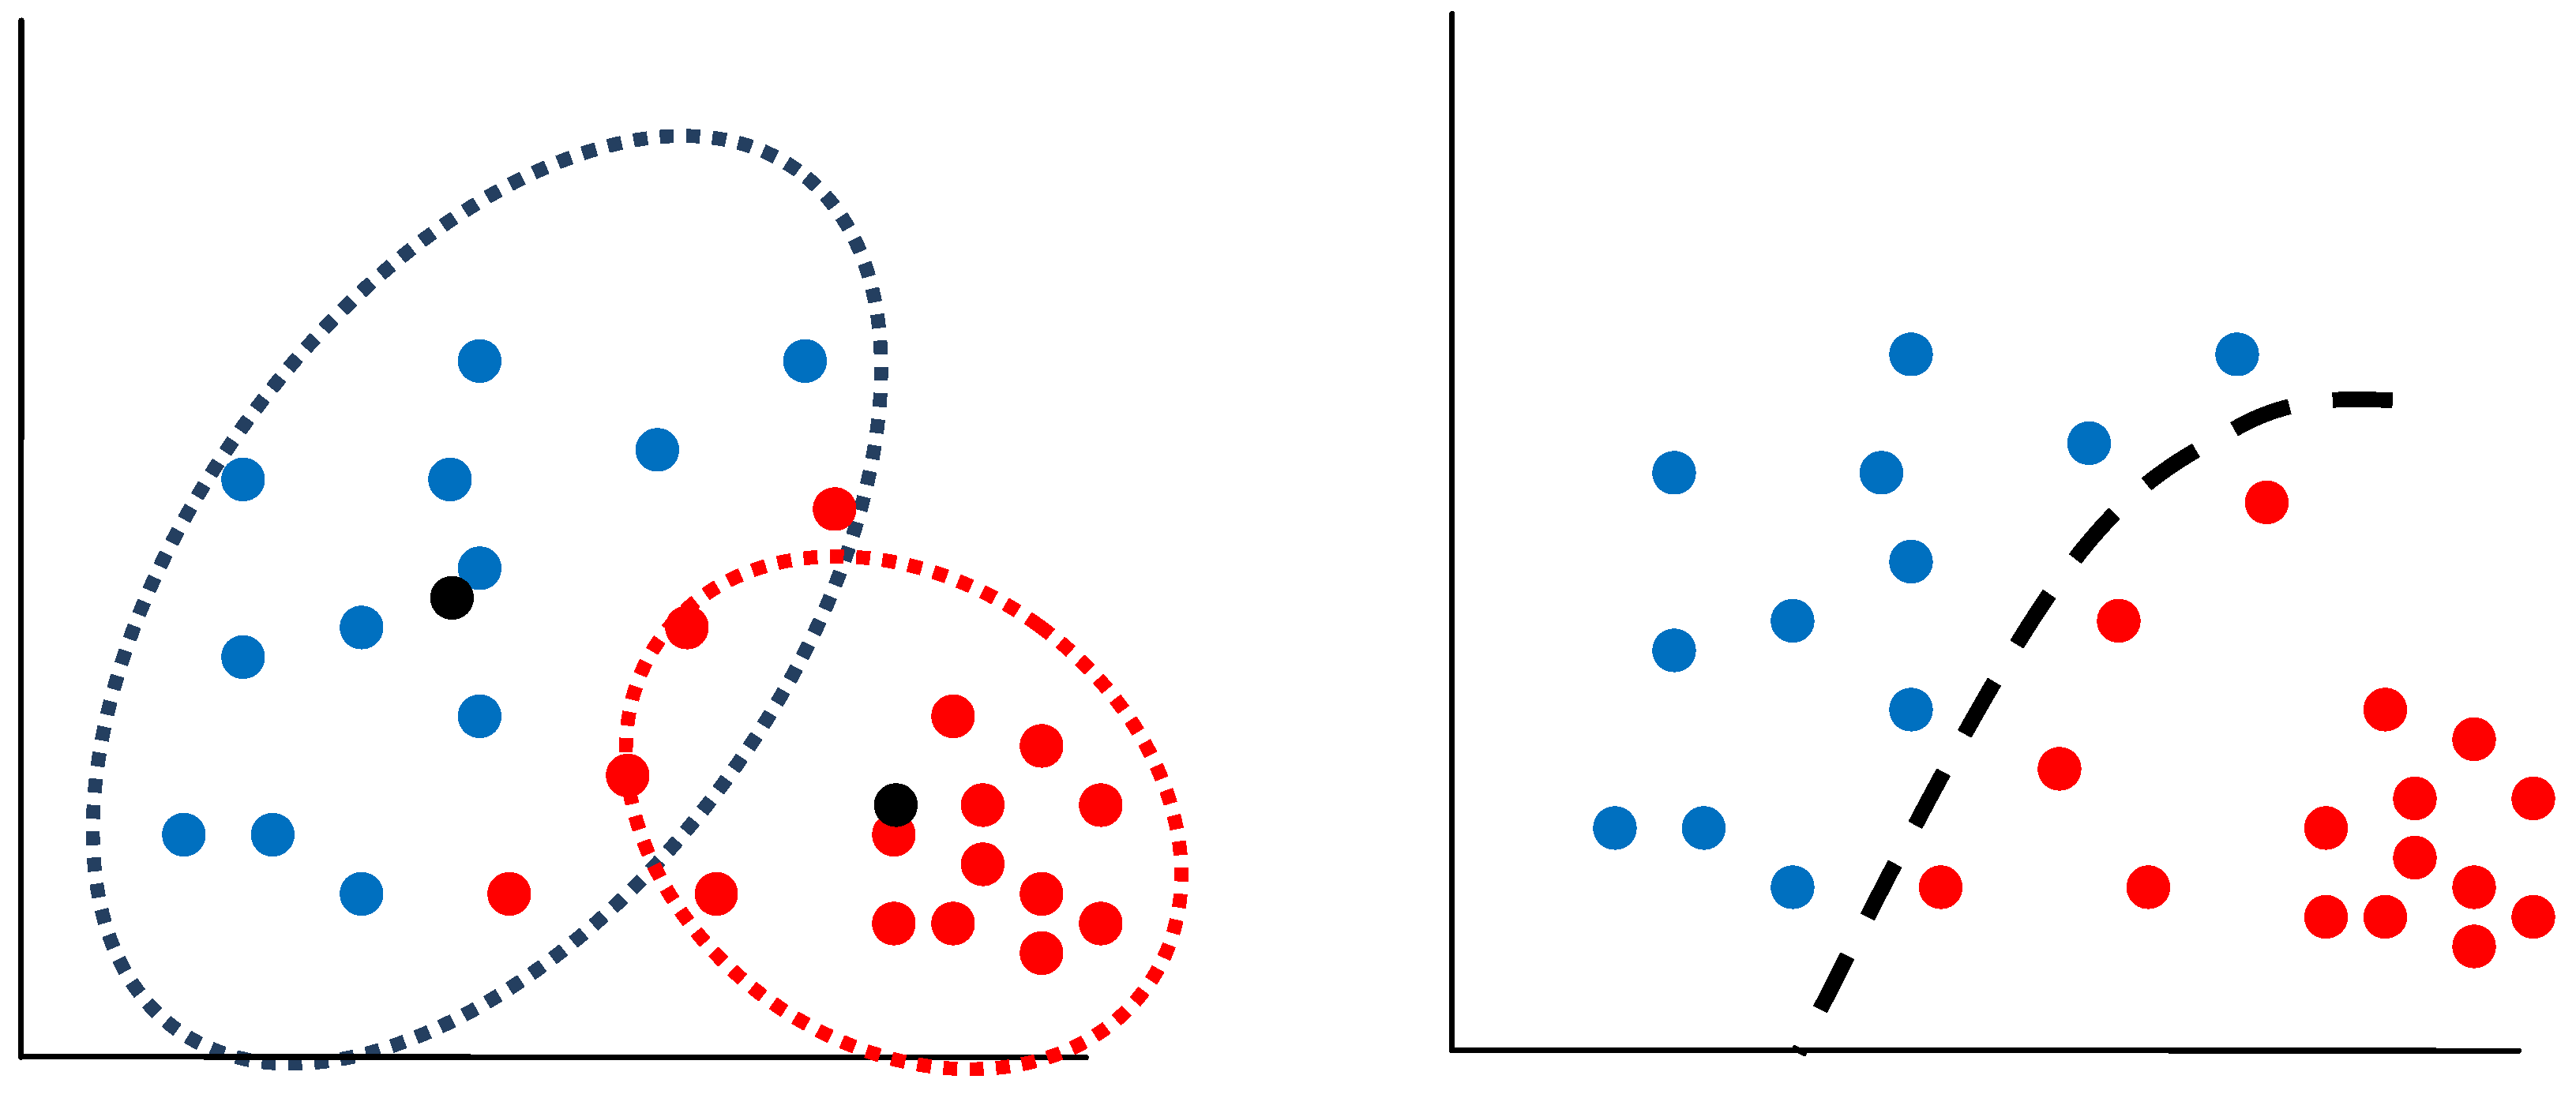
Figure 1 illustrates the difference between a maximum likelihood classification and a SMV. By identifying the hyperplane that separates two classes (represented by the red and blue dots) rather than using the distance between class spectral means (the black dots), SVM can produce a more accurate classification. A penalty parameter allows the SVM to vary the degree of training data misclassified due to possible data error when optimizing the hyperplane. While there are many possible kernels, four common kernels found in remote sensing packages are linear, polynomial, radial basis function, and sigmoid. Finding the best kernel and parameters can be difficult, though Hsu
et al. [
33] suggest starting with a radial basis function and testing a range of parameters to identify an effective model. In a recent study by Yang [
34], it is shown that for most land cover classes, the radial basis function is the best kernel with a penalty parameter of 100.
Figure 1.
A stylized example of a cluster-type (left) and support vector machine likelihood classification (right) between two hypothetical classes shown in blue and red.
Figure 1.
A stylized example of a cluster-type (left) and support vector machine likelihood classification (right) between two hypothetical classes shown in blue and red.
Several studies have demonstrated the great potential for SVM. Pal and Mather [
30] found that SVM outperforms maximum likelihood and artificial neural network classifiers using Landsat TM and is well suited for small training sets and high-dimensional data. Foody and Mathur [
35] found SVM outperforms discriminate analysis and decision-tree algorithms for airborne sensor data. Li
et al. [
36] applied SVM to an OBIA with better results than standard fuzzy logic classification. Only a single study has applied SVM for analysis of mangroves. Huang
et al. [
17] applied SVM as part of a fusion methodology of spectral and image texture data to map mangroves although the effectiveness of SVM for multispectral classification of mangroves remains untested.


