Letter

Estimating Urban Heat Island Effects on the Temperature Series of Uccle (Brussels, Belgium) Using Remote Sensing Data and a Land Surface Scheme

Royal Meteorological Institute, 3 Avenue Circulaire, 1180 Brussels, Belgium
Remote Sens. 2010, 2(12), 2773-2784; https://doi.org/10.3390/rs2122773
Submission received: 12 October 2010 / Revised: 26 October 2010 / Accepted: 7 December 2010 / Published: 10 December 2010
(This article belongs to the Special Issue Urban Remote Sensing)

Abstract

:
In this letter, the urban heat island effects on the temperature time series of Uccle (Brussels, Belgium) during the summers months 1960–1999 was estimated using both ground-based weather stations and remote sensing imagery, combined with a numerical land surface scheme including state-of-the-art urban parameterization, the Town Energy Balance Scheme. Analysis of urban warming based on remote sensing method reveals that the urban bias on minimum temperature is rising at a higher rate, 2.5 times (2.85 ground-based observed) more, than on maximum temperature, with a linear trend of 0.15 °C (0.19 °C ground-based observed) and 0.06 °C (0.06 °C ground-based observed) per decade respectively. The results based on remote sensing imagery are compatible with estimates of urban warming based on weather stations. Therefore, the technique presented in this work is a useful tool in estimating the urban heat island contamination in long time series, countering the drawbacks of a ground-observational approach.

Graphical Abstract

1. Introduction

It is important to know whether, and to what extent, estimates of global warming trends can be explained by the growth of the urban heat island due to increased urbanization. In fact, if observations of temperatures in growing cities are used in the assessment of global warming trends, these trends may be overestimated. However, the change in urbanization over time is smaller for a station that originally was established in a densely built-up area than for a station originally installed in a rural or only light urbanized environment that has experienced growth. Jones et al. [1] have shown that temperatures in central London and Vienna did not rise relative to rural locations nearby in recent decades. Nevertheless, suburban sites continue to warm relative to nearby rural areas until local urbanization is complete, as shown for London's Heathrow airport by Jones and Lister [2].
The past observational approach compared urban air temperature records with records of a rural area. However, selective use of rural sites, requires information (metadata) about the site and its surroundings. Some forms of metadata, such as city population statistics, must be used with care because they may not be representative of the immediate vicinity of the observing site. Also, in situ observations usually suffer from inhomogeneities caused by nonclimatic factors such as changes in observation time, instrumentations, location (altitude and latitude), and other local meteorological features.
With the advent of remote sensing methodology, it has become possible to monitor local urban climate changes associated with land use changes over rapidly expanding urban areas. Specifically, the quantity of impervious surfaces is related to urban growth and urban density [3]. The proportion of impervious surfaces has been reported to be a good indicator for the monitoring of the urban heat island effects (UHI). A positive correlation between the proportion of impervious surfaces and land surface temperatures was identified by Yuan and Bauer [4]. The expansion of the built-up area was found to be the main factor in long-term changes in air temperatures [5,6].
Recently, Hamdi et al. [7] presents a new technique for estimating effects of increased urbanization on temperature trends. Specifically, they combine data from remote sensing imagery and a land surface model including the most advanced urban parameterization of Masson [8], the Town Energy Balance (TEB) scheme. In their study: (i) urbanization was assessed by measuring changes of percent impervious surface areas, (ii) the land surface scheme was run in a stand-alone mode, coupled to downscaled ERA-40 reanalysis data [9]. It should be noted that it was the first time a modeling approach was applied to assess the degree to which background temperature trends are amplified by urbanization. This new technique was applied to the Brussels Capital Region (BCR) in Belgium, which has experienced a rapid overturning of agricultural land and native vegetation to buildings and impermeable pavements over the last century. However, in their study, the modeling set up was used just as a sensitivity study because no observed data were found in order to compare the results of their new technique based on remote sensing imagery with observed estimates from ground-based weather stations. Their model-based estimate of urban warming was based on calculating the difference between two model integrations: (i) “the rural” scenario representing a hypothetical situation with no urban areas inside the Brussels Capital Region domain and (ii) the “urban” scenario, which represented the climate in the presence of urban areas using the measured historical changes of surface cover fractions. Recently, a homogenized rural climatic temperature records (summer 1955–2006, minimum TMIN and maximum TMAX temperature) were found at a station far away from Brussels about 20 km and therefore this station presents the suitable site to measure the increase of the urban heat island from Brussels. Thus, in this work, the urban heat island effects on the temperature time series of Brussels during summer months will be estimated using both ground-based weather stations and remote sensing imagery combined with a land surface scheme and the results compared. Therefore, the aim of this letter is to prove that the technique presented in Hamdi et al. [7] works correctly.

2. Data and Model

2.1. Study Area

The focus of our study is the Brussels Capital Region (BCR) (see Figure 1.), centrally located in Belgium, with a size of 161.78 km2, and a registered population of 1,031,215, on January 1st 2007, estimated by the National Institute of Statistics (INS). As in the majority of large European cities, it is only during the 19th century that the population strongly increased, exceeding 1 million inhabitants in 2004. This caused a rapid expansion of the capital over the last 50 years. The area covered by the BCR is quite circular (Figure 1) with a diameter of 12 km and the effects of urbanization variability dominate the topographic influence (orography is beneath 150 m).
Figure 1. Study area of the Brussels Capital Region. The national recording station of the Royal Meteorological Institute of Belgium (urban station) is marked with a red bulb, and rural stations with a green bulb (Brussegem right, Asse left). The red arrow presents the direction of the prevailing wind direction in the region.
Remotesensing 02 02773 g001

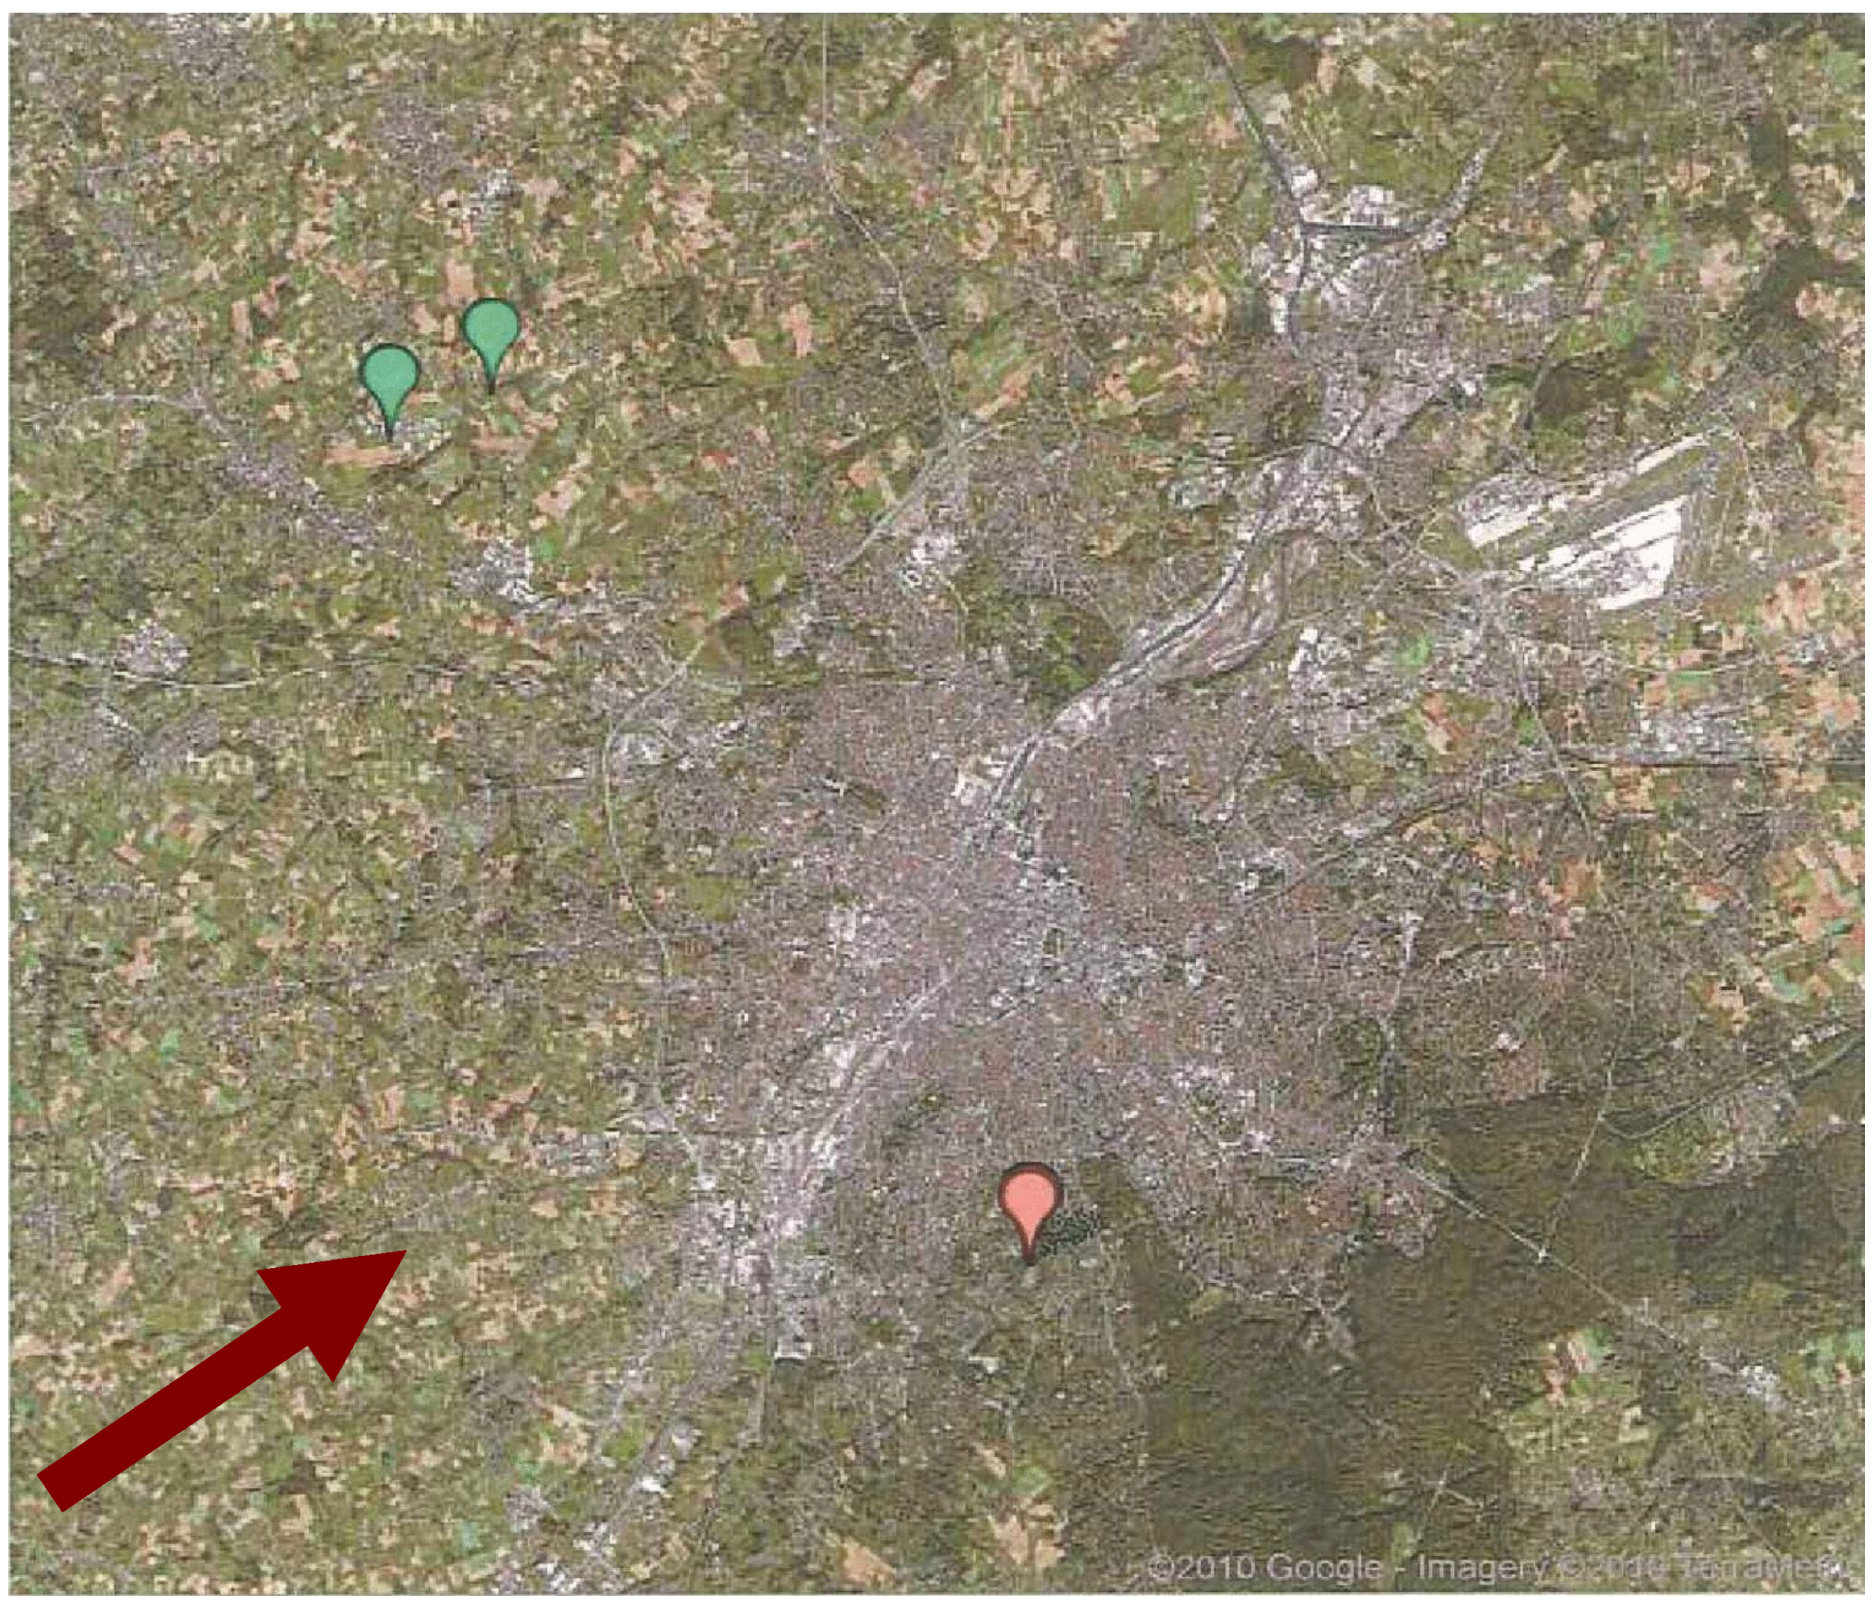
2.2. Meteorological Weather Station

The national recording station of the Royal Meteorological Institute (RMI) of Belgium [World Meteorological Organization (WMO) code 06447] is situated some 6 km south of the center of the capital (Figure 1), in the Uccle suburban, at 50.80°N and 04.35°E. The series has been used to monitor climate change in Belgium and is the one used in the world database of land-surface air temperature and in the Global Climate Observing System (GCOS) surface network [10]. In order to assess the degree to which the Uccle temperature trends are amplified by urbanization two ground-based meteorological stations, situated 20 km away from the center of Brussels and managed by the RMI, was used (see Figure 1 and Table 1). These rural stations are not influenced by the SW-prevailing wind direction and therefore the impact of the city is negligible. Also, even if the urban heat island may not be zero in these small villages [11], they did not experience a rapid increase during the last century and therefore the ability of the urban infrastructure to prevent outgoing longwave radiation is not increasing and the anthropogenic heat input is stable.
Table 1. Individual temperature series used to estimate the urban warming of the city of Brussels, their observation hours, location and approximate elevation.
Time spanObservation timeLocation (above mean sea level)
1 June 1955–31 August 2006Daily max- and minimumUccle (104 m)
1 June 1991–31 August 2006Daily max- and minimumBrussegem ( ~53 m)
1 June 1980–31 August 1990Daily max- and minimumAsse (~53 m)
1 June 1955–31 August 1971Daily max- and minimumAsse (~53 m)

2.3. Evolution of Surface Cover Fraction

The evolution of surface cover fractions over the study region was derived from a study by Vanhuysse et al. [12]. This study aims to assess the evolution of the fraction of impervious surfaces in the BCR since the 1950s acceleration of urban growth linked to widespread use of cars as a new mode of transport. Two periods were studied:
(i)
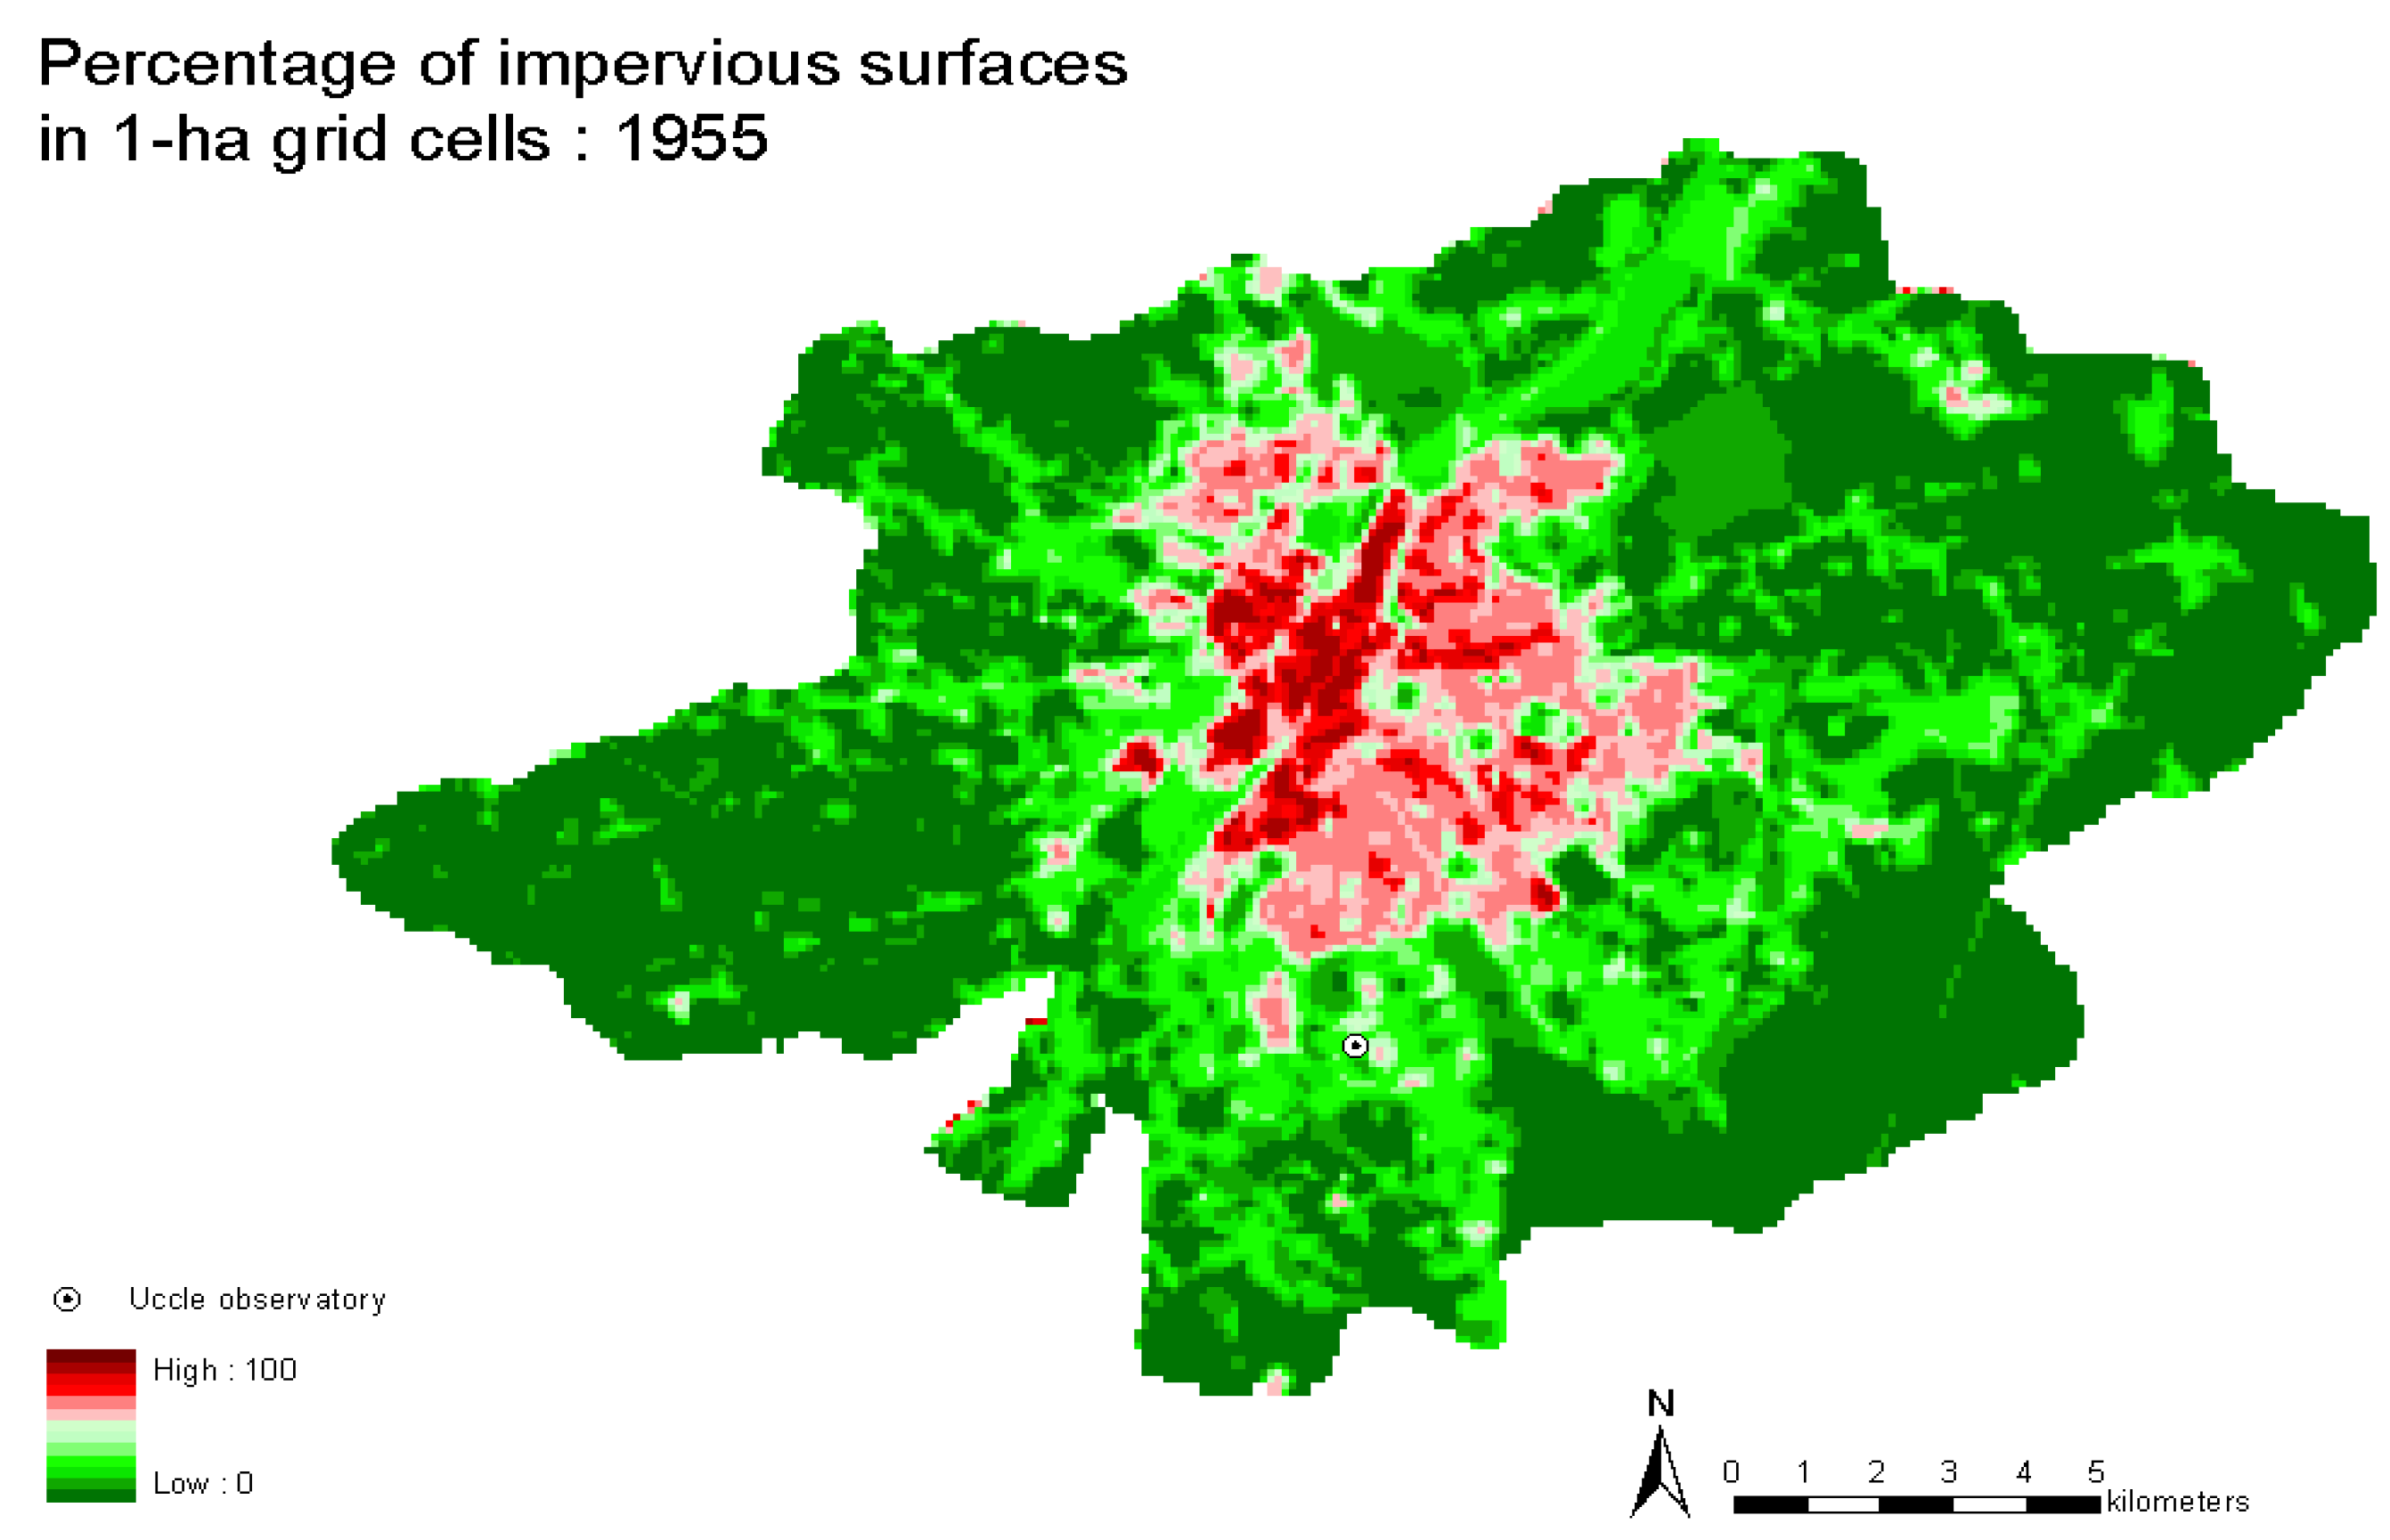
From 1950s to 1980s: Vanhuysse et al. [12] used the MURBANDY database [3] available for 1955, 1970, and 1985 and then estimated the fraction of impervious surfaces using topographic maps and aerial photos. Initially, an interpretation of land use in 1997 was carried out visually on the screen, based on satellite images IRS/1C (spatial resolution 5.8 m), and aerial orthophotos (5 m spatial resolution). The legend of reference is derived from CORINE Land Cover but has a higher degree of detail for artificial surfaces. The minimum mapped area is 1 ha for artificial surfaces and 3 ha for other surfaces. Then, for 1955, 1970 and 1985, the database of 1997 was retrospectively updated using information from maps and aerial photos of the period. For each of the three dates, topographic maps at 1:5,000 were scanned, georeferenced, and overlayed with the MURBANDY/MOLAND data. The interpretation was carried out visually using a geographic information system (ArcGIS v9.1). For 1985, the coverage map at 1:5,000 was not comprehensive enough and had to be supplemented by aerial photographs. The final results indicate that the percentage of impervious surfaces has increased from 26% in 1955 to 39% in 1985.
(ii)
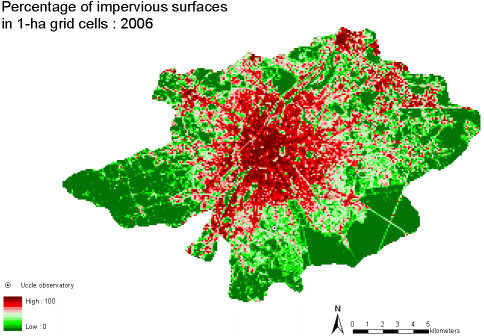
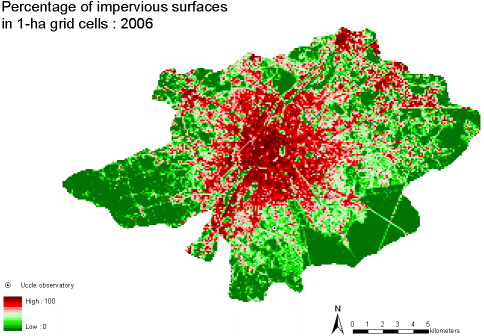
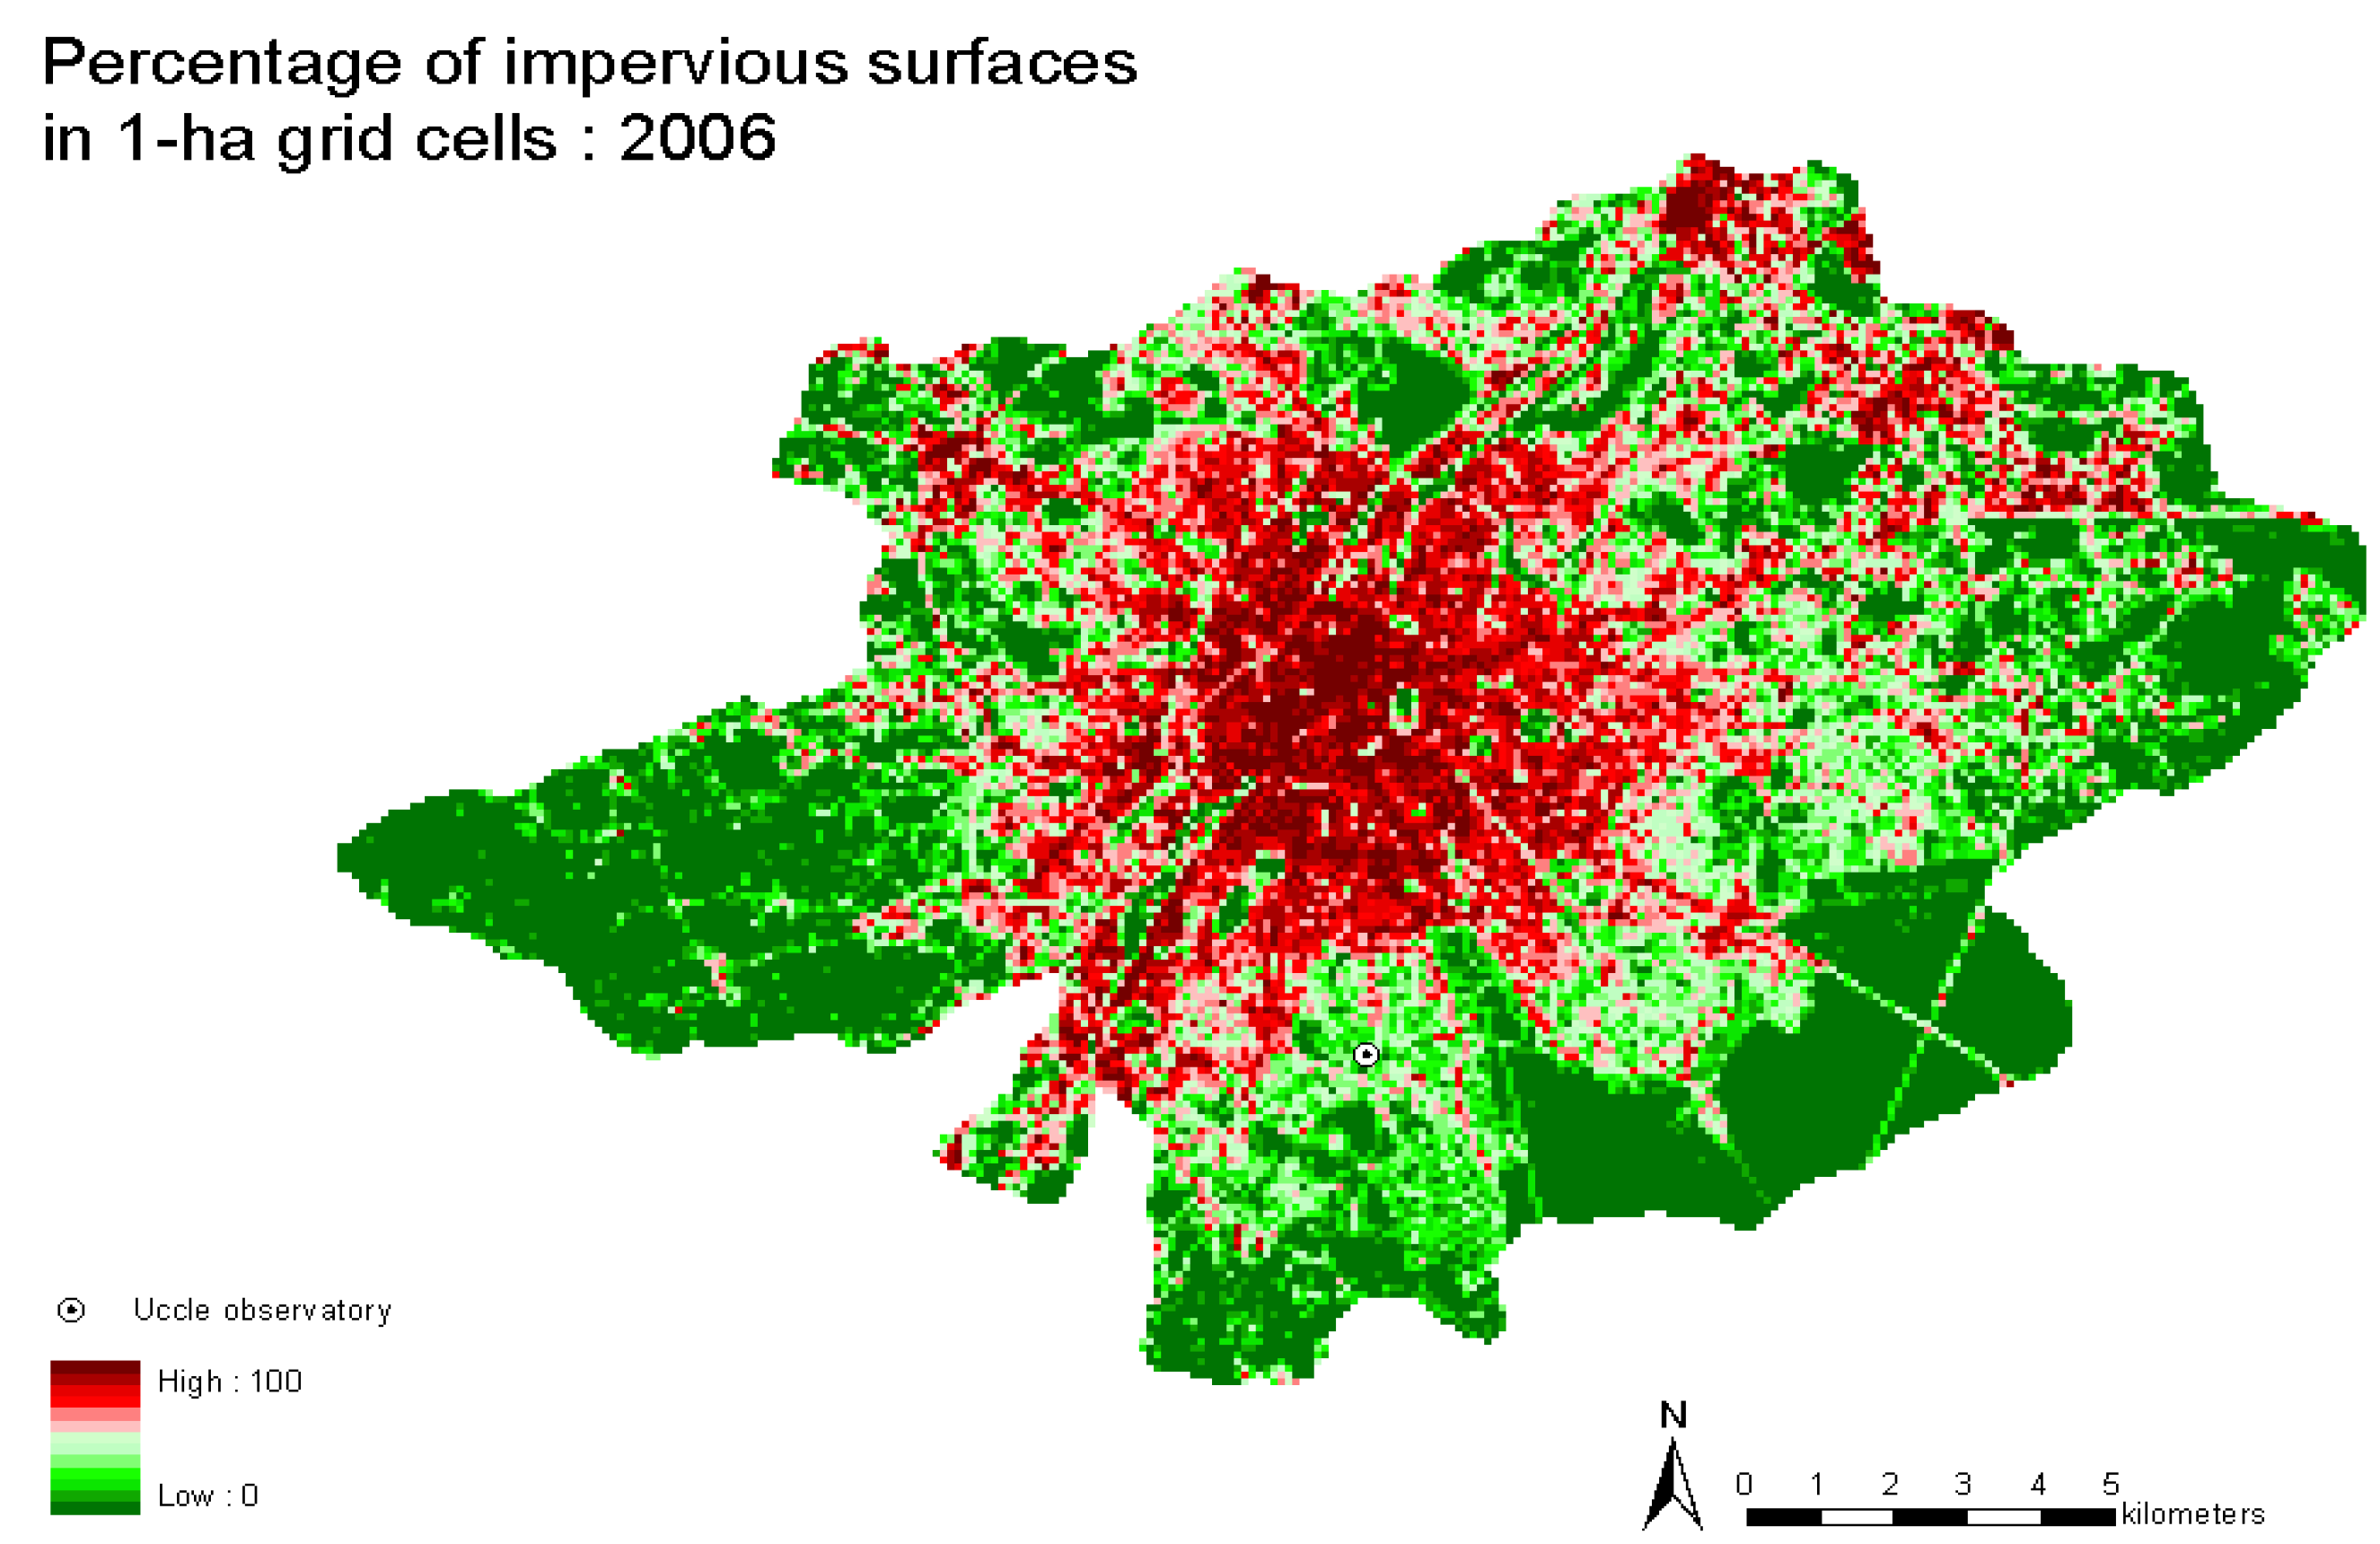
From 1980s to 2006: Vanhuysse et al. [12], first, conducted a binary classification of land use on the basis of a very-high-resolution satellite image (UrbOrtho, QuickBird) dating from 2006 (see Table 2). They used the software eCognition Professional v4.0, which allows a classification by region (object-oriented classification) based on fuzzy logic. The regions are assigned a class according to their degree of belonging to this class, as determined by the nearest neighbor algorithm and/or membership functions modeled by the user. The final result was made binary keeping only two classes: pervious and impervious surfaces. A grid mesh of 30 meters per side was generated by referring to the Landsat images, so that, each mesh covers exactly one Landsat pixel. Thus, applying the binary classification on the grid, they were able to extract the percentage of impervious surfaces in each cell. Then, they built a simple regression model between the percentage of impervious surfaces and different spectral variables derived from high-resolution Landsat images: NDVI (Normalized Difference Vegetation Index), PVI (Perpendicular Vegetation Index), SAVI (Soil Adjusted Vegetation Index), MSAVI2 (Second Modified Soil Adjusted Vegetation Index), and BI (Brightness Index). This model permitted to estimate the percentage of impervious surfaces for two previous dates (1993 and 1986) for which only high-resolution images (Landsat Thematic Mapper with 30 m resolution) are available. The final results indicate that the percentage of impervious surfaces has increased from 39% in 1985 to 47% in 2006 (see Figure 2).
Table 2. Synthesis of satellite images used for the second period.
YearImageSpatial resolution
1986Landsat TM30 m (B, V, R, PIR, MIR), 120 m (TIR)
1987Landsat TM30 m (B, V, R, PIR, MIR), 120 m (TIR)
1993Landsat TM30 m (V, R, PIR, MIR), 120 m (TIR)
2003Landsat ETM+30 m (B, V, R, PIR, MIR), 60 m (TIR), 15 m (pan)
YearImageSpatial resolution
2005Spot HRV20 m (V, R, PIR)
2003Spot HRG2.5 m (pan-supermode)
2006QuickBird2.4 m (B, V, R, PIR), 0.6 m (pan)
2004UrbOrtho0.6 m (B, V, R)
Figure 2. The percentage of impervious surfaces in the catchment basins including the Brussels Capital Region in 1955 (upper panel) and 2006 (lower panel). The black dot shows the Uccle observatory location.
Remotesensing 02 02773 g002aRemotesensing 02 02773 g002b

2.4. Atmospheric Data

The ERA-40 re-analysis [8] is produced by the European Centre for Medium-Range Weather Forecasts (ECMWF). This global dataset covers the period from September 1957 to August 2002 with a temporal resolution of 6 h and a spatial resolution of about 120 km for Western Europe. In order to increase the spatial resolution over Belgium, a dynamical downscaling method was applied using the numerical weather prediction limited area model ALADIN developed by the ALADIN international team [13].
A dynamical downscaling to 10 km resolution over Belgium is performed in two steps: (i) in the first step, the ALADIN model is coupled to the ERA-40 data and run at a resolution of 40 km on a domain encompassing most of Western Europe; (ii) the results are then used as initial conditions and lateral boundary conditions for a second downscaling run at 10 km resolution on a smaller domain over Belgium (see Hamdi et al. [7] for more details).

2.5. Land Surface Scheme

We use the externalized surface scheme of Météo-France SURFEX (SURFace EXternalisée) [14]. In SURFEX, each grid box is made of four adjacent surfaces: One for nature; one for urban areas; one for sea or ocean; and one for lake. Horizontal interaction does not exist between the different surface area tiles. The coverage of each of these surfaces is known through the global ECOCLIMAP database [15], which combines land cover maps and satellite information. During a model time step (300s), each surface grid box receives the upper air temperature, specific humidity, wind speed, pressure, total precipitation, long-wave radiation, and short-wave radiation.
Over urban surfaces, SURFEX includes the Town Energy Balance (TEB) [7] single-layer urban canopy module. Urban canopy is assumed to be an isotropic array of street canyons. The advantage is that relatively few individual surface energy balance evaluations need to be resolved, radiation interactions are simplified, and therefore computational time is kept low. TEB simulates heat and water exchanges and climate of three generic surfaces (roof, wall, and road), where heat transfers are computed through several layers of materials, generally four. Anthropogenic heat and vapor releases from buildings, vehicles and chimneys can also be added. For vegetated tiles, Noilhan and Planton [16] Interaction between Soil, Biosphere, and Atmosphere (ISBA) scheme is used. TEB is forced with literature-based surface thermal parameters and observed or simulated atmospheric and radiation data from above roof level. Despite the simplification hypotheses, offline simulations of TEB have been shown to accurately reproduce surface energy balance, canyon air temperature, and surface temperatures observed in dense urban areas: Vancouver and Mexico City [17], Marseille [18], Basel [19].

2.6. Model Parameter

The domain is 10 km × 10 km over the BCR, centered at the city center of Brussels. This small heterogeneous domain is overlaid over a 1 km resolution land cover classification provided by the ECOCLIMAP database. The land cover types contained in this domain are then aggregated into four tiles (Sea, Lake, Vegetation, and Urban) with the corresponding fractional coverage (0%, 0%, 53%, 47%) to be used as the contemporaneous land cover setting. SURFEX was run in one offline single column mode from 1 June 1960 to 31 August 1999 (40 yr), and the forcing parameters were derived from the downscaling of the ERA-40 described in Section 2.4 for the grid point closest to the BCR. These drivers are taken at a height of 50 m above ground level to ensure that they are representative of the local scale (102–104 m). For the vegetation tile, radiative, thermal, and soil properties (albedo, roughness length, emissivity, thermal inertia, leaf area index, etc.) are taken from the ECOCLIMAP database [15] and remain fixed through the simulation. For the urban tile, SURFEX uses only one urban land-use class as input, which is characterized by a set of parameters. In this study, geometrical, thermal, and radiative properties of roofs, walls, and roads were set to values representing a typical midsize European city (see Table 1 in Hamdi et al. [7]). Another important urban-related aspect is the anthropogenic heat. This term includes all heat emitted by human activities: traffic, release from industry, and release from residential buildings. Over the area presented in this study, releases from buildings have been shown to be the dominant component of anthropogenic heat [20]. In SURFEX, to mimic space heating, a fixed minimum internal building temperature of 19 °C is specified [8,17]. Detailed aspect of the simulation set up can be found in Hamdi et al. [7].

3. Results and Discussion

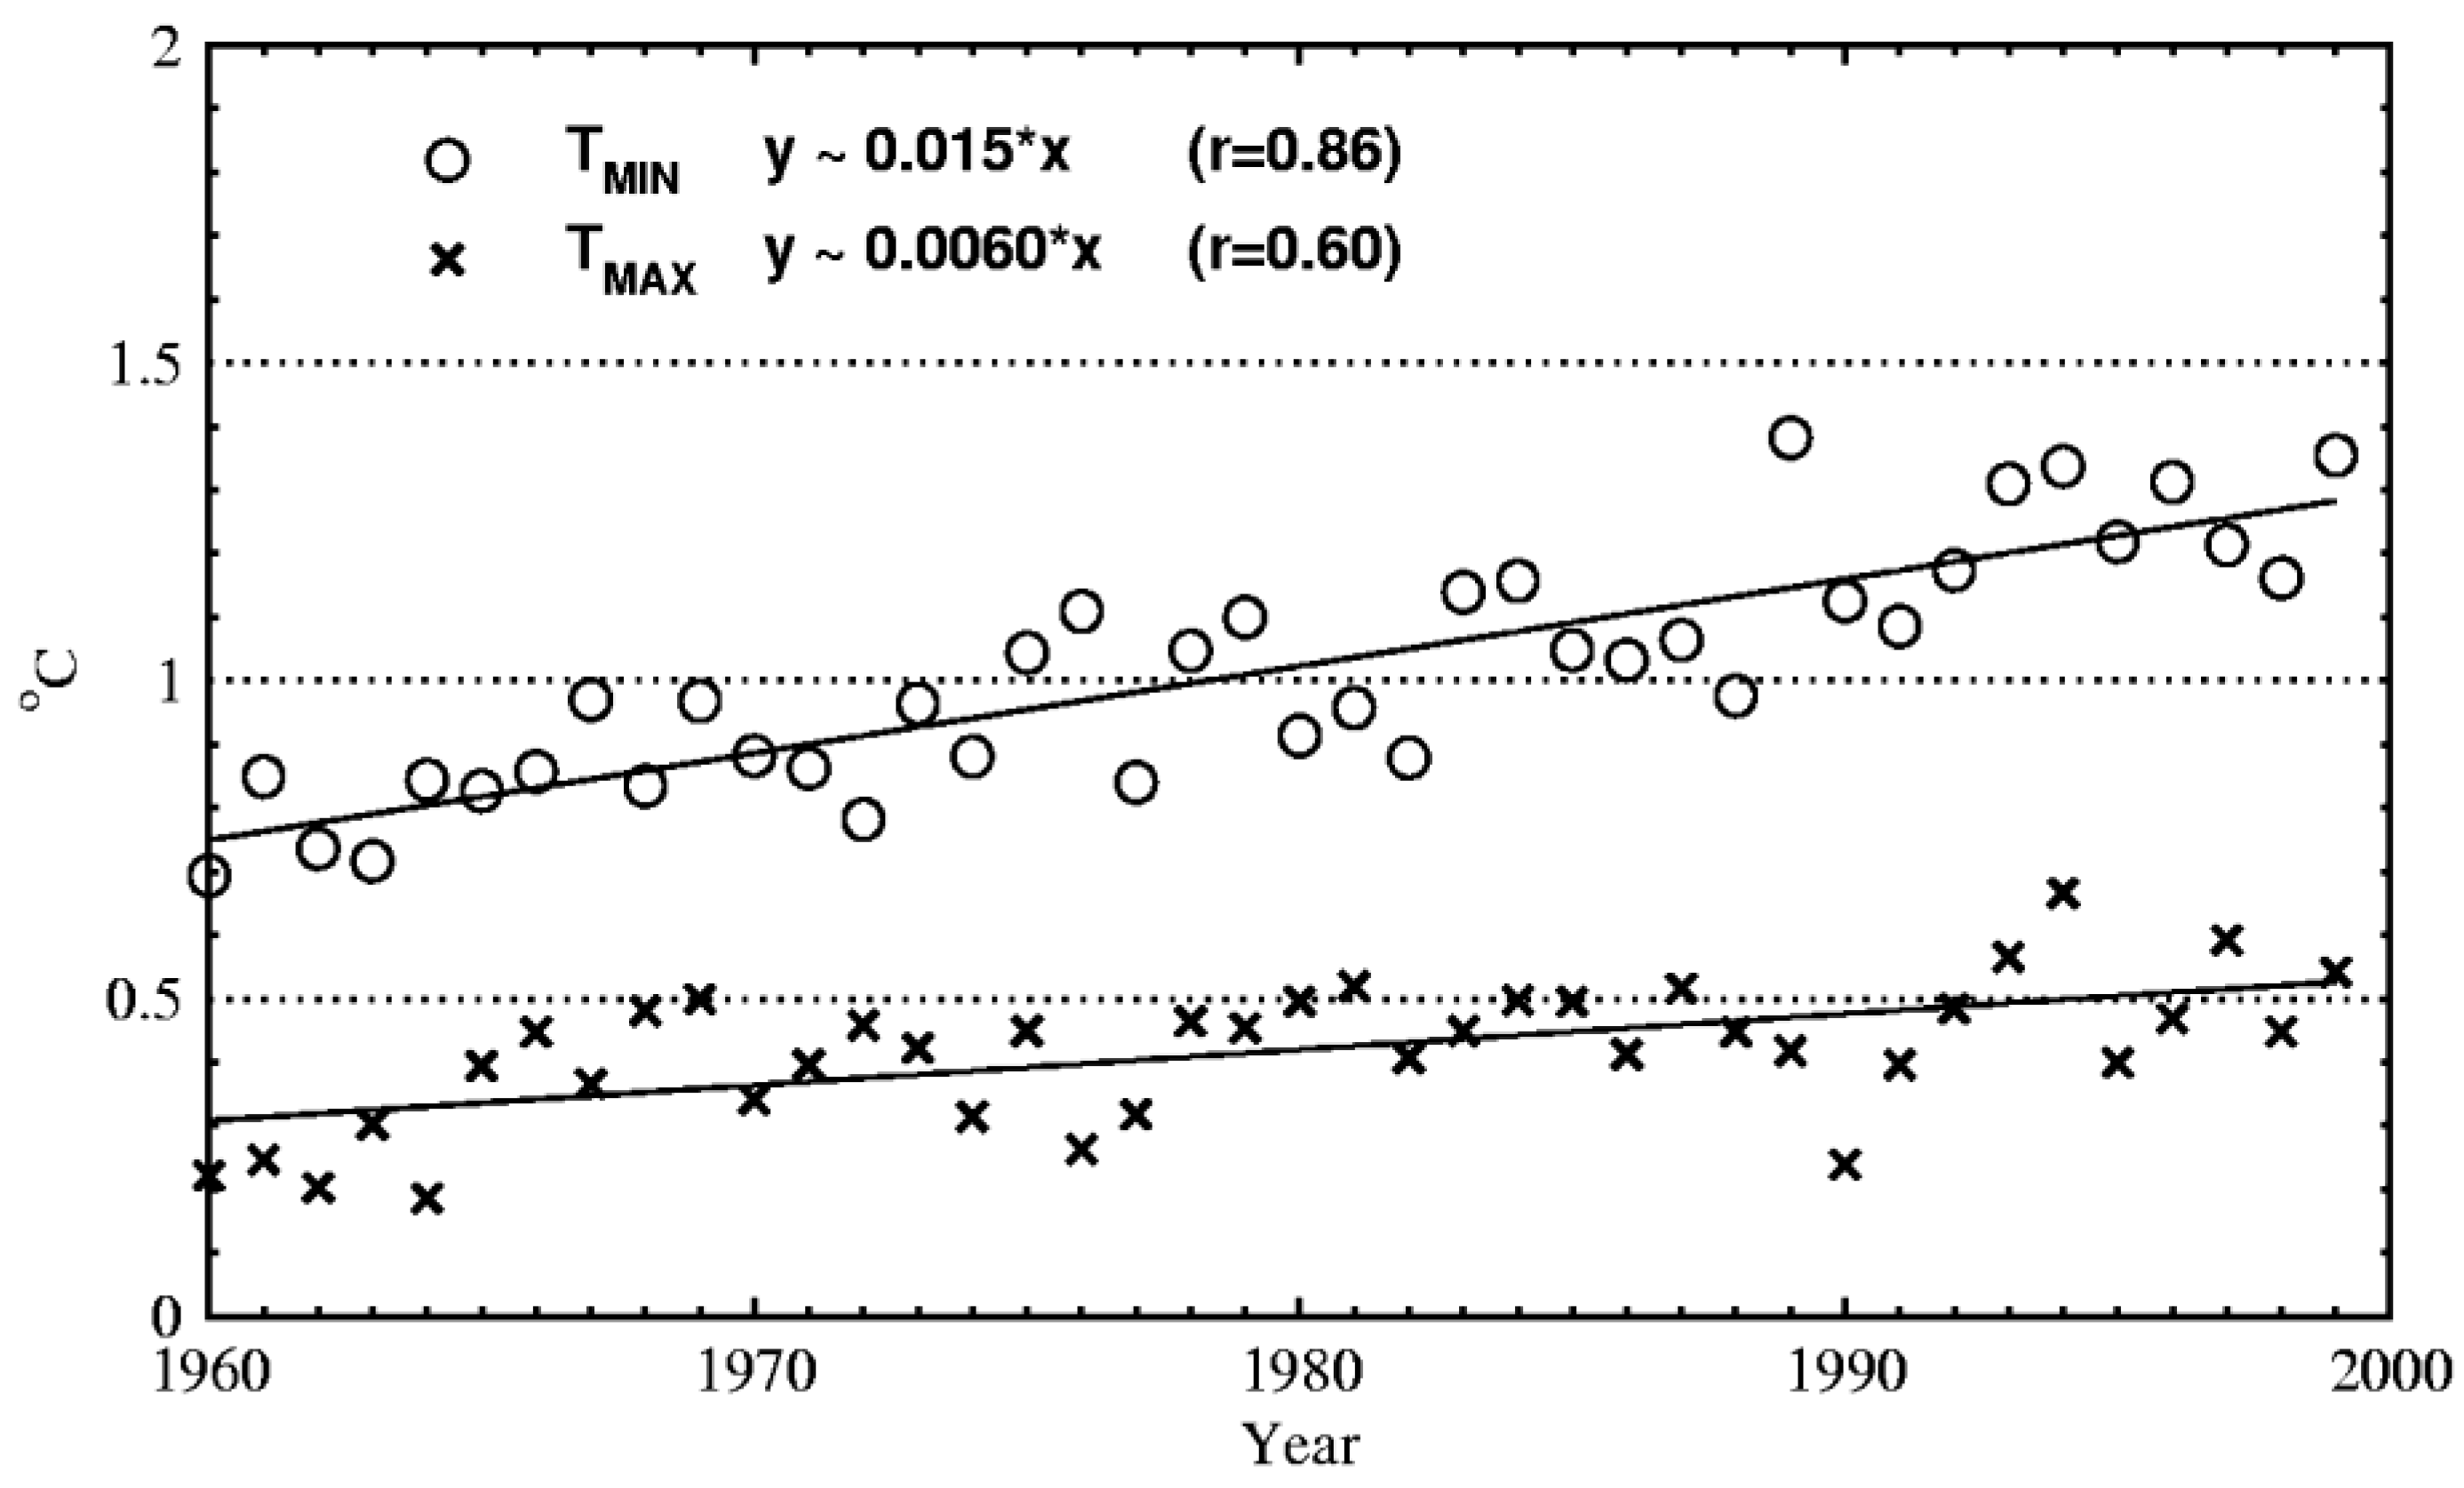
3.1. Urban Warming from Weather Stations

The urban heat island intensity is defined as the difference in temperature between urban and rural stations. Estimates of urban bias at the Uccle recording station, on maximum and minimum temperature, calculated during the summer of each year between 1955 and 2006, are plotted with the linear trends in Figure 3 (unfortunately, no data were found between 1972 and 1979).
Figure 3. The urban warming on minimum and maximum temperature estimated with ground-based weather stations with the linear trend, 1955–2006. r is the correlation coefficient. The mean is calculated during the summer.
Remotesensing 02 02773 g003
As indicated by Figure 3, the urban warming on minimum temperature is shown to be rising at a higher rate (2.85 times more) than on maximum temperature, with a linear trend of 0.19 °C and 0.06 °C (10 yr)−1, respectively. This result is consistent with previous work suggesting that the maximum temperature is substantially less affected by urbanization than the minimum temperature [21]. The increase of annual mean urban bias on minimum temperature may be attributed to: (i) The higher thermal inertia, which, in combination with lower albedo of urban surfaces (0.08–0.25), delays the cooling of the cities at night compared to rural areas; (ii) it can also be attributed to the limited evapotranspiration which prevents evaporative cooling of urban areas; (iii) during night hours, the contribution of anthropogenic heat can also influence long-term temperature trends.

3.2. Urban Warming from Model Simulations

To isolate effects of urbanization on local near surface climate conditions, we calculate the difference between two model integrations: (i) “the rural” scenario representing a hypothetical situation with no urban areas inside the Brussels Capital Region domain and the “urban” scenario, which represented the climate in the presence of urban areas using the measured historical changes of surface cover fractions. For this run, the surface cover fractions are updated each year using a linear interpolation. The use of the land surface model in an offline mode does not account for atmospheric feedback and therefore allows isolation of the effects of landscape difference on local near surface climate conditions.

3.2.1. Evaluation of the Model

To evaluate model performance, a comparison is made between the urban run and the routine observations of the Uccle ground station. Table 3 presents the statistics that quantify model performance for daily maximum (TMAX) and minimum (TMIN) temperature using statistical measures based on formulas by Willmott [22]. The 2-m temperatures predicted by the urban run are consistent with meteorological observations, with a correlation coefficient of 0.96 and an index of agreement of 0.97 for TMAX and TMIN. The systematic root mean square error (RMSESYS), which should account for physical processes that the model does not routinely simulate well, is small compared to the unsystematic root mean square error (RMSEUNSYS). The proportions of systematic errors in the model are 26% and 11% for TMAX and TMIN respectively. The minimum temperature is better simulated by the model with a minor negative bias of 0.43 °C and RMSESYS of 0.66 °C against 1.12 °C and 1.38 °C for maximum temperature.
Table 3. Performance statistics for daily maximum (TMAX) and minimum (TMIN) temperature based on formulas by Wilmott [22]. RMSESYS and RMSEUNSYS are the systematic and unsystematic root mean square error, respectively.
CorrelationIndex of agreementBias (°C)RMSESYS (°C)RMSEUNSYS (°C)
TMAX0.960.971.121.382.33
TMIN0.960.97-0.430.661.89

3.2.2. Urban Warming

Model simulations show that the urban warming on minimum temperature is rising at a higher rate (2.5 times, observed 2.85 more) than on maximum temperature, with a linear trend of 0.15° (observed 0.19 °C) and 0.06 °C (observed 0.06 °C) (10 yr)−1, respectively. Figure 4 shows that the model is able to capture all the observed characteristics of urban warming, even if:
  • We consider BCR as a lumped urban volume.
  • The entire BCR is composed of one homogeneous material comprising uniform thermophysical properties, irrespective of spatial variability.
  • Urbanization was assessed only by measuring changes of the impervious surface area (percent) in the BCR.
Figure 4. The urban warming on minimum and maximum temperature estimated with satellite data with the linear trend, 1960–1999. r is the correlation coefficient. The mean is calculated during the summer.
Remotesensing 02 02773 g004

4. Conclusions

In this study, the urban heat island effects on the temperature time series of Uccle, during summer months, was estimated using both ground-based weather stations and remote sensing imagery, combined with a land surface scheme. The model-based estimate of urban warming was based on calculating the difference between two model integrations: (i) “the rural” scenario representing a hypothetical situation with no urban areas inside the Brussels Capital Region domain and the “urban” scenario, which represented the climate in the presence of urban areas using the measured changes of surface cover fractions. Results of our simulations are compatible with estimates of urban warming based on weather stations. However, exact compatibility is not possible because, with the 10 km horizontal resolution of the climate drivers used to run the land surface scheme, we are not able to replicate the micrometeorology in the required detail.
The new technique presented in this study is a useful tool in estimating the urban heat island contamination in long time series, countering the drawbacks of an observational approach. It would be very simple and useful to apply this research method to other cities. Furthermore, because of its local character, the results of this study will be particularly helpful for planners in developing scenarios for future land cover changes.

Acknowledgements

We thank S. Vanhuysse for providing us the data of the surface cover fraction. These data are obtained in the frame of the project 2008-02-AL. The author is very grateful to G. Demarée for fruitful discussions about the history of weather stations.

References

  1. Jones, P.D.; Lister, D.H.; Li, Q. Urbanization effects in large-scale temperature records, with an emphasis on China. J. Geophys. Res. 2008, 113. [Google Scholar] [CrossRef]
  2. Jones, P.D.; Lister, D.H. The urban heat island in central London and urban-related warming trends in Central London since 1900. Weather 2009, 64, 323–327. [Google Scholar] [CrossRef]
  3. Fricke, R.; Wolff, E. The MURBANDY project: Development of land use and network databases for the Brussels area (Belgium) using remote sensing and aerial photography. Int. J. Appl. Earth Obs. Geoinf. 2002, 4, 33–50. [Google Scholar] [CrossRef]
  4. Yuan, F.; Bauer, M.E. Comparison of impervious surface area and normalized difference vegetation index as indicators of surface urban heat island effects in Landsat imagery. Remote Sens. Environ. 2007, 106, 375–386. [Google Scholar] [CrossRef]
  5. Huang, L.; Li, J.; Zhao, D.; Zhu, J. A fieldwork study on the diurnal changes of urban microclimate in four types of ground cover and urban heat island of Nanjing, China. Build. Environ. 2008, 43, 7–17. [Google Scholar] [CrossRef]
  6. Shouraseni, S.R.; Yuan, F. Trends in extreme temperatures in relation to urbanization in twin cities metropolitan area, Minnesota. J. Appl. Meteor. Clim. 2009, 48, 669–679. [Google Scholar]
  7. Hamdi, R.; Deckmyn, A.; Termonia, P.; Demarée, J.A.; Baguis, P.; Vanhuysse, S.; Wolff, E. Effects of historical urbanization in the Brussels Capital Region on surface air temperature time series: a model study. J. Appl. Meteorol. Climatol. 2009, 48, 2181–2196. [Google Scholar] [CrossRef]
  8. Masson, V. A physically-based scheme for the urban energy budget in atmospheric models. Bound.-Layer Meteor. 2000, 94, 357–397. [Google Scholar] [CrossRef]
  9. Uppala, S.M.; KÅllberg, P.W.; Simmons, A.J.; Andrae, U.; Bechtold, V.C.; Fiorino, M.; Gibson, J.K.; Haseler, J.; Hernandez, A.; Kelly, G.A.; et al. The ERA-40 re-analysis. Quart. J. Roy. Meteor. Soc. 2005, 131, 2961–3012. [Google Scholar] [CrossRef]
  10. Peterson, T.C.; Daan, H.; Jones, P.D. Initial selection of a GCOS surface network. Bull. Amer. Meteor. Soc. 1997, 78, 2145–2152. [Google Scholar] [CrossRef]
  11. Fujibe, F. Detection of urban warming in recent temperature trends in Japan. Int. J. Climatol. 2009, 29, 1811–1822. [Google Scholar] [CrossRef]
  12. Vanhuysse, S.; Depireux, J.; Wolff, E. Etude de l’évolution de l’imperméabilisation du sol en région de Bruxelles-Capitale; IGEAT, Université Libre de Bruxelles: Brussels, Belgium, 2006; p. 60. [Google Scholar]
  13. ALADIN International Team. The ALADIN project: Mesoscale modelling seen as a basic tool for weather forecasting and atmospheric research. WMO Bull. 1997, 46, 317–324. [Google Scholar]
  14. Le Moigne, P. SURFEX Scientific Documentation; Note de centre (CNRM/GMME), Météo-France: Toulouse, France, 2009; p. 211. [Google Scholar]
  15. Masson, V.; Champeaux, J.L.; Chauvin, F.; Meriguet, C.; Lacaze, R. A global database of land surface parameters at 1 km resolution in meteorological and climate models. J. Climate 2003, 16, 1261–1282. [Google Scholar] [CrossRef]
  16. Noilhan, J.; Planton, S. A simple parameterization of land surface processes for meteorological models. Mon. Wea. Rev. 1989, 117, 536–549. [Google Scholar]
  17. Masson, V.; Grimmond, C.S.B.; Oke, T.R. Evaluation of the Town Energy Balance (TEB) scheme with direct measurements from dry districts in two cities. J. Appl. Meteor. 2002, 41, 1011–1026. [Google Scholar]
  18. Lemonsu, A.; Grimmond, C.S.B.; Masson, V. Modeling the surface energy balance of an old Mediterranean city core. J. Appl. Meteor. 2004, 43, 312–327. [Google Scholar] [CrossRef]
  19. Hamdi, R.; Masson, V. Inclusion of a drag approach in the Town Energy Balance (TEB) scheme: Offline 1-D evaluation in a street canyon. J. Appl. Meteor. Clim. 2008, 47, 2627–2644. [Google Scholar] [CrossRef]
  20. Van Weverberg, K.; De Ridder, K.; Van Rompaey, A. Modeling the contribution of the Brussels Heat Island to a long temperature time series. J. Appl. Meteor. Clim. 2008, 47, 976–990. [Google Scholar] [CrossRef]
  21. Landsberg, H.E. The Urban Climate; International Geophysics Series; Academic Press: New York, NY, USA, 1981; Volume 28, p. 275. [Google Scholar]
  22. Wilmott, C.T. Some comments on the evaluation of model performance. Bull. Amer. Meteor. Soc. 1982, 63, 1309–1313. [Google Scholar] [CrossRef]

