Article

Spectrally Segmented-Enhanced Neural Network for Precise Land Cover Object Classification in Hyperspectral Imagery

1
Department of Computer Science and Engineering, Hajee Mohammad Danesh Science and Technology University, Dinajpur 5200, Bangladesh
2
School of Information Technology, Deakin University, Geelong 3220, Australia
3
School of Engineering & Technology, Central Queensland University Australia, 400 Kent Street, Sydney 2000, Australia
*
Author to whom correspondence should be addressed.
Remote Sens. 2024, 16(5), 807; https://doi.org/10.3390/rs16050807
Submission received: 10 January 2024 / Revised: 22 February 2024 / Accepted: 22 February 2024 / Published: 25 February 2024

Abstract

:
The paradigm shift brought by deep learning in land cover object classification in hyperspectral images (HSIs) is undeniable, particularly in addressing the intricate 3D cube structure inherent in HSI data. Leveraging convolutional neural networks (CNNs), despite their architectural constraints, offers a promising solution for precise spectral data classification. However, challenges persist in object classification in hyperspectral imagery or hyperspectral image classification, including the curse of dimensionality, data redundancy, overfitting, and computational costs. To tackle these hurdles, we introduce the spectrally segmented-enhanced neural network (SENN), a novel model integrating segmentation-based, multi-layer CNNs, SVM classification, and spectrally segmented dimensionality reduction. SENN adeptly integrates spectral–spatial data and is particularly crucial for agricultural land classification. By strategically fusing CNNs and support vector machines (SVMs), SENN enhances class differentiation while mitigating overfitting through dropout and early stopping techniques. Our contributions extend to effective dimensionality reduction, precise CNN-based classification, and enhanced performance via CNN-SVM fusion. SENN harnesses spectral information to surmount challenges in “hyperspectral image classification in hyperspectral imagery”, marking a significant advancement in accuracy and efficiency within this domain.

1. Introduction

Hyperspectral imagery (HSI) has revolutionized the field of remote sensing by combining the benefits of subdivisional spectroscopy and imaging technology. It enables the capture of spatial distribution information along with hundreds or even thousands of contiguous narrow spectral bands, offering a unique perspective on surface targets [1,2]. Owing to its inherent advantages in distinguishing unique land-cover categories and different objects, hyperspectral imaging (HSI) has gained widespread usage across a variety of domains. These applications encompass a wide spectrum of disciplines, including but not limited to military defense, atmospheric science, urban planning, vegetation ecology, and environmental surveillance [3,4,5,6]. Despite its remarkable capabilities, HSI classification poses significant challenges, including interference from redundant spectral information, the limited availability of labeled samples, and the presence of high intra-class variability. Addressing these obstacles and making advancements in hyperspectral image classification techniques offer significant potential for realizing the complete capabilities of HSI data analysis [7].
In the field of HSI classification, traditional methods have predominantly relied on spectral information, often neglecting the effective integration of spatial data. While techniques like band selection, sparse representation classifiers, and principal component analysis (PCA) [8] have been utilized to extract discriminative features, they encountered notable limitations in feature extraction and robustness. Specifically, PCA, despite its widespread use, suffers from several drawbacks, including its assumption of linearity and orthogonality in data distribution, which may not hold true in complex real-world scenarios, potentially overlooking subtle but relevant information crucial for accurate classification [9]. However, traditional machine learning algorithms like random forest [10] and SVM [11], while widely used, have limitations in handling non-linear data and complex decision boundaries. Random forest may struggle with capturing intricate spectral–spatial relationships, while SVM’s performance may deteriorate with high-dimensional feature spaces. Nonetheless, the advent of deep learning has spurred significant interest in HSI classification, particularly with convolutional neural networks (CNNs). Various CNN-based architectures have demonstrated remarkable performance by simultaneously leveraging both spectral and spatial information [12]. This integration of advanced deep learning techniques presents a promising avenue for enhancing the accuracy of classification in hyperspectral imagery analysis.
As previously discussed, the formidable challenge posed by the high dimensionality of HSI data underscores the necessity of dimensionality reduction as a crucial preprocessing step to mitigate data redundancy and complexity. In the realm of HSI classification, two primary approaches for dimensionality reduction exist: feature extraction and band selection. Feature extraction techniques such as kernel PCA (KPCA) [13], PCA, linear discriminant analysis (LDA) [14], and Fisher’s linear discriminant analysis (FLDA) [15] aim to optimize between-class separation, whether leveraging label information or not. However, it is important to note the limitations of minimum noise fraction (MNF) [16], another commonly used technique for dimensionality reduction. While MNF is effective in certain contexts, it may not be suitable for HSI classification due to its inherent assumptions and limitations. MNF assumes that noise in the data is uncorrelated across bands, which may not hold true for HSI datasets characterized by complex spectral and spatial correlations. Additionally, MNF may not effectively capture the subtle spectral variations crucial for accurate classification in HSI data [17]. Therefore, while MNF may be a useful technique in some scenarios, its effectiveness for HSI classification is limited by these factors. Conversely, band selection algorithms, while effective at selecting informative band subsets directly from the original band space of HSIs, often struggle to capture the intricate spectral–spatial correlations inherent in HSI data. Despite the application of popular feature selection methods like chi-squared, select K best, and mutual information feature selection [18,19], their efficacy for HSI classification may be limited by the inherent challenges in capturing the nuanced spectral and spatial properties unique to HSI datasets.
In the study covered in [20], the conventional low-rank representation (LRR) method for HSI classification has been improved and modified. This paper presents a locality-and-structure-regularized LRR approach that combines spectral and spatial data to analyze local pixel similarities. The authors of [21] also presented a new method for classifying HSI using spectral gradients in another paper. They were able to efficiently collect both geographical information and spectral features by utilizing spectral gradients in conjunction with the random forest approach. The spectral characteristics were then fused together using multi-scale fusion so that support vector machines (SVMs) could be used for classification. Furthermore, the study in [22] introduced deep support vector machines (DSVMs) for HSI classification, outperforming other cutting-edge algorithms, including different versions of the conventional SVM. However, spatial features play a vital role in enhancing the classification performance. To alleviate the spatial redundancy that frequently arises when using a regular 3D CNN with HSI, a 3D octave CNN was developed in the work reported in [23].
In a separate investigation [24], a novel technique incorporating 3D CNNs was introduced, integrating both spectral and spatial data to bolster classification accuracy. Similarly, in [25], a model utilizing 3D CNNs was proposed for HSI classification, following a similar methodology. Initially, the HSI dataset is segmented into small, overlapping 3D patches and processed with a 3D kernel function across contiguous spectral bands to produce 3D feature maps. Subsequent research has seen a surge in studies employing either 2D CNNs or 3D CNNs for HSI analysis [26]. However, utilizing 2D CNNs or 3D CNNs for HSI classification poses several challenges. While 2D CNN architectures excel in capturing spatial details, they often struggle to extract informative or distinguishing features from spectral dimensions. Conversely, although 3D CNNs are presumed to offer enhanced performance, they come with increased computational demands due to extensive 3D convolution operations [27]. Deep 3D CNNs necessitate a larger dataset for training, yet publicly accessible HSI datasets provide limited samples. Additionally, numerous prevalent 3D CNN-based methods rely on stacked 3D convolutions, complicating the direct minimization of estimation loss using such nonlinear structures [28]. To address these challenges, many researchers have proposed hybrid approaches. For instance, in [29], a hybrid model termed HybridSN was introduced, merging 2D-CNN with 3D-CNN to effectively extract both spectral and spatial features from HSI data, leading to improved classification accuracy. In another study, the authors developed a wavelet-based 2D CNN named SpectralNET [30] for extracting spectral–spatial features from HSI. They utilized a four-level wavelet decomposition with 2D convolutions by concatenating the upper levels with previously decomposed features and applying average pooling after convolution operations. However, due to the increased number of hidden layers during wavelet transformation, computational costs are slightly higher, and performance diminishes with fewer training samples.
In recent studies, researchers have recognized the benefits of multi-scale spatial features in enhancing the accuracy of semantic segmentation in regular RGB images [31]. Models such as PSPnet [32] and the Inception Module have successfully fused features at different scales to capture detailed information and improve overall performance. Influenced by the dilated residual network (DRN) [33], their investigation extended this notion through the introduction of the spectral dilated convolutions (SDCs) concept [34], aiming to enhance spectral coverage. In a different study, a novel Tri-CNN [35] approach enabled the extraction of multi-scale spectral features, thereby enhancing the classification accuracy and performance of HSI analysis. It introduced a novel three-branch CNN architecture aimed at enhancing classification performance. However, it is worth noting some limitations. Firstly, the reliance on PCA-based dimensionality reduction may restrict the model’s ability to capture all relevant spectral information, potentially leading to the loss of discriminative features. Additionally, the three-branch convolution structure introduces complexity, as all branches are applied to the reduced data simultaneously. This approach may hinder effective feature extraction, as different segments of data could benefit from distinct processing strategies. Hence, exploring alternative methods wherein branches are applied to different data segments individually could potentially improve feature extraction and classification accuracy. By incorporating spectrally segmented dimensionality reduction techniques, the issue of optimization and reduced time costs associated with HSI analysis can be addressed. Partitioning the HSI data into subsets based on spectral characteristics allows for an effective reduction in high dimensionality while preserving informative features [36]. This approach not only enhances the efficiency of subsequent classification processes but also improves the overall effectiveness of HSI analysis.
The proposed model introduces a comprehensive approach to enhance HSI classification, focusing on three key components aimed at improving accuracy and effectiveness. Firstly, we implement spectrally segmented dimensionality reduction through factor analysis (FA), leveraging the inherent strengths of FA for superior performance in handling the complex spectral characteristics of HSI data. Factor analysis excels in capturing the underlying structure of high-dimensional data, making it particularly well-suited for extracting informative features relevant to land cover classification. By segmenting the data and applying FA, we not only reduce dimensionality but also ensure the inclusion of top informative features from diverse segments, enhancing the model’s ability to capture crucial spectral nuances. Moving on to the segmentation-based multibranch CNNs, we recognize CNNs’ inherent capability as feature extractors. However, in scenarios with limited training samples, CNNs may struggle to extract features comprehensively from various perspectives. To address this limitation, we deploy a multibranch CNN architecture with distinct branches structured to extract spatial and spectral features from different data weights. This innovative approach enables the extraction of detailed features even with fewer training samples, enhancing the model’s robustness and adaptability to diverse HSI datasets. Lastly, the integration of support vector machines (SVMs) into the final classification stage leverages SVMs’ proficiency in creating non-linear decision boundaries, complementing CNNs’ feature extraction capabilities. SVMs are renowned for their robustness and effectiveness in handling complex data, making them an ideal choice for classification tasks. By combining CNNs with SVMs, we harness the strengths of both models, resulting in improved classification accuracy. Additionally, the incorporation of dropout as a regularization strategy mitigates overfitting and enhances the model’s generalization ability, ensuring reliable performance on novel instances.
Our proposed model, the spectrally segmented-enhanced neural network (SENN), represents a significant advancement in precision land cover classification. By synergistically combining spectrally segmented dimensionality reduction, segmentation-based multibranch CNNs, and CNN-SVM fusion, our model effectively addresses the inherent challenges of HSI data analysis. SENN offers a promising solution for diverse landscapes and scenarios, particularly in the context of agricultural land cover object classification, by retaining crucial features and integrating spectral–spatial data. Notably, the SENN’s primary innovation lies in its effective mitigation of dimensionality through spectrally segmented dimensionality reduction while maintaining crucial features, essential for handling the complexity of agricultural land cover object classification. Moreover, the fusion of CNNs and support vector machines (SVMs) enhances class differentiation, contributing to improved accuracy in classification tasks. Techniques such as dropout and early stopping are incorporated to alleviate overfitting issues, further enhancing the overall performance and robustness of our proposed model. The primary achievements of our study can be outlined as follows:
  • Spectrally segmented dimensionality reduction: CNNs are adept at extracting significant features from unprocessed image data, facilitating the effective representation of intricate information. These techniques effectively reduce the data’s high dimensionality while preserving the most informative features. This step aims to enhance the subsequent classification process in terms of efficiency and effectiveness.
  • Parallel multi-resolution CNN model: The second objective is to implement a multi-resolution CNN model for classification, utilizing the extracted informative features. Utilizing the CNN architecture, this model will harness both spectral and spatial data inherent in hyperspectral imagery to acquire intricate characteristics, leading to precise classification outcomes for agricultural landscapes. By capitalizing on the hierarchical representations learned by the CNN model, the overall classification accuracy is expected to improve.
  • Final classification using SVM: CNNs excel at automatically extracting meaningful features from raw image data, enabling effective representation of complex information. In combination with SVMs, which create non-linear decision boundaries, class separation is enhanced, resulting in improved classification accuracy. The integration of CNNs and SVMs provides a flexible framework for image analysis tasks. Throughout the training process, a range of strategies is employed, encompassing techniques such as “dropout”. Regularization using dropout randomly deactivates neurons during training, helping the network learn more robust features and avoid overreliance on individual neurons.

2. Methodology

The integration of spectral and spatial data is achieved through a multi-resolution CNN, drawing inspiration from the simplified iteration of the conventional 3D CNN architecture [37]. Recent strides in deep learning emphasize the effectiveness of hybrid models that fuse 3D and 2D CNNs, demonstrating their efficacy in extracting intricate features from hyperspectral datasets. By incorporating both spectral and spatial dimensions, these models enhance network performance, enabling a more comprehensive analysis of high-dimensional hyperspectral images and addressing challenges within image processing.

2.1. Background of SENN

Most contemporary models designed for HSI classification predominantly adopt either a 2D-CNN structure [25] or a 3D-CNN framework [27]. However, while the 2D-CNN excels at capturing spatial information, it tends to overlook the valuable spectral intricacies inherent in HSI data [38]. On the other hand, the 3D-CNN strives to simultaneously extract both spatial and spectral information; however, this approach might not effectively extract features. To overcome these limitations, an innovative strategy is presented: a multi-resolution feature fusion network. This novel network amalgamates a spectral feature extractor and a spatial feature extractor. Through the integration of these components, the network profoundly augments the extraction of both spectral and spatial features, resulting in significant enhancements in the comprehensive feature representation and the precision of HSI classification.
To address the challenges associated with HSI classification, a combination of spectrally segmented dimensionality reduction and a multiple-layer CNN model is proposed. HSI data are represented as a high-dimensional cube denoted as X   R P × Q × B , where P and Q stand for the measures of spatial domain and B signifies the count of the spectral bands. Each pixel in the hyperspectral cube is represented by a vector X i R B , where i denotes the pixel index.
The first key aspect of SENN involves spectrally segmented dimensionality reduction techniques. These techniques partition the HSI data into subsets based on spectral characteristics, effectively reducing high dimensionality while preserving informative features. Let R 1 , R 2 , R 3 R K denote the spectrally segmented subsets obtained from the original hyperspectral cube X. Each subset RK is represented by a reduced-dimensional matrix Y i R P × Q × R , where R is the reduced dimensionality obtained after the segmentation process. The dimensionality reduction is typically achieved using methods such as FA.
The second aspect of SENN involves the implementation of a multiple-layer CNN model for classification. The CNN model takes as input the reduced-dimensional subsets Y i obtained from the spectrally segmented dimensionality reduction. The CNN structure encompasses convolutional layers, identified as CONV3D and CONV2D, carrying out the extraction of spatial and spectral features. These layers apply filters with learnable parameters to capture spatial and spectral patterns. The output of the CNN model is a classification layer that produces the predicted class labels for each pixel. The mathematical expressions associated with the SENN model include the operations performed in the convolution layers [26]. For example, a 3D convolution operation can be represented as:
Z k = φ W k × Y k + b k ,
where Zi represents the output feature maps after the convolution operation, Wi denotes the learnable weights, bi is the bias term, and φ represents the activation function, often exemplified by ReLU. Similarly, a 2D convolution operation could be formulated as follows [26]:
Z k = φ W k × Y k + b k ,
where Z′i represents the output feature maps after the 2D convolution, W′i denotes the learnable weights, b′i denotes the bias term. Additionally, pooling operations, such as max pooling or average pooling, can decrease the size of the feature maps in terms of spatial information. This operation can be mathematically represented as [30]:
P Z k = M a x Z k ,
where P(Zi) represents the pooled feature maps obtained from Zi using the max pooling operation. Furthermore, fully connected layers in the CNN model can be represented as [39]:
A = φ V     F   +   c ,
where A denotes the output activation, V represents the learnable weights, F represents the input features, c is the bias term, and φ represents the activation function.
The integration of mathematical expressions and equations within the SENN model provides a comprehensive understanding of the intricate operations and transformations conducted within each branch, offering insights into its functionality. By synergizing spectrally segmented dimensionality reduction with multibranch CNN architecture, the SENN model aims to elevate HSI classification accuracy by adeptly capturing both spectral and spatial features. Initially, the HSI data undergo segmentation based on spectral correlation, dividing it into distinct segments to enable more targeted analysis. Subsequently, the application of the dimensionality reduction technique FA to each segmented subset effectively reduces data complexity while preserving essential characteristics. This segmented approach ensures tailored processing for each subset, optimizing the extraction of informative features vital for accurate classification. In parallel, the SENN model incorporates multiple branches within the CNN architecture, each endowed with diverse convolution kernels and weights to comprehensively extract features. By diversifying the feature extraction process across multiple branches, the model can effectively capture a broader range of spectral and spatial characteristics inherent in the HSI data. Following the extraction of spectral–spatial features, the data are passed to the fully connected layers. Notably, a strategic decision is made to replace the last dense layer with an SVM classifier, enhancing the model’s capacity to discern subtle patterns and nuances within the HSI data. This integration is particularly effective as SVMs excel in creating non-linear decision boundaries, thereby complementing the feature extraction capabilities of the CNN architecture. The synergy between CNN and SVM fosters improved classification accuracy and performance, rendering the SENN model a valuable asset for HSI analysis in diverse applications.

2.2. SENN Model Description

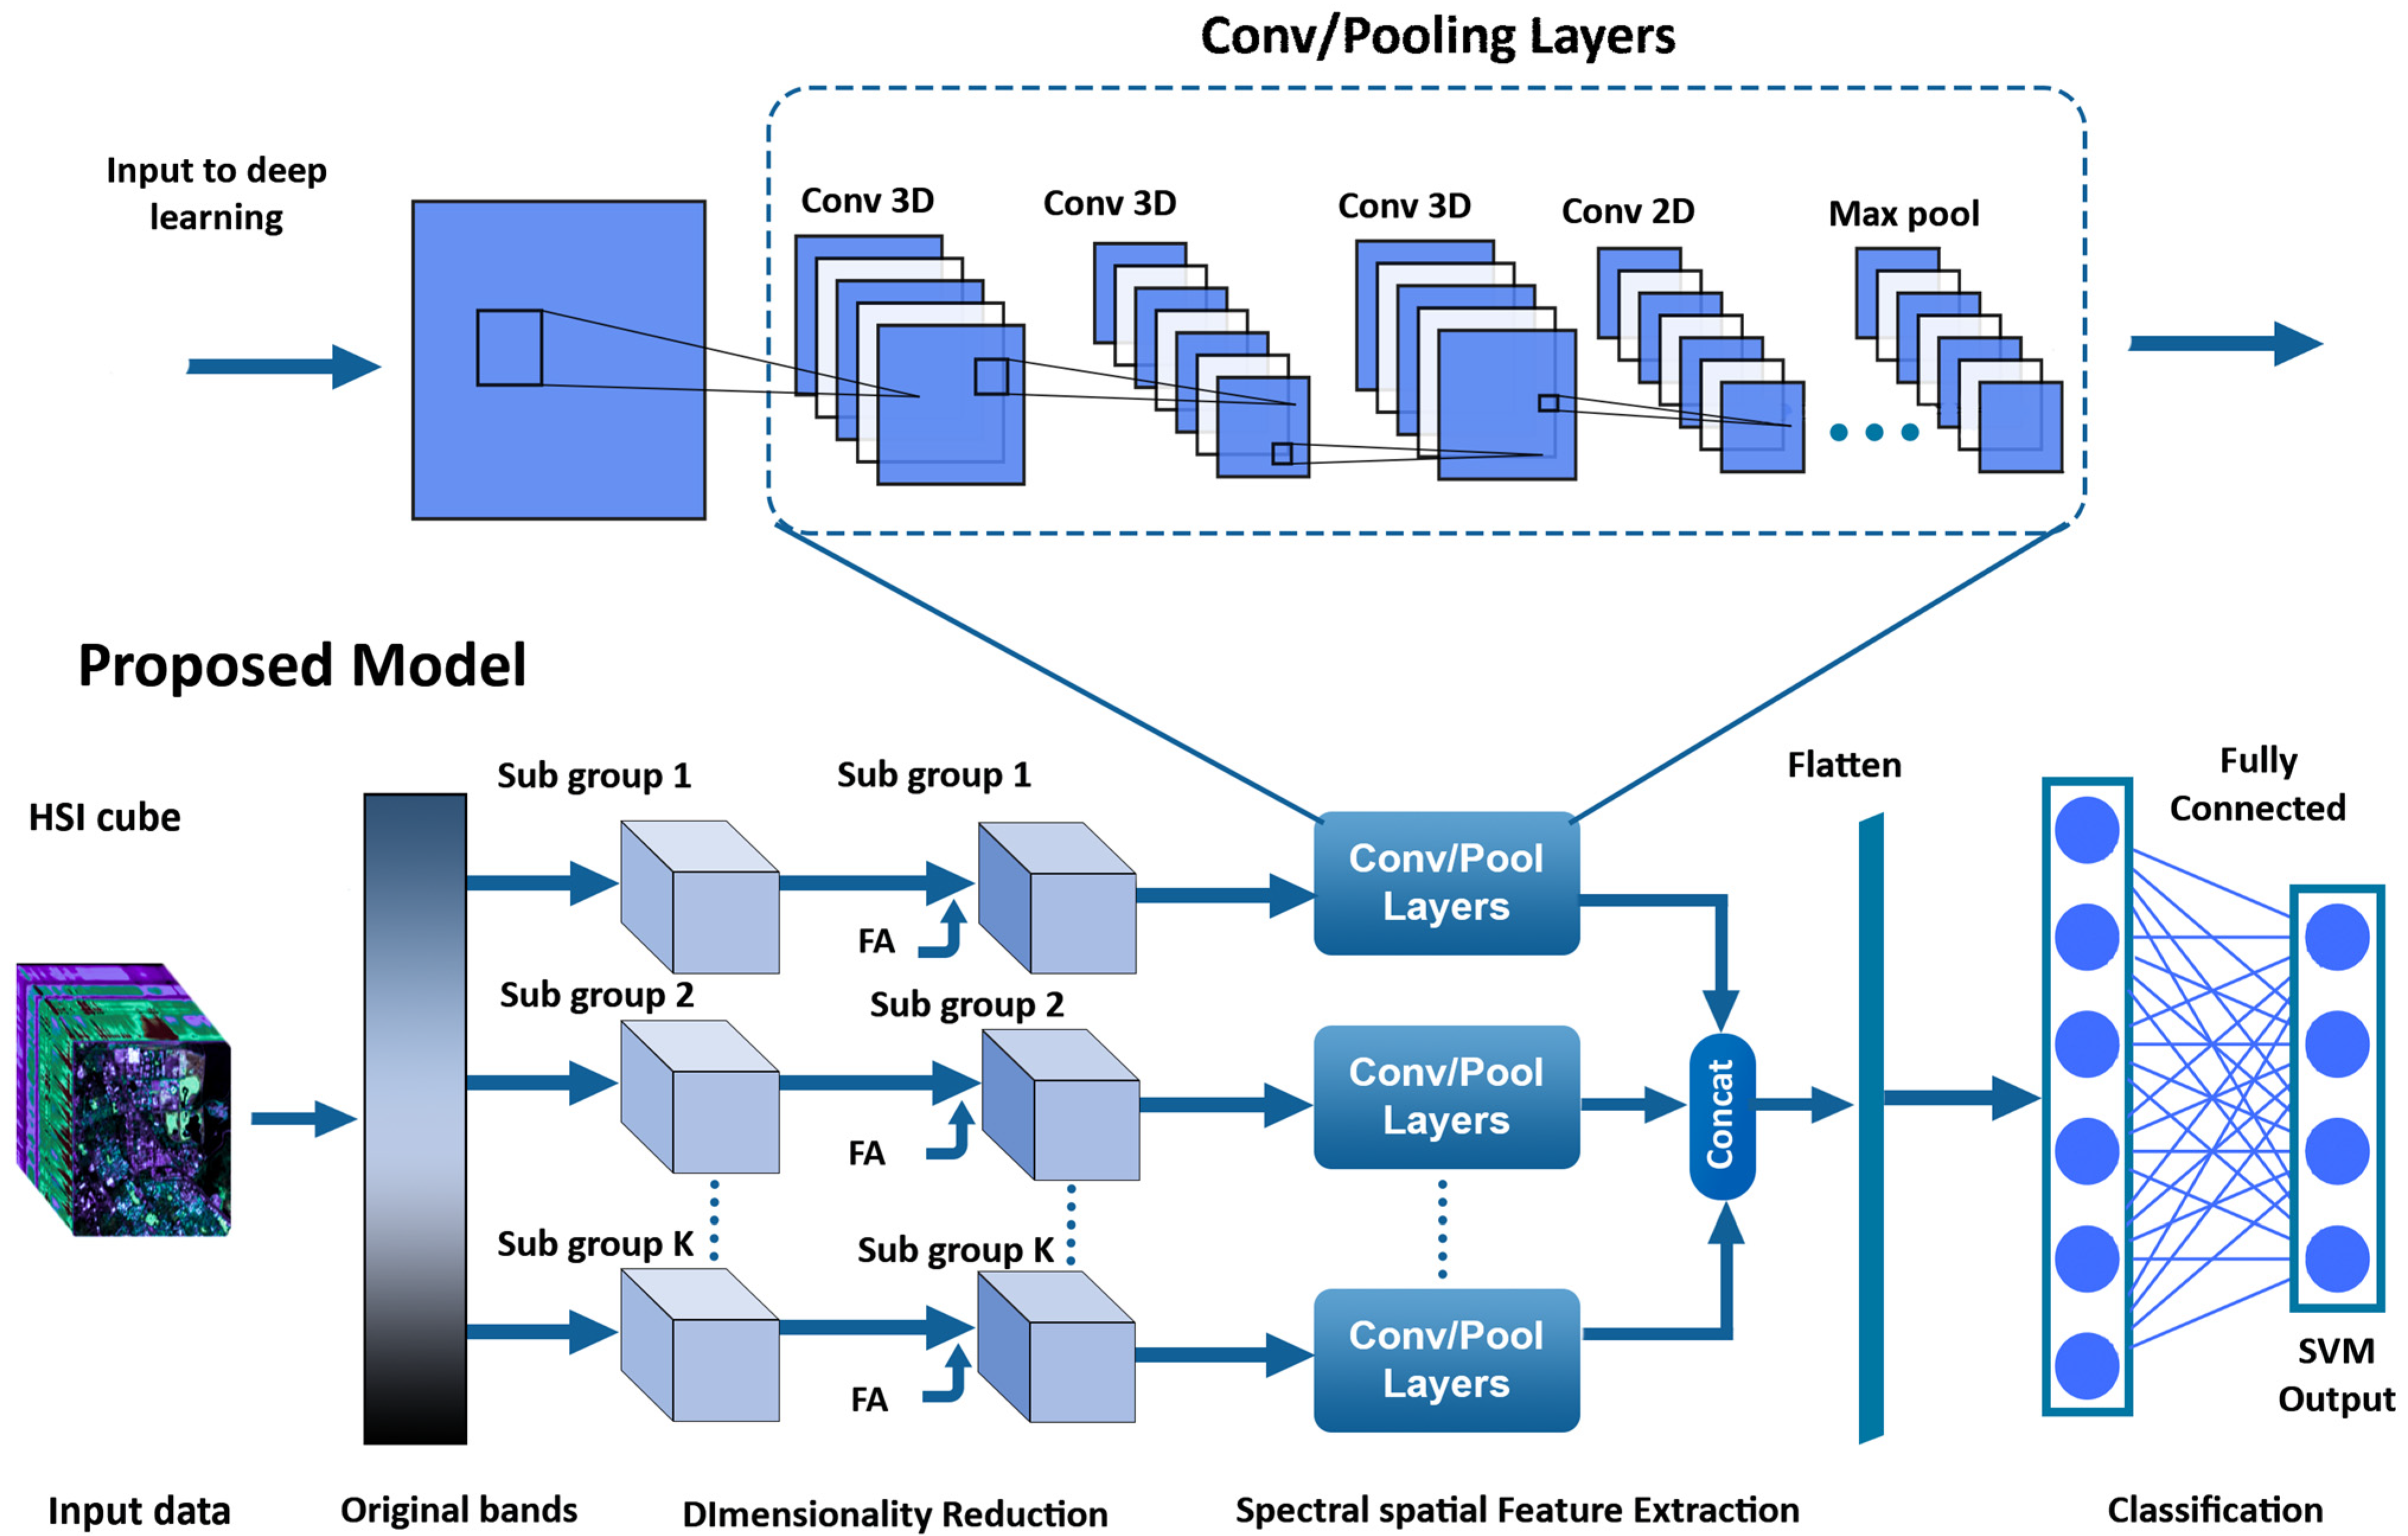
The input HSI cube, with dimensions P × Q × R is first spectrally segmented into several subgroups based on spectral band correlations. During the spectral segmentation phase, creating 3 segments provides a balanced representation of spectral features, allowing for the effective extraction of the features and the classification of land cover objects in subsequent stages of the model. In the next step, factor analysis (FA) is implemented in each subgroup for the dimensionality reduction to P × Q × R data. The output vector Y, with dimensions P × Q, represents the selection of a class from the existing classes of land cover objects.
The integrity of spectral dimensions is upheld through the application of FA, maintaining the P × Q × R scale, while the number of bands undergoes a reduction from R to RD (where RD < R). Employing FA in conjunction with spectral segmentation as a preliminary step in HSI preprocessing proves to be immensely advantageous. This approach empowers FA to effectively encapsulate the variances intrinsic to correlated and overlapping spectral bands, thereby enhancing the model’s prowess in discerning analogous instances. Conversely, the conventional employment of PCA-based dimensionality reduction methods such as PCA or the MNF fails to directly address this specific objective in the realm of HSI [40]. On occasion, these strategies yield an approximation to the essential factors that do not adequately discriminate among comparable instances. Following the conclusion of the FA phase, we proceed to derive overlapping 3D cube patches measuring W × W × R from the preprocessed HSI. Subsequently, these patches are input into the deep learning model. For patch extraction, the window dimensions represented as W × W are set at 19 × 19 for the Indian Pines dataset, and 15 × 15 for both the Pavia University and Salinas Scene datasets. The veracious values for these patches are established based on the class category attributed to the central pixel. These specific values have been chosen through grid-search, aiming to optimize the overall accuracy. The SENN model architecture, depicted in Figure 1, features multiple 3D convolution layers followed by a 2D convolution layer to extract spatial-spectral features. Each block consists of three 3D convolution layers with 8, 16, and 32 filters, respectively, using kernel sizes of 3 × 3 × 5 for the first two layers and 3 × 3 × 1 for the third layer. By utilizing smaller convolution kernels, the model efficiently extracts features while minimizing computational cost [29,35]. Max pooling is applied after each convolution layer to prevent overfitting, and all convolution blocks are concatenated and flattened to convert each branch’s extracted features into one-dimensional vectors.
To ensure the seamless flow of features throughout our model, we implemented the channel-wise concatenation of decomposed data within the fully connected dense layers. This strategic approach enables the effective integration and transmission of spectral–spatial features, ensuring that relevant information is retained and propagated throughout the network. By preserving crucial details, our model facilitates comprehensive analysis and classification of HSI data, allowing for the accurate interpretation of complex spatial and spectral characteristics. Moreover, the incorporation of two dropout layers serves as a crucial mechanism to mitigate the risk of overfitting, particularly in scenarios with a limited number of HSI samples. Through the random deactivation of neurons during training, dropout layers prevent the model from relying excessively on specific features or patterns, thereby enhancing its generalization ability and robustness to unseen data instances.
Furthermore, the strategic utilization of a support vector machine (SVM) as the final layer of our model aims to maximize classification accuracy and performance. SVMs are renowned for their robustness and effectiveness in handling complex classification tasks by identifying an optimal hyperplane that maximizes the margin between distinct classes. By integrating the SVM into our model, we leverage its discriminative capabilities to effectively manage intricate decision boundaries and capture non-linear correlations present within the HSI data. The utilization of the “squared_hinge” loss function further enhances classification accuracy by penalizing misclassifications based on their distance from the decision boundary, thereby promoting a more precise delineation of class boundaries and reducing classification errors.
Moreover, the network structure and hyperparameters have been meticulously designed and fine-tuned to ensure optimal performance across all HSI datasets used in our research. The detailed specifications of the layers in each branch and level, including three 3D convolution layers and one 2D convolution layer, are provided in Table 1. The dimensions of the 3D convolution kernels are 8 × 3 × 3 × 7 × 1, 16 × 3 × 3 × 5 × 8, and 32 × 3 × 3 × 3 × 16, where the third 3D convolution signifies 32 3D kernels 3 × 3 × 3 in dimension for all 16 3D input feature maps. Conversely, the dimension of the 2D convolution kernel is 64 × 3 × 3 × 576, where 64 represents the number of 2D kernels, 3 × 3 denotes the spatial dimension of the 2D kernel, and 576 signifies the number of 2D input feature maps. Through extensive experimentation and validation, our model has demonstrated exceptional accuracy and reliability in accurately classifying HSI data, even in complex and heterogeneous environments. This robust performance underscores the efficacy and suitability of our proposed model for HSI classification.

3. Experimental Result Analysis

3.1. Experimental Configuration

The experiments were conducted using the Python 3.8 programming language and TensorFlow 2.4.0 as the deep learning framework. During the segmentation process, the HSI data are partitioned into K subsets based on spectral band correlations, with each subset represented by an R-dimensional matrix. For the experimental datasets, segments are separated based on threshold values of the correlation matrix, with typically two/three visual correlation segments identified. For general purposes, we have created three segments for each dataset by setting K = 3. Furthermore, each segment’s bands are reduced using dimensionality reduction methods such as FA, where R represents the number of spectral features extracted. Since a minimum of two features is desired for deep learning models, R is set as 2 for each segment of the dataset before being passed to the deep learning model. The optimization algorithm chosen was Adam, employing a learning rate of 1 × 10⁻³. After rigorous experimental analysis, the optimal learning rate was determined to be 0.001, complemented by a decay rate of 1 × 10⁻⁶ for the Adam optimizer. The training epoch was set at 120 iterations.
It is important to note that all experiments were conducted on Google Colab, a cloud-based platform, providing access to high-performance GPUs that significantly expedited the model training process. The configuration of the proposed model, applied to the SA dataset, is outlined in Table 1. This training configuration ensures a fair comparison by utilizing 5% of the total dataset as training data for each of the three datasets. Additionally, 20% of the training data is allocated for validation purposes. The use of Google Colab offered computational resources that enhanced the efficiency and scalability of the experiments.

3.2. Datasets Details

  • Salinas Scene (SC): The Salinas Valley in California was surveyed using the airborne visible/infrared imaging spectrometer (AVIRIS) sensor, resulting in an image dataset comprising 224 spectral bands ranging from 0.4 to 2.45 µm [41]. The image has a spatial resolution of 3.7 m and dimensions of 512 × 217 pixels. To mitigate water absorption distortions, certain bands (108–112, 154–167, and 224) were excluded from the analysis. Additional details regarding the distribution of pixels per class can be found in Table 2.
  • The Pavia University (PU): The Pavia University dataset was captured using the reflective optics imaging spectrometer sensor (ROSIS) during an aerial survey conducted over Pavia, located in northern Italy. This dataset comprises 103 spectral bands covering a wavelength range from 0.43 to 0.86 µm [41], with a spatial resolution of 1.3 m. The image dimensions of Pavia University are 610 × 340 pixels. For detailed information on the distribution of pixels per class, please refer to Table 3.
  • Indian Pines (IP): The Indian Pines dataset was acquired using the AVIRIS sensor over the Indian Pines test site in northwestern Indiana. It comprises a total of 145 × 145 pixels and 224 spectral bands, spanning the wavelength range from 400 nm to 2500 nm [41]. The dataset encompasses 16 distinct classes, providing valuable information about the land cover in the area. With its high-resolution spatial and spectral data, the Indian Pines dataset has been extensively utilized for HSI classification and analysis in various remote sensing applications. For a detailed breakdown of the dataset, including the pixel count for each class, please refer to Table 4.

3.3. Evaluation Metrics

Comparing predicted class maps with reference or ground truth data is necessary to assess the accuracy of classification results. However, visually inspecting pixel assignments in an image is subjective and may not provide a comprehensive evaluation. Therefore, relying on quantitative measures is more dependable. One widely used measure is the overall accuracy (OA), represented by Equation (5), which calculates the proportion of correctly assigned HSI pixels out of the total number of samples:
O A = i N S c o r r e c t S t o t a l
The average accuracy (AA) is a crucial criterion in evaluating classification performance. It estimates the average accuracy across all categories or classes, providing a comprehensive assessment. Equation (6) defines the calculation for the average accuracy (AA), enabling a quantitative measure of this evaluation metric:
A A = k N A c c u r a c y N
It effectively conveys information about the importance of understanding the average accuracy (AA) and the Kappa coefficient (Kappa) in assessing the effectiveness and quality of the classification process for HSI data. The reference to Equation (6) adds clarity by indicating where to find the calculation for the Kappa coefficient:
K a p p a = N k = 1 n m i , i k = 1 n ( G , k , C , k ) N 2 k = 1 n ( G , k , C , k )
The Kappa coefficient assesses the concurrence between the classified predicted map and the actual ground truth. This coefficient spans from 0 to 1, where 1 signifies complete concordance and 0 implies a lack of concordance. An attained Kappa value of ≥0.8 denotes considerable agreement, whereas a value <0.4 suggests inadequate model performance.

3.4. Results and Discussion

Within this section, the performance of the proposed model in classification is systematically examined, employing quantitative and qualitative evaluation strategies across the PU, SA, and IP datasets. A comparative study is undertaken, contrasting the efficacy of the proposed approach against six leading algorithms that are currently deemed state of the art. To counterbalance any potential variability stemming from random sample selection, the experiment trails are replicated 10 times, and the average outcome from these iterations is adopted as the final result. Furthermore, a breakdown of the classification results for each individual class is presented.
The assessment of the proposed model’s capacity to classify HSI was extended to consider the impact of distinct spatial dimensions across various datasets. In the thorough analysis of the results, an investigation into segmentation based on two distinct factors was conducted: mutual information among spectral bands and band-to-band correlation. Additionally, three different dimensionality reduction techniques (PCA, MNF, FA) were applied for each of these two segmentation approaches. The outcomes are summarized in Table 5, in which an overview of the fluctuations in three different accuracy metrics across the datasets used is presented. Notably, for the PU dataset, mutual information-based FA exhibited a strong performance. However, the proposed dimensionality method, specifically correlation-based FA, consistently demonstrated superior performance across the board. This suggests that correlation-based FA is generally more effective in achieving higher classification accuracy, with exceptions such as the SA dataset, where MNF performed better. Despite FA’s comparatively lower performance in mutual information-based reduction, its effectiveness significantly improves when utilizing correlation-based methods, emerging as the optimal choice for dimensionality reduction in this study.
The magnitude of the window size dictates the extent of spatial information employed for labeling HSI patches. Large windows may include irrelevant neighborhood data, impeding feature extraction. Conversely, small windows result in a loss of spatial information. The analysis provides corroborating evidence of the window size’s role in influencing the model’s performance across the three utilized datasets. Table 6 depicts the experimental results, indicating optimal window sizes of 9 × 9, 11 × 11, 13 × 13, 15 × 15, 17 × 17, 19 × 19, 21 × 21, and 25 × 25 for the PU, SA, and IP datasets, respectively. Considering that the model was trained on only 5% of the data, even slight changes in initial settings can have a substantial impact on performance. Hence, the analysis reveals compelling patterns. For the SA and PU datasets, a window size of 15 × 15 emerges as the optimal choice, consistently delivering superior performance. Conversely, the IP dataset exhibits its peak performance with a window size of 19 × 19 within the framework of our proposed model. This nuanced outcome underscores the critical role that tailored patch window sizes play in optimizing the effectiveness of our method, offering distinct advantages contingent on the characteristics of each dataset.
The evaluation of the model’s effectiveness is achieved by scrutinizing its classification accuracy across varying proportions of training data. This assessment involves the random selection of labeled samples amounting to 1%, 2%, 3%, 4%, and 5% for training purposes, with the remaining data serving as the testing set. The classification outcomes for the proposed model across each dataset are illustrated in Figure 2. Observing the results, it is evident that minor changes in classification accuracy occur across all training sample proportions. The proposed model exhibits consistent performance across the three datasets, regardless of the proportion of training samples used. To validate the proposed classification algorithm, we compare it with several other algorithms, namely, SVM [11], 2D-CNN [25], 3D-CNN [26], Fast 3D-CNN [42], HybridSN [29], SpectralNET [30], and TRI-CNN [35]. The quantitative comparisons of the methods being compared are presented in Table 7, Table 8 and Table 9, with the best results highlighted in bold. Based on these comparisons, it can be concluded that the proposed SENN model outperforms the other methods. Moreover, as previously mentioned, the proposed methodology entailed conducting the experimental results iteratively 10 times, with the resultant mean values serving as the definitive outcomes of the model. To fortify the credibility and precision of these mean values, we conducted a comparative analysis of the standard deviation values pertaining to class wise accuracies, in conjunction with overall accuracy, average accuracy, and Kappa coefficient, across three distinct datasets as detailed in Table 10. Our findings reveal that the observed differences are negligible, thereby substantiating minimal variation and affirming the stability of our results. This robust consistency underscores the reliability of our experimental approach and the validity of our conclusions.
The training times obtained from the comparison of methods are juxtaposed with those of the proposed method in Table 11. This comparison unequivocally reveals that the proposed model exhibits shorter training times in comparison to the other methods, owing to its lower count of trainable parameters relative to the other models. From the comparison, it is evident that SpectralNET and the 3D CNN require higher training times due to the higher parameter count of 3D blocks and the use of four levels of decomposition using 2D convolution layers, making them efficient but time-consuming feature extractors. Conversely, the SVM, being a machine learning algorithm, requires a relatively limited amount of computation time. Fast 3D CNN and Tri-CNN show an average duration. Notably, both the HybridSN and proposed methods demonstrate the shortest times. In the case of HybridSN, this can be attributed to its lower number of hidden layers and parameters. Similarly, in the proposed method, the number of parameters is also limited despite having more layers. This is achieved by adjusting the kernel size and filter according to the feature maps, thereby keeping the parameters within a limited range. Upon an evaluation of the three datasets, it becomes evident that the 2D-CNN method yields the lowest overall accuracy due to its exclusive reliance on 2D filters for the extraction of spatial information. Conversely, the 3D-CNN method attains a higher accuracy of 98.13% by simultaneously capturing both spatial and spectral information through the utilization of 3D filters, thereby enhancing the precision of the classification. Despite the incorporation of four parallel branches of 3D kernels for the extraction of spatial features, the TRI-CNN method demonstrates no appreciable enhancement when compared to HybridSN or SpectralNET, and its accuracy lags slightly by 0.73%. HybridSN amalgamates three layers of 3D-CNN with one layer of 2D-CNN to extract both spectral–spatial and spatial information. SpectralNET, which fuses spectral and spatial information within a deep neural network architecture, outperforms the aforementioned models in terms of accuracy. In our proposed method, we achieve an overall accuracy approximately 0.35% higher than that of Tri-CNN and SpectralNET, surpassing other models across the categories. This underscores its proficiency in yielding favorable outcomes even when dealing with modest training datasets. The comparative outcomes are depicted in Table 8 for the Salinas dataset, Table 9 for the Pavia University dataset, and Table 10 for the Indian Pines dataset, further highlighting the effectiveness of our model in achieving favorable results.
The experimental findings demonstrated that the suggested SENN approach had superior performance in comparison to the other classification strategies utilized in this study. The inclusion of spectral–spatial information in Fast 3D-CNN, HybridSN, Spectral-NET, and TRI-CNN led to enhanced overall accuracy in comparison to the 2D CNN method. The Fast 3D-CNN utilizes a simultaneous extraction method to capture both spectral and spatial information from the three-dimensional picture patch. This approach efficiently maintains the inherent characteristics of the data. HybridSN utilized the advantageous characteristics of both 2D-CNN and 3D-CNN to extract spectral and spatial features for the purpose of picture classification. SpectralNET employed a wavelet-based variant of the 2D CNN framework to effectively combine spectral and spatial data, particularly designed for HSI classification. The categorization report, which includes a variety of performance assessment measures, is displayed in Table 12, Table 13 and Table 14 for their respective datasets. Figure 3 depicts the training accuracy and loss curves for the Salinas, Pavia University, and Indian Pines datasets, all acquired from the proposed model. The curve for the SA dataset shows a more consistent trend compared to the others; however, the training curve for the Indian Pines dataset shows significant variations. This thorough perspective offers a detailed analysis of outcomes particular to each class, showcasing improved results for every class and a clear absence of overfitting. Our suggested SENN technique has shown clear superiority over competing approaches in all three datasets examined in this study. By leveraging the advantages of each individual branch, our model skillfully extracted characteristics at different levels, resulting in improved classification performance.

3.5. Ablation Experiments

To comprehensively demonstrate the efficacy of the proposed model, we conducted an extensive study utilizing three distinct datasets to assess the influence of varied configurations of network elements. The purpose was to evaluate the performance of our entire spectral segmentation technique (SENN) in comparison to its different components e.g., SVM, 2D CNN, 3D CNN, 3D 2D CNN without segmentation and with segmentation (multibranch). This additional experimentation helps elucidate the distinct impacts of each component of the proposed model, providing valuable insights into their contributions to overall performance. The outcomes of this comparative analysis, as showcased in Table 15, underscore the superior effectiveness of our spectral segmentation approach. In this analysis, a pattern of segmented multibranch components outperforming components without segmentation can be seen. Even the 3D-2D CNN-SVM without segmentation performs slightly worse due to the inherent challenge of CNN-SVM models in effectively balancing the trade-offs between CNNs and SVMs, particularly in high-dimensional hyperspectral data. Overall, the proposed model (SENN) containing all its constituent components outperforms the rest of the possible combinations of components. Additionally, it was anticipated that these experiments might not yield impactful outcomes due to the sheer volume of data, further justifying the use of segmentation-based dimensionality reduction to streamline the analysis process.

4. Conclusions and Future Work

In this article, we present the innovative spectrally segmented-enhanced neural network (SENN) tailored for HSI classification. Comprising two core functional submodules, the SENN incorporates a multi-layer network designed for segmented data to enrich spectral–spatial information diversity, complemented by a robust SVM classifier. The SVM’s crucial role involves effectively handling non-linearly separable data and optimizing class margins to maximize classification accuracy. The proposed model showcases exceptional performance across three standard datasets, as evidenced by comprehensive experimental results and insightful ablation studies. Its versatility extends to additional HSI data, emphasizing its potential for broader applications within the field. Looking ahead, our future research endeavors aim to explore a more streamlined architecture, strategically reducing training parameters to diminish computational complexity while preserving model performance.
Furthermore, our ongoing efforts are directed towards addressing the comparatively lower classification accuracy observed in the IP dataset. This prompts a focused investigation into refining the neural network model, with the goal of enhancing generalization capabilities and achieving elevated accuracy across diverse datasets. The commitment to continual improvement and exploration underscores our dedication to advancing the state of the art in HSI classification.

Author Contributions

Conceptualization, T.I. and R.I.; methodology, T.I. and R.I.; software, T.I. and R.I.; validation, T.I., R.I. and P.U.; formal analysis, R.I., P.U. and A.U.; investigation, P.U. and A.U.; resources, T.I., R.I. and P.U.; data curation, T.I. and R.I.; writing—original draft preparation, T.I. and R.I.; writing—review and editing, P.U. and A.U.; visualization, T.I. and R.I.; supervision, R.I., P.U. and A.U.; funding acquisition, P.U. and A.U. All authors have read and agreed to the published version of the manuscript.

Funding

This research received no external funding.

Data Availability Statement

The data used in this study are available in [41].

Conflicts of Interest

The authors declare no conflicts of interest.

References

  1. Xu, H.; Yao, W.; Cheng, L.; Li, B. Multiple Spectral Resolution 3D Convolutional Neural Network for Hyperspectral Image Classification. Remote Sens. 2021, 13, 1248. [Google Scholar] [CrossRef]
  2. Teke, M.; Deveci, H.S.; Haliloğlu, O.; Gürbüz, S.Z.; Sakarya, U. A Short Survey of Hyperspectral Remote Sensing Applications in Agriculture. In Proceedings of the Recent Advances in Space Technologies (RAST), Istanbul, Turkey, 12–14 June 2013; pp. 171–176. [Google Scholar] [CrossRef]
  3. Ghamisi, P.; Dalla Mura, M.; Benediktsson, J.A. A Survey on Spectral–Spatial Classification Techniques Based on Attribute Profiles. IEEE Trans. Geosci. Remote Sens. 2015, 53, 2335–2353. [Google Scholar] [CrossRef]
  4. Camps-Valls, G.; Tuia, D.; Bruzzone, L.; Benediktsson, J.A. Advances in Hyperspectral Image Classification: Earth Monitoring with Statistical Learning Methods. IEEE Signal Process. Mag. 2014, 31, 45–54. [Google Scholar] [CrossRef]
  5. Xu, Y.; Wu, Z.; Chanussot, J.; Wei, Z. Joint Reconstruction and Anomaly Detection from Compressive Hyperspectral Images Using Mahalanobis Distance-Regularized Tensor RPCA. IEEE Trans. Geosci. Remote Sens. 2018, 56, 2919–2930. [Google Scholar] [CrossRef]
  6. Pyo, J.; Duan, H.; Ligaray, M.; Kim, M.; Baek, S.; Kwon, Y.S.; Lee, H.; Kang, T.; Kim, K.; Cha, Y.; et al. An Integrative Remote Sensing Application of Stacked Autoencoder for Atmospheric Correction and Cyanobacteria Estimation Using Hyperspectral Imagery. Remote Sens. 2020, 12, 1073. [Google Scholar] [CrossRef]
  7. Zhang, X.; Wang, Y.; Zhang, N.; Xu, D.; Luo, H.; Chen, B.; Ben, G. SSDANet: Spectral-Spatial Three-Dimensional Convolutional Neural Network for Hyperspectral Image Classification. IEEE Access 2020, 8, 127167–127180. [Google Scholar] [CrossRef]
  8. Karamizadeh, S.; Abdullah, S.M.; Manaf, A.A.; Zamani, M.; Hooman, A.; Publishing, S.R. An Overview of Principal Component Analysis. Available online: https://www.scirp.org/journal/paperinformation.aspx?paperid=38103 (accessed on 20 November 2023).
  9. Uddin M., P.; Mamun, M.A.; Hossain, M.A. PCA-based Feature Reduction for Hyperspectral Remote Sensing Image Classification. IETE Tech. Rev. 2021, 38, 337–396. [Google Scholar] [CrossRef]
  10. Joelsson, S.R.; Benediktsson, J.A.; Sveinsson, J.R. Random forest classifiers for hyperspectral data. In Proceedings of the 2005 International Geoscience and Remote Sensing Symposium (IGARSS ‘05), Seoul, Republic of Korea, 29 July 2005; p. 4. [Google Scholar] [CrossRef]
  11. Leng, J.; Li, T.; Bai, G.; Dong, Q.; Dong, H. Cube-CNN-SVM: A Novel Hyperspectral Image Classification Method. In Proceedings of the 2016 IEEE 28th International Conference on Tools with Artificial Intelligence (ICTAI), San Jose, CA, USA, 6–8 November 2016. [Google Scholar] [CrossRef]
  12. Vaddi, R.; Manoharan, P. Hyperspectral image classification using CNN with spectral and spatial features integration. Infrared Phys. Technol. 2020, 107, 103296. [Google Scholar] [CrossRef]
  13. Ebied, H.M. Feature extraction using PCA and Kernel-PCA for face recognition. In Proceedings of the 2012 8th International Conference on Informatics and Systems (INFOS), Giza, Egypt, 14–16 May 2012; pp. MM-72–MM-77. [Google Scholar]
  14. Zhou, J.; Zhang, Q.; Zeng, S.; Zhang, B.; Fang, L. Latent Linear Discriminant Analysis for feature extraction via Isometric Structural Learning. Pattern Recognit. 2024, 149, 110218. [Google Scholar] [CrossRef]
  15. Cristianini, N. Fisher Discriminant Analysis (Linear Discriminant Analysis). In Dictionary of Bioinformatics and Computational Biology; Wiley: Hoboken, NJ, USA, 2004. [Google Scholar] [CrossRef]
  16. Kishore, K.M.S.; Behera, M.K.; Chakravarty, S.; Dash, S. Hyperspectral Image Classification using Minimum Noise Fraction and Random Forest. In Proceedings of the 2020 IEEE International Women in Engineering (WIE) Conference on Electrical and Computer Engineering (WIECON-ECE), Bhubaneswar, India, 26-27 December 2020; pp. 296–299. [Google Scholar] [CrossRef]
  17. Wu, J.-Z.; Yan, W.-D.; Ni, W.-P.; Bian, H. Feature extraction for hyperspectral data based on MNF and singular value decomposition. In Proceedings of the 2013 IEEE International Geoscience and Remote Sensing Symposium—IGARSS, Melbourne, VIC, Australia, 21–26 July 2013; pp. 1430–1433. [Google Scholar] [CrossRef]
  18. Zhao, W.; Du, S. Spectral–Spatial Feature Extraction for Hyperspectral Image Classification: A Dimension Reduction and Deep Learning Approach. IEEE Trans. Geosci. Remote Sens. 2016, 54, 4544–4554. [Google Scholar] [CrossRef]
  19. Islam, M.T.; Islam, M.R.; Uddin, M.P.; Ulhaq, A. A Deep Learning-Based Hyperspectral Object Classification Approach via Imbalanced Training Samples Handling. Remote Sens. 2023, 15, 3532. [Google Scholar] [CrossRef]
  20. Islam, M.R.; Ahmed, B.; Hossain, M.A.; Uddin, M.P. Mutual Information-Driven Feature Reduction for Hyperspectral Image Classification. Sensors 2023, 23, 657. [Google Scholar] [CrossRef]
  21. Peng, J.; Sun, W.; Li, H.C.; Li, W.; Meng, X.; Ge, C.; Du, Q. Low-Rank and Sparse Representation for Hyperspectral Image Processing: A review. IEEE Geosci. Remote Sens. Mag. 2022, 10, 10–43. [Google Scholar] [CrossRef]
  22. Zhong, S.; Chang, C.-I.; Zhang, Y. Iterative Support Vector Machine for Hyperspectral Image Classification. In Proceedings of the 2018 25th IEEE International Conference on Image Processing (ICIP), Athens, Greece, 7–10 October 2018; pp. 3309–3312. [Google Scholar] [CrossRef]
  23. Okwuashi, O.; Ndehedehe, C.E. Deep support vector machine for hyperspectral image classification. Pattern Recognit. 2020, 103, 107298. [Google Scholar] [CrossRef]
  24. Xu, Q.; Xiao, Y.; Wang, D.; Luo, B. Csa-mso3dcnn: Multiscale octave 3d cnn with channel and spatial attention for hyperspectral image classification. Remote Sens. 2020, 12, 188. [Google Scholar] [CrossRef]
  25. Kanthi, M.; Sarma, T.H.; Bindu, C.S. A 3d-Deep CNN Based Feature Extraction and Hyperspectral Image Classification. In Proceedings of the 2020 IEEE India Geoscience and Remote Sensing Symposium (InGARSS), Online, 1–4 December 2020; IEEE: Piscataway, NJ, USA, 2020; pp. 229–232. [Google Scholar]
  26. Yang, Q.; Liu, Y.; Zhou, T.; Peng, Y.; Tang, Y. 3D Convolutional Neural Network for Hyperspectral Image Classification Using Generative Adversarial Network. In Proceedings of the 2020 13th International Conference on Intelligent Computation Technology and Automation (ICICTA), Xi’an, China, 24–25 October 2020; pp. 277–283. [Google Scholar] [CrossRef]
  27. Chen, Y.; Jiang, H.; Li, C.; Jia, X.; Ghamisi, P. Deep Feature Extraction and Classification of Hyperspectral Images Based on Convolutional Neural Networks. IEEE Trans. Geosci. Remote Sens. 2016, 54, 6232–6251. [Google Scholar] [CrossRef]
  28. Ben Hamida, A.; Benoit, A.; Lambert, P.; Ben Amar, C. 3-D Deep Learning Approach for Remote Sensing Image Classification. IEEE Trans. Geosci. Remote Sens. 2018, 56, 4420–4434. [Google Scholar] [CrossRef]
  29. Islam, M.R.; Islam, M.T.; Uddin, M.P. Improving hyperspectral image classification through spectral-spatial feature reduction with a hybrid approach and deep learning. J. Spat. Sci. 2023, 1–18. [Google Scholar] [CrossRef]
  30. Firat, H.; Hanbay, D. Classification of Hyperspectral Images Using 3D CNN Based ResNet50. In Proceedings of the 2021 29th Signal Processing and Communications Applications Conference (SIU), Istanbul, Turkey, 9–11 June 2021; pp. 1–4. [Google Scholar] [CrossRef]
  31. Roy, S.K.; Krishna, G.; Dubey, S.R.; Chaudhuri, B.B. HybridSN: Exploring 3-D–2-D CNN Feature Hierarchy for Hyperspectral Image Classification. IEEE Geosci. Remote Sens. Lett. 2020, 17, 277–281. [Google Scholar] [CrossRef]
  32. Chakraborty, T.; Trehan, U. SpectralNET: Exploring Spatial-Spectral WaveletCNN for Hyperspectral Image Classification. arXiv 2021, arXiv:2104.00341. [Google Scholar]
  33. Liu, L.; Shi, Z.; Pan, B.; Zhang, N.; Luo, H.; Lan, X. Multiscale Deep Spatial Feature Extraction Using Virtual RGB Image for Hyperspectral Imagery Classification. Remote Sens. 2020, 12, 280. [Google Scholar] [CrossRef]
  34. Zhao, H.; Shi, J.; Qi, X.; Wang, X.; Jia, J. Pyramid Scene Parsing Network. arXiv 2017, arXiv:1612.01105. [Google Scholar]
  35. Yu, F.; Koltun, V.; Funkhouser, T. Dilated Residual Networks. arXiv 2017, arXiv:1705.09914. [Google Scholar]
  36. Noshiri, N.; Beck, M.A.; Bidinosti, C.P.; Henry, C.J. A comprehensive review of 3D convolutional neural network-based classification techniques of diseased and defective crops using non-UAV-based hyperspectral images. Smart Agric. Technol. 2023, 5, 100316. [Google Scholar] [CrossRef]
  37. Alkhatib, M.Q.; Al-Saad, M.; Aburaed, N.; Almansoori, S.; Zabalza, J.; Marshall, S.; Al-Ahmad, H. Tri-CNN: A Three Branch Model for Hyperspectral Image Classification. Remote Sens. 2023, 15, 316. [Google Scholar] [CrossRef]
  38. Islam, M.T.; Kumar, M.; Islam, M.R.; Sohrawordi, M. Subgrouping-Based NMF with Imbalanced Class Handling for Hyperspectral Image Classification. In Proceedings of the 2022 25th International Conference on Computer and Information Technology (ICCIT), Cox’s Bazar, Bangladesh, 17–19 December 2022; pp. 739–744. [Google Scholar] [CrossRef]
  39. Li, Y.; Zhang, H.; Shen, Q. Spectral–Spatial Classification of Hyperspectral Imagery with 3D Convolutional Neural Network. Remote Sens. 2017, 9, 67. [Google Scholar] [CrossRef]
  40. Islam, M.T.; Kumar, M.; Islam, M.R. MC-NET: Spectral-Spatial Feature Reduction for Hyperspectral Image Classification with Optimized Technique Series. In Proceedings of the 2022 4th International Conference on Electrical, Computer & Telecommunication Engineering (ICECTE), Rajshahi, Bangladesh, 29–31 December 2022; pp. 1–4. [Google Scholar] [CrossRef]
  41. He, K.; Zhang, X.; Ren, S.; Sun, J. Deep residual learning for image recognition. In Proceedings of the IEEE Conference on Computer Vision and Pattern Recognition, Las Vegas, NV, USA, 26 June–1 July 2016. [Google Scholar] [CrossRef]
  42. Islam, R.; Siddiqa, A.; Afjal, M.I.; Uddin, M.P.; Ulhaq, A. Hyperspectral Image Classification via Information Theoretic Dimension Reduction. Remote Sens. 2023, 15, 1147. [Google Scholar] [CrossRef]
Figure 1. An insightful depiction of the overall system architecture encapsulating the key components of the proposed spectrally segmented-enhanced neural network (SENN) model.
Remotesensing 16 00807 g001
Figure 2. The classification outcomes achieved by the proposed spectrally segmented-enhanced neural network (SENN) model across diverse datasets. The visual representation highlights SENN’s prowess in accurately categorizing hyperspectral imagery, offering valuable insights into its robust performance across different scenarios.
Remotesensing 16 00807 g002
Figure 3. Training accuracy curves, showcasing the dynamic learning process of the proposed spectrally segmented-enhanced neural network (SENN) model across different datasets. Subfigures (a,d) correspond to the Salinas Scene dataset, (b,e) represent the Pavia University dataset, and (c,f) focus on the Indian Pines dataset.
Remotesensing 16 00807 g003
Table 1. A concise overview of the SENN model’s architecture: unveiling its layers and parameters.
Layer (Type)Layer (Type)Layer (Type)
Input_1 (InputLayer)Input_2 (InputLayer)Input_k (InputLayer)
con3d_1_1 (Convolution 3D)Con3d_2_1 (Convolution 3D)Con3d_k_1 (Convolution 3D)
Con3d_1_2 (Convolution 3D)Con3d_2_2 (Convolution 3D)Con3d_k_2 (Convolution 3D)
Con3d_1_3 (Convolution 3D)Con3d_2_3 (Convolution 3D)Con3d_k_3 (Convolution 3D)
Reshape_1Reshape_2Reshape_k
Con2d_1 (Convolution 2D)Con2d_2 (Convolution 2D)Con2d_k (Convolution 2D)
Concatenate (Con2d_1, Con2d_2, Con2d_k)
Flatten
Dense (2,408,704)
Dropout (0.4) (0)
Dense (32,896)
Dropout (0.4) (0)
Squared Hinge (SVM) (16, 2064)
Total Trainable params: 1,901,264
Table 2. Land cover categories and corresponding pixel quantities within the Salinas Scene dataset.
No.Class LabelsSamples
1Brocoli_green_weeds_12009
2Brocoli_green_weeds_23726
3Fallow1976
4Fallow_rough_plow1294
5Fallow_smooth2678
6Stubble3959
7Celery3579
8Grapes_untrained11,271
9Soil_vineyards_develop6203
10Corn_senesced_green_weeds3278
11Lettuce_romaine_4wk1068
12Lettuce_romaine_5wk1927
13Lettuce_romaine_6wk916
14Lettuce_romaine_7wk1070
15Vineyards_untrained7268
16Vineyards_vertical_trellis1807
Table 3. Land cover categories and corresponding pixel quantities within the Pavia University dataset.
No.Class LabelsSamples
1Asphalt6631
2Meadows18,649
3Gravel2099
4Trees3064
5Painted_metal_sheets1345
6Bare_Soil5029
7Bitumen1330
8Self_Locking_Bricks3682
9Shadows947
Table 4. Land cover categories and corresponding pixel quantities within the Indian Pines dataset.
No.Class LabelsSamples
1Alfalfafa46
2Corn-no till1428
3Corn-mintill830
4Corn237
5Grass-pasture483
6Grass-trees730
7Grass-pasture-mowed28
8Hay-windrowed478
9Oats20
10Soybean-no till972
11Soybean-mintill2455
12Soybean-clean593
13Wheat205
14Woods1265
15Buildings-Grass-Trees-Drives386
16Stone-Steel-Towers93
Table 5. A thorough evaluation of classification performance metrics was carried out for the Salinas Scene dataset. This in-depth analysis aimed to provide a comprehensive understanding of how well the proposed spectrally segmented-enhanced neural network (SENN) model performed in classifying hyperspectral imagery within the context of the Salinas Scene dataset.
Segmentation
Basis
Dimensionality ReductionSAPUIP
OAKappaAAOAKappaAAOAKappaAA
Mutual InformationPCA97.3597.1697.2897.5997.8397.6498.6498.5298.63
MNF98.8298.8698.6396.3296.1796.0498.4898.2498.35
FA99.1999.2198.8799.4699.2999.3797.8297.6597.75
CorrelationPCA99.2199.1299.1599.3599.2799.2398.8498.7898.69
MNF98.6398.3898.2199.3299.2299.1498.6597.8598.11
FA99.5899.4799.5199.4699.3899.4399.1899.0599.13
Table 6. The impact of different 3D patch window sizes on the efficacy of the proposed method was investigated across various datasets. This analysis sought to understand how variations in the size of the 3D patch window influenced the performance of the proposed spectrally segmented-enhanced neural network (SENN) method across different datasets.
Window SizeSAPUIP
OAKappaAAOAKappaAAOAKappaAA
9 × 999.1598.3698.8799.1998.8799.0497.4997.2497.23
11 × 1199.3999.2799.3199.1898.9298.9898.8298.6398.71
13 × 1399.4599.2999.3899.3799.2199.2498.9698.5998.86
15 × 1599.5899.5299.5499.4699.3399.4199.1498.7598.98
17 × 1799.5399.4199.4599.3599.2299.2999.1198.7298.02
19 × 1999.5699.4699.4999.4399.3699.3999.1898.9799.12
21 × 2199.4799.4499.4299.4199.1899.2699.1398.8399.96
25 × 2599.5199.3899.4499.3999.2799.3399.0798.7998.94
Table 7. A comprehensive analysis of classification performance metrics was conducted for the Salinas Scene dataset. This thorough examination aimed to provide detailed insights into the effectiveness of the proposed spectrally segmented-enhanced neural network (SENN) model in classifying hyperspectral imagery within the Salinas Scene dataset.
Class 2D CNN3D CNNFast 3D CNNHybridSNSpectral NETTRI-CNNProposed
196.3499.1999.1399.5799.6698.9599.62
297.9499.1198.4198.8899.3499.1599.18
397.8898.9098.6999.0699.6199.7499.64
495.5398.4898.4898.7699.4299.0599.57
597.5998.8498.8499.2599.2699.7399.53
696.9497.9098.9099.2199.6099.6299.48
796.9299.5699.0199.1599.2199.0499.39
896.9398.5498.5498.8497.4397.6399.63
996.4499.2899.2899.5499.2699.5199.62
1095.6998.6898.6899.5099.2299.7399.46
1194.9498.9598.7599.0999.2299.4599.51
1297.8399.2099.2199.2799.0699.2499.28
1395.8299.0499.3298.9498.5598.8999.49
1495.6998.7198.6798.0998.9198.5599.56
1597.8198.1999.1999.0599.2599.6899.63
1696.6298.8499.2299.5499.5399.0999.59
OA96.7198.8498.9399.1399.1999.2399.58
Kappa96.6298.7398.8399.0499.1299.1799.47
AA96.6898.8098.8999.1099.1599.2099.51
Table 8. A comprehensive analysis of classification performance metrics was conducted for the Pavia University dataset. This detailed evaluation aimed to provide insights into the effectiveness of the proposed spectrally segmented-enhanced neural network (SENN) model in classifying hyperspectral imagery within the context of the Pavia University dataset.
Class 2D CNN3D CNNFast 3D CNNHybridSNSpectral NETTRI-CNNProposed
198.4099.3198.8599.3998.9499.4499.45
296.8699.4699.3799.1298.2599.1999.49
393.1499.4199.2199.2098.9299.0699.54
496.9299.2898.7699.3698.5199.3499.40
596.0797.9598.7698.6799.5398.3799.43
692.3798.9298.9999.1298.7799.3099.53
797.0997.2598.4798.7498.8498.7299.34
898.4098.8299.3698.9298.9999.2399.53
995.9098.4197.8998.6699.4798.6299.16
OA96.1998.8198.8999.0998.9299.1299.46
Kappa96.0698.6698.7999.8898.6998.9499.38
AA96.1298.7598.8599.0298.8799.0399.43
Table 9. A comprehensive analysis of classification performance metrics was conducted for the Indian Pines dataset. This meticulous evaluation aimed to provide a detailed assessment of the proposed spectrally segmented-enhanced neural network (SENN) model’s effectiveness in classifying hyperspectral imagery within the Indian Pines dataset.
Class 2D CNN3D CNNFast 3D CNNHybridSNSpectral NETTRI-CNNProposed
198.2399.1599.1399.2999.4198.5299.23
295.6699.3199.0598.8199.0298.8499.12
396.3298.3698.8499.3199.3499.3699.41
495.9398.4398.4298.9299.2098.8599.33
595.4499.2498.7899.0298.9399.3599.61
693.6798.6697.8498.9399.2898.1198.79
796.0999.1398.9499.3899.0698.3799.32
894.4297.9698.4899.2597.1198.1698.54
995.8899.2799.2299.3198.8299.3299.39
1093.7298.2998.6299.2598.5998.0598.15
1196.9799.4298.3599.3499.0898.4499.34
1296.8699.1999.1499.0298.9398.1599.71
1396.3598.7398.9898.2998.8399.3198.89
1496.7299.4198.6595.6199.2298.6299.11
1594.8497.1999.1398.8198.6498.9699.07
1696.6598.0499.1399.1798.8898.7399.21
OA95.9398.7798.8398.9698.9298.7199.18
Kappa95.7698.6998.7298.8998.8198.6399.05
AA95.8598.7398.7998.9298.8998.6999.13
Table 10. Comparison of the neat outcomes including class-wise accuracies achieved using the proposed model across three datasets, providing both mean and standard deviation values obtained from 10 experiments.
Class Mean ValuesStandard Deviation
SAIPPUSAIPPU
199.6299.2399.4599.5999.2199.44
299.1899.1299.4999.1699.0999.45
399.6499.4199.5499.6199.499.52
499.5799.3399.4099.5399.3299.39
599.5399.6199.4399.5199.5799.41
699.4898.7999.5399.4598.7499.52
799.3999.3299.3499.3799.3199.32
899.6398.5499.5399.6198.5299.51
999.6299.3999.1699.6199.3799.13
1099.4698.15 99.4398.12
1199.5199.34 99.4999.33
1299.2899.71 99.2799.69
1399.4998.89 99.4798.81
1499.5699.11 99.5599.06
1599.6399.07 99.6199.04
1699.5999.18 99.5899.16
OA99.5899.1899.4699.5699.1499.42
Kappa99.4799.0599.3899.4499.0299.33
AA99.5199.1399.4399.4999.1099.41
Table 11. A comparative analysis of training times (in seconds) was conducted for various deep learning models across three benchmark datasets, each utilizing 5% of the training data. This comparison aimed to provide insights into the efficiency and computational performance of different models, highlighting the training time variations among them.
Dataset 2D CNN3D CNNFast 3D CNNHybridSNSpectral NETTRI-CNNProposed
Models
Salinas Scene79.62138.4390.6284.46118.693.9981.44
Pavia University75.86129.1986.7685.98110.9987.6878.77
Indian Pines71.07123.6874.9678.47101.7779.8270.61
Table 12. A thorough examination of classification performance metrics was undertaken for the Salinas Scene dataset, utilizing 5% of the training data. This comprehensive analysis aimed to provide a detailed assessment of the proposed spectrally segmented-enhanced neural network (SENN) model’s effectiveness in classifying hyperspectral imagery within the specified training data subset.
ClassesPrecisionRecallF1-ScoreSupport
11.001.001.001909
21.001.001.003540
31.000.991.001877
41.001.001.001229
51.001.001.002544
61.001.001.003761
70.991.000.993400
81.001.001.0010,707
91.001.001.005893
101.001.001.003114
111.001.000.991015
121.001.001.001831
131.000.990.99870
141.000.991.001017
151.001.001.006905
161.001.001.001717
accuracy 1.0051,329
Mac. Avg.1.000.990.9951,329
Wgt. Avg.1.001.000.9951,329
Table 13. A comprehensive analysis of classification performance metrics was conducted for the Pavia University dataset (using 5% of training data).
ClassesPrecisionRecallF1-ScoreSupport
10.991.001.006299
21.001.001.0017,717
31.000.981.001994
40.991.000.992911
50.990.991.001278
61.001.001.004778
71.001.001.001264
81.001.000.993498
90.981.000.98900
Accuracy 1.0040,639
Mac. Avg.0.990.990.9940,639
Wgt. Avg.1.000.991.0040,639
Table 14. A comprehensive analysis of classification performance metrics was conducted for the Indian Pines dataset (using 5% of training data).
ClassesPrecisionRecallF1-ScoreSupport
11.001.001.0044
21.000.960.981357
30.971.000.99789
40.990.990.99225
51.001.000.99459
61.001.001.00694
70.961.000.9827
81.001.001.00454
91.000.850.8619
100.971.000.99923
110.981.000.992332
120.990.960.98563
131.001.001.00195
141.001.001.001202
151.000.980.99367
160.950.960.9588
Accuracy 0.999738
Mac. Avg.0.990.980.989738
Wgt. Avg.0.990.990.999738
Table 15. Ablation studies were conducted to analyze the impact of various components’ combinations of the proposed entire SENN approach.
DatasetMethod
Without SegmentationWith Segmentation (Multibranch)
2D CNN3D CNN3D-2D CNN SVM3D-2D CNN-SVM2D CNN3D CNN3D-2D CNNSENN (Overall Proposed Approach)
SA98.1498.4398.8792.6298.7696.2198.6499.2499.58
PU97.9698.3198.6591.2397.9696.8698.9399.1999.46
IP97.1597.8898.2387.3797.8995.6798.5599.1199.18
Disclaimer/Publisher’s Note: The statements, opinions and data contained in all publications are solely those of the individual author(s) and contributor(s) and not of MDPI and/or the editor(s). MDPI and/or the editor(s) disclaim responsibility for any injury to people or property resulting from any ideas, methods, instructions or products referred to in the content.

