
A Weak Sample Optimisation Method for Building Classification in a Semi-Supervised Deep Learning Framework
by
 ,
,
Yanjun Wang
1,2,*,
Yunhao Lin
1,2,
Huiqing Huang
3,4,
Shuhan Wang
1,2,
Shicheng Wen
5,6 and
Hengfan Cai
1,2 1
National-Local Joint Engineering Laboratory of Geo-Spatial Information Technology, Hunan University of Science and Technology, Xiangtan 411201, China
2
School of Earth Sciences and Spatial Information Engineering, Hunan University of Science and Technology, Xiangtan 411201, China
3
The Third Surveying and Mapping Institute of Hunan Province, Changsha 410118, China
4
Hunan Geospatial Information Engineering and Technology Research Center, Changsha 410118, China
5
The Second Survey and Mapping Institute of Hunan Province, Changsha 410118, China
6
Hunan Provincial Natural Resources Survey and Monitoring Center, Changsha 410118, China
*
Author to whom correspondence should be addressed.
Remote Sens. 2023, 15(18), 4432; https://doi.org/10.3390/rs15184432
Submission received: 12 July 2023
/
Revised: 2 September 2023
/
Accepted: 5 September 2023
/
Published: 8 September 2023
(This article belongs to the Special Issue Advances in Object and Activity Detection in Remote Sensing Imagery II)
Abstract
:Deep learning has gained widespread interest in the task of building semantic segmentation modelling using remote sensing images; however, neural network models require a large number of training samples to achieve better classification performance, and the models are more sensitive to error patches in the training samples. The training samples obtained in semi-supervised classification methods need less reliable weakly labelled samples, but current semi-supervised classification research puts the generated weak samples directly into the model for applications, with less consideration of the impact of the accuracy and quality improvement of the weak samples on the subsequent model classification. Therefore, to address the problem of generating and optimising the quality of weak samples from training data in deep learning, this paper proposes a semi-supervised building classification framework. Firstly, based on the test results of the remote sensing image segmentation model and the unsupervised classification results of LiDAR point cloud data, this paper quickly generates weak image samples of buildings. Secondly, in order to improve the quality of the spots of the weak samples, an iterative optimisation strategy of the weak samples is proposed to compare and analyse the weak samples with the real samples and extract the accurate samples from the weak samples. Finally, the real samples, the weak samples, and the optimised weak samples are input into the semantic segmentation model of buildings for accuracy evaluation and analysis. The effectiveness of this paper’s approach was experimentally verified on two different building datasets, and the optimised weak samples improved by 1.9% and 0.6%, respectively, in the test accuracy mIoU compared to the initial weak samples. The results demonstrate that the semi-supervised classification framework proposed in this paper can be used to alleviate the model’s demand for a large number of real-labelled samples while improving the ability to utilise weak samples, and it can be used as an alternative to fully supervised classification methods in deep learning model applications that require a large number of training samples.

1. Introduction
High-spatial-resolution remote sensing data have shown great potential for application in areas such as precision agricultural monitoring [1,2,3], urban and rural regional planning, road traffic management [4,5], high precision navigation maps [6,7,8], environmental disaster assessment [9,10], forestry measurement [11,12,13], and military construction. Buildings, as the main body in urban construction, occupy a more important component in high-resolution remote sensing images. In urban scenes, buildings are used as an important assessment indicator to understand the development status of cities due to their wide distribution in urban areas. And because of the rich information on buildings contained in high-resolution remote sensing images, the extraction of buildings using high-resolution remote sensing images has become a current research hotspot [14,15].
At present, image semantic segmentation algorithms based on deep learning are widely used in building extraction applications, but due to the irregular distribution and large number of building data in large urban scenes obtained by sensors, the rapid production of building samples has become a challenge. The existing building semantic segmentation model requires a large number of labelled training samples as a priori knowledge in order to obtain more satisfactory accuracy results. In terms of producing training samples, the current mainstream approach is based on manual labelling, however, high-resolution building labelling in complex scenes requires a huge time cost, resulting in the acquisition speed of high-quality labels lagging far behind that of remote sensing data, which hinders the automatic extraction of remote sensing information [16].
In order to simplify the labelling process of training samples, researchers have carried out research on automatic or semi-automatic sample generation methods and have proposed semi-supervised learning strategies. The semi-supervised learning-based image semantic segmentation method uses a limited number of real samples as training data, and then makes full use of the limited labelled data and the weakly labelled data generated by unsupervised classification methods for model training, reducing the cost of acquiring accurately labelled data.
In order to secure the number of training samples to increase sample diversity and thus improve training accuracy results, many studies have explored the use of a small number of real labels to label unlabelled data, thereby expanding the number of weakly labelled samples available for training. Weakly annotated samples are often the result of feature extraction and classification of multi-source remote sensing data, benefiting from the ability of multi-source remote sensing data to provide a true visual representation of surface targets.
For example, Han et al. proposed a semi-supervised generation framework combining deep learning features, self-labelling techniques, and discriminative evaluation methods for the task of scene classification and labelling datasets, which can learn valuable information from unlabelled samples and improve classification capabilities [17]. Wang et al. formulated high-spatial-resolution remote sensing image classification as a semi-supervised depth metric learning problem, which considers group images and single images for the label consistency of unlabelled data [18]. Kaiser et al. [19] used vectorised weakly labelled samples from Open Street Map for house and road extraction, and Kang et al. created pseudo-labelled sample remote sensing using non-deep learning methods to improve the deep learning-based segmentation of small labelled datasets [20]. Xu et al. [21] trained the deep convolutional neural network (DCNN) model to obtain the spatial distribution of rice and maize in Liaoning Province using the results of the traditional classifier support vector machine (SVM) to classify images as weak samples and analysed the applicability of weak samples. Hong et al. [22] used a cross-modal deep learning framework to expand a small number of labels into a large number of labelled samples for the classification of hyperspectral images, effectively improving the efficiency of label expansion. Wang et al. [23] used self-training to achieve the label expansion of unlabelled scene images and further improved the quality of labelled samples of scene images by constraining the initial weights of the expanded labelled samples. Zhu et al. [24] considered the influence of different structural models to extract scene image features and trained two different structural classification models to simultaneously assign labels to unlabelled scene images to enhance the stability of the predicted labelling results of unlabelled samples. Ding et al. [25,26,27] and Zhang et al. [28] designed a graph convolutional neural network framework for hyperspectral image classification, which uses superpixels to cluster local spectral features, and uses the clustering results as the nodes of the graph convolution, then uses the graph convolutional network to learn the relationship between the labelled and unlabelled samples. In the case of a small number of samples, this method obtains better classification results than other methods. The spectral information of ground objects is crucial in this method, RGB images have more complex ground features than spectral images, and the method using a graph convolutional neural network needs to be optimised in the small sample data classification task, which only processes RGB images.
This type of method, from the perspective of weak sample expansion based on multi-source remote sensing data, can significantly improve the classification accuracy even with little annotated data, but the incorrectly annotated samples in the weak sample data will have an impact on the semantic segmentation model accuracy. How to improve the problem of incorrect samples in weak sample data in order to improve the classification accuracy of semantic segmentation models is still one of the directions to be investigated in semi-supervised classification methods.
Active learning (AL) [29] in supervised learning methods can effectively deal with the small sample size problem. AL iteratively enhances the predictive performance of a classifier by actively increasing the size of training data for each training iteration by utilizing an unlabelled pool of samples. In each iteration, AL enhances the training dataset by actively selecting the most valuable instances from the pool of unlabelled data, and an oracle (human- or machine-based) assigns the true class labels to these instances. Finally, these useful instances are added to the existing training dataset, and the classifier is retrained on this new training dataset. The process continues until a stopping criterion (which may be the size of the training dataset), the number of iterations, or the desired accuracy score is achieved [30]. AL is mainly applied to the processing of hyperspectral data. Due to the high dimensionality of hyperspectral data, AL can reduce the dimension and extract effective information from high-dimensional data. For example, Guo et al. [31] proposed an AL framework that stitches together the spectral and spatial features of superpixels. Similarly, Xue et al. [32] considered neighbourhood and superpixel information to enhance the uncertainty of query samples. Liu et al. [33] proposed a feature-driven AL framework to define a well-constructed feature space for hyperspectral image classification (HSIC).
Semi-supervised learning (SSL) and AL’s main goal is to use limited sample tags to achieve good generalization performance, and combined with SSL, AL is reasonable. Zhang et al. [34] proposed an RF-based semi-supervised AL method that exploits spectral–spatial features to define a query function to select the most informative samples as target candidates for the training set. Li et al. [35] adopted multinomial logistic regression with AL to segment hyperspectral images (HSIs) in a semi-supervised manner. Munoz-Mari et al. [36] utilized AL to improve the classification confidence of a hierarchical model by having it select the most informative samples. AL has also been adapted to a co-training framework in which the algorithm automatically selects new training samples from the abundant unlabelled samples. Wan et al. [37] proposed collaborative active and semi-supervised learning (CASSL) for HSI classification. Wang et al. [38] proposed a new semi-supervised active learning method that aims to discover representativeness and discriminativeness by semi-supervised active learning (DRDbSSAL). Zhang et al. [39] proposed to combine AL and hierarchical segmentation method for the classification of HSIs, where the training set was enlarged by the self-learning-based semi-supervised method. Dópido et al. [40] proposed a new framework for semi-supervised learning, which exploits active learning for unlabelled sample selection in hyperspectral data classification.
Weakly supervised refers to learning using high-level or noisy inputs from expert knowledge or crowdsourced data [16] to obtain testing accuracy comparable to that of real samples as inputs. Wang et al. [41] used image-level labels and labels consisting of individual geotagged points as weak sample sources to input into the model and converted the different classes of labels into pixel-level semantic segmentation results via a class activate map (CAM) [42] and masks.
Weakly supervised learning is a research method to investigate how to make full use of the valid samples in weak sample data so as to improve the classification accuracy of semantic segmentation models. This method is an extension of semi-supervised learning in the direction of weak sample research. Weakly supervised learning requires not only acquiring weak sample data but also inputting unlabelled data, together with a small number of labelled samples, into the weakly supervised model to learn its deep features from a large amount of unlabelled data by means of specific loss functions [43], generative adversarial networks (GANs) [44], and other contrastive learning [45] methods. This significantly reduces the need for a large number of accurately labelled samples. For example, Peng Rui et al. [46] used a contrast learning model and label propagation method to generate a large number of high-confidence labels in multi-scale unlabelled data, and finally used the expanded samples in a weakly supervised network to obtain the classification results of scene images. Liang et al. [47] constructed a weakly supervised semantic segmentation network based on conditional generative adversarial networks and used a self-training method to generate pseudo-labels of unlabelled data by a generator to achieve weakly supervised semantic segmentation. Weakly supervised learning was achieved by a self-training method in which the generator generated pseudo-labels of unlabelled data. The weakly supervised learning model obtains high-confidence labels from weak sample data with a contrast learning method, but contrast learning is a probability estimation method embedded inside the model and cannot explicitly analyse how to extract valid samples from weak sample data, and thus, improve the classification results of the weakly supervised model.
In summary, there are still some shortcomings in the field of semi-supervised building classification from high-resolution remote sensing images that need to be explored, including:
- The quality of weak samples generated based on multi-source remote sensing data needs to be improved;
- The existing weakly supervised or semi-supervised classification methods lack explicit simulation and applicability analysis of the process of generating high-quality weak samples.
In view of the above problems, this paper proposes a semi-supervised building classification framework based on multi-source remote sensing data. It draws on the idea of active learning to automatically select the optimal sample feature information, and then applies the semi-supervised classification method and active learning strategy to the classification task with only a spatial domain (no spectral information). The proposed method focuses on the generation and quality optimization of weak building samples. The innovations of this paper are as follows:
- From the perspective of constructing a weak sample generation strategy, this paper uses the unsupervised classification results of airborne LiDAR data and the test results of an image segmentation model to quickly generate initial image weak samples, thus reducing the need for the network to manually label the training samples;
- In this paper, a weak sample optimization strategy is proposed to improve the accuracy of the overall weak sample by iteratively comparing part of the weak sample with the real sample. Finally, the weak sample set with the highest iterative accuracy was sent to the high-resolution semantic segmentation network for training to improve the test accuracy of the weak samples;
- A comparative analysis of the model testing accuracy of the real sample, the initial weak sample, and the optimised weak sample for each dataset was carried out on two datasets of different high resolutions and different building types, and we discuss the applicability of the proposed semi-supervised classification framework.
Our method alleviates the problem of deep learning models requiring a large number of manually annotated samples, while the weak sample optimisation strategy improves the model testing accuracy when using weak samples as training data in semi-supervised classification studies.
2. Data Sources
This paper presents two high-resolution remote sensing image datasets as experimental areas for the building semantic segmentation task of high-resolution images. The image datasets were acquired from UAV photogrammetry, and the real samples were vector data visually interpreted and manually annotated by ArcGIS. The single image data in the dataset was too large to be fed into the network for training, and therefore, in order to improve the network training efficiency and increase the training samples, the data in the experimental area was cropped from left to right and from top to bottom. The single cropped image size for both datasets was 224 × 224, with a 50% overlap between the frames. Due to the irregular shape of the data area, the edges of the images were cropped so that images with fewer than 244 × 244 pixels were filled with a pixel value of 255. Data enhancement operations, such as rotation, horizontal flip, and affine transformation, were performed prior to network training to enhance the sample diversity.
2.1. Yuhu Urban Dataset
The Yuhu Urban dataset covers part of the urban area in Xiangtan City, Hunan Province, with a spatial resolution of 0.03 m. One image in the dataset was used as the training set, with an area size of 557 × 677 m, and one image as the test set, with an area size of 827 × 1209 m. The total number of cropped images was 14,112 for the training set, 3528 for the validation set, and 39,121 for the test set. Due to the centimetre resolution of the Yuhu Urban dataset, although the image and label samples were cropped to a large sample size for training, the overall training area was not large, the features contained in each 224 × 224-pixel image and sample were incomplete, and the dataset was a small sample for training. In this dataset, the feature topics that needed to be finely classified were buildings, including high-rise buildings, low-rise buildings, and backgrounds. The training sample areas are shown in Figure 1.
2.2. XiangXi Urban and Rural Buildings (XXURB) Public Dataset
The XXURB dataset [48] covers some urban areas in western Hunan Province, with a spatial resolution of 0.2 m. In this paper, two of the images were used as the training set, with sizes of 750 m × 832 m and 683 m × 804 m, respectively. The former image, without real sample labelling, was used as the training data for the proposed weak sample generation strategy, and the latter image, with real sample labelling, was used as the training data for the semantic segmentation model to supervise the classification of the buildings. The test data size was 904 m × 1804 m. In the XXURB dataset, the proportion of low-rise buildings was too small, so this study mainly classified the classification types into buildings and non-buildings. The training areas with real samples are shown in Figure 2.
3. Materials and Methods
3.1. Weak Sample Generation and Optimization Strategy for Buildings
The semantic segmentation model requires a large number of training samples with real labels to obtain high accuracy, while the high time and labour costs required for the labelling of a large number of real samples affect the practical application of the network model. Therefore, in order to reduce the annotation time of image training samples and reduce the workload of training sample production, this paper firstly proposes a strategy for generating weak samples of buildings based on airborne LiDAR and image data by using unsupervised classification results from LiDAR data that overlap with the training image regions and test results from image semantic segmentation models instead of hand-crafted real samples.
The overall flow chart is shown in Figure 3. From the perspective of weak sample generation, a method is proposed to generate weak samples based on the classification results of multi-source remote sensing data to reduce the amount of labelled training samples required by the model. To address the accuracy problem of weak samples, an iterative optimization strategy for weak samples is proposed for the improvement of weak sample patches, and finally, the applicability of the quality of weak samples to the semantic segmentation model is discussed.
3.2. Semantic Segmentation Model for Buildings Classification
In this paper, the FDTNet model proposed in previous studies [49] was chosen as the semantic segmentation model for buildings. FDTNet is a two-branch parallel structured network coupling the local feature information of a CNN with the global feature information of a Transformer network [50]. Previously, the fusion of CNN and Transformer was mainly based on the CNN base framework, and after continuous downsampling to obtain deep features, the Transformer module was then applied. This architecture actually still obtains partial pixel-to-pixel correlation in local areas and cannot obtain global correlation. In contrast, the FDTNet model obtains local and global features with Deeplabv3+ and Transformer, respectively, and fuses the two features with the CAFM [51] module. Considering that the representation of shallow features in CNN networks is not significant enough, it is enhanced with the CBAM module [52], and finally, the multilayer features are fused with E-Link [53] in a progressive fusion strategy form, the multi-layer features are effectively fused, and the semantic segmentation results are output. Its detailed network framework structure is shown in Figure 4.
3.3. A Weak Sample Generation Method for Buildings Based on Multi-Source Remote Sensing Data
All semantic segmentation models, including FDTNet, require a large number of training samples with real labels to obtain high accuracy, while the time and labour costs required for the annotation of a large number of real samples are high, which affects the practical application of the model. In order to reduce the annotation time of image training samples and the workload of training sample production, this paper firstly proposes a weak sample generation strategy for buildings, i.e., a method to generate weak samples of buildings based on airborne LiDAR point cloud data and image data. This includes the principle of the method for the unsupervised classification of buildings based on airborne LiDAR point cloud data, and the supervised classification method based on image data of part of the test area and real samples. Weak samples of the training area are generated using both methods.
3.3.1. A Weak Sample Generation Method Based on Airborne LiDAR Point Clouds
The unsupervised classification method of point clouds can automatically classify and extract features. The main purpose of producing weak samples with point cloud unsupervised classification is to reduce the time cost and workload of manually producing training samples. The point cloud has three-dimensional information about the building, and when converting it into image data, only the roof surface information is required in the building structure as representative information about the building in the orthophoto. In order to simplify the extraction process of unsupervised point cloud classification, only the roof point is extracted, and the building is classified according to the roof information.
In this paper, we use a well-established method for extracting point clouds from building roofs and combine the geometric attributes of building roofs to classify the roofs of two types of buildings: low-rise and high-rise. The overall flowchart of the building point cloud classification is shown in Figure 5. Firstly, a point cloud segmentation method based on height and fitted plane constraints was used to extract the roof point clouds, with the algorithm provided by the “Classify LAS Buildings” tool integrated in ArcGIS Pro. The elevation threshold was set to 16.5 m. In this paper, buildings of six storeys and above with an average height of 2.8 m were classified as high-rise buildings, while buildings of other heights were classified as low-rise buildings. Finally, the roofs of buildings with different classification labels were projected onto the 2D plane to generate weak sample labels.
3.3.2. A Weak Sample Generation Method Based on Test Area Image
Weak samples from the two training regions in the XXURB dataset were generated by applying the FDTNet model test classification to each of the two regional images and using a small number of real samples from the test region (Figure 6) as the training set. The test region needed real sample data for accuracy evaluation, while the unlabelled sample region had no real samples. Using some real samples from the test region as training to generate weak samples from the unlabelled region can reduce the substantial time cost of manually labelling samples.
3.4. Optimisation Strategies for Weak Samples of Buildings
Compared with the real annotated strong training samples, the labelled data obtained by classification methods are weak samples, and the weak sample data carry error samples that confuse the cognitive ability of the semantic segmentation model. Therefore, we proposed an iterative optimization strategy for weak samples to improve the correctness of the weak samples in view of the problem that, the accuracy of the weak samples generated from airborne LiDAR point cloud data and image data is too low, which leads to the degradation of the accuracy of the model test results.
3.4.1. Division of Training Areas
Before running the weak sample optimization strategy, the Yuhu Urban dataset and the XXURB dataset were divided into regions.
As shown in Figure 7, the entire Yuhu Urban dataset was divided in a 1:4:5 ratio, where 10% of the training area had weak and real samples of buildings generated based on airborne LiDAR point clouds, and the remaining 40% of the training area belonged to areas without real sample markers but with weak samples generated by LiDAR, while the area used as a test set in the above Yuhu urban dataset accounted for 50% of the entire study area. The regional division of the XXURB dataset is shown in Figure 8.
3.4.2. An Optimisation Strategies for Weak Samples
A detailed flowchart of the iterative building weak sample optimisation strategy is shown in Figure 9 below, taking the weak sample optimisation process for the Yuhu Urban dataset as an example, in order to verify that, the weak sample optimisation strategy can reduce the time cost of manually produced samples, so only a proportion of 10% of the real sample areas have manually labelled real samples, while the remaining 40% proportion of the training areas have only weak samples generated by LiDAR. Similarly, for the XXURB dataset, a proportion of 25% of the real sample areas have manually labelled real samples, while the remaining 25% of the training areas have only weak samples of images generated from the model test results.
The weak sample iterative optimization strategy is implemented on the basis of having 10% real samples.
- (1)
- Firstly, the LiDAR weak samples from the and regions are input into the network model as training data to obtain model training parameter weights for the initial LiDAR weak samples, and the model parameter weights are used to self-test the image datasets from the two training regions;
- (2)
- Then the classification results obtained from the self-test are compared with the real samples on the patches, and the classification result patches are intersected with the real samples to take the merge operation to extract the correct patches in the classification results, and the correct patches are used as one of the training samples. In the region, since there is no real sample, the test classification result is directly used as the training sample and input into the model together with the correct classification result spot of for a new round of self-training and self-test verification and iteration of the correct sample in the real sample region;
- (3)
- In the process of iteration, when the classification accuracy of from training and self-testing no longer improves, the iteration is stopped and the weights of the model training parameters of the current round are output for the final prediction of the classification result of the test region , which is the final test accuracy result of the weak sample optimization strategy.
After iterative optimisation of the weak samples in the two datasets, the weak samples of buildings, the optimised weak samples of buildings and the real samples of buildings, respectively, were input into the FDTNet model for classification experiments, and then we analysed the applicability of the weak sample optimisation strategy proposed in this study, from the test accuracy results obtained for the three samples.
4. Results
4.1. Experimental Environment and Evaluation Indicators
This experiment use pyTorch 1.11.0 as the deep learning programming framework, an SGD optimiser with an initial learning rate of 0.01 was used during training, and a Warmup strategy to automatically adjust the learning rate as the number of training rounds increases in order to better train the model. The batch size in the experiments was 4 and all network models were iterated for 30 epochs. The training and inference phases are used on a computer equipped with GeForce RTX 1080Ti and i7-9700k CPU with 32 GB memory.
Using pixel-level accuracy to evaluate building classification results, this paper selects three representative metrics for semantic segmentation network evaluation, namely the intersection of each class , the average () and the overall accuracy () to assess the performance of this study’s method and comparative methods. In particular, the overall accuracy indicates the global accuracy, which does not take into account individual classes but measures the classification accuracy of all classes; refers to the percentage of the predicted number of pixels in a single class that intersect and merge with the true pixels in that class. The specific calculations for the three evaluation metrics are shown in Equations (1) to (3).
In the above equation, indicates the number of features to be classified, indicates the number of pixels of feature class predicted to be true; indicates the number of pixels of feature class predicted to be non-class i features; indicates the number of pixels of non-class features predicted to be true.
4.2. Results of Building Semantic Segmentation with FDTNet Model
4.2.1. Results and Analysis of the Yuhu Urban Dataset
Table 1 shows the accuracy evaluation results of each model for semantic segmentation of building types in the Yuhu Urban dataset test area, including the FDTNet model, UNet [54] and DeepLabv3+ [55]. In this table, we show the and of the models, as well as the evaluation analysis of the for each building type. Figure 10 shows the qualitative comparison results in the Yuhu Urban dataset. It is worth noting that the Yuhu Urban dataset was trained with a small sample range of regions for validating a large range of test regions, and therefore the prediction accuracy of all the semantic segmentation models applied in Table 1 is generally low.
In Table 1, the FDTNet model achieves the highest test accuracy in all evaluation metrics, with of 70.8% and of 83.7%, for the same pre-processing and network parameter settings for the prediction results of the test area. Compared to the underlying network structure, DeepLabv3+, FDTNet has improved on all types of features, with 1.2%, 2.1% and 3.6% improvement in the background category, high-rise building category and low-rise building respectively. In addition to using the ResNet backbone model, FDTNet also introduces an attention mechanism module and a multi-level feature fusion strategy to enhance the extraction of shallow texture features, so that FDTNet’s classification ability on low-rise building classes with complex and diverse textures is substantially improved compared to DeepLabv3+.
4.2.2. Results and Analysis of the XXURB Dataset
In this paper, the FDTNet model is used to compare and analyse the sub-metre scale XXURB dataset, which obtained from UAV tilt photography, and the applicability of FDTNet for fine semantic segmentation has been further verified through the classification and extraction of buildings on datasets with different resolution scales.
The XXURB dataset has two training regions and one test region, and only one training region has real annotated samples. In this section, the training set with real samples annotated is used to train different building classification models, and the results of the accuracy evaluation of the test area are shown in Table 2. An example of the classification results of each network model in the XXURB dataset is shown in Figure 11 below.
From Table 2, it can be seen that our FDTNet model has at least 4.9% higher and at least 2.1% higher in the binary classification problem for buildings compared to other classification models. The of the building class shows that the FDTNet model achieves a classification accuracy of 74.7%, while the of the other comparison methods is less than 70%, which verifying that the FDTNet model has the highest building recognition performance among all model methods. Compared to the classification results of the underlying network branch DeepLabv3+, the FDTNet model has gained a significant improvement in its ability to classify buildings after the improvement of the model framework.
4.3. Results of Building Weak Sample Generation
4.3.1. Unsupervised Weak Sample Generation Method Based on Point Cloud
To compare the difference in building classification accuracy between airborne LiDAR weak samples and real sample, the range of the airborne LiDAR data was aligned with the training area in the Yuhu Urban dataset. After the LiDAR data in the training region were segmented using a roof point cloud segmentation method based on height and fitted plane constraints, the results of the building roof point cloud labels and other background class labels were obtained as shown in Figure 12. In Figure 12b, points in RGB represent extracted building roof point label, black points represent background label.
By projecting the roof point cloud classification results onto the plane, a weak sample of the building is obtained and its comparison with the real sample is shown in Figure 13.
In this paper, the building roof classification method based on height and fitted plane constraints used achieves only 59.7% of for building classification. Combining the analysis of the original point cloud and the classification result, it can be seen that due to the incomplete scanning of the LiDAR instrument and the lack of recognition capability of the extraction algorithm, a large area of high-rise buildings in the lower left corner failed to generate a more complete weak sample, which resulting in a lower accuracy of the classification. Furthermore, in the actual urban scenes, different types of roofs are connected to each other, and the classification of different roofs by height will lead to the classification of roofs belonging to the same building type into two types, so that the generated weak samples will be different from the real samples, resulting in the confusion of two different types of buildings.
In this paper, the classification results of LiDAR data with limited accuracy are used as training weak samples, and the classification accuracy results of the test area of Yuhu urban dataset are output. In addition, to address the accuracy quality of LiDAR weak samples, this paper proposes an optimal iterative strategy to improve the accuracy of weak sample training.
4.3.2. Weak Sample Generation Method Based on Test Area Image
With the small sample size of the Yuhu Urban dataset, the model is only able to learn to acquire features for a small number of samples, and the samples of each type of feature have a greater impact on the model training. The weak samples reduce the completeness and accuracy of the real samples in the small sample area, making the model less capable of learning the differential features of each type of feature, and the model is unable to achieve accuracy similar to the real sample test results without manually adding real samples. In order to further verify the applicability of the weak sample iterative optimisation strategy, under the condition that the sample size of the weak samples is sufficient, in this section, experiments on a sample optimisation strategy based on weak samples of images are conducted in the XXURB dataset. The XXURB dataset has a large regional scope and sufficient sample size for training samples. Considering the possible quality problems of the weak samples of LiDAR classification results, this dataset chooses to obtain the weak samples from the model test results of the images.
The result of the semantic segmentation of weak samples in the two training regions are shown in Figure 14.
Table 3 shows the weak sample accuracy results for the two training regions. The of the weak sample in the two training regions is close to 80%, which is a substantial improvement in both sample size and sample accuracy compared to the Yuhu Urban dataset, and can be used to discuss the applicability of the weak sample optimisation strategy, when the weak sample has good quality.
4.4. Results of Building Classification Based on Weak Sample Optimization Strategy
Based on the weak samples generated, the weak sample optimization strategy was used to optimize the experimental analysis of two datasets, and compare the differences in test results produced by the two weak sample before and after optimisation.
4.4.1. Results of an Optimization Strategy Based on Point Cloud Weak Sample
Table 4 shows the classification result accuracy of the FDTNet model for the test region , when the manually labelled samples and the LiDAR weak samples from the region are used as the training set respectively. Among them, the test reached 64.9%, when manually labelled real samples were used as the training, compared to the fully supervised classification results in Section 4.2.1, when real samples from both training regions were used as the training at the same time, there was a 5.9% difference in the test . This result indicating that the FDTNet semantic segmentation model still needs a large number of accurately real labelled samples to improve the accuracy of the model classification.
In Table 5, the model classification results for the are shown, when using LiDAR weak samples from the real training region and the unlabelled sample region () as the training set, with or without the weak sample optimisation strategy. As seen in the table, when LiDAR weak samples from both training regions are used as training, compared to the LiDAR weak sample test results from in Table 4, there is a 3.4% improvement in test accuracy, and the results indicate that the increase in the amount of weak sample data can improve the test accuracy. In this paper, the applicability of the semantic segmentation model to weak samples is analysed by comparing experiments with the UNet model and the FDTNet model. After using FDTNet as the semantic segmentation model for optimisation, the is improved by 1.9%, which verifies the effectiveness of the iterative optimisation strategy for LiDAR weak samples in improving the accuracy of the model. While the optimisation using the UNet model only improves by 1.0%, the results indicate that FDTNet is more suitable for the iterative optimisation strategy for weak samples than the UNet model.
In summary, the accuracy results from the two tables show that an increase in the amount of data from either real or weak samples leads to an increase in test accuracy. However, there was a difference in the magnitude of the lift between the two, with a 2.5% difference between the weak sample and the true sample, because the classification results from LiDAR data do not achieve the accuracy of a real sample. Weak samples produced by LiDAR classification not only have partially accurate samples of classified patches, but also have misclassified patches interfering with the model’s accurate perception of the building, thus affecting the test accuracy result. Therefore, this paper proposes an iterative optimization strategy for the weak samples of buildings, by comparing the self-training self-test results of the weak samples with the real samples, and obtaining the spots with correct model cognition in the weak sample results as samples for retraining. The semantic segmentation accuracy is improved by reducing the cognitive interference with the model from the wrong sample in the weak sample of LiDAR data.
4.4.2. Results of an Optimization Strategy Based on Image Weak Sample
Table 6 shows the classification results of the FDTNet model in the XXURB dataset, when the manually labelled samples and the image weak samples of the are used as the training respectively. The of the test region reaches 80.6%, when the image weak samples are used as the training, which is only 2.4% different from the test result of the real samples.
In Table 7, the classification results of the FDTNet model on with and without the weak sample optimisation strategy are shown, when using weak samples of images from and as the training. The test improves by 1.5%, reaches 82.1%, when adding the weak samples from the 25% occupied region as training, compared to only the weak samples from the 25% occupied region as training, however, compared to the test when using real samples from 25% of the real sample area as training, there was a 0.9% drop. The results again validate that, adding weak samples allows the model to acquire more training features, but the incorrect classification patches carried in the weak samples affect the model’s ability to learn the correct sample features, resulting in weaker sample test classification results than the real samples.
In order to eliminate the error patches in the weak samples and thus improve the classification accuracy of the weak samples, this paper applies a weak sample iterative optimization strategy to the image weak samples. By comparing the image weak samples with the real samples in , eliminating the error sample patches, and iteratively optimising the weak samples in , the weak samples in are indirectly optimised by the self-training self-testing method, so that the weak samples in the two training regions of the building reach the optimal iterative accuracy, and finally the optimal model training parameters generated by the iterative weak samples are used for the final test.
The accuracy of is similarly shown in Table 7. Compared to before the iterative optimization, the optimized improved by 0.6%, reaches 82.7%, and the difference in was less than 1% compared to the fully supervised classification results with 50% of the real samples from the training regions.
5. Discussion
In the LiDAR point cloud weak sample iterative optimization experiments, although the iterative optimization strategy improved the test accuracy of the building semantic segmentation model, when using exclusively LiDAR weak samples as training region, but the final optimised test accuracy still falls short of the test accuracy of the real samples. This section discusses the main reason, why the test accuracy of the LiDAR weak samples is much lower than that of the real samples in the building classification experiments for the Yuhu Urban dataset.
The first factor considered in this paper is, the uncertainty of weak samples in the during each iteration, which affects the final optimization accuracy.
So, we added the area’s real samples to the optimisation iteration process, i.e., the weak samples from the two training region datasets were simultaneously optimised with their real samples. And the test accuracy evaluation results obtained are shown in Table 8, where the “FDTNet (after optimization+)+” in the table represents the addition of the real samples from to the comparison iteration. As can be seen from Table 8, the of all kinds of buildings are dropped. Overall, whether or not the real samples of the were added did not have an impact on the classification of the .
After excluding the influence of the weak sample iterative optimisation strategy and the semantic segmentation model used on the applicability of the weak samples, the main influence is that the LiDAR weak sample data lacks the key feature samples that can identify and distinguish between classes of buildings compared to the real samples.
The classification mIoU for LiDAR buildings (roof point cloud) in Section 3.3.1 was only 59.9%. As shown in Figure 15, the roof of the high-rise building in the lower left region of the image was never correctly classified throughout the weak sample optimisation method process.
Due to the lack of building samples and their features in the figure, so that the subsequent model cannot learn the features of such high-rise buildings. And the wide distribution of such buildings in the test area, the model cannot learn their features when training, thus resulting in the low classification accuracy of high-rise buildings in the test area. Therefore, the accuracy and completeness of the LiDAR weak sample labels are the main reasons affecting the accuracy of the iterative optimization algorithm. When the LiDAR weak samples of typical features are insufficient, the semantic segmentation accuracy of the model decreases significantly, and the test accuracy of the model cannot approach the test accuracy of the real samples, regardless of whether the subsequent iterative optimization strategy is used.
In contrast, the classification accuracy of the weak sample in the XXURB dataset reached 80%, and the weak training sample size was sufficient, so the difference between the weak sample test accuracy of the model and that of the real sample was less than 1%. This result demonstrates that when there are sufficient key features in the weak samples, the test accuracy of the optimised weak samples can be iterated to be close to that of the real samples, and further demonstrates the applicability of the weak sample iterative optimisation strategy proposed in this paper.
6. Conclusions
In this paper, a semi-supervised learning model framework is proposed to alleviate the problem that, building semantic segmentation models require a large number of real samples to achieve good classification accuracy. Firstly, the method of generating weak samples based on airborne LiDAR point cloud data and image data can effectively reduce the time cost of manually annotating samples; Secondly, the weak sample iterative optimisation strategy proposed in this paper can improve the testing accuracy of the semantic segmentation model, when weak samples are selected as training samples, with 1.9% and 0.6% improvement on two building datasets respectively; Finally, the paper discusses the impact of the quality of the weak samples on the accuracy of the model tests. It is concluded that when the initial accuracy of the weak sample is good and there are sufficient key features in the weak sample, the gap between the test accuracy of the weak sample, i.e., the test accuracy of the weak samples after using the iterative optimization strategy is close to the real samples. In this paper, we propose a building weak sample generation and optimization strategy that reduces the time cost of a large number of manually labelled samples, under the condition that the amount of weak sample data is sufficient and of good quality, and at the expense of a small amount of classification accuracy. The method in this paper can be used instead of a fully supervised learning method with real samples for semantic segmentation and extraction of buildings in high resolution remote sensing images.
The weak sample generation and optimization strategy proposed in this study is mainly used to simulate the implementation process of weakly supervised learning model. However, the real weakly supervised model does not need to deal with the weak samples separately. Instead, the labelled samples and unlabelled samples are directly input into the weakly supervised model, and the optimized weak sample classification results are automatically obtained through the generator, discriminator, discriminant loss function and so on. Therefore, the next step is to design an end-to-end weakly supervised learning model to automatically obtain weak samples of unlabelled data and output test classification results. At the same time, multi-modal remote sensing data is introduced for weak sample generation and multiple weak sample feature learning, which can further propose the applicability of weak/semi-supervised classification models.
Author Contributions
Conceptualization, Y.W.; methodology, Y.W., Y.L. and H.C.; software, S.W. (Shuhan Wang) and H.H.; validation, S.W. (Shicheng Wen) and H.C.; formal analysis, Y.L. and H.C.; investigation, S.W. (Shuhan Wang) and H.C.; resources, Y.W. and Y.L.; data curation, Y.L. and H.C.; writing—original draft preparation, Y.L. and H.C.; writing—review and editing, Y.W. and S.W. (Shuhan Wang); visualization, H.H. and S.W. (Shicheng Wen); supervision, Y.W. and S.W. (Shuhan Wang); and project administration, Y.W. All authors have read and agreed to the published version of the manuscript.
Funding
This research was funded by the National Natural Science Foundation of China (Nos. 41971423 and 31972951).
Data Availability Statement
No new data were created or analyzed in this study. Data sharing is not applicable to this article.
Conflicts of Interest
The authors declare no conflict of interest.
References
- Kwak, G.H.; Park, C.W.; Lee, K.D.; Na, S.I.; Ahn, H.Y.; Park, N.W. Potential of hybrid CNN-RF model for early crop mapping with limited input data. Remote Sens. 2021, 13, 1629. [Google Scholar] [CrossRef]
- Zhong, Y.; Hu, X.; Luo, C.; Wang, X.; Zhao, J.; Zhang, L. WHU-Hi: UAV-borne hyperspectral with high spatial resolution (H2) benchmark datasets and classifier for precise crop identification based on deep convolutional neural network with CRF. Remote Sens. Environ. 2020, 250, 112012. [Google Scholar] [CrossRef]
- Hu, X.; Wang, X.; Zhong, Y.; Zhang, L. S3ANet: Spectral-spatial-scale attention network for end-to-end precise crop classification based on UAV-borne H2 imagery. ISPRS J. Photogramm. Remote Sens. 2022, 183, 147–163. [Google Scholar] [CrossRef]
- Ghandorh, H.; Boulila, W.; Masood, S.; Koubaa, A.; Ahmed, F.; Ahmad, J. Semantic segmentation and edge detection—Approach to road detection in very high resolution satellite images. Remote Sens. 2022, 14, 613. [Google Scholar] [CrossRef]
- Chen, W.; Zhou, G.; Liu, Z.; Li, X.; Zheng, X.; Wang, L. NIGAN: A framework for mountain road extraction integrating remote sensing road-scene neighborhood probability enhancements and improved conditional generative adversarial network. IEEE Trans. Geosci. Remote Sens. 2022, 60, 1–15. [Google Scholar] [CrossRef]
- Mi, X.; Yang, B.; Dong, Z.; Chen, C.; Gu, J. Automated 3D road boundary extraction and vectorization using MLS point clouds. IEEE Trans. Intell. Transp. Syst. 2021, 23, 5287–5297. [Google Scholar] [CrossRef]
- Zai, D.; Li, J.; Guo, Y.; Cheng, M.; Lin, Y.; Luo, H.; Wang, C. 3-D road boundary extraction from mobile laser scanning data via supervoxels and graph cuts. IEEE Trans. Intell. Transp. Syst. 2017, 19, 802–813. [Google Scholar] [CrossRef]
- Wang, Y.; Lin, Y.; Wang, S.; Li, S.; Wang, M. 3D road boundary extraction based on mobile laser scanning point clouds and OSM data. Bull. Surv. Mapp. 2022, 2022, 18–25. (In Chinese) [Google Scholar]
- Jiang, H.; Peng, M.; Zhong, Y.; Xie, H.; Hao, Z.; Lin, J.; Ma, X.; Hu, X. A survey on deep learning-based change detection from high-resolution remote sensing images. Remote Sens. 2022, 14, 1552. [Google Scholar] [CrossRef]
- Chowdhury, T.; Rahnemoonfar, M. Attention based semantic segmentation on UAV dataset for natural disaster damage assessment. In Proceedings of the 2021 IEEE International Geoscience and Remote Sensing Symposium IGARSS, Brussels, Belgium, 11–16 July 2021; pp. 2325–2328. [Google Scholar]
- Furze, S.; O’Sullivan, A.M.; Allard, S.; Pronk, T.; Curry, R.A. A High-Resolution, Random Forest Approach to Mapping Depth-to-Bedrock across Shallow Overburden and Post-Glacial Terrain. Remote Sens. 2021, 13, 4210. [Google Scholar] [CrossRef]
- Liu, Y.; Zhang, H.; Cui, Z.; Lei, K.; Zuo, Y.; Wang, J.; Hu, X.; Qiu, H. Very High Resolution Images and Superpixel-Enhanced Deep Neural Forest Promote Urban Tree Canopy Detection. Remote Sens. 2023, 15, 519. [Google Scholar] [CrossRef]
- Wang, Y.; Lin, Y.; Cai, H.; Li, S. Hierarchical Fine Extraction Method of Street Tree Information from Mobile LiDAR Point Cloud Data. Appl. Sci. 2023, 13, 276. [Google Scholar] [CrossRef]
- Wang, Y.; Zeng, X.; Liao, X.; Zhuang, D. B-FGC-Net: A Building Extraction Network from High Resolution Remote Sensing Imagery. Remote Sens. 2022, 14, 269. [Google Scholar] [CrossRef]
- Hosseinpour, H.; Samadzadegan, F.; Javan, F.D. CMGFNet: A deep cross-modal gated fusion network for building extraction from very high-resolution remote sensing images. ISPRS J. Photogramm. Remote Sens. 2022, 184, 96–115. [Google Scholar] [CrossRef]
- Zhou, Z.H. A brief introduction to weakly supervised learning. Natl. Sci. Rev. 2018, 5, 44–53. [Google Scholar] [CrossRef]
- Han, W.; Feng, R.; Wang, L.; Cheng, Y. A semi-supervised generative framework with deep learning features for high-resolution remote sensing image scene classification. ISPRS J. Photogramm. Remote Sens. 2018, 145, 23–43. [Google Scholar] [CrossRef]
- Wang, Y.; Zhang, L.; Deng, H.; Lu, J.; Huang, H.; Zhang, L.; Liu, J.; Tang, H.; Xing, X. Learning a discriminative distance metric with label consistency for scene classification. IEEE Trans. Geosci. Remote Sens. 2017, 55, 4427–4440. [Google Scholar] [CrossRef]
- Kaiser, P.; Wegner, J.D.; Lucchi, A.; Jaggi, M.; Hofmann, T.; Schindler, K. Learning aerial image segmentation from online maps. IEEE Trans. Geosci. Remote Sens. 2017, 55, 6054–6068. [Google Scholar] [CrossRef]
- Kang, X.; Zhuo, B.; Duan, P. Semi-supervised deep learning for hyperspectral image classification. Remote Sens. Lett. 2019, 10, 353–362. [Google Scholar] [CrossRef]
- Xu, Q.; Zhang, J.S.; Zhang, F.; Ge, S.; Yang, Z.; Duan, Y. Applicability of weak samples to deep learning crop classification. Natl. Remote Sens. Bull. 2022, 26, 1395–1409. (In Chinese) [Google Scholar] [CrossRef]
- Hong, D.; Yokoya, N.; Xia, G.S.; Chanussot, J.; Zhu, X.X. X-ModalNet: A semi-supervised deep cross-modal network for classification of remote sensing data. ISPRS J. Photogramm. Remote Sens. 2020, 167, 12–23. [Google Scholar] [CrossRef]
- Wang, C.; Shi, J.; Ni, Y.; Zhou, Y.; Yang, X.; Wei, S.; Zhang, X. Semi-supervised learning-based remote sensing image scene classification via adaptive perturbation training. In Proceedings of the IGARSS 2020–2020 IEEE International Geoscience and Remote Sensing Symposium, Waikoloa, HI, USA, 26 September–2 October 2020; pp. 541–544. [Google Scholar]
- Zhu, X.; Ghahramani, Z. Learning from labels and unlabeled data with label propagation. Tech. Rep. 2002, 3175, 237–244. [Google Scholar] [CrossRef]
- Ding, Y.; Zhang, Z.; Zhao, X.; Hong, D.; Li, W.; Cai, W.; Zhan, Y. AF2GNN: Graph convolution with adaptive filters and aggregator fusion for hyperspectral image classification. Inf. Sci. 2022, 602, 201–219. [Google Scholar] [CrossRef]
- Ding, Y.; Zhang, Z.; Zhao, X.; Hong, D.; Cai, W.; Yu, C.; Yang, N.; Cai, W. Multi-feature fusion: Graph neural network and CNN combining for hyperspectral image classification. Neurocomputing 2022, 501, 246–257. [Google Scholar] [CrossRef]
- Ding, Y.; Zhang, Z.; Zhao, X.; Hong, D.; Cai, W.; Yang, N.; Wang, B. Multi-scale receptive fields: Graph attention neural network for hyperspectral image classification. Expert Syst. Appl. 2023, 223, 119858. [Google Scholar] [CrossRef]
- Zhang, Z.; Ding, Y.; Zhao, X.; Siye, L.; Yang, N.; Cai, Y.; Zhan, Y. Multireceptive field: An adaptive path aggregation graph neural framework for hyperspectral image classification. Expert Syst. Appl. 2023, 217, 119508. [Google Scholar] [CrossRef]
- Settles, B. Active Learning Literature Survey; CS Technical Reports; University of Wisconsin-Madison: Madison, WI, USA, 2009. [Google Scholar]
- Ahmad, M.; Shabbir, S.; Roy, S.K.; Hong, D.; Wu, X.; Yao, J.; Khan, A.M.; Mazzara, M.; Distefano, S.; Chanussot, J. Hyperspectral image classification—Traditional to deep models: A survey for future prospects. IEEE J. Sel. Top. Appl. Earth Obs. Remote Sens. 2021, 15, 968–999. [Google Scholar] [CrossRef]
- Guo, J.; Zhou, X.; Li, J.; Plaza, A.; Prasad, S. Superpixel-based active learning and online feature importance learning for hyperspectral image analysis. IEEE J. Sel. Top. Appl. Earth Obs. Remote Sens. 2016, 10, 347–359. [Google Scholar] [CrossRef]
- Xue, Z.; Zhou, S.; Zhao, P. Active learning improved by neighborhoods and superpixels for hyperspectral image classification. IEEE Geosci. Remote Sens. Lett. 2018, 15, 469–473. [Google Scholar] [CrossRef]
- Liu, C.; He, L.; Li, Z.; Li, J. Feature-driven active learning for hyperspectral image classification. IEEE Trans. Geosci. Remote Sens. 2017, 56, 341–354. [Google Scholar] [CrossRef]
- Zhang, Y.; Cao, G.; Li, X.; Wang, B.; Fu, P. Active semi-supervised random forest for hyperspectral image classification. Remote Sens. 2019, 11, 2974. [Google Scholar] [CrossRef]
- Li, J.; Bioucas-Dias, J.M.; Plaza, A. Semisupervised hyperspectral image segmentation using multinomial logistic regression with active learning. IEEE Trans. Geosci. Remote Sens. 2010, 48, 4085–4098. [Google Scholar] [CrossRef]
- Munoz-Mari, J.; Tuia, D.; Camps-Valls, G. Semisupervised classification of remote sensing images with active queries. IEEE Trans. Geosci. Remote Sens. 2012, 50, 3751–3763. [Google Scholar] [CrossRef]
- Wan, L.; Tang, K.; Li, M.; Zhong, Y.; Qin, A.K. Collaborative active and semisupervised learning for hyperspectral remote sensing image classification. IEEE Trans. Geosci. Remote Sens. 2014, 53, 2384–2396. [Google Scholar] [CrossRef]
- Wang, Z.; Du, B.; Zhang, L.; Zhang, L.; Jia, X. A novel semisupervised active-learning algorithm for hyperspectral image classification. IEEE Trans. Geosci. Remote Sens. 2017, 55, 3071–3083. [Google Scholar] [CrossRef]
- Zhang, Z.; Pasolli, E.; Crawford, M.M.; Tilton, J.C. An active learning framework for hyperspectral image classification using hierarchical segmentation. IEEE J. Sel. Top. Appl. Earth Obs. Remote Sens. 2015, 9, 640–654. [Google Scholar] [CrossRef]
- Dópido, I.; Li, J.; Plaza, A.; Bioucas-Dias, J.M. Semi-supervised active learning for urban hyperspectral image classification. In Proceedings of the 2012 IEEE International Geoscience and Remote Sensing Symposium, Munich, Germany, 22–27 July 2012; pp. 1586–1589. [Google Scholar]
- Wang, S.; Chen, W.; Xie, S.M.; Azzari, G.; Lobell, D.B. Weakly supervised deep learning for segmentation of remote sensing imagery. Remote Sens. 2020, 12, 207. [Google Scholar] [CrossRef]
- Zhou, B.; Lapedriza, A.; Xiao, J.; Torralba, A.; Oliva, A. Learning deep features for scene recognition using places database. Adv. Neural Inf. Process. Syst. 2014, 27, 96941. Available online: http://hdl.handle.net/1721.1/96941 (accessed on 11 July 2023).
- Perantoni, G.; Bruzzone, L. A novel technique for robust training of deep networks with multisource weak labeled remote sensing data. IEEE Trans. Geosci. Remote Sens. 2021, 60, 1–15. [Google Scholar] [CrossRef]
- Chen, H.; Peng, S.; Du, C.; Li, J.; Wu, S. SW-GAN: Road Extraction from Remote Sensing Imagery Using Semi-Weakly Supervised Adversarial Learning. Remote Sens. 2022, 14, 4145. [Google Scholar] [CrossRef]
- He, K.; Fan, H.; Wu, Y.; Xie, S.; Girshick, R. Momentum contrast for unsupervised visual representation learning. In Proceedings of the IEEE/CVF Conference on Computer Vision and Pattern Recognition (CVPR), Seattle, WA, USA, 13–19 June 2020; pp. 9729–9738. [Google Scholar]
- Peng, R.; Zhao, W.; Zhang, L.; Chen, X. Multi-scale contrastive learning based weakly supervised learning for remote sensing scene classification. J. Geo-Inf. Sci. 2022, 24, 1375–1390. (In Chinese) [Google Scholar]
- Liang, C.; Cheng, B.; Xiao, B.; He, C.; Liu, X.; Jia, N.; Chen, J. Semi-/weakly-supervised semantic segmentation method and its application for coastal aquaculture areas based on multi-source remote sensing images—Taking the Fujian coastal area (mainly Sanduo) as an example. Remote Sens. 2021, 13, 1083. [Google Scholar] [CrossRef]
- Wang, Y.; Li, S.; Teng, F.; Cai, H. Improved Mask R-CNN for Rural Building Roof Type Recognition from UAV High-Resolution Images: A Case Study in Hunan Province, China. Remote Sens. 2022, 14, 265. [Google Scholar] [CrossRef]
- Lin, Y.; Wang, Y.; Li, S.; Cai, H. Fine classification of crop planting types coupled with DeepLab and Transformer from high-resolution remote sensing images. Acta Geod. Cartogr. Sin. 2023. in press. (In Chinese) [Google Scholar]
- Dosovitskiy, A.; Beyer, L.; Kolesnikov, A.; Weissenborn, D.; Zhai, X.; Unterthiner, T.; Dehghani, M.; Minderer, M.; Heigold, G.; Gelly, S.; et al. An image is worth 16x16 words: Transformers for image recognition at scale. arXiv 2020, arXiv:2010.11929. [Google Scholar]
- Wang, H.; Chen, X.; Zhang, T.; Xu, Z.; Li, J. CCTNet: Coupled CNN and Transformer Network for Crop Segmentation of Remote Sensing Images. Remote Sens. 2022, 14, 1956. [Google Scholar] [CrossRef]
- Woo, S.; Park, J.; Lee, J.Y.; Kweon, I.S. Cbam: Convolutional block attention module. In Proceedings of the European Conference on Computer Vision (ECCV), Munich, Germany, 8–14 September 2018; pp. 3–19. [Google Scholar]
- Zhou, L.; Zhang, C.; Wu, M. D-LinkNet: LinkNet with pretrained encoder and dilated convolution for high resolution satellite imagery road extraction. In Proceedings of the IEEE Conference on Computer Vision and Pattern Recognition Workshops, Salt Lake City, UT, USA, 18–23 June 2018; pp. 182–186. [Google Scholar]
- Ronneberger, O.; Fischer, P.; Brox, T. U-net: Convolutional networks for biomedical image segmentation. In International Conference on Medical Image Computing and Computer-Assisted Intervention; Springer: Cham, Switzerland, 2015; pp. 234–241. [Google Scholar]
- Chen, L.C.; Zhu, Y.; Papandreou, G.; Schroff, F.; Adam, H. Encoder-decoder with atrous separable convolution for semantic image segmentation. In Proceedings of the European Conference on Computer Vision (ECCV), Munich, Germany, 8–14 September 2018; pp. 801–818. [Google Scholar]
Figure 1.
Training area and real sample of buildings in the Yuhu Urban dataset. (a) Raw image of the training area in the Yuhu Urban dataset. (b) Real sample of the training area in the Yuhu Urban dataset.
Figure 1.
Training area and real sample of buildings in the Yuhu Urban dataset. (a) Raw image of the training area in the Yuhu Urban dataset. (b) Real sample of the training area in the Yuhu Urban dataset.
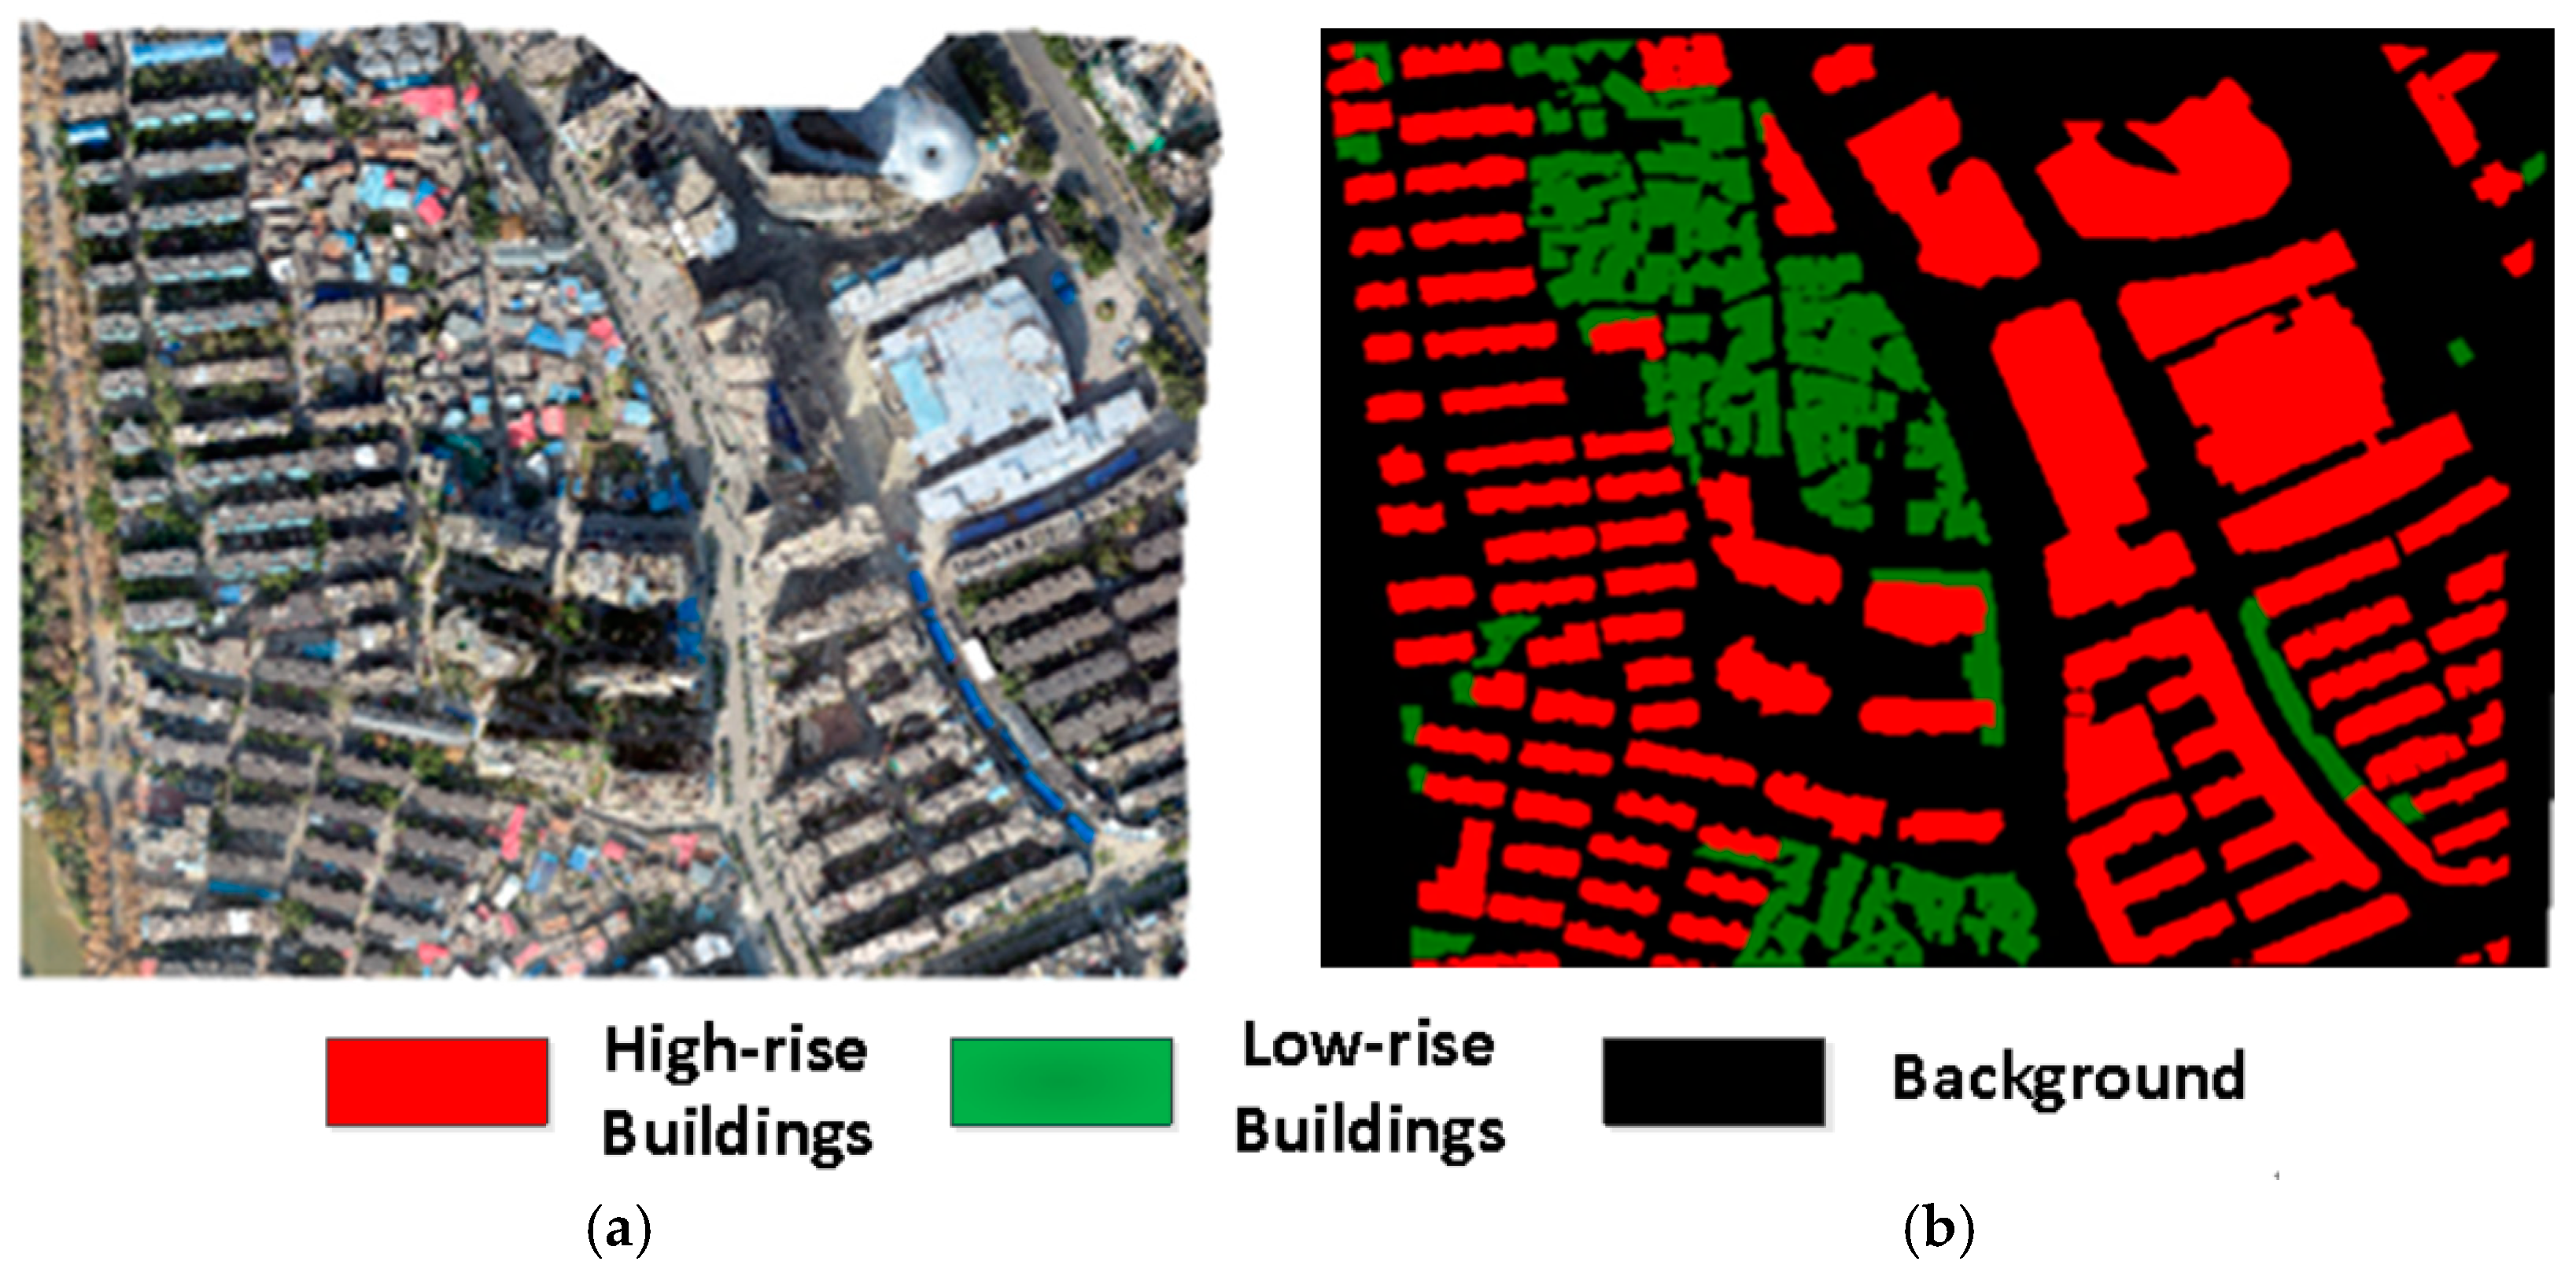
Figure 2.
Training area and real sample of buildings in the XXURB dataset. (a) Raw image of the training area in the XXURB dataset. (b) Real sample of the training area in the XXURB dataset.
Figure 2.
Training area and real sample of buildings in the XXURB dataset. (a) Raw image of the training area in the XXURB dataset. (b) Real sample of the training area in the XXURB dataset.

Figure 3.
Flow chart of generation of weak building samples and optimization strategies with multi-source remote sensing data.
Figure 3.
Flow chart of generation of weak building samples and optimization strategies with multi-source remote sensing data.
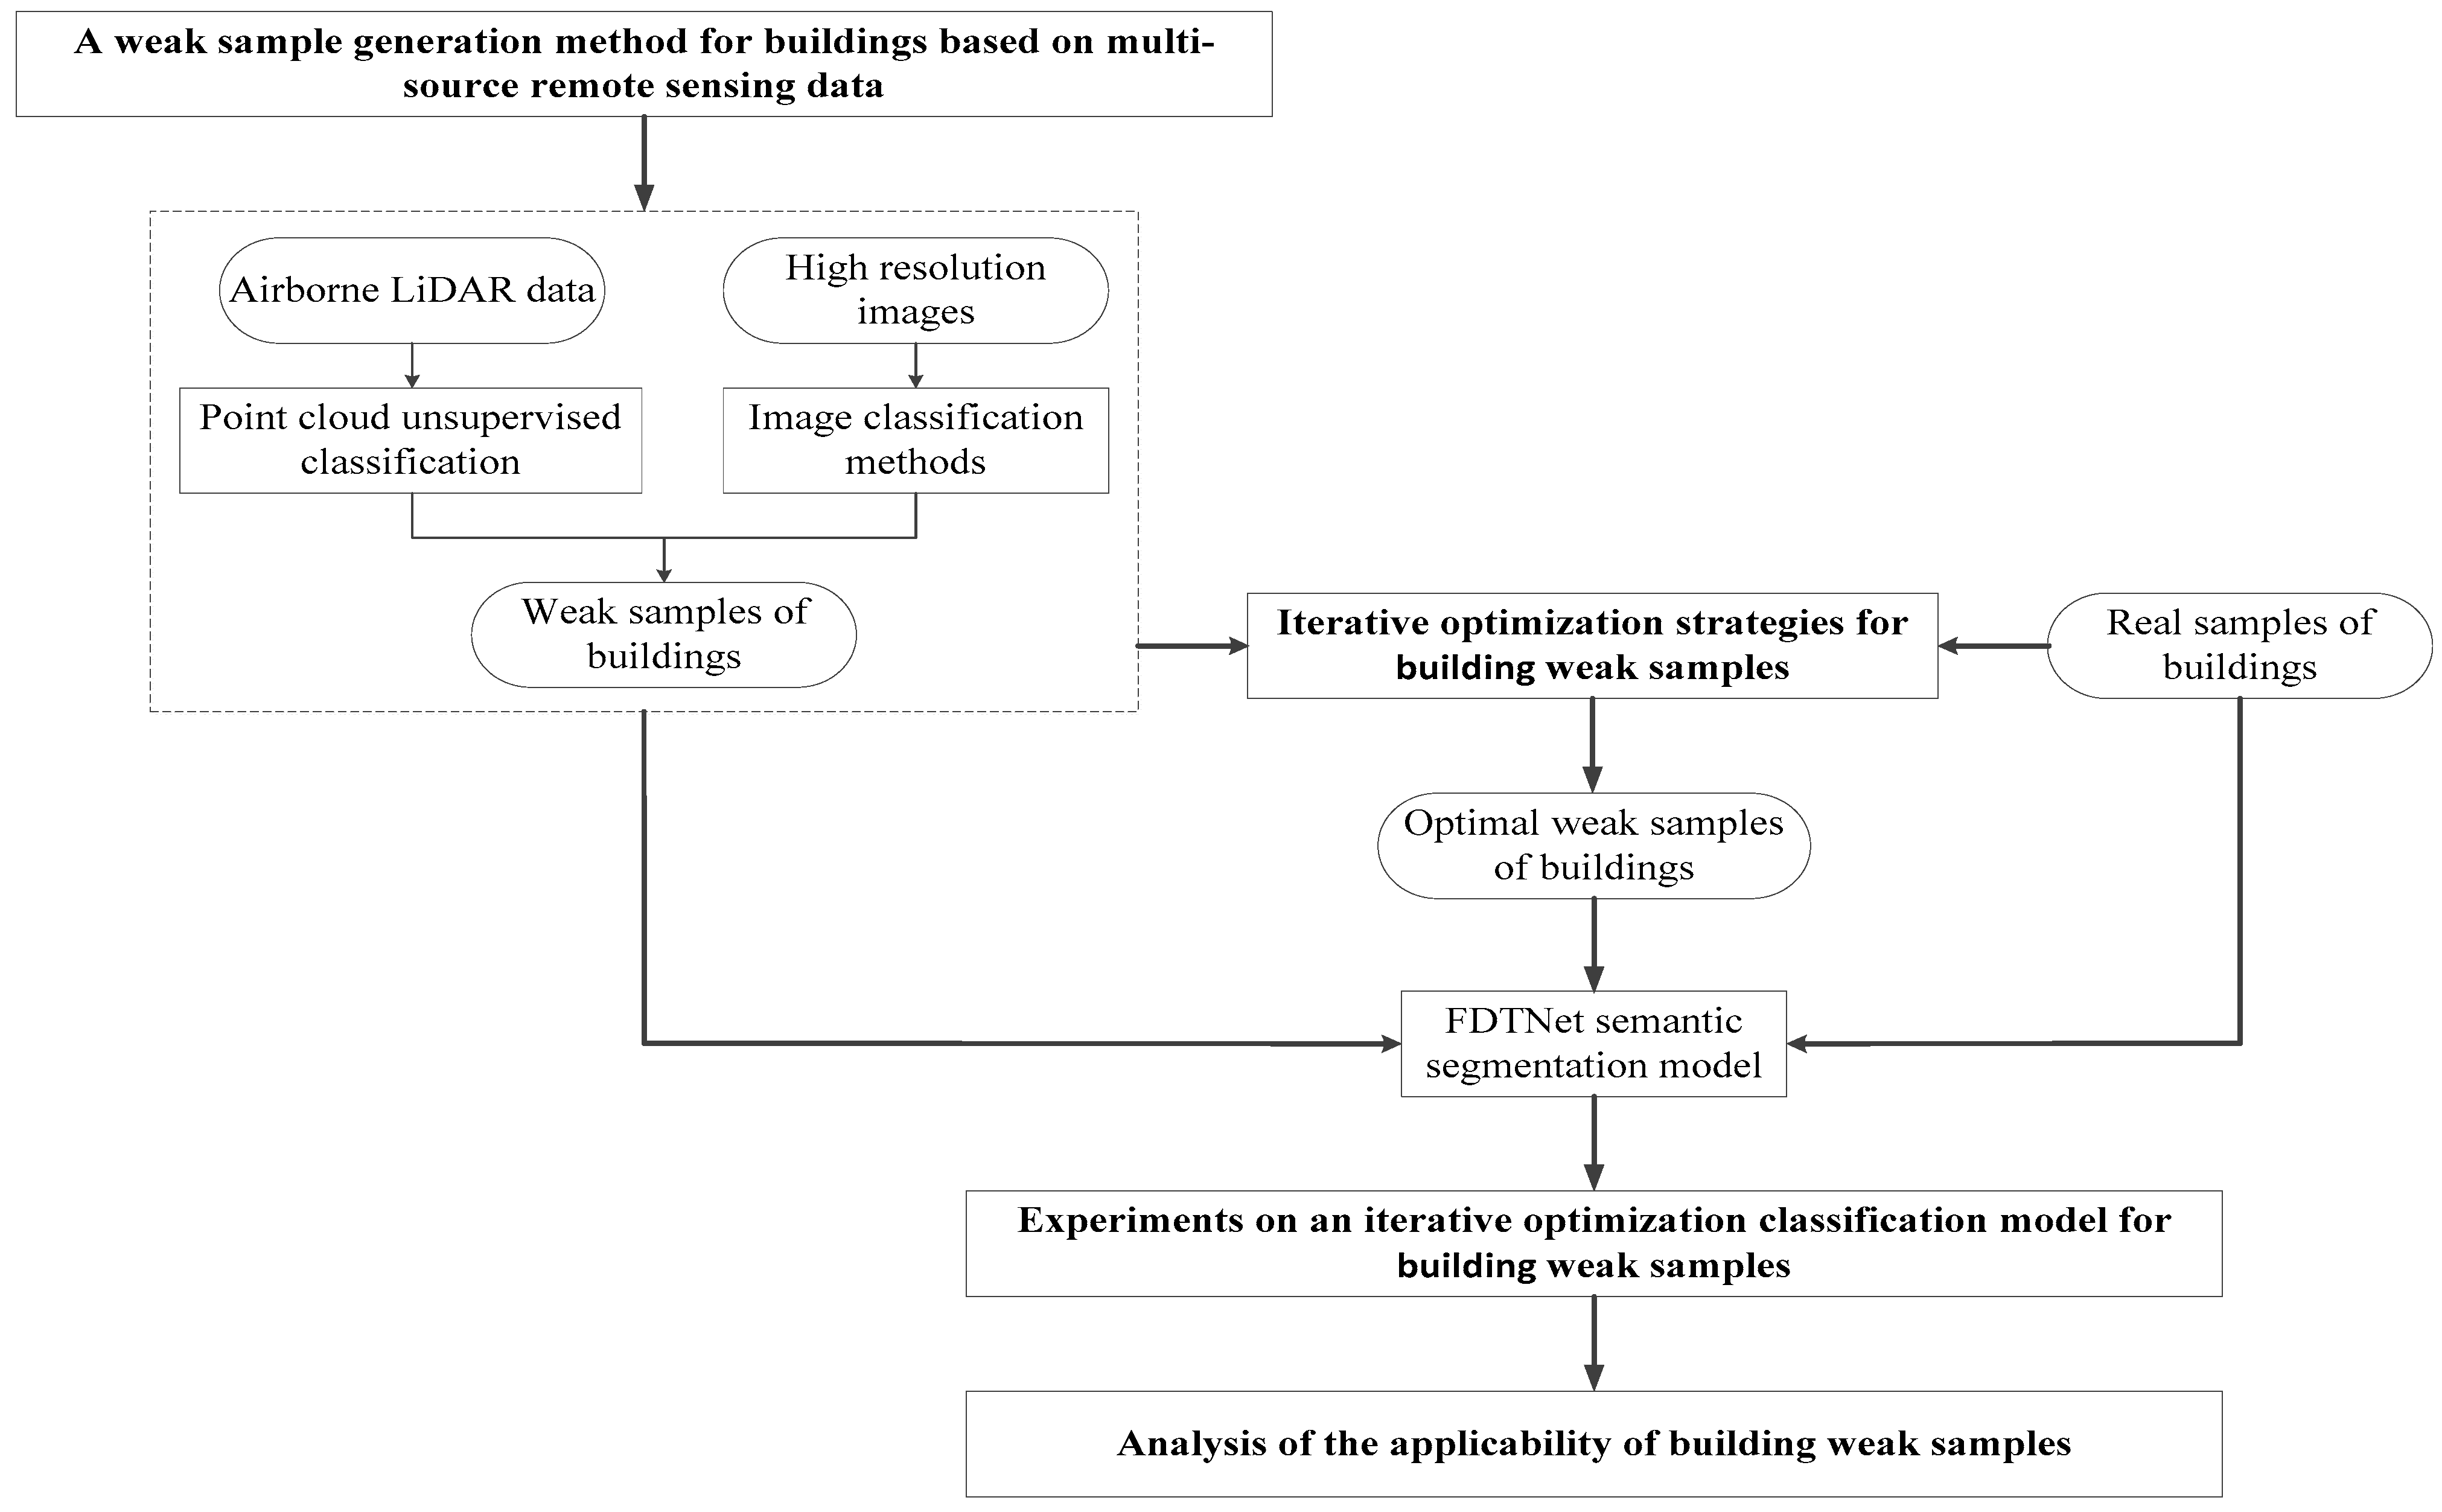
Figure 4.
The architecture of FDTNet.
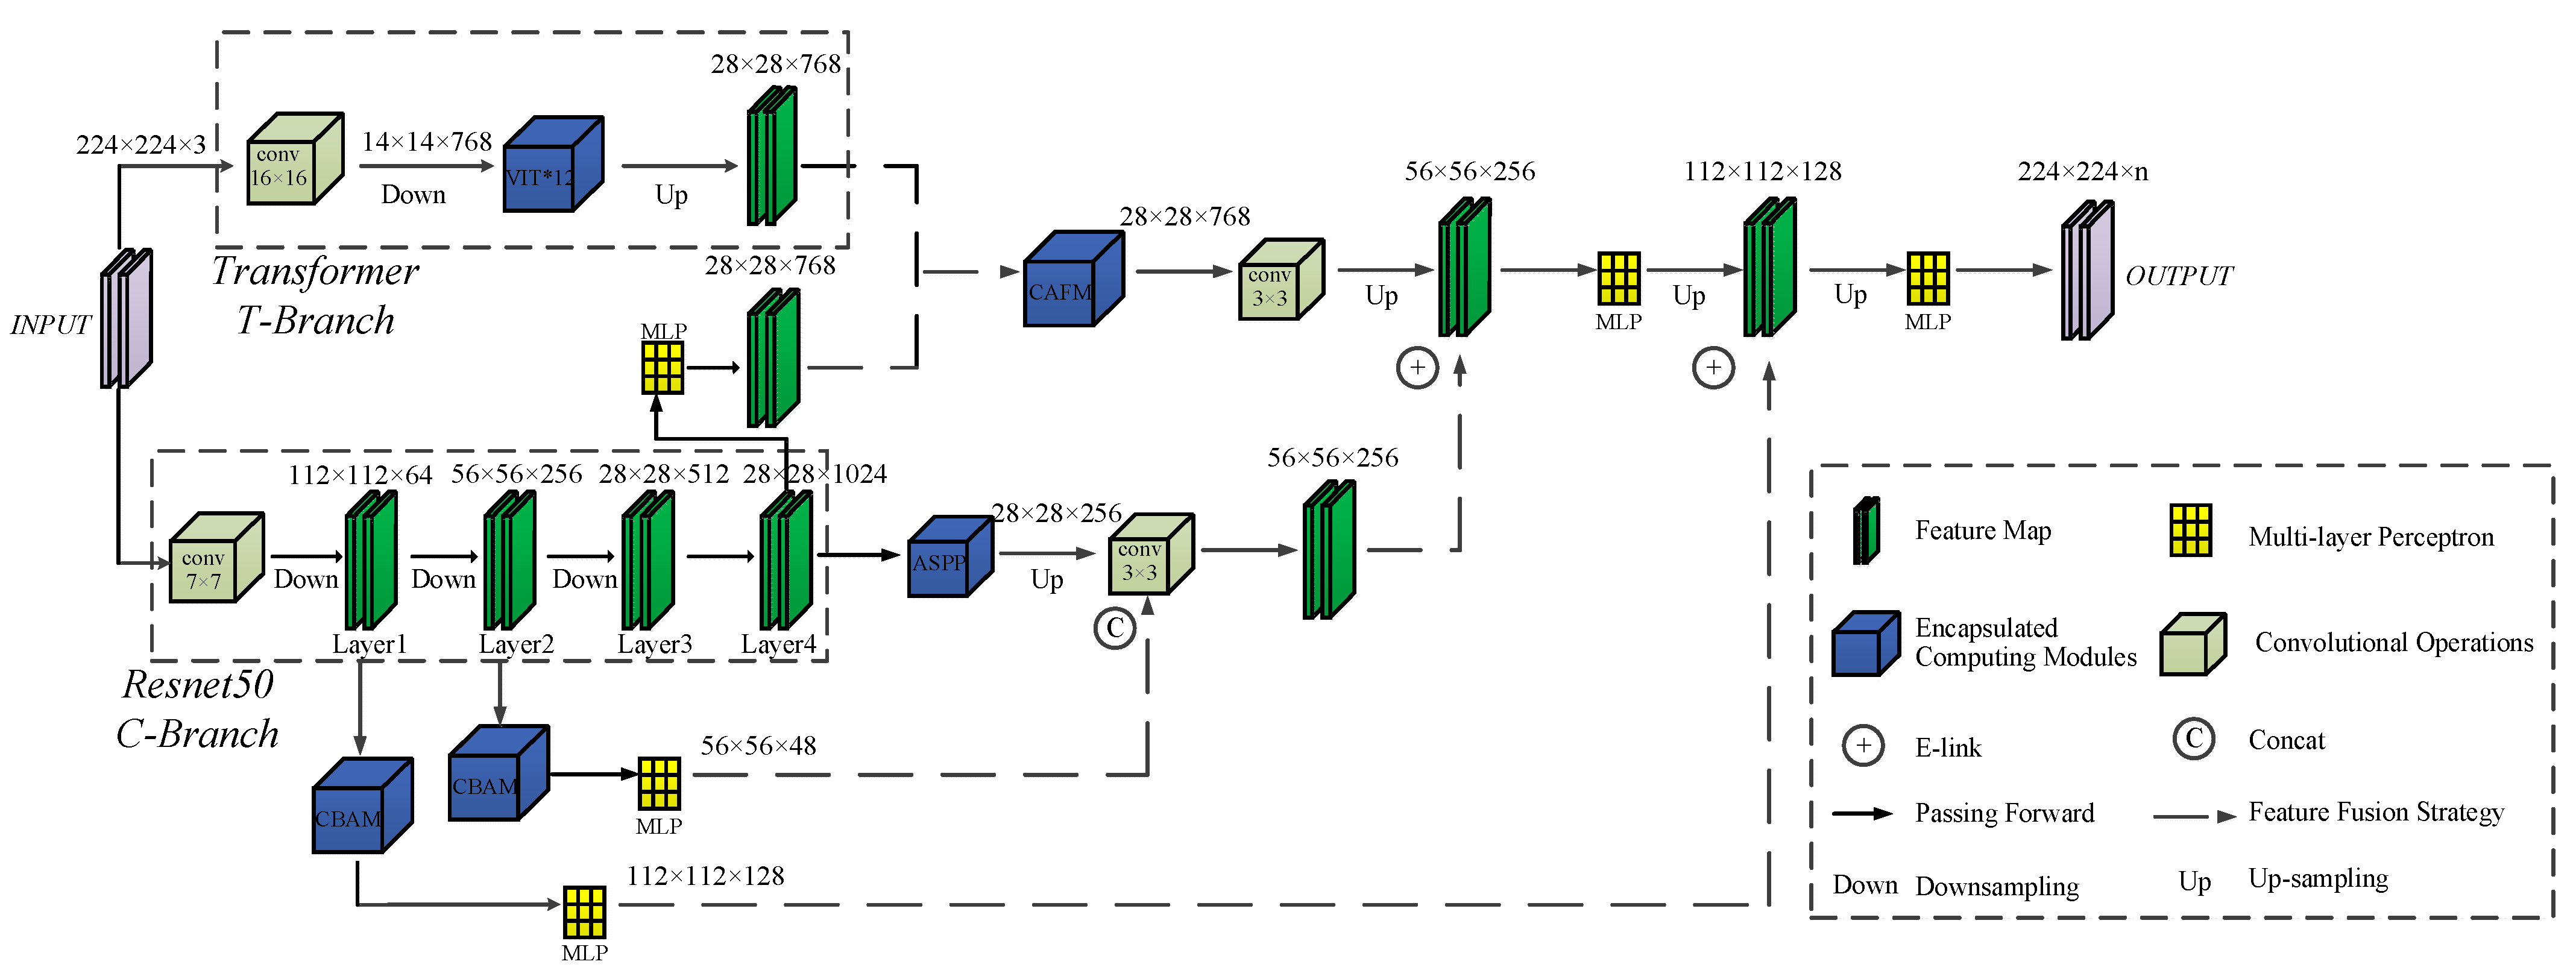
Figure 5.
The architecture of point cloud unsupervised building roof classification.

Figure 6.
Partial test area for generating weak samples. (a) Original image of part of the test area. (b) Real samples of part of the test area.
Figure 6.
Partial test area for generating weak samples. (a) Original image of part of the test area. (b) Real samples of part of the test area.
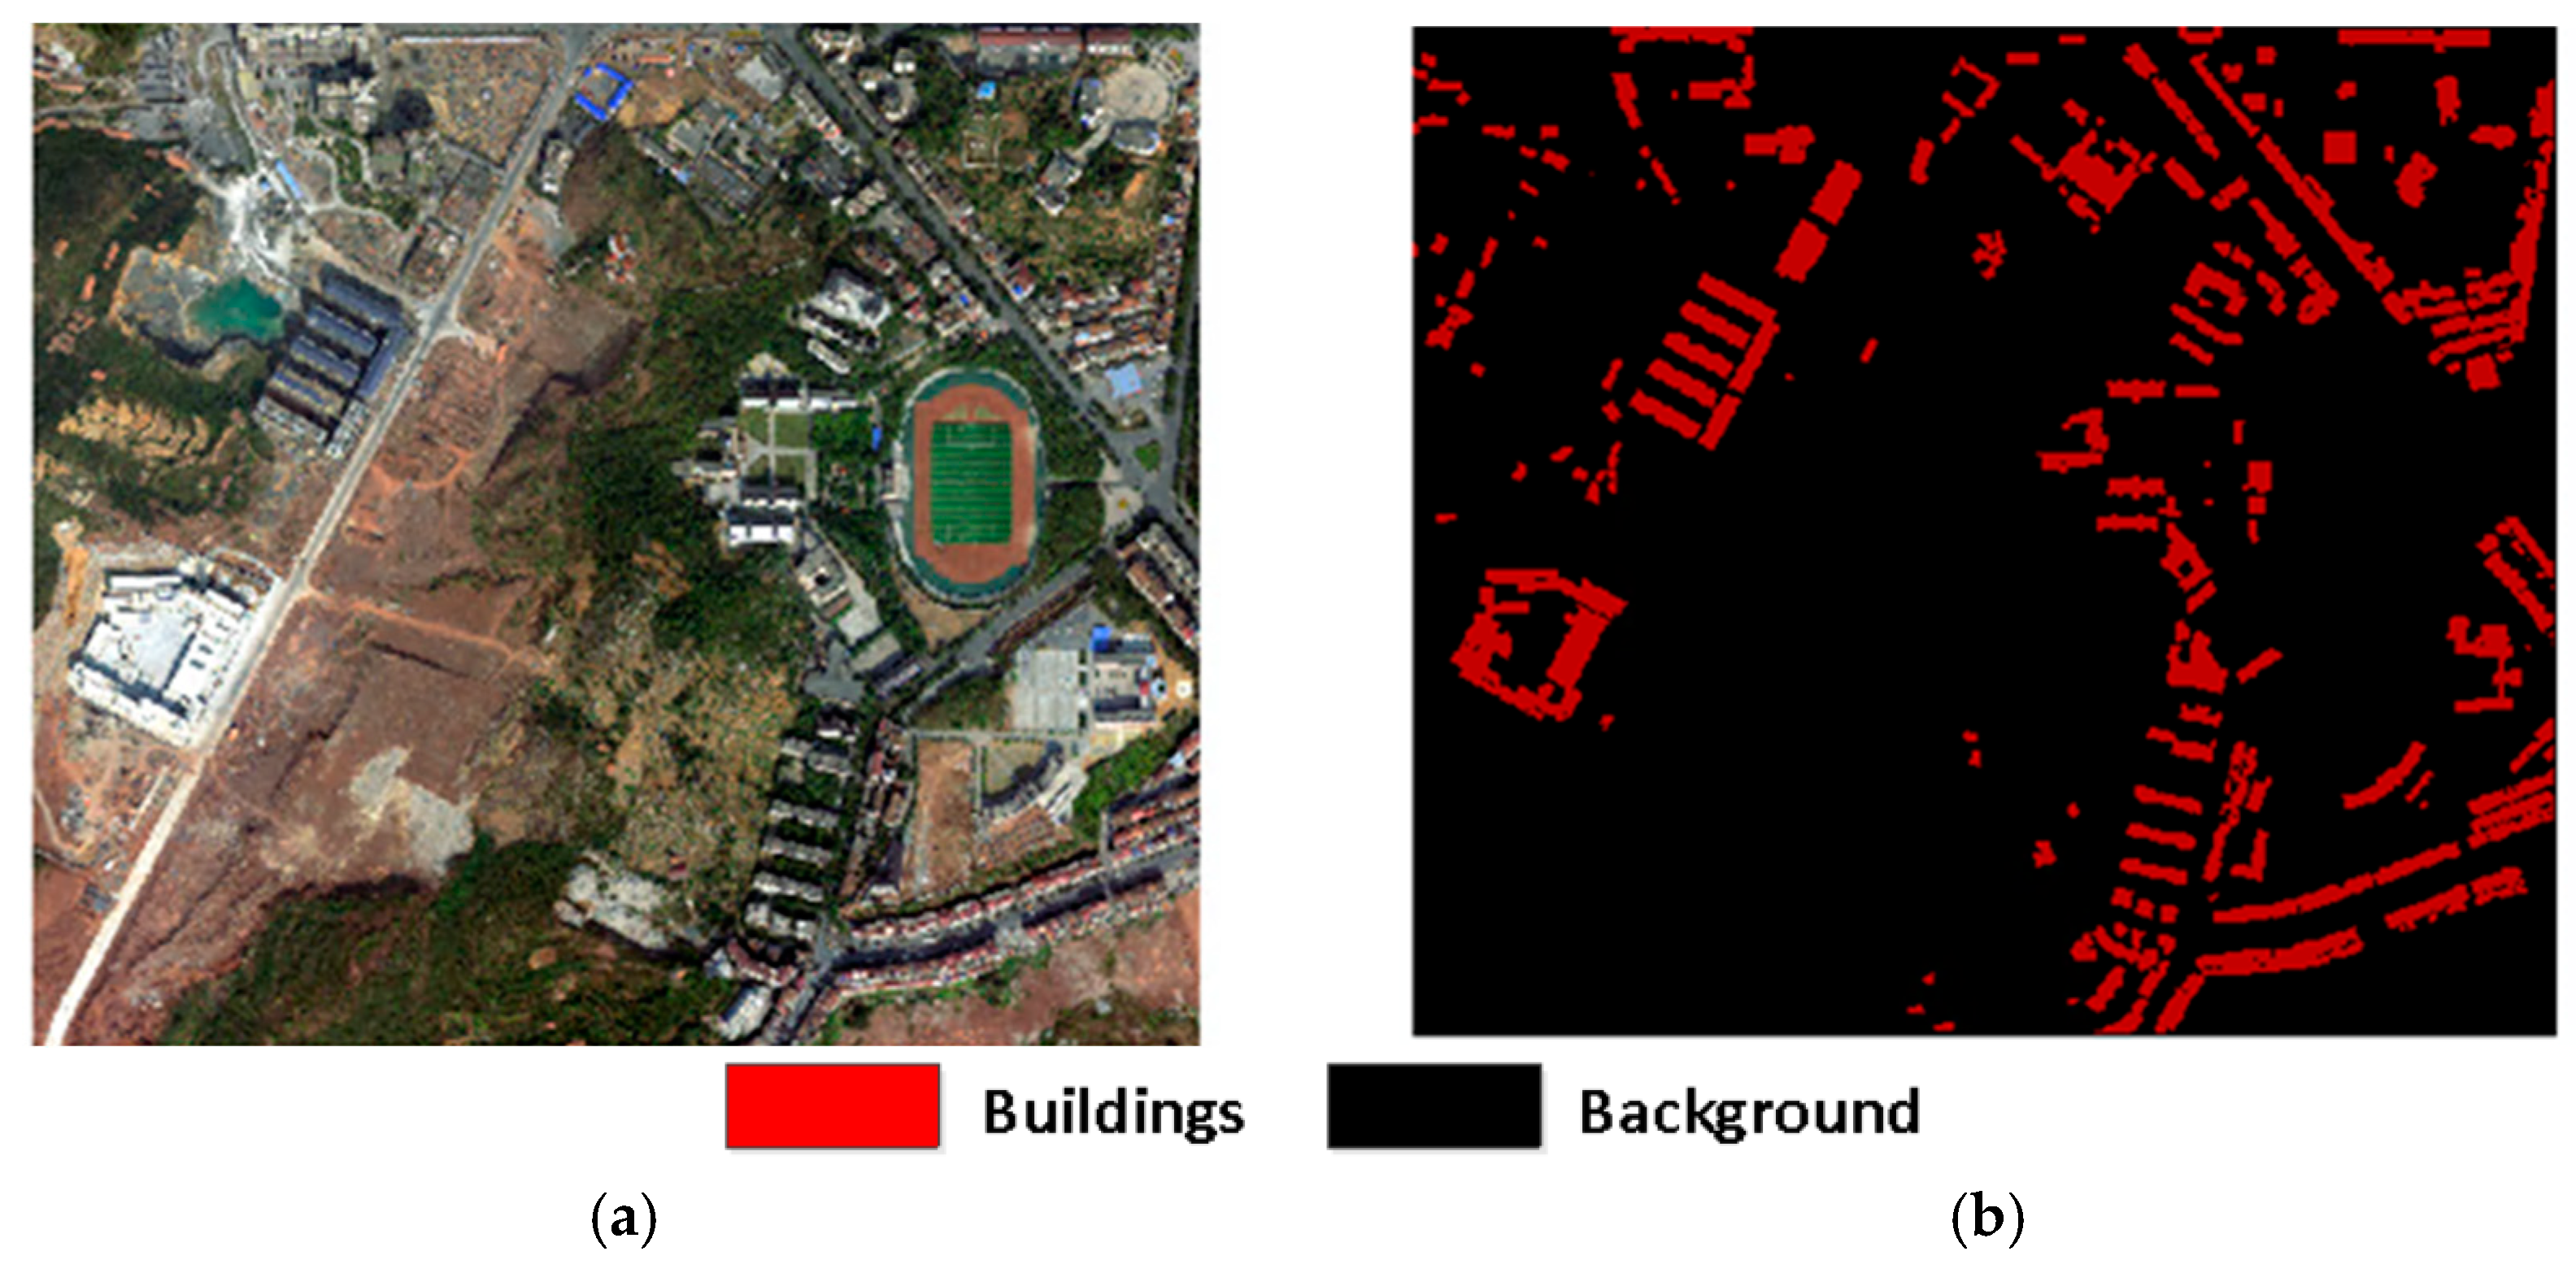
Figure 7.
Weak sample area delineation for the Yuhu Urban dataset.
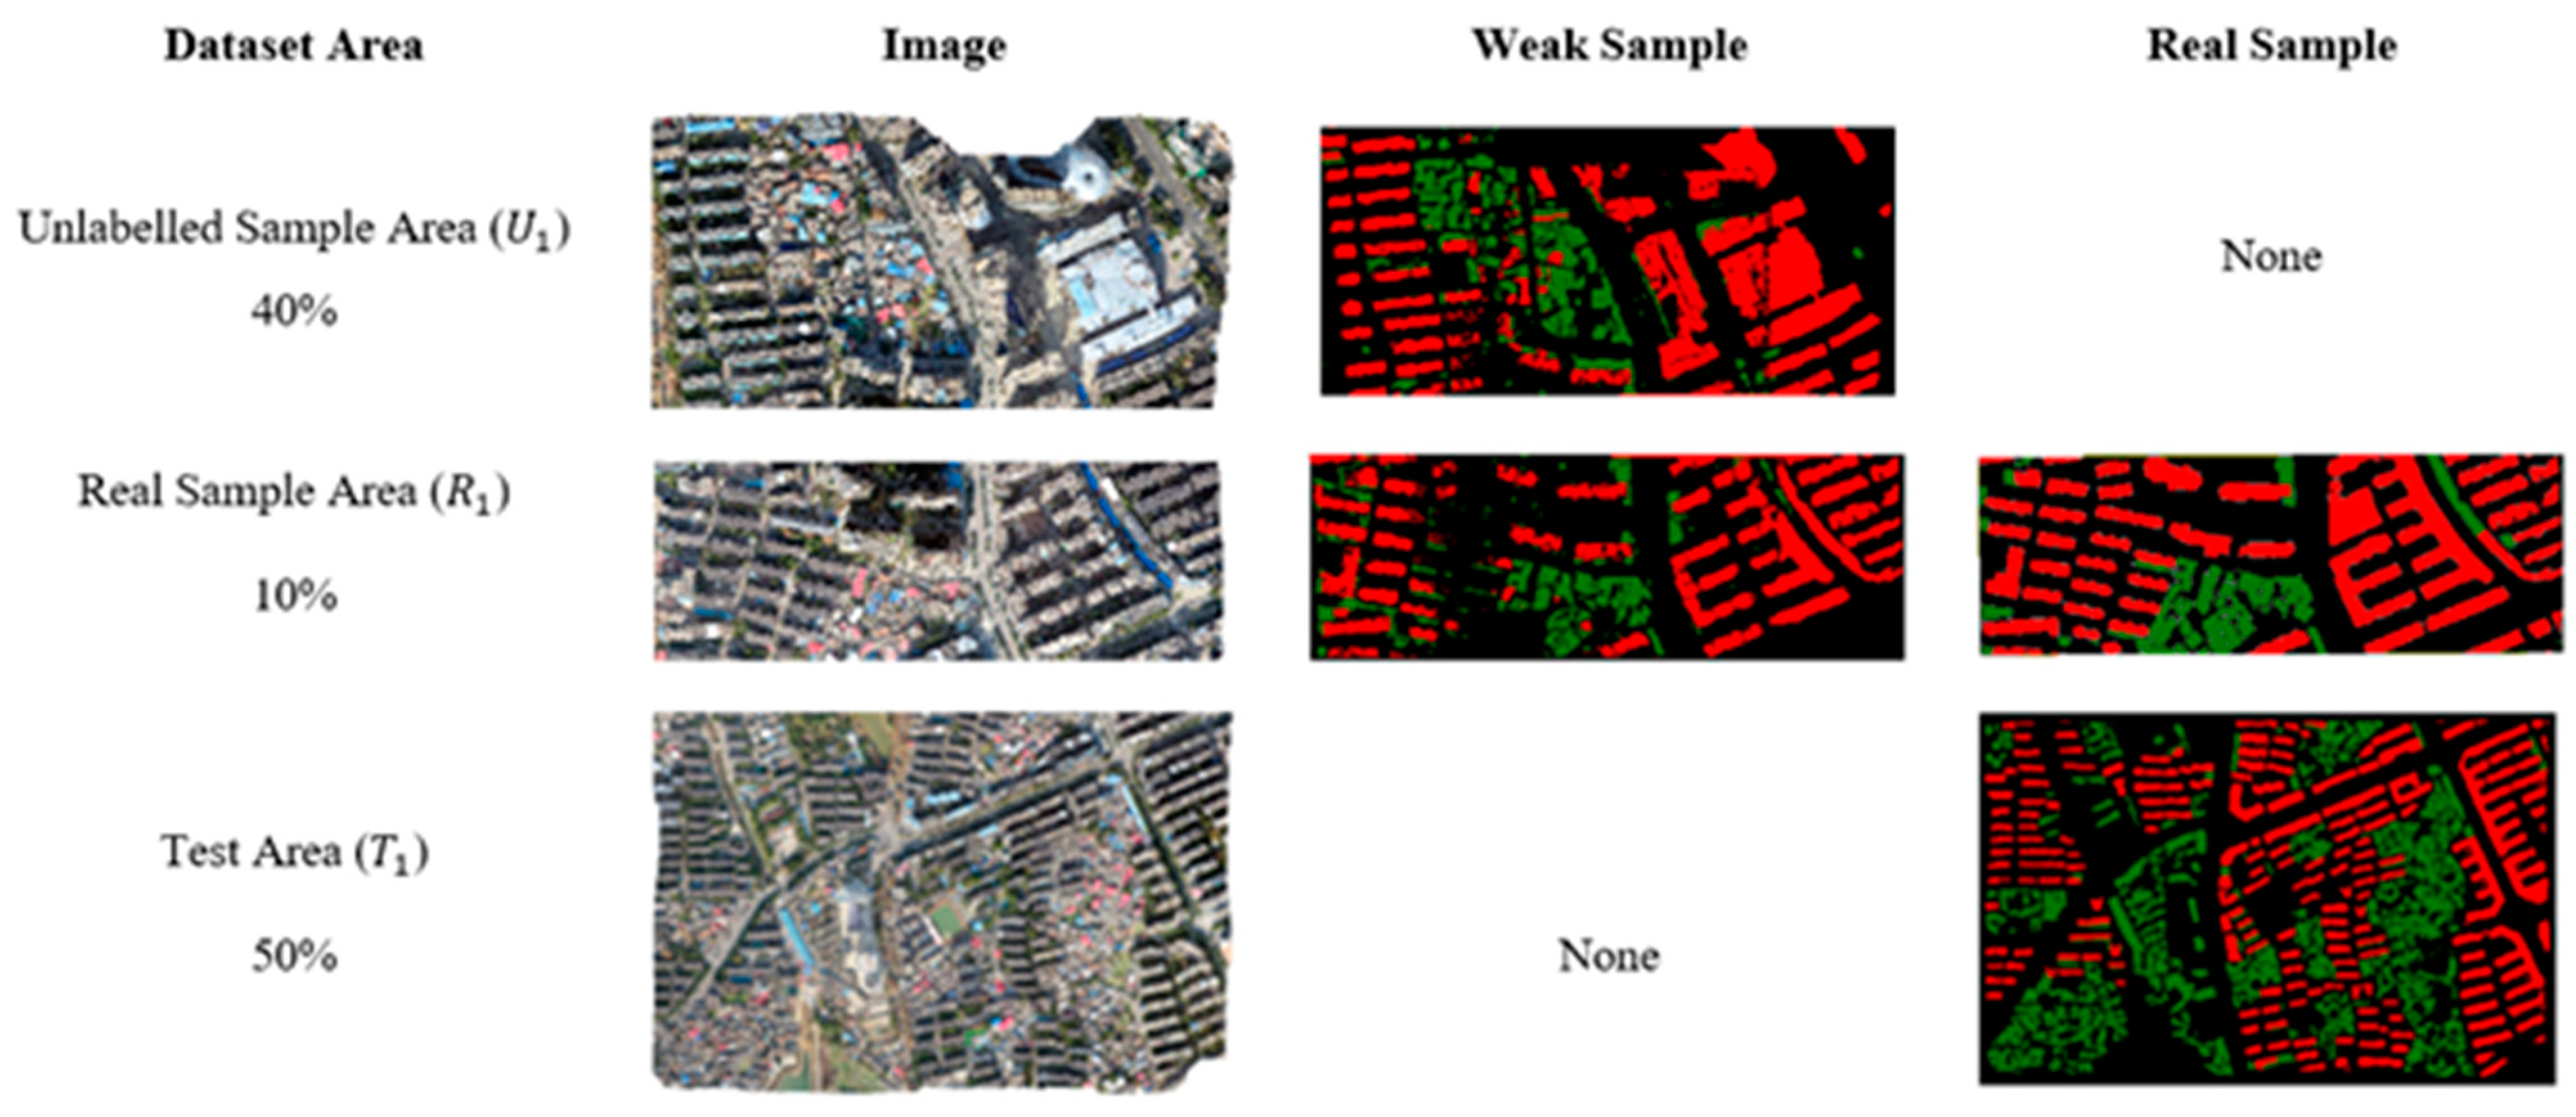
Figure 8.
Weak sample area delineation for the XXURB dataset.

Figure 9.
A weak sample optimization strategy based on airborne LiDAR.

Figure 10.
Classification results for each model in the Yuhu Urban dataset.

Figure 11.
Classification results for each model in the XXURB dataset. (a) Image. (b) Real Sample. (c) UNet. (d) DeepLabv3+. (e) FDTNet.
Figure 11.
Classification results for each model in the XXURB dataset. (a) Image. (b) Real Sample. (c) UNet. (d) DeepLabv3+. (e) FDTNet.
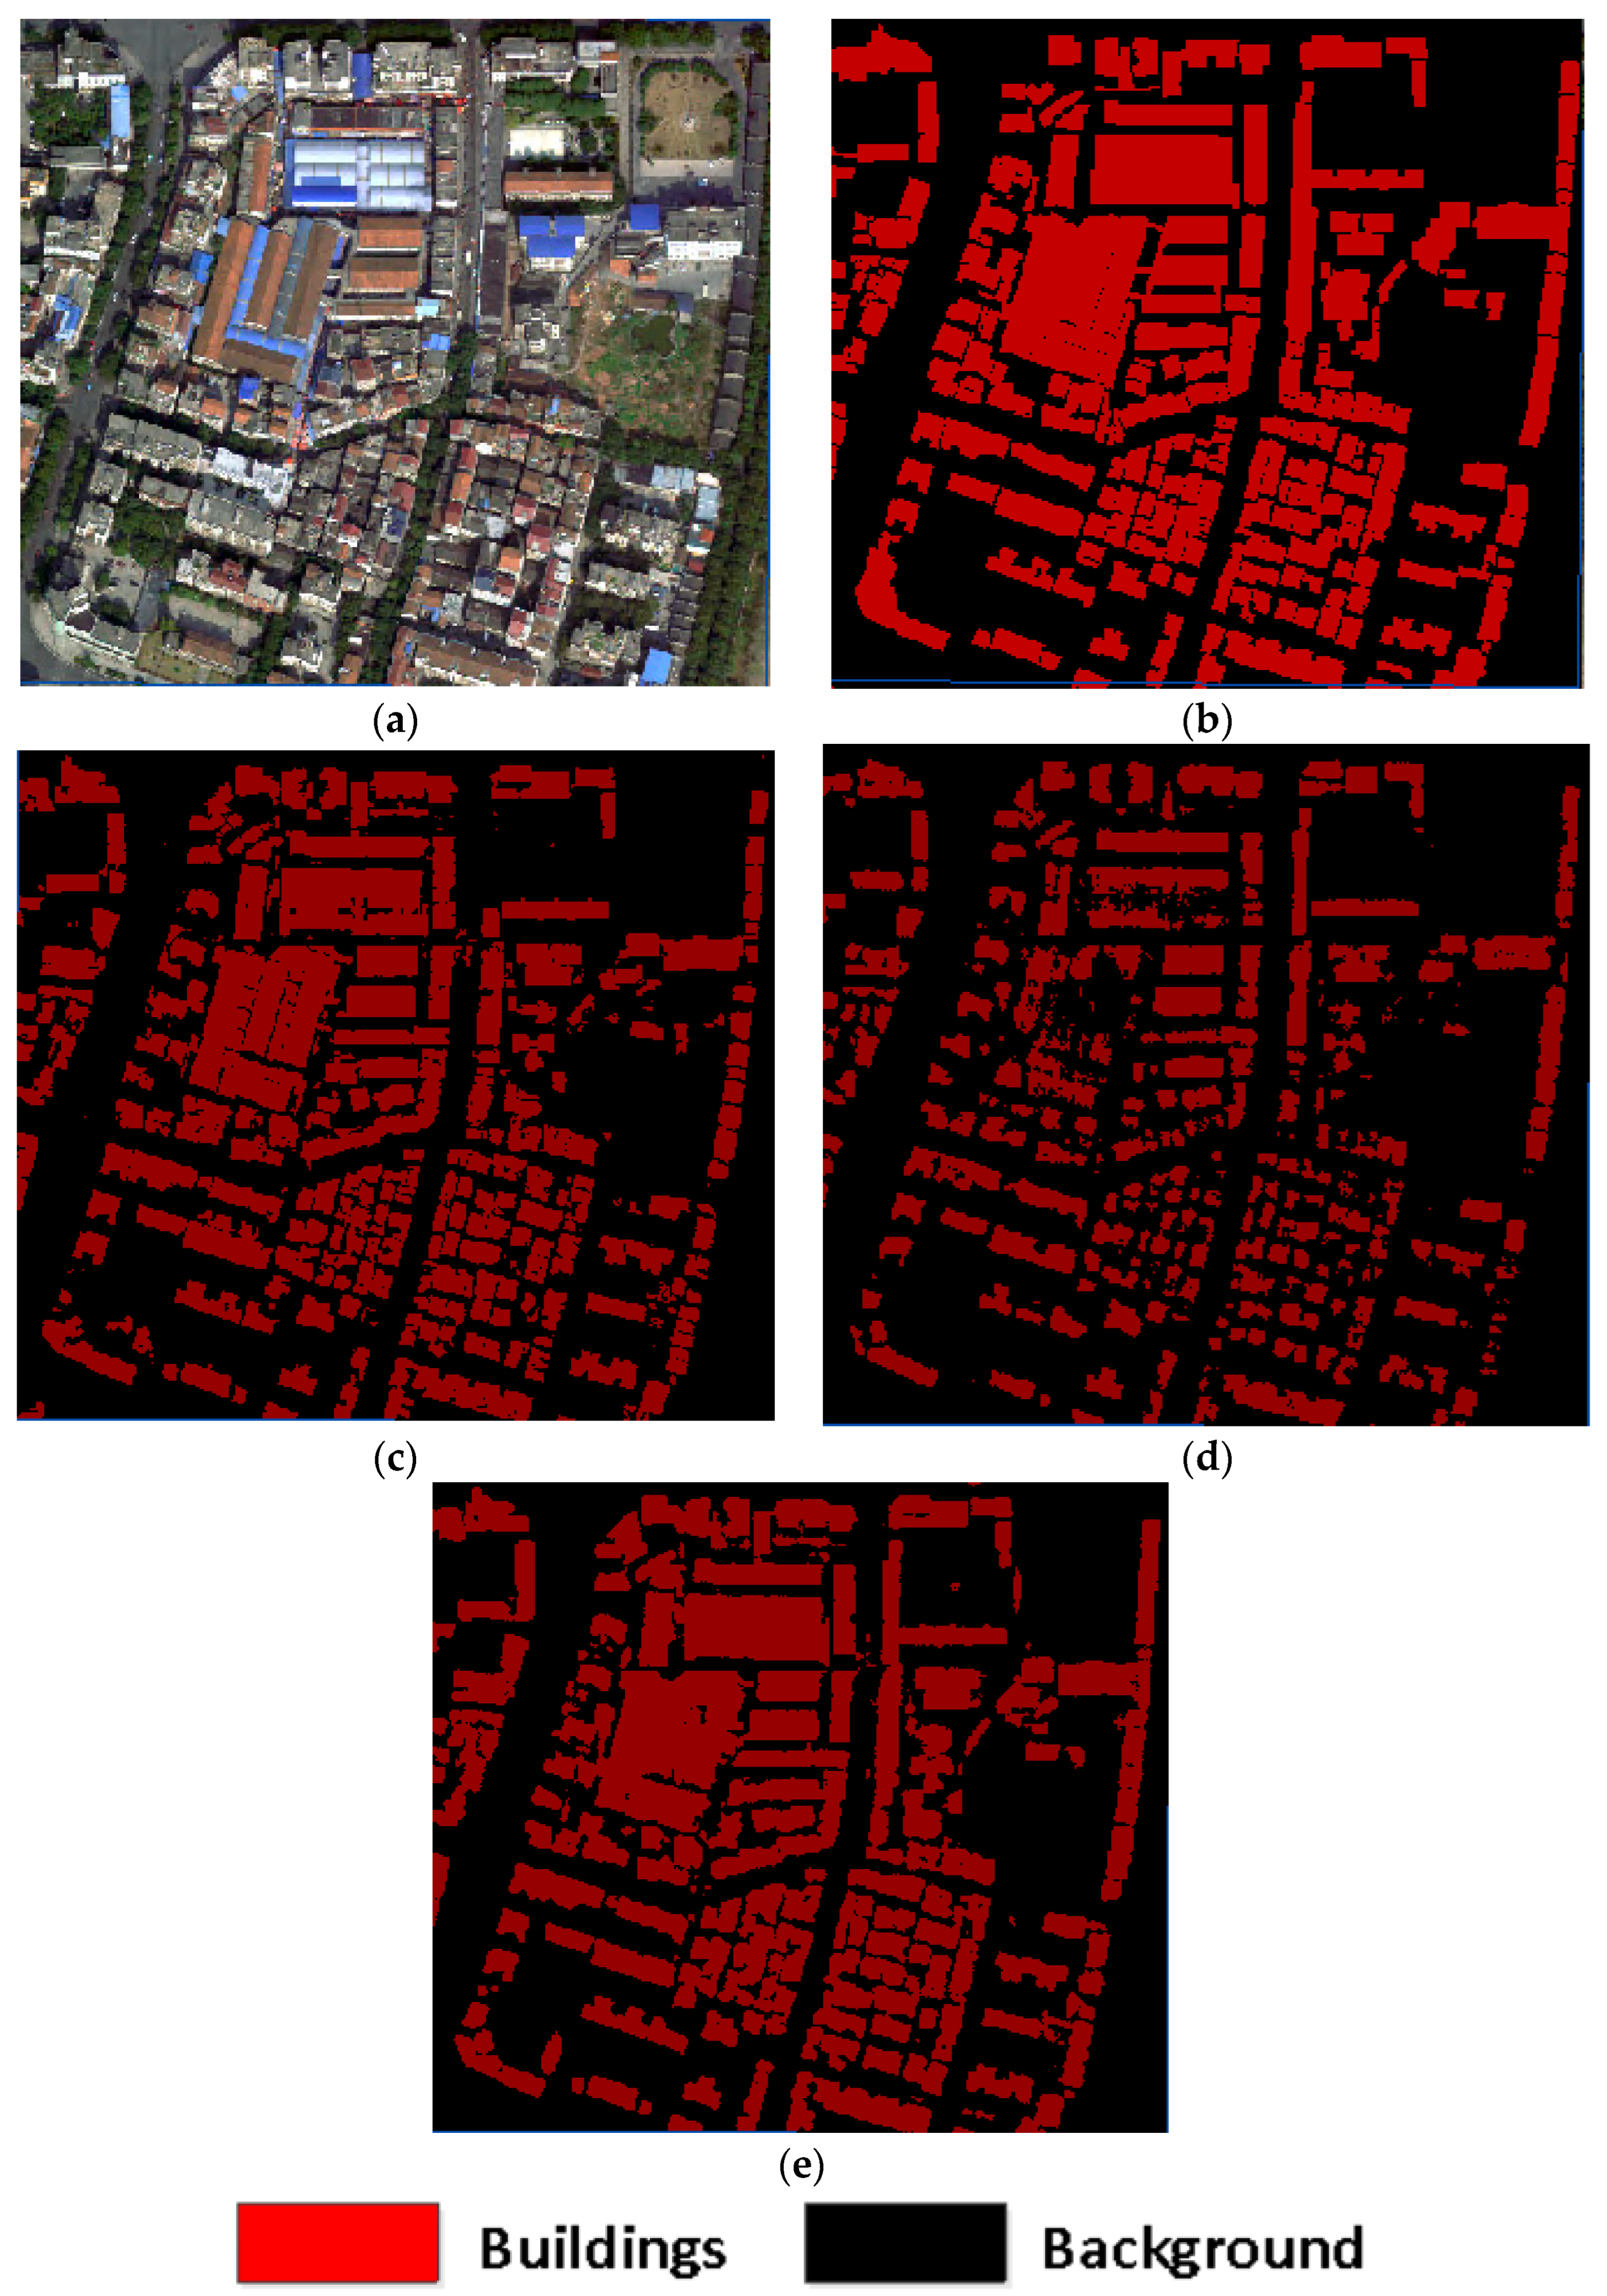
Figure 12.
The result of extraction roof point cloud. (a) Original point cloud data. (b) Building point cloud classification results.
Figure 12.
The result of extraction roof point cloud. (a) Original point cloud data. (b) Building point cloud classification results.
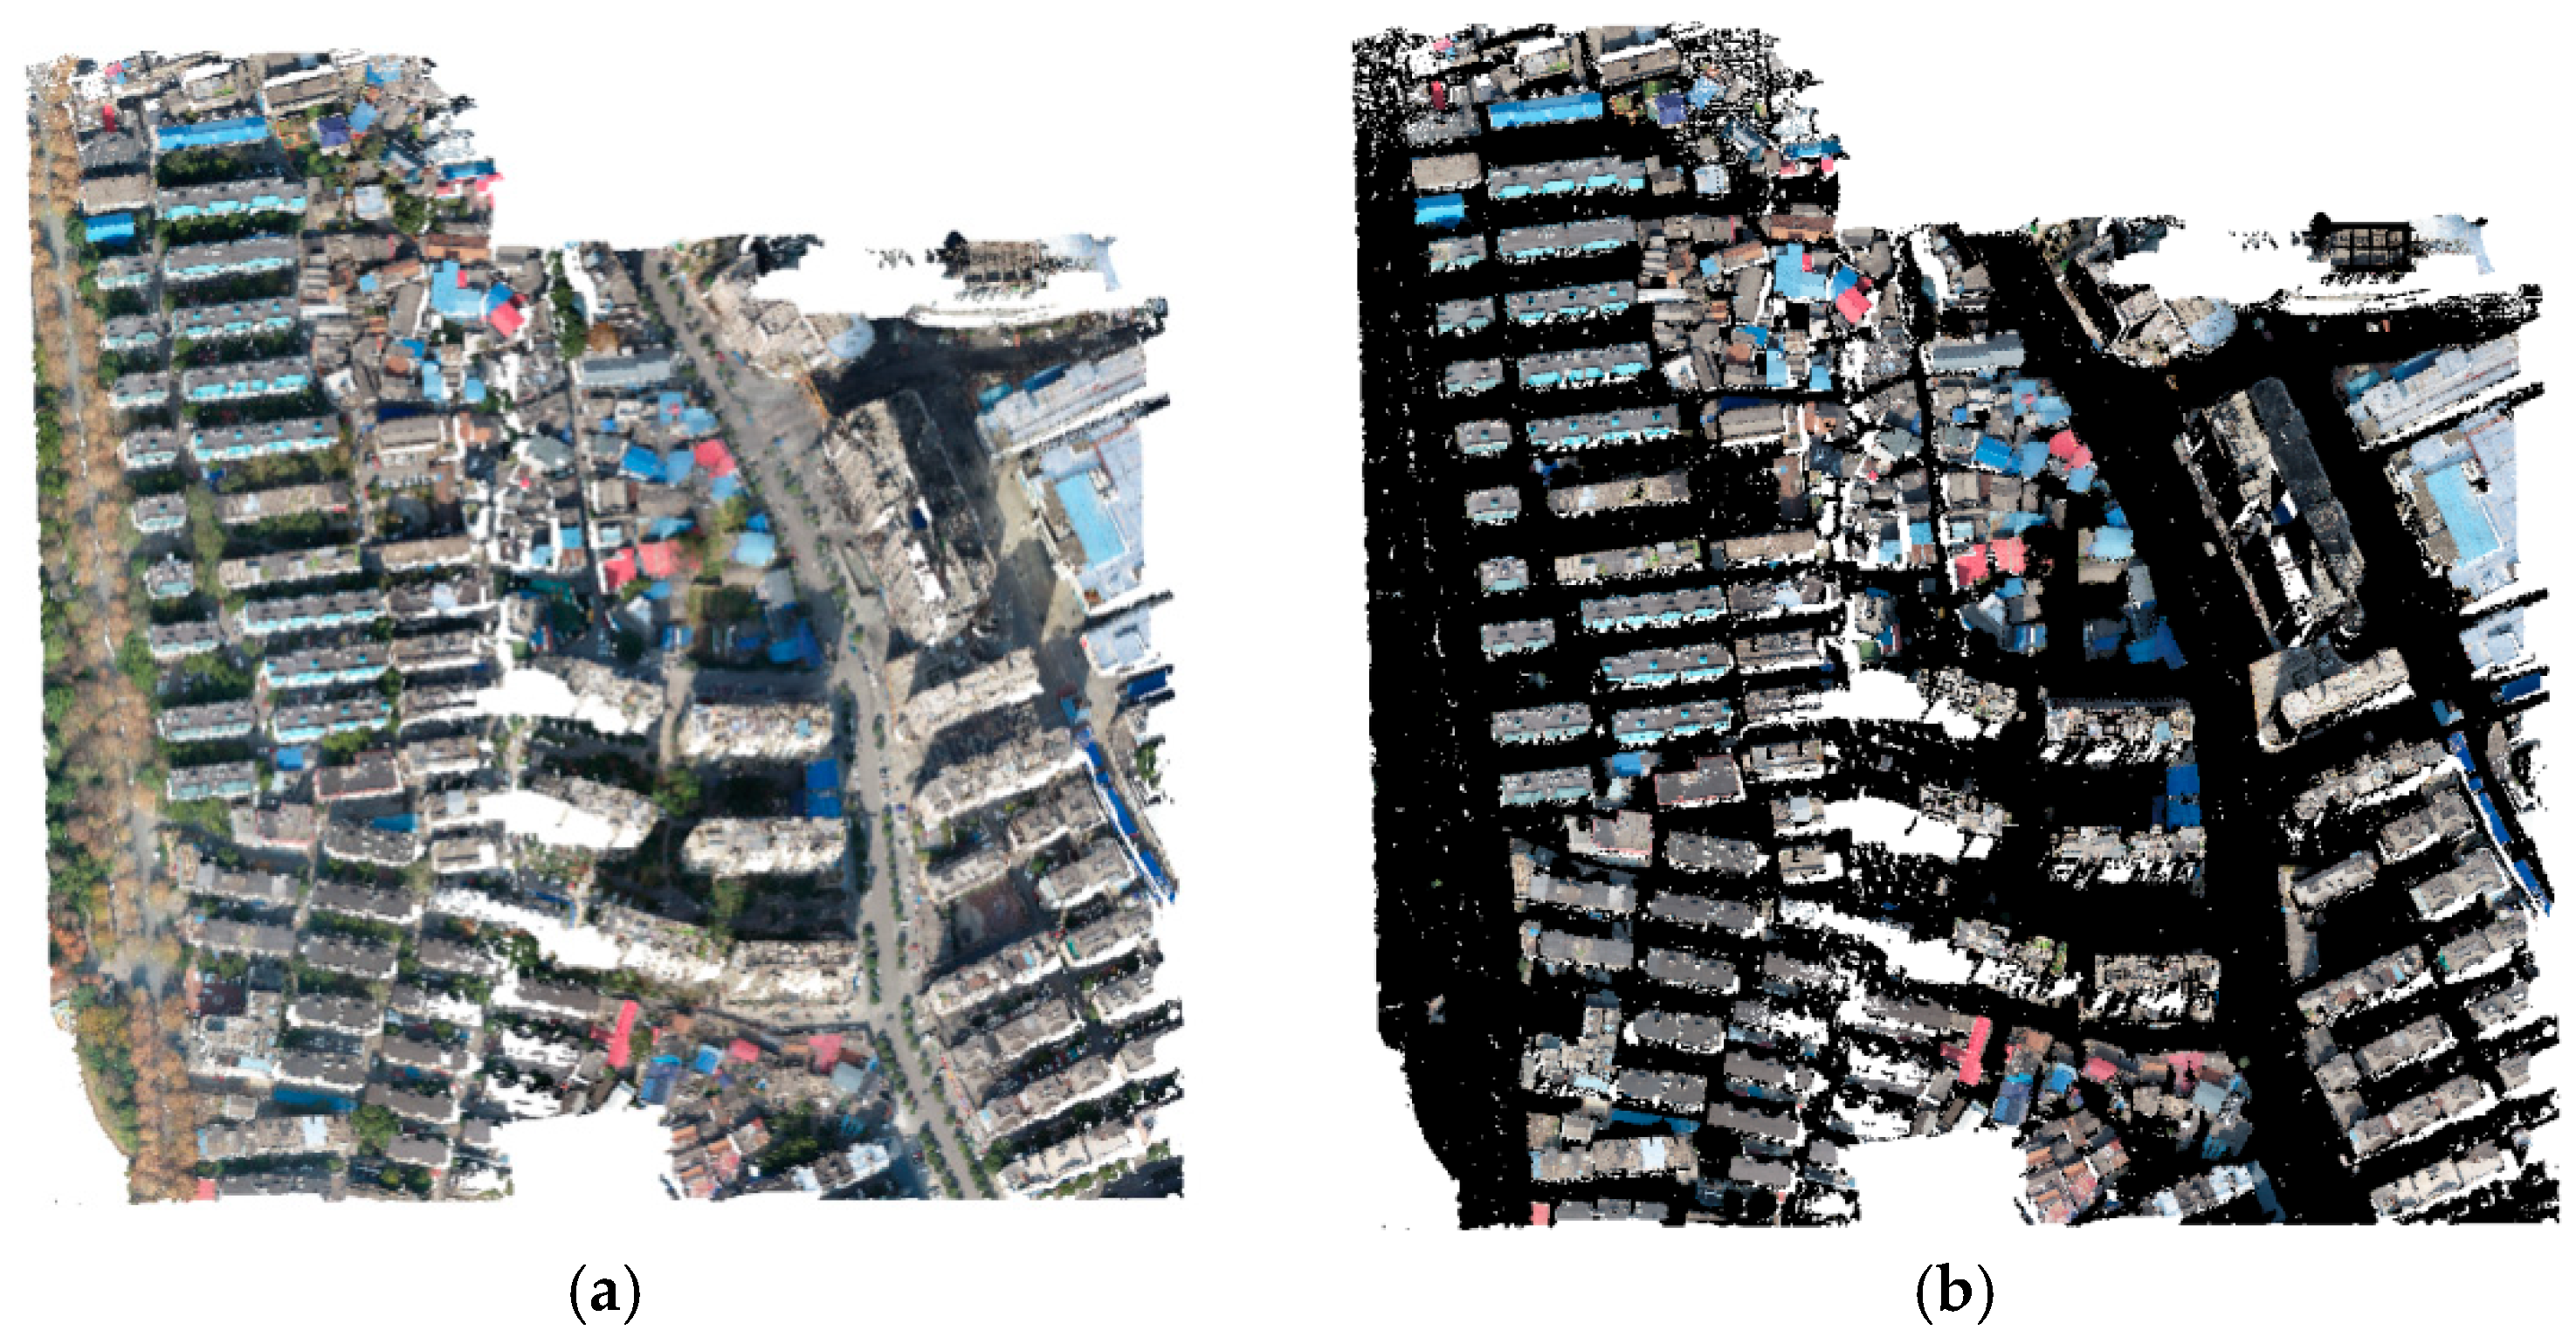
Figure 13.
Results of generating weak samples of buildings using roof point cloud. (a) Image data from the LiDAR region. (b) Real sample from the LiDAR region. (c) LiDAR classification of weak sample.
Figure 13.
Results of generating weak samples of buildings using roof point cloud. (a) Image data from the LiDAR region. (b) Real sample from the LiDAR region. (c) LiDAR classification of weak sample.
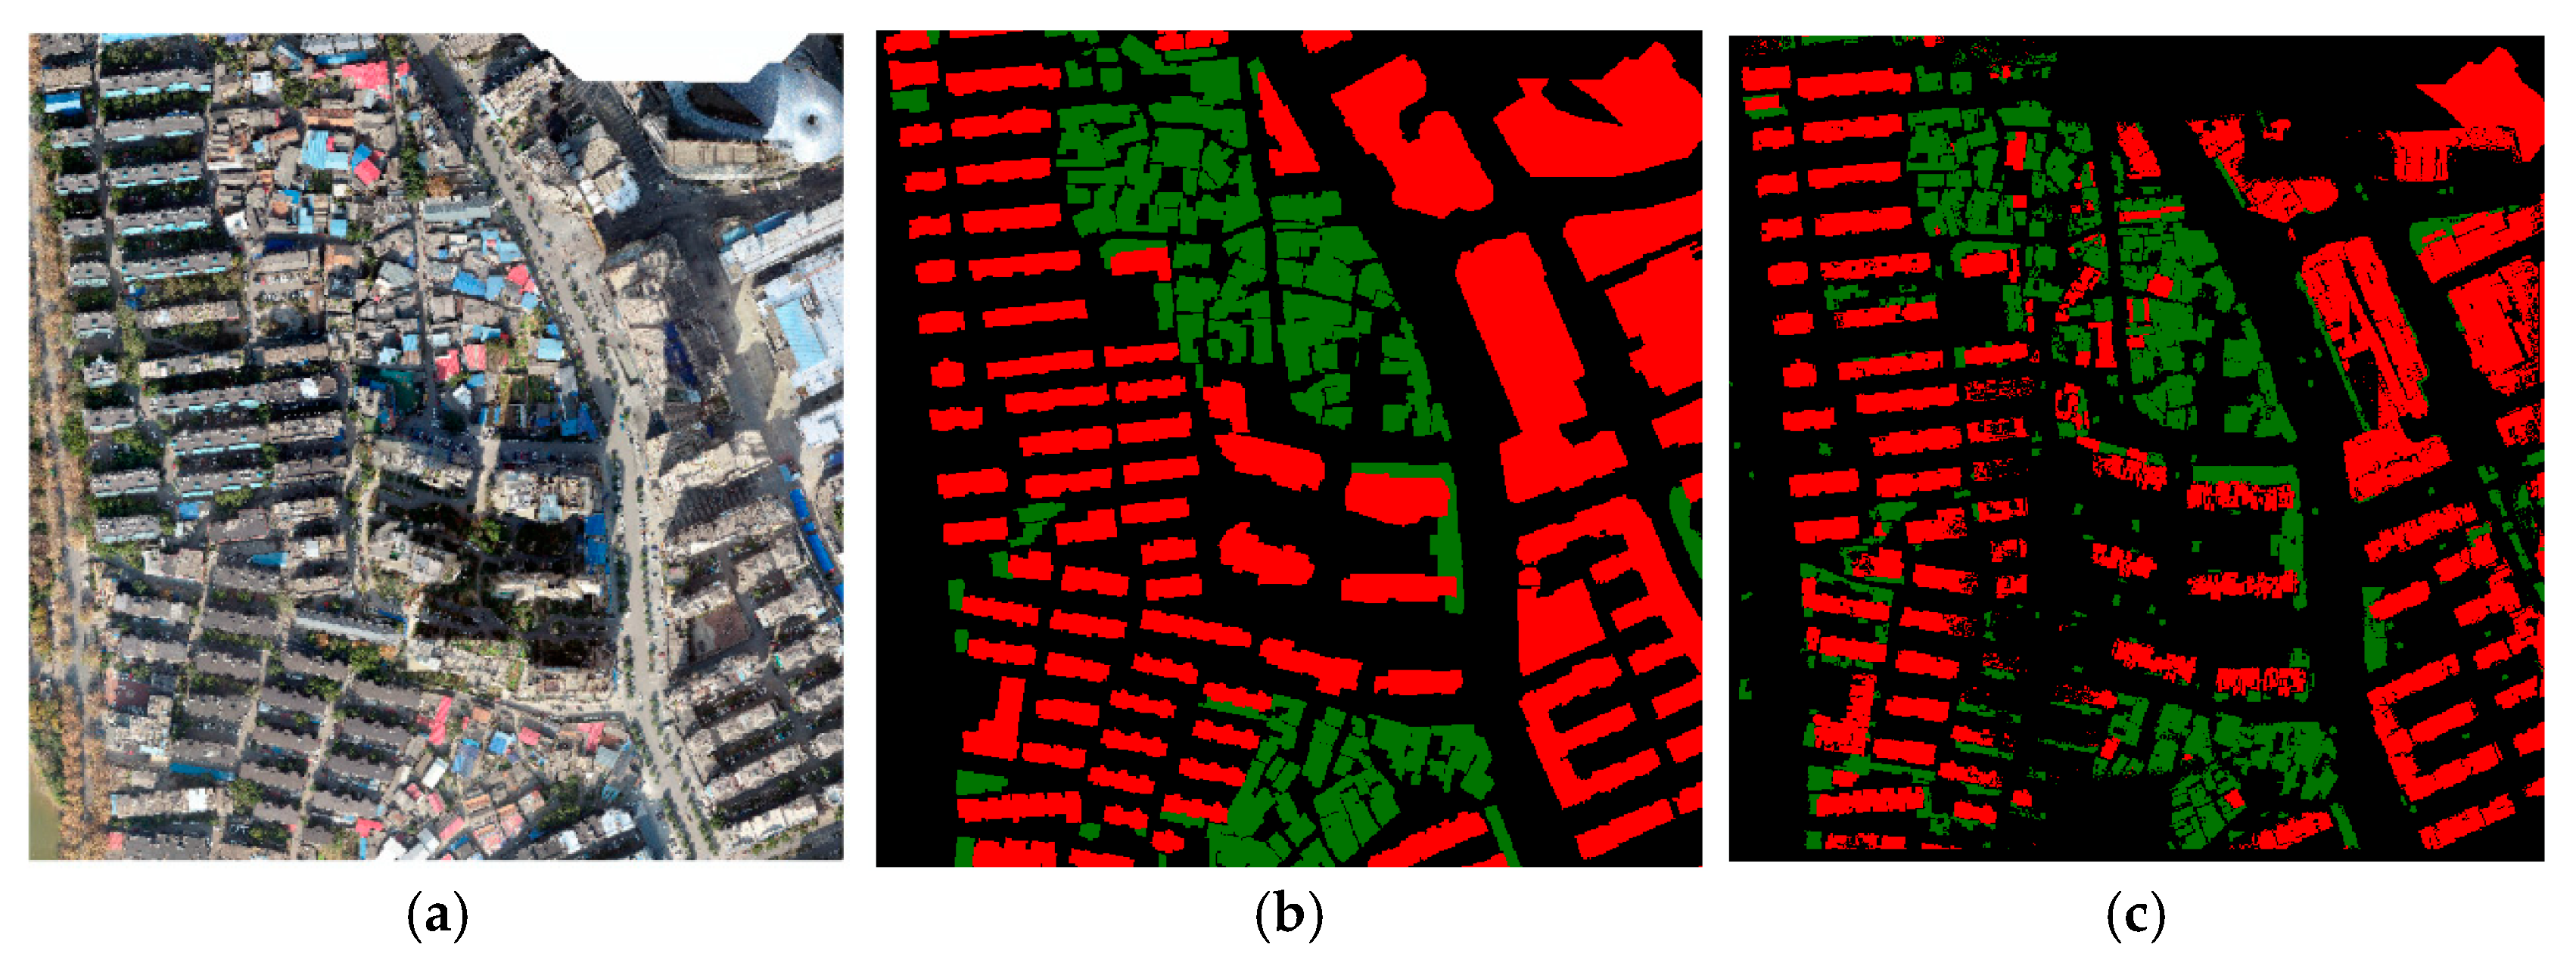
Figure 14.
Results of building weak sample generation based on image data. (a) Original image of . (b) Weak sample of . (c) Original image of . (d) Weak sample of .
Figure 14.
Results of building weak sample generation based on image data. (a) Original image of . (b) Weak sample of . (c) Original image of . (d) Weak sample of .
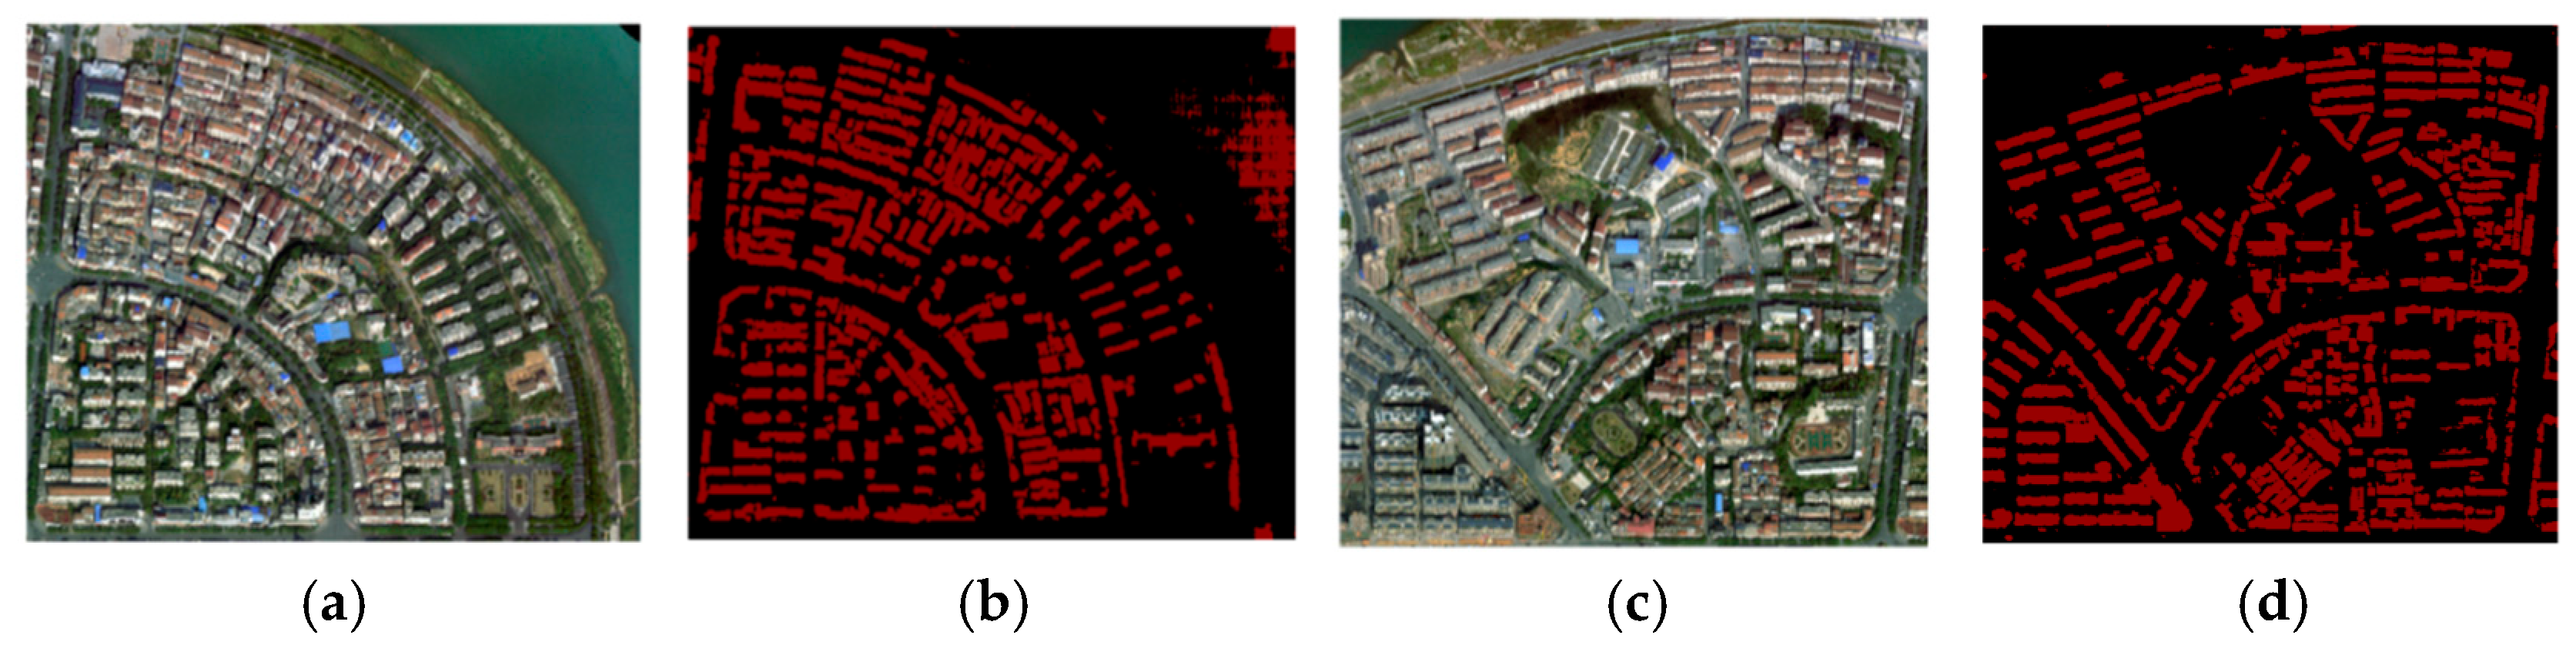
Figure 15.
Comparison of changes in weak samples during iterative optimization. (a) area image. (b) area real sample. (c) area weak sample. (d) Correct sample after one iteration. (e) Correct sample after final iteration.
Figure 15.
Comparison of changes in weak samples during iterative optimization. (a) area image. (b) area real sample. (c) area weak sample. (d) Correct sample after one iteration. (e) Correct sample after final iteration.


Table 1.
Accuracy evaluation of experimental results in the Yuhu Urban dataset.
| Network Model | Background | High-Rise Building | Low-Rise Building | ||
|---|---|---|---|---|---|
| UNet | 74.3% | 58.5% | 51.1% | 61.3% | 77.5% |
| DeepLabv3+ | 78.4% | 66.6% | 60.8% | 68.6% | 82.5% |
| FDTNet | 79.6% | 68.5% | 64.6% | 70.8% | 83.7% |
Table 2.
Accuracy evaluation of experimental results in the XXURB dataset.
| Network Model | Background | Building | ||
|---|---|---|---|---|
| UNet | 88.9% | 67.2% | 78.1% | 91.0% |
| DeepLabv3+ | 86.5% | 60.2% | 73.4% | 88.9% |
| FDTNet | 91.3% | 74.7% | 83.0% | 93.1% |
Table 3.
Accuracy evaluation of experimental results on the XXURB dataset.
| Test Area | Background | Building | ||
|---|---|---|---|---|
| 85.9% | 72.1% | 79.0% | 89.7% | |
| 87.7% | 73.7% | 80.7% | 90.8% |
Table 4.
Test accuracy of FDTNet when training 10% real sample area ().
| Sample Type | Background | High-Rise Building | Low-Rise Building | ||
|---|---|---|---|---|---|
| Real sample | 76.5% | 63.8% | 54.5% | 64.9% | 79.9% |
| LiDAR weak sample | 66.1% | 54.3% | 45.6% | 55.3% | 70.7% |
Table 5.
Comparison of test accuracy before and after 50% LiDAR weak sample iterative optimization.
| Method | Background | High-Rise Building | Low-Rise Building | ||
|---|---|---|---|---|---|
| FDTNet | 66.6% | 58.6% | 50.9% | 58.7% | 74.9% |
| FDTNet (after optimization) | 69.5% | 59.1% | 53.3% | 60.6% | 76.5% |
| UNet | 64.5% | 49.9% | 29.6% | 48.0% | 67.9% |
| UNet (after optimization) | 65.8% | 52.6% | 28.6% | 49.0% | 69.4% |
Table 6.
Test accuracy of FDTNet when training 10% real sample area ().
| Sample Type | Background | Building | ||
|---|---|---|---|---|
| Real sample | 91.3% | 74.7% | 83.0% | 93.1% |
| Image weak sample | 89.0% | 72.2% | 80.6% | 91.5% |
Table 7.
Comparison of test accuracy of FDTNet, when using different sample.
| Sample Type | Background | Building | ||
|---|---|---|---|---|
| Weak sample | 90.0% | 74.2% | 82.1% | 92.2% |
| Weak sample (after optimization) | 90.7% | 74.6% | 82.7% | 92.7% |
| Real sample | 91.4% | 75.8% | 83.6% | 93.2% |
Table 8.
Applicability of real samples from to weak sample.
| Method | Background | High-Rise Building | Low-Rise Building | ||
|---|---|---|---|---|---|
| FDTNet (after optimization) | 69.5% | 59.1% | 53.3% | 60.6% | 76.5% |
| FDTNet (after optimization+) | 69.2% | 57.9% | 53.2% | 60.1% | 76.5% |
Disclaimer/Publisher’s Note: The statements, opinions and data contained in all publications are solely those of the individual author(s) and contributor(s) and not of MDPI and/or the editor(s). MDPI and/or the editor(s) disclaim responsibility for any injury to people or property resulting from any ideas, methods, instructions or products referred to in the content. |
© 2023 by the authors. Licensee MDPI, Basel, Switzerland. This article is an open access article distributed under the terms and conditions of the Creative Commons Attribution (CC BY) license (https://creativecommons.org/licenses/by/4.0/).
Share and Cite
MDPI and ACS Style
Wang, Y.; Lin, Y.; Huang, H.; Wang, S.; Wen, S.; Cai, H. A Weak Sample Optimisation Method for Building Classification in a Semi-Supervised Deep Learning Framework. Remote Sens. 2023, 15, 4432. https://doi.org/10.3390/rs15184432
AMA Style
Wang Y, Lin Y, Huang H, Wang S, Wen S, Cai H. A Weak Sample Optimisation Method for Building Classification in a Semi-Supervised Deep Learning Framework. Remote Sensing. 2023; 15(18):4432. https://doi.org/10.3390/rs15184432
Chicago/Turabian StyleWang, Yanjun, Yunhao Lin, Huiqing Huang, Shuhan Wang, Shicheng Wen, and Hengfan Cai. 2023. "A Weak Sample Optimisation Method for Building Classification in a Semi-Supervised Deep Learning Framework" Remote Sensing 15, no. 18: 4432. https://doi.org/10.3390/rs15184432
Note that from the first issue of 2016, this journal uses article numbers instead of page numbers. See further details here.