
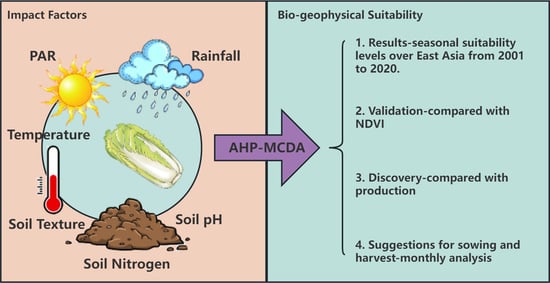
Bio-Geophysical Suitability Mapping for Chinese Cabbage of East Asia from 2001 to 2020


Institute of Industrial Science, The University of Tokyo, Tokyo 1538505, Japan
*
Author to whom correspondence should be addressed.
Remote Sens. 2023, 15(5), 1427; https://doi.org/10.3390/rs15051427
Submission received: 21 December 2022
/
Revised: 26 February 2023
/
Accepted: 1 March 2023
/
Published: 3 March 2023
(This article belongs to the Special Issue Selected Papers from the “International Symposium on Remote Sensing 2022”)
Abstract
:The cultivation of Chinese cabbage is a crucial source of daily vegetable supply for both human consumption and livestock feed, particularly in East Asian countries. However, changes in global climate and land usage have resulted in significant shifts in the ecological conditions suitable for Chinese cabbage production, thereby threatening its productivity. To address this issue, this study was conducted to map the bio-geophysical suitability of Chinese cabbage in East Asia (Japan, Northeast China, South Korea, and North Korea) from 2001 to 2020. This study integrated six key factors—temperature, rainfall, photosynthetically active radiation (PAR), soil nitrogen, soil pH, and soil texture—into a seasonal and monthly bio-geophysical suitability assessment using a GIS-based Analytic Hierarchy Process–Multiple-Criteria Decision-Making Analysis (AHP-MCDA). The levels of bio-geophysical suitability were categorized into four levels: optimal, suitable, marginal, and unsuitable. The findings of the study firstly indicate that summer is the optimal season for Chinese cabbage cultivation, as it was found to have the highest level of optimal suitability among the four seasons in East Asia. South Korea has the largest percentage of optimal and suitable areas compared to the other three countries. Secondly, this study also conducted a comparison analysis between bio-geophysical suitability and Normalized Difference Vegetation Index (NDVI) over 20 years, and the results show good consistency between the two indicators, with the highest R2 value being 0.61. Thirdly, the comparison between bio-geophysical suitability and production data in two villages in Japan demonstrates that an increase in suitability from 0.28 to 0.32 indicates a significant increase in production. Production would stay stable even with further increases in suitability. Finally, two case studies with monthly comparisons of bio-geophysical suitability across Japan and East Asia in 2020 provide an effective benchmark for determining optimal sowing and harvest times. This study’s results can provide important insights into the trade of Chinese cabbage and support the development of agricultural insurance programs both for farmers and insurance companies. Furthermore, this approach may also be applicable for the assessment of the suitability of other crops.
1. Introduction
The rapid increases in global population and economic development demands have brought dramatic urbanization and the expansion of industrialization into agricultural lands in recent years [1,2,3]. According to The World Bank, the percentage of global agricultural lands has consistently decreased from 37.6% to 36.5% within these two decades and is predicted to present a downward trend afterward [4,5,6]. Along with the threats posed by global warming and extreme meteorological disasters, the niches for various crops have also been consistently changing [7]. Consequently, to guarantee global food security, the urgent need for balancing the optimal use of limited agricultural lands with sustainable agriculture development for future ages is more significant than ever [8,9,10].
Sustainable agriculture is a vital issue, as it aims to satisfy the demands of society for food or commodity by means of understanding ecosystem services in order to leave enough space for future generations to survive [11,12,13]. Remote sensing can provide timely, frequent, and ubiquitous observations over the land’s surface at a wide range of both spatial and temporal scales [14,15,16,17]. Therefore, there is the potential for experiments carrying out suitability mapping to contribute to sustainable agriculture [18,19,20]. Specific crops can be guaranteed to provide high yield with low risk in the proper zones that suitability mapping results indicate as optimal and suitable [21]. Meanwhile, suitability mapping results can also give evidence of where specific crops successfully survive in unsuitable zones [22]. The key farming technology that supports crop survival can, therefore, be promoted to help improve other areas under similar conditions. Moreover, unsuitable areas of suitability mapping results should also be avoided for cultivation or guaranteed with agricultural insurance [23].
Selecting the optimal places for agricultural production through suitability mapping can be a complex process that requires a comprehensive understanding of meteorology, agrology, and mechanisms of plant growth [24,25]. Currently, most researchers carry out land suitability analysis (LSA), which only focuses on land quality, aspects of which include soil, topography, land use type, etc. [26,27]. However, the evaluation of whether the growing environment of crops aligns with their growth requirements should involve more factors such as solar demand and meteorological conditions. Hence, a comprehensive suitability evaluation referred to as “bio-geophysical suitability” was proposed. Bio-geophysical suitability considers all the elements that crops need to grow and flourish and provides an inclusive assessment of whether the environment is suitable for crop growth [28].
While integrating multiple parameters into suitability mapping, parametric methods such as stories, square root methods, and parsing classification are frequently used for logical rating and scoring [29,30,31]. However, these models have a tendency to overlook variability in the importance of individual elements required for crop growth. Analytical Hierarchy Process-Multiple-Criteria Decision Analysis (AHP-MCDA) has been used for decision making since the 1980s [32]. Based on a hierarchic structure that considers experts’ opinions, AHP-MCDA is used to calculate and represent the significance and relationship between factors with an accuracy validation of the consistency index [33]. While equipped with a geographical information system (GIS), AHP-MCDA is used to assign proper weights to each element, then suitable lands for agricultural use are comprehensively determined via mapping results. For instance, a GIS-based MCDA was used by Romano et al. [34] to evaluate the potential of a rural coastal area in Southern Italy, improving its sustainable development through the restoration of manor farms, which were large agricultural properties during the medieval period. Bozdag et al. [35] applied GIS-based AHP methodology to assess the land suitability of Cihanbeyli, Turkey, obtaining land suitability maps to identify the suitable areas for irrigated and dry farm agriculture. Morales and de Vries [36] also developed an AHP-MCDA for land use suitability analysis of residential, industrial, commercial, agricultural, and forest land uses.
Napa cabbage (Brassica rapa subsp. pekinensis), known as Chinese cabbage, is a staple vegetable in the daily diets of people and livestock in East Asian countries [37,38]. In 2016, it was reported to have the highest vegetable yield across China [39]. Chinese cabbage has a general growing period of 60–90 days. In East Asia, Chinese cabbage is a seasonal vegetable, and cultivation and harvest time vary depending on different regions’ climates and soil conditions. Currently, there have not been any studies focusing on the suitability analysis of Chinese cabbage across East Asia.
Widely used in the field of agriculture to assess the health and productivity of crops, the Normalized Difference Vegetation Index (NDVI) reflects the amount of green vegetation in certain areas [40]. NDVI has been chosen for describing crop calendars over long time periods. De Castro et al. [41] proposed a general and robust procedure to map crop phenology using MODIS-NDVI in a complex and diverse cropland area located in central California. Nguyen et al. [42] described and mapped the variability in irrigated rice cropping patterns of the Mekong delta by evaluating NDVI classes generated from SPOT image series. Pan et al. [43] also presented a comprehensive method to construct an NDVI time-series dataset derived from HJ-1 A/B CCD and demonstrated its crop calendar in cropland areas. Easily obtained from satellite imagery, NDVI makes it possible to monitor crop growth and changes over large areas and long time periods and therefore describe the growth conditions and maturation patterns of crops [44]. By comparing the NDVI-derived crop calendar with the suitability results, researchers can assess the accuracy of the suitability map and determine how well the model represents the true biophysical conditions on the ground [19].
This study presents a comprehensive assessment of the bio-geophysical suitability of Chinese cabbage based on the AHP-MCDA methodology in four seasons (spring, summer, autumn, and winter) across East Asia (Japan, Northeast China, South Korea, and North Korea) from 2001 to 2020. The main objectives can be mainly described as follows: (1) assess the bio-geophysical suitability results of Chinese cabbage in four seasons in East Asia from 2001 to 2020 and evaluate their accuracies by comparison via NDVI; (2) discover the relationship between bio-geophysical suitability and production through two case studies; and (3) conduct monthly analysis of bio-geophysical suitability at both national and international scales and provide recommendations for optimal sowing and harvesting times.
2. Materials and Methods
2.1. Study Area
This study covered a part area of East Asia (29°45′40″–45°59′12″N, 124°0′29″–149°15′17″W), including Japan, Northeast China, South Korea, North Korea, as Figure 1 illustrates. The background was from Google Satellite. In addition, eighteen sites across East Asia where Chinese cabbage was cultivated were also monitored, as Figure 1 shows. Broadly classified as either temperate or subtropical climates within East Asia, coastal areas such as Orang, Muan, and Haenam often encounter monsoons, while others have a more seasonal rainfall pattern [45]. The soil types in these sites range from fertile loams and clay soils in low-lying areas to rocky, acidic soils in mountainous regions [46]. All eighteen selected Chinese cabbage fields were cultivated bare lands. Moreover, Kawakami (35°52′11.86′′–35°59′42.92′′N, 138°29′5.31′′–138°44′20.14′′W) and Minamimaki (35°53′47.94′′–36°3′11.10′′N, 138°21′39.21′′–138°33′30.30′′W) in Nagano County, Japan, whose productions were the highest ones among villages in Japan, were selected for comparison analysis between suitability mapping results and ground truth production data.
2.2. Input Factors and Data Process
Bio-geophysical suitability, which comprises solar, meteorological, and agrological suitability, plays a crucial role in the growth and production of Chinese cabbage. This study incorporated six essential factors for cabbage growth into the AHP-MCDA model, including temperature, rainfall, PAR, soil nitrogen, soil texture, and soil pH. In this study, the datasets of six parameters for bio-geophysical suitability mapping are all illustrated in Table 1. Particularly, MODIS MOD11A2 v006 of land surface temperature, JAXA NRT of rainfall, and MODIS MCD18A2 of PAR, which has a different temporal resolution, were all calculated to the seasonal averages, which were divided among spring (March, April, May), summer (June, July, August), autumn (September, October, November), and winter (December, January, February) from 2001 to 2020. The monthly averages of 2020 of three elements were also calculated for further discussion.
2.2.1. Solar Suitability
Solar suitability is determined by the intensity of illuminance. Chinese cabbage prefers long-time illumination. Extended light hours can promote good growth, as photosynthesis is closely related to illumination. Generally, the photosynthetic compensation point of cabbage is within 750–1000 lux per day while the photosynthetic satiation point is within 15,000–25,000 lux [47]. PAR is a measure of the intensity of sun illumination that is available for photosynthesis in plants. It is defined as the portion of the total solar radiation spectrum that falls within the 400–700 nm range, which is the part of the spectrum that is most efficiently used by plants for photosynthesis [48]. Calculation of the threshold classes of PAR under natural light can be performed using the following approach [47]:
where PAR is the photosynthetically active radiation (W/m2) and the unit of illuminance is lux.
2.2.2. Meteorological Suitability
Meteorological suitability consists of the suitability of land surface temperature and precipitation. As a semi-hardy vegetable, the growth of Chinese cabbage requires a mild climate. Most varieties of Chinese cabbage do not tolerate extremely high or low land surface temperatures and are generally adapted to a daily land surface average temperature of 15–25 °C [39,49].
Precipitation is also an essential element for the growth of Chinese cabbage. The Chinese cabbage root system is shallow in the top layer of soil an cannot make full use of deep soil water; hence, the water supply for Chinese cabbage relies on rainfall and irrigation [50]. Prior research has recommended a range of 60–100 mm of rainfall, supplemented with appropriate irrigation, for a 60-day growth period of Chinese cabbage [47,51]. In this study, we adopt the term “rainfall” to refer specifically to the accumulated rainfall during the growth phase of Chinese cabbage, under the assumption that the soil possesses sufficient capacity to withstand irrigation, notwithstanding potential water losses such as runoff and evaporation. The rainfall can be calculated as follows:
where Rainfall refers to accumulated rainfall (mm); Hourly Rainfall denotes single raster image of JAXA NRT (mm/h); i is the account of accumulated raster images of NRT for purposes of seasonal and monthly analysis accordingly.
2.2.3. Agrological Suitability
Agrological suitability can be evaluated by soil properties like soil nitrogen, soil phosphorus and soil potassium, soil texture, and soil pH. Limited to data available on the scale of East Asia, soil nitrogen, soil texture, and soil pH were included to determine agrological suitability. In this study, the soil properties (soil nitrogen, soil texture, and soil pH) all refer to properties of the top layer of soil (0–5 cm). As one of the most vital nutrient elements in soil, the content of soil nitrogen has a profound impact on the growth of Chinese cabbage and mainly increases the amount of thickness of leaves [52,53]. It has been reported that for every 1000 kg of Chinese cabbage harvested, 1.8–2.6 kg of pure soil nitrogen is needed [39].
Fertile, loose soil with good aeration, water, and fertilizer retention capacities are required as the prerequisites for high-yield Chinese cabbage. Therefore, soil texture is crucial for its growth [54,55]. Loam has a strong ability to retain fertilizer and moisture. It is the most suitable for cabbage cultivation, while sandy clay, silty clay, and silt are also good enough to retain fertilizer and water. Cultivated in loamy sand, sandy loam, silty loam, sil loam, or sand, Chinese cabbage may grow well enough in the rosette period but may die in the dormant stage because of its poor ability to contain fertilizer [56].
The cultivation of Chinese cabbage necessitates a soil environment with a slightly acidic to neutral pH level, ranging between 6.5 and 7 [39,48]. An over-acidic soil condition can lead to the development of diseases such as rhizomatosis, while an over-alkaline soil can increase the susceptibility to diseases such as saline damage and dry heartburn [57].
In addition, only agricultural lands were considered for bio-geophysical suitability mapping, and the water system was removed as well in this study [10]. Four datasets assembled on the Google Earth Engine used for agricultural land extraction and water body removal are also shown in Table 1. Bio-geophysical suitability maps were also generated from the Google Earth Engine, and the displayed maps were output as categorization maps from ArcGIS 10.3. Because of the disparities in spatial resolution between multiple satellite imageries, it was proposed that all input datasets undergo resampling utilizing a common methodology called the bilinear interpolation method [58] to a final resolution of 250 m, which corresponds to the finest resolution over all criteria.
2.3. Crop Calendar and Ground Truth Production
NDVI, widely preferred in crop calendar studies, is a simple and robust representation of the actual distribution and productivity of vegetation in the field. NDVI can be used to assess the consistency and accuracy of suitability results, thereby validating the suitability results with actual crop health and growing conditions observed on the ground. There have been numerous studies conducted to validate the proposed model results with NDVI, such as the independent accuracy assessment performed by Radočaj et al. [59] using peak NDVI values derived from Sentinel-2 multispectral satellite images, and the seasonal NDVI adapted by Ujoh et al. [60] to assess the accuracy of suitability mapping for rice cultivation in Benue State, Nigeria. Similarly, Jargalsaikhan et al. [61] have also conducted validation with NDVI.
In order extend the overall temporal coverage and guarantee data availability for the duration of the 20-year study period, an aggregation of NDVI intended for comparison analysis was conducted by integrating Landsat 7 Collection 1 Tier 1 8-Day NDVI Composite, Landsat 8 Collection 1 Tier 1 8-Day NDVI Composite, and Sentinel-2 MSI: Multispectral Instrument, Level-2A. Particularly, for Sentinel-2 MSI, after cloud masking, the NDVI is calculated as [62]:
where RED represents the red band, which is the B4 band of Sentinel-2A, while NIR is the near-infrared band, which is B8 of Sentinel-2A. Since there is a discrepancy of spatial resolution between the Landsat NDVI composite and Sentinel-2 imageries, bilinear interpolation method was also utilized to upscale the resolution of the Sentinel-2 imageries from 10 m to 30 m. By incorporating these diverse satellite systems, the available information was optimized and the results were based on a comprehensive and reliable dataset. The daily NDVI aggregation was subsequently calculated into average seasonal NDVI aggregation.
It was also recognized that there also exists a mismatch between the spatial resolution of NDVI aggregation and suitability maps. This disparity is particularly relevant in the context of Chinese cabbage fields in East Asia, as some of these fields may not cover an area as large as hundreds of meters and may therefore incorporate more land features. To address this issue, the bio-geophysical suitability maps were downscaled from a resolution of 250 m to 30 m via the bilinear interpolation method in order to enable a more precise comparison with the corresponding pixels in NDVI aggregation.
The acquisition of accurate and prompt data on Chinese cabbage production in individual countries is a challenging task. Hence, this study utilizes production data of Chinese cabbage from the years 2005 to 2016 from the villages of Kawakami and Minamimaki in order to examine the relationship between suitability and production. The primary source of production data for this study was the Japan Crops website [63], a platform dedicated to promoting and sharing agricultural information across Japan. The villages of Kawakami and Minamimaki were selected as the case study for this comparison analysis, as they are well known for cultivation and production of Chinese cabbage over Japan. The data collected for this study comprise the harvest data, which reflect the production of Chinese cabbage harvested by farmers, and the output data, which represent the production that reaches the market, for the spring, summer, and autumn seasons from 2005 to 2016.
2.4. Overflow
The proposed processing flow of this study, as depicted in Figure 2, was divided into five steps: (1) Criteria datasets, which included temperature, rainfall, soil nitrogen, soil texture, and soil pH data, were prepared for AHP-MCDA. Additionally, eighteen Chinese cabbage fields from the study area were selected, and Landsat NDVI composite and Sentinel-2 multispectral satellite imageries, as well as ground truth data, were collected. (2) Temperature, rainfall, and PAR datasets were calculated into seasonal and monthly aggregations, and standardized three soil properties to international standards. The daily Sentinel-2 images were first upscaled using the bilinear interpolation method to the same spatial resolution as the Landsat NDVI composites. Subsequently, the daily NDVI composites were aggregated to obtain the seasonal NDVI aggregations. (3) AHP-MCDA was applied on the sub-criteria of all six elements to produce the suitability maps accordingly. (4) AHP-MCDA was applied on the six input factors, with the extraction of agricultural lands and removal of waterbodies, thus generating the seasonal and monthly bio-geophysical suitability maps. (5) Downscaled pixels of the bio-geophysical suitability maps where eighteen points were located were matched with the resolution of NDVI, then followed by a time-series comparison analysis between suitability and NDVI. Additionally, two comparative analyses between the suitability and production data were conducted, as well as monthly evaluations of suitability both nationally and internationally.
2.5. Analytic Hierarchy Process–Multi-Criteria Decision Analysis (AHP-MCDA)
Resolving complicated decision-making problems consisting of multiple scenarios, criteria, and factors, the Analytic Hierarchy Process (AHP) is a potential mathematical method that sets priorities among factors according to experts’ opinions when quantitative and qualitative aspects should be considered, therefore helping the decision-making process go fluently [64]. The main steps of AHP can be mainly included as pairwise matrix setting, weight calculation, and consistency valuation [65]. The calculation principle was explained in detail by Thomas L. Satty [32].
The pairwise matrix was set according to multiple experts’ opinions on the fundamental comparison scale [10,39,47]. Table 2 shows the detail for the pairwise comparison matrix of the six elements involved. The temperature had a superior priority over rainfall and PAR, followed by soil properties. The authenticity of this pairwise matrix is considered reliable since the consistency ratio (CR) is 0.08, which is far less than 0.1. The classes of sub-criteria were all set based on relevant reference [38,47,50,58]. Six pairwise matrixes for each element to be weighted were also constructed through AHP-MCDA. The CRs for temperature, rainfall, PAR, soil nitrogen, soil texture, and soil pH are 0.008, 0.029, 0.070, 0.076, 0.022, and 0.086, which are all less than 0.1, indicating that all the matrixes are consistent. The weights of all criteria can be seen in Table 3.
The corresponding threshold can be obtained by summing up the corresponding weights of each class for each element, which are shown in Table 3. By this means, four categorizations of bio-geophysical suitability were eventually calculated, as Table 4 shows. The suitability weights located in the corresponding intervals were classified as optimal, suitable, marginal, and unsuitable. Optimal designates the best places for Chinese cabbage to grow, while suitable describes where Chinese cabbage can successfully grow. Marginal designates the regions where Chinese cabbage may be cultivated but its yield and health cannot be guaranteed, whereas unsuitable stands for areas where it cannot survive.
3. Results
The bio-geophysical suitability maps of four seasons of East Asia from 2001 to 2020 are shown as Figure 3, Figure 4, Figure 5 and Figure 6. The land area proportions of different suitability levels of different scale (East Asia, Japan, Northeast China, South Korea, North Korea) from 2001 to 2020 in four seasons are also illustrated in Figure 7. The area statistics tables of East Asia in each season for two decades can be found in the supplementary material (Tables S1–S4). It is undeniable that summer has the most optimal percentage of suitability within the four seasons, while spring and autumn are also suitable seasons for Chinese cabbage to grow, where the suitability is almost fully occupied by the optimal and suitable levels. In the winter season, the marginal areas for Chinese cabbage to grow are approximately 15% of the entire farmlands in East Asia. Specifically, there was a sharp drop from the optimal level to the suitable level in the summer of 2017; this was probably because a quasi-stationary high-pressure system formed over the sea of Okhotsk, which brought cool wet northeast flows to the East Asian countries [66].
In Japan, the ranking of the seasons according to suitability level across two decades is summer > autumn > spring > winter. Since Japan has the largest latitude span, the north Hokkaido areas can be extremely cold in winter; despite this, Hokkaido has a large number of farmlands, therefore Japan had the most extensive rate of marginal and unsuitable levels in winter among the four countries. The northeast regions of China were found to be conducive for the growth of Chinese cabbage during the summer season. In spring and autumn seasons, there were sometimes huge differences in suitability from year to year since the climate of these seasons was unstable. In addition, China has undergone tremendous development changes in the past 20 years; the ratio between urban and rural areas is constantly changing, and some industrial pollution of the soil caused by urbanization may also make Chinese cabbage less likely to grow [67,68]. In South Korea, the best seasons are spring and autumn, but other two seasons were all good enough to grow Chinese cabbage; this could be one possible reason that Chinese cabbage has been one of the main ingredients of Korean dishes. In North Korea, according to the suitability analysis of 20 years, the ranking of the suitable seasons is summer > spring > autumn > winter.
4. Discussion
4.1. Comparison Analysis between Bio-Geophysical Suitability and NDVI
The validation of the bio-geophysical suitability of Chinese cabbage in relation to NDVI was conducted through a time-series comparison to demonstrate the consistency of their changing trends. Figure 8 and Figure 9 shows parts of sites intended for discussion. the dashed line called “suitable threshold” is the threshold value where Chinese cabbage can naturally survive without any anthropogenic farming interference. Other maps can also be found in the supplementary material (Figures S1 and S2). Furthermore, quantitative evaluations of the linear relationship between the two parameters were performed for validation. The results of the validation for each place are presented in Figure 10.
The comparison results of eleven sites (Iwamizawa, Shinotsu, Kawakami, Naganohara, Changchun, Shenyang, Yanbian, Goesan, Orang, Pyongyang-song, and Taehongdan) among the eighteen sites indicate a close alignment between the suitability and NDVI values. In particular, the cases of Iwamizawa, Shenyang, and Taehongdan, illustrated in Figure 8a–c, were chosen as examples to show high consistency, with the R2 values reaching high values of 0.61, 0.52, and 0.60, as shown in Figure 10a,i,r, respectively. In Japan, Kirishima and Taketa did not present positive correlations, and their R2 values were limited to 0.05 or even below 0.01 as shown in Figure 10f,g. Take the situation of Taketa for instance: as Figure 9a presents, the main reason for this could be multiple situations in which suitability went down while NDVI rose. Since the suitability of Taketa across whole seasons was still above the suitable threshold, although abnormal seasonal climates could affect the suitability values, in general, Chinese cabbage could still thrive naturally; therefore, NDVI was not affected. The trends between suitability and NDVI of all four sites in South Korea generally did not have ideal matches either. However, the explanation for this could be similar to the situation of Taketa. As illustrated in Figure 9b, Haenam serves as another pertinent example, wherein the suitability exhibited a decrement during the winter seasons of 2002 and 2003 due to comparatively lower temperatures, but experienced an increment during the summer seasons of 2016 and 2017. Despite these fluctuations in suitability, NDVI still exhibited a high value, as the suitability level remained above the threshold deemed as “suitable.” In China, the suitability of all four places was above the suitable threshold; therefore, they were all ideal places for Chinese cabbage cultivation. The suitability and NDVI of Harbin were exactly opposite from 2012 onwards as Figure 9c shows, while the other three places all had positive correlations between the two indexes. The discrepancy between the rising suitability and declining NDVI values in Harbin could be attributed to the fact that while the suitability levels were above the optimal threshold across all seasons, local farmers may have pursued cultivation strategies that prioritized the local vegetable market to maximize their profit, rather than only considering the suitability conditions of Chinese cabbage. For North Korea’s situation, the validations of suitability with NDVI of all four sites were acceptable, which can be seen in Figure 10o–r. In conclusion, based on the comparison analysis between suitability and NDVI of multiple sites of different regions in four countries of East Asia, suitability shows substantial homogeneity with NDVI in the locations of Chinese cabbage fields.
4.2. Comparison Analysis between Bio-Geophysical Suitability and Production Data
A comparison analysis between the suitability and production of Chinese cabbage was performed, as depicted in Figure 11. For the purpose of this analysis, the averages of the entire suitability values of the villages were utilized instead of individual pixels. The fitting curves in Figure 11a,b both demonstrate comparable trends. As the suitability clustered within a range of 0.26 to 0.30, the production remained at a relatively low level. However, as the suitability surpassed the optimal threshold of 0.32, production exhibited a substantial increase. Despite further increments in the suitability value, the fitted curve presents a saturation trend, suggesting that once suitability reached the optimal level, the production of Chinese cabbage maintained a stable trajectory. Given the financial cost associated with further improving the suitability, it could be inferred that additional increases in suitability are not imperative.
4.3. Monthly Evaluation of Bio-Geophysical Suitability Nationally and Internationally
Based on the validity of the suitability results, monthly comparison analysis can also contribute to optimal cultivation and harvest time, or even agricultural insurance suggestions both nationally and internationally. Three typical high-yielding cabbage production sites were selected within the entirety of Japan, specifically Iwamizawa in Hokkaido, Kawakami in Nagano, and Kirishima in Kyushu (Figure 12a), and these three sites refer to the northern, middle, and southern parts of Japan, respectively. In the spring season, as the snow has not melted yet in the northern parts of Japan, the suitability level of Iwamizawa was found to be beneath the suitable level, and Chinese cabbage would not survive during this season. However, the suitability level of Kawakami was found to be above the suitable threshold only after mid-April, which means the potential harvest time would be in mid-June if a sixty-day growth period type of Chinese cabbage was cultivated. Moreover, Kirishima was found to be entirely within an optimal suitability condition, therefore suggesting that large quantities of Chinese cabbage can be grown in Kirishima or nearby areas to satisfy the national Chinese cabbage market demand in spring season; local farmers can also receive huge benefits at this time. In summer, the suitabilities of all three sites were found to all be suitable for Chinese cabbage to survive, especially for Kawakami, where high production was granted for the past ten years if Chinese cabbage was sowed in April and harvested in June. Meanwhile, in Iwamizawa, it is possible to cultivate Chinese cabbage from mid-May, but anthropogenic farming techniques might be in need to guarantee its survival, or agricultural insurance is also necessary to protect the local farmers’ interests if the farming scale is large. Meanwhile, the growing condition in Kirishima was found to still be suitable, but production may not be as optimal as in the spring season since Chinese cabbage is also sensitive to burns if anti-high-temperature agricultural measures are not taken. The autumn season would be a suitable time for farmers in Kawakami and Iwamizawa to cultivate Chinese cabbage, provided that the cultivation is at least completed by mid-July. Conversely, Kirishima may have an opportunity to dominate the market share if the harvest time starts from October. In contrast to the other two locations where Chinese cabbage cultivation during colder weather conditions was found to be challenging, it remains viable for Kirishima to engage in winter cabbage production if tillage occurs prior to the onset of October.
Four sites in four countries with diverse latitudes were also selected for suitability comparison. As Figure 12b illustrates, Muan in South Korea was found to be an optimal place to cultivate Chinese cabbage across the four seasons; developing the export business of Chinese cabbage could be promising if the vegetable market of South Korea is saturated. During the spring season, Kawakami was found to be suitable for cultivation if started from mid-April, while for Harbin and Pyongyangsong, we found that it was recommended to sow at the outset of the season. By employing these strategies, the respective national demands for Chinese cabbage in the market can be satisfactorily met during this season. Meanwhile, in summer, all sites in four countries were found to be suitable for cultivation. Sowing in late July and harvesting in mid-September is acceptable for autumn Chinese cabbage in Kawakami with a short growing period such as 60 days. However, for the situations of Harbin and Pyongyangsong, the cultivation duration could last from August to mid-October, which means almost all types of Chinese cabbage are available to cultivate in autumn as their cultivation intervals are within 60 to 90 days. During the winter season, Muan is poised to easily command a significant market presence in the winter Chinese cabbage market since the other three sites would require significant human and financial resources and the implementation of advanced agricultural engineering techniques to help obtain normal production.
4.4. Limitations, Uncertainties, and Future Work
The AHP-MCDA method is widely used in geography, agriculture, and ecology due to its versatility in handling complex and conflicting criteria. However, there may be subjectivity in expert weight assignments. This study validated weight assignments with multiple references related to the biology and agriculture of Chinese cabbage [69,70] and compared the AHP-MCDA approach with the NDVI, showing high consistency in most areas in East Asia. Future work could consider alternative methodologies, such as weighted linear combination (WLC) [71] and fuzzy set qualitative comparative analysis (fsQCA) [25], to help evaluate the accuracy of AHP-MCDA.
Rainfall is widely regarded as the predominant water source for Chinese cabbage [39]. Given the specific focus of our study on frozen precipitation exclusively during the winter season in particular regions, any loss of water such as runoff or evaporation was not accounted for in our assessment of water supply to Chinese cabbage. As such, potential improvement may be needed in future work, such as with regard to the accuracy of rainfall, which could be assessed by evaluating soil moisture levels across East Asia [72]. Moreover, the level of soil science among the four countries differs, leading to limited data availability of soil conditions over the East Asia region. As a result, the agrological suitability part was based on the assumption that soil properties (soil nitrogen, soil texture, and soil pH) remained constant throughout the 20-year analysis period. However, this assumption may not accurately reflect reality, as soil properties are subject to changes due to human activities [73]. In future research, a more dynamic investigation of soil properties, incorporating updated soil properties datasets, would enhance the accuracy of bio-geophysical suitability assessment.
Furthermore, the analysis of the relationship between suitability and NDVI requires a bilinear interpolation downscaling in spatial resolution of the suitability maps from 250 m to 30 m to align with the resolution of NDVI data. However, this method is subject to limitations and uncertainties, such as its assumption of a linear relationship between data points and its dependence on the original data’s density and distribution. To address these limitations, alternative interpolation methods, such as bicubic interpolation or convolution filtering [64], could be employed and compared with the results obtained from bilinear interpolation. In addition, high-resolution data from satellite imagery or field observations could also be utilized to validate and enhance the accuracy of the downscaled data. Further exploration through a sensitivity analysis would also help determine the impact of different interpolation methods and data sources on the accuracy of the downscaled data.
5. Conclusions
In this study, a GIS-based Analytic Hierarchy Process–Multi-Criteria Decision-Making Analysis (AHP-MCDA) was used to assess the seasonal and monthly bio-geophysical suitability of Chinese cabbage including the six elements of temperature, rainfall, PAR, soil nitrogen, soil texture, and soil pH in East Asia from 2001 to 2020.
The results of this study firstly demonstrate that the summer season is the most favorable season for the cultivation of Chinese cabbage in East Asia. This conclusion was drawn based on the highest percentage of optimal level observed during the summer among the four seasons over the 20-year period analyzed. South Korea was found to have the highest rate of optimal level and the most suitable areas compared to Japan, Northeast China, and North Korea. Moreover, the time-series bio-geophysical suitability comparisons with NDVI revealed that 11 out of 18 sites show a high degree of consistency. The major inconsistency between suitability and NDVI cases could be explained by their suitability values already being above the suitable threshold; hence, there was no impact on NDVI even as suitability fluctuated. Additionally, two case studies in Japan were conducted to compare bio-geophysical suitability with production data over a ten-year period. The results indicate that there was a large gap in production when the value of suitability increased from 0.28 to 0.32, which corresponded to the shift from suitable to optimal level. On the other hand, once the suitability level exceeded 0.32, the production remained stable and saturated. A monthly suitability comparison analysis was carried out as an example at a national scale in Japan in 2020. The results suggest that Kirishima has the potential to dominate the national Chinese cabbage market during the spring and winter seasons, while Kawakami and Iwamizawa are optimal for cultivation if Chinese cabbage is sowed in mid-September and harvested in mid-July. In addition, a monthly international suitability comparison analysis was performed for four selected sites, each in one of our four countries. The results indicate that Muan of South Korea is optimal for cultivating Chinese cabbage throughout all seasons, making it a potential location for export to satisfy the demand for winter cabbage within East Asia. The other three sites were also found to be suitable for growing various types of Chinese cabbage if sowed and harvested at proper times. These results provide valuable insights into the optimal time for sowing and harvest, import and export trade between countries, and the need for agricultural insurance for local farmers or related insurance companies. Furthermore, this methodology is expected to be applied to other crops in the future.
Supplementary Materials
The following supporting information can be downloaded at: https://www.mdpi.com/article/10.3390/rs15051427/s1, Figure S1. Time-series suitability comparisons with NDVI of (a) Shinotsu, (b) Kawakami, (c) Naganohara, (d) Kirishima, (e) Changchun, (f) Yanbian. Figure S2. Time-series suitability comparisons with NDVI of (a) Gochang, (b) Goesan, (c) Muan, (d) Kyongwon, (e) Orang, (f) Pyongyangsong. Table S1. Areas statistics of suitability level of 20 years in spring season. Table S2. Areas statistics of suitability level of 20 years in summer season. Table S3. Areas statistics of suitability level of 20 years in autumn season. Table S4. Areas statistics of suitability level of 20 years in winter season.
Author Contributions
Conceptualization, S.S. and W.T.; methodology, S.S.; software, S.S.; validation, S.S.; formal analysis, S.S.; investigation, W.T.; resources, W.T.; data curation, S.S.; writing—original draft preparation, S.S.; writing—review and editing, W.T.; visualization, S.S.; supervision, W.T.; project administration, W.T.; funding acquisition, W.T. All authors have read and agreed to the published version of the manuscript.
Funding
This research received no external funding.
Data Availability Statement
The data utilized in this study can be made available upon request from the corresponding author.
Acknowledgments
The authors would like to express their sincere gratitude to three anonymous reviewers for providing insightful and constructive comments that significantly enhanced the quality and clarity of the manuscript. They would also like to extend their appreciation to Zheng Y.H. from Fudan University, China and Hu, B.F. from Jiangxi University of Finance and Economics, China, for their valuable contributions and constructive suggestions to this study.
Conflicts of Interest
The authors declare no conflict of interest.
References
- Hu, B.; Shao, S.; Ni, H.; Fu, Z.; Hu, L.; Zhou, Y.; Min, X.X.; She, S.F.; Chen, S.C.; Huang, M.X.; et al. Current status, spatial features, health risks, and potential driving factors of soil heavy metal pollution in China at province level. Environ. Pollut. 2020, 266, 114961. [Google Scholar] [CrossRef]
- Reba, M.; Seto, K.C. A systematic review and assessment of algorithms to detect, characterize, and monitor urban land change. Remote Sens. Environ. 2020, 242, 111739. [Google Scholar] [CrossRef]
- Zhang, Y.; Fu, T.; Chen, X.; Guo, H.; Li, H.; Hu, B. Modelling Cadmium Contents in a Soil–Rice System and Identifying Potential Controls. Land 2022, 11, 617. [Google Scholar] [CrossRef]
- The Word Bank. Agricultural Land (% of Land Area). Available online: https://data.worldbank.org/indicator/AG.LND.AGRI.ZS (accessed on 20 December 2022).
- Akıncı, H.; Özalp, A.Y.; Turgut, B. Agricultural land use suitability analysis using GIS and AHP technique. Comput. Electron. Agric. 2013, 97, 71–82. [Google Scholar] [CrossRef]
- Nurda, N.; Noguchi, R.; Ahamed, T. Change detection and land suitability analysis for extension of potential forest areas in Indonesia using satellite remote sensing and GIS. Forests 2020, 11, 398. [Google Scholar] [CrossRef] [Green Version]
- Habibie, M.I.; Noguchi, R.; Shusuke, M.; Ahamed, T. Land suitability analysis for maize production in Indonesia using satellite remote sensing and GIS-based multicriteria decision support system. GeoJournal 2021, 86, 777–807. [Google Scholar] [CrossRef]
- Kihoro, J.; Bosco, N.J.; Murage, H. Suitability analysis for rice growing sites using a multicriteria evaluation and GIS approach in great Mwea region, Kenya. Springerplus 2013, 2, 265. [Google Scholar] [CrossRef] [Green Version]
- Moeletsi, M.E.; Walker, S. Agroclimatological suitability mapping for dryland maize production in Lesotho. Theor. Appl. Climatol. 2013, 114, 227–236. [Google Scholar] [CrossRef]
- Peter, B.G.; Messina, J.P.; Lin, Z.; Snapp, S.S. Crop climate suitability mapping on the cloud: A geovisualization application for sustainable agriculture. Sci. Rep. 2020, 10, 15487. [Google Scholar] [CrossRef]
- Reganold, J.P.; Papendick, R.I.; Parr, J.F. Sustainable agriculture. Sci. Am. 1990, 262, 112–121. [Google Scholar] [CrossRef] [Green Version]
- Janker, J.; Mann, S.; Rist, S. What is sustainable agriculture? Critical analysis of the international political discourse. Sustainability 2018, 10, 4707. [Google Scholar] [CrossRef] [Green Version]
- Delgado, J.A.; Short, N.M., Jr.; Roberts, D.P.; Vandenberg, B. Big data analysis for sustainable agriculture on a geospatial cloud framework. Front. Sustain. Food Syst. 2019, 3, 54. [Google Scholar] [CrossRef] [Green Version]
- Seelan, S.K.; Laguette, S.; Casady, G.M.; Seielstad, G.A. Remote sensing applications for precision agriculture: A learning community approach. Remote Sens. Environ. 2003, 88, 157–169. [Google Scholar] [CrossRef]
- Huang, J.; Gómez-Dans, J.L.; Huang, H.; Ma, H.; Wu, Q.; Lewis, P.E.; Xie, X. Assimilation of remote sensing into crop growth models: Current status and perspectives. Agric. Forest. Meteorol. 2019, 276, 107609. [Google Scholar] [CrossRef]
- Xia, F.; Hu, B.; Shao, S.; Xu, D.; Zhou, Y.; Huang, M.X.; Li, Y.; Chen, S.C.; Shi, Z. Improvement of Spatial Modeling of Cr, Pb, Cd, As and Ni in Soil Based on Portable X-ray Fluorescence (PXRF) and Geostatistics: A Case Study in East China. Int. J. Environ. Res. Pub. Health 2019, 16, 2694. [Google Scholar] [CrossRef] [Green Version]
- Wang, M.; Feng, C.; Hu, B.; Wang, N.; Xu, J.; Ma, Z.; Peng, J.; Shi, Z. A new framework for reconstructing time series DMSP-OLS nighttime light data using the Improved Stepwise Calibration (ISC) method. Remote Sens. 2022, 14, 4405. [Google Scholar] [CrossRef]
- Bandyopadhyay, S.; Jaiswal, R.K.; Hegde, V.S.; Jayaraman, V. Assessment of land suitability potentials for agriculture using a remote sensing and GIS based approach. Int. J. Remote Sens. 2009, 30, 879–895. [Google Scholar] [CrossRef]
- Baroudy, A.A.E.; Ali, A.M.; Mohamed, E.S.; Moghanm, F.S.; Shokr, M.S.; Savin, I.; Lasaponara, R. Modeling land suitability for rice crop using remote sensing and soil quality indicators: The case study of the nile delta. Sustainability 2020, 12, 9653. [Google Scholar] [CrossRef]
- Binte, M.R.; Noguchi, R.; Ahamed, T. Agricultural land suitability assessment using satellite remote sensing-derived soil-vegetation indices. Land 2021, 10, 223. [Google Scholar] [CrossRef]
- Halder, J.C. Land suitability assessment for crop cultivation by using remote sensing and GIS. J. Geogr. Geol. 2013, 5, 65. [Google Scholar] [CrossRef]
- Islam, M.M.; Ahamed, T.; Noguchi, R. Land suitability and insurance premiums: A GIS-based multicriteria analysis approach for sustainable rice production. Sustainability 2018, 10, 1759. [Google Scholar] [CrossRef]
- Benami, E.; Jin, Z.; Carter, M.R.; Ghosh, A.; Hijmans, R.J.; Hobbs, A.; Kenduiywo, B.; Lobell, D.B. Uniting remote sensing, crop modelling and economics for agricultural risk management. Nat. Rev. Earth Environ. 2021, 2, 140–159. [Google Scholar] [CrossRef]
- Zolekar, R.B.; Bhagat, V.S. Multi-criteria land suitability analysis for agriculture in hilly zone: Remote sensing and GIS approach. Comput. Electron. Agric. 2015, 118, 300–321. [Google Scholar] [CrossRef]
- Seyedmohammadi, J.; Sarmadian, F.; Jafarzadeh, A.A.; McDowell, R.W. Development of a model using matter element, AHP and GIS techniques to assess the suitability of land for agriculture. Geoderma 2019, 352, 80–95. [Google Scholar] [CrossRef]
- Bock, M.; Gasser, P.Y.; Pettapiece, W.W.; Brierley, A.J.; Bootsma, A.; Schut, P.; Neilsen, D.; Smith, C.S. The land suitability rating system is a spatial planning tool to assess crop suitability in Canada. Front. Environ. Sci. 2018, 6, 77. [Google Scholar] [CrossRef] [Green Version]
- Tadesse, M.; Negese, A. Land suitability evaluation for sorghum crop by using GIS and AHP techniques in Agamsa sub-watershed, Ethiopia. Cogent. Food Agric. 2020, 6, 1743624. [Google Scholar] [CrossRef]
- Hashemvand, K.; Takeuchi, W. Assessment of oil palm yield and biophysical suitability in Indonesia and Malaysia. Int. J. Remote Sens. 2020, 41, 8520–8546. [Google Scholar] [CrossRef]
- Mendas, A.; Delali, A. Integration of MultiCriteria Decision Analysis in GIS to develop land suitability for agriculture: Application to durum wheat cultivation in the region of Mleta in Algeria. Comput. Electron. Agric. 2012, 83, 117–126. [Google Scholar] [CrossRef]
- Montgomery, B.; Dragićević, S.; Dujmović, J.; Schmidt, M. A GIS-based Logic Scoring of Preference method for evaluation of land capability and suitability for agriculture. Comput. Electron. Agric. 2016, 124, 340–353. [Google Scholar] [CrossRef]
- Motuma, M.; Suryabhagavan, K.V.; Balakrishnan, M. Land Suitability Analysis for Wheat and Sorghum Crops in Wogdie District, South Wollo, Ethiopia, Using Geospatial Tools. Appl. Geomat. 2016, 8, 57–66. [Google Scholar] [CrossRef]
- Saaty, T.L. Decision making with the analytic hierarchy process. Int. J. Ser. Sci. 2008, 1, 83–98. [Google Scholar] [CrossRef] [Green Version]
- Elaalem, M.; Comber, A.; Fisher, P. A comparison of fuzzy AHP and ideal point methods for evaluating land suitability. Trans. GIS 2011, 15, 329–346. [Google Scholar] [CrossRef]
- Romano, G.; Dal Sasso, P.; Liuzzi, G.T.; Gentile, F. Multi-criteria decision analysis for land suitability mapping in a rural area of Southern Italy. Land Use Policy 2015, 48, 131–143. [Google Scholar] [CrossRef]
- Bozdag, A.; Yavuz, F.; Günay, A.S. AHP and GIS based land suitability analysis for Cihanbeyli (Turkey) County. Environ. Earth Sci. 2016, 75, 813. [Google Scholar] [CrossRef]
- Morales, F., Jr.; de Vries, W.T. Establishment of land use suitability mapping criteria using analytic hierarchy process (AHP) with practitioners and beneficiaries. Land 2021, 10, 235. [Google Scholar] [CrossRef]
- Kim, D.W.; Yun, H.S.; Jeong, S.J.; Kwon, Y.S.; Kim, S.G.; Lee, W.S.; Kim, H.J. Modeling and testing of growth status for Chinese cabbage and white radish with UAV-based RGB imagery. Remote Sens. 2018, 10, 563. [Google Scholar] [CrossRef] [Green Version]
- Lee, C.H.; Lee, D.K.; Ali, M.A.; Kim, P.J. Effects of oyster shell on soil chemical and biological properties and cabbage productivity as a liming materials. Waste Manag. 2008, 28, 2702–2708. [Google Scholar] [CrossRef]
- Wang, S.F. Efficient Cultivation of Cabbage and Radish in Spring and Summer Season; Jindun Publisher: Beijing, China, 2016; pp. 17–29. (In Chinese) [Google Scholar]
- Carlson, T.N.; Ripley, D.A. On the relation between NDVI, fractional vegetation cover, and leaf area index. Remote Sens. Environ. 1997, 62, 241–252. [Google Scholar] [CrossRef]
- De Castro, A.I.; Six, J.; Plant, R.E.; Peña, J.M. Mapping crop calendar events and phenology-related metrics at the parcel level by object-based image analysis (OBIA) of MODIS-NDVI time-series: A case study in central California. Remote Sens. 2018, 10, 1745. [Google Scholar] [CrossRef] [Green Version]
- Nguyen, T.T.H.; De Bie, C.A.J.M.; Ali, A.; Smaling, E.M.A.; Chu, T.H. Mapping the irrigated rice cropping patterns of the Mekong delta, Vietnam, through hyper-temporal SPOT NDVI image analysis. Int. J. Remote Sens. 2012, 33, 415–434. [Google Scholar] [CrossRef]
- Pan, Z.K.; Huang, J.F.; Zhou, Q.B.; Wang, L.M.; Cheng, Y.X.; Zhang, H.K.; Blackburn, G.A.; Liu, J.H. Mapping crop phenology using NDVI time-series derived from HJ-1 A/B data. Int. J. Appl. Earth Obs. 2015, 34, 188–197. [Google Scholar] [CrossRef] [Green Version]
- DeFries, R.S.; Townshend, J.R.G. NDVI-derived land cover classifications at a global scale. Int. J. Remote Sens. 1994, 15, 3567–3586. [Google Scholar] [CrossRef]
- Lu, H.; Guo, Z. Evolution of the monsoon and dry climate in East Asia during late Cenozoic: A review. Sci. China Earth Sci. 2014, 57, 70–79. [Google Scholar] [CrossRef]
- Li, J.; Pu, L.; Zhu, M.; Zhang, J.; Li, P.; Dai, X.; Xu, Y.; Liu, L. Evolution of soil properties following reclamation in coastal areas: A review. Geoderma 2014, 226, 130–139. [Google Scholar] [CrossRef]
- Li, J.W.; Shinnohara, S.; Shimura, H. Chinese Cabbage; Shinohara Shiki Publisher: Tokyo, Japan, 1993; pp. 77–185. (In Japanese) [Google Scholar]
- Oh, S.; Moon, K.H.; Song, E.Y.; Son, I.C.; Koh, S.C. Photosynthesis of Chinese cabbage and radish in response to rising leaf temperature during spring. Hortic. Environ. Biotechnol. 2015, 56, 159–166. [Google Scholar] [CrossRef]
- Cho, J.H.; Suh, J.M.; Jin, K.H.; Kang, J.S.; Hong, C.O.; Lim, W.T.; Lee, S.G. The impacts of high temperature and heavy precipitation amount on winter Chinese cabbage yields. Int. J. Environ. Sci. 2013, 22, 235–242. (In Korean) [Google Scholar] [CrossRef]
- Kim, I.G.; Park, K.J.; Kim, B.J. Analysis of meteorological factors on yield of Chinese cabbage and radish in winter cropping system. Korean J. Agric. For. Meteorol. 2013, 15, 59–66. (In Korean) [Google Scholar] [CrossRef] [Green Version]
- University of California. Drought Tips for Home Gardeners. Available online: https://ucanr.edu/sites/mg-plumas-sierra/WaterManagement// (accessed on 23 September 2022).
- Qu, Z.M.; Qi, X.C.; Wang, J.; Chen, Q.; Li, C.L. Effects of nitrogen application rate and topdressing times on yield and quality of Chinese cabbage and soil nitrogen dynamics. Environ. Pollut. Bioavailab. 2019, 31, 1–8. [Google Scholar] [CrossRef] [Green Version]
- Hu, B.; Xie, M.; Li, H.; Zhao, W.; Hu, J.; Jiang, Y.; Ji, J.; Li, S.; Hong, Y.; Yang, M.; et al. Stoichiometry of soil carbon, nitrogen, and phosphorus in farmland soils in Southern China: Spatial pattern and related dominates. Catena 2022, 217, 106468. [Google Scholar] [CrossRef]
- Hu, B.; Zhou, Q.; He, C.; Duan, L.; Li, W.; Zhang, G.; Ji, W.; Peng, J.; Xie, H. Spatial variability and potential controls of soil organic matter in the Eastern Dongting Lake Plain in southern China. J. Soils Sediments 2021, 21, 2791–2804. [Google Scholar] [CrossRef]
- Li, H.; Van den Bulcke, J.; Mendoza, O.; Deroo, H.; Haesaert, G.; Dewitte, K.; Neve, S.; Sleutel, S. Soil texture controls added organic matter mineralization by regulating soil moisture—Evidence from a field experiment in a maritime climate. Geoderma 2022, 410, 115690. [Google Scholar] [CrossRef]
- Mi, Y.H.; Lu, L.; Liu, H.C. Impact analysis of soil texture on the quality of Chinese cabbage. Southwest. China. J. Agric. Sci. 2012, 25, 1347–1351. (In Chinese) [Google Scholar]
- Guttormsen, G.; Singh, B.R.; Jeng, A.S. Cadmium concentration in vegetable crops grown in a sandy soil as affected by Cd levels in fertilizer and soil pH. Fertil. Res. 1995, 41, 27–32. [Google Scholar] [CrossRef]
- Parker, J.A.; Kenyon, R.V.; Troxel, D.E. Comparison of interpolating methods for image resampling. IEEE Trans. Med. Imaging 1983, 2, 31–39. [Google Scholar] [CrossRef]
- Radočaj, D.; Jurišić, M.; Gašparović, M.; Plaščak, I. Optimal soybean (Glycine max L.) land suitability using gis-based multicriteria analysis and sentinel-2 multitemporal images. Remote Sens. 2020, 12, 1463. [Google Scholar] [CrossRef]
- Ujoh, F.; Igbawua, T.; Ogidi Paul, M. Suitability mapping for rice cultivation in Benue State, Nigeria using satellite data. Geo-Spat. Inf. Sci. 2019, 22, 332–344. [Google Scholar] [CrossRef] [Green Version]
- Jargalsaikhan, D.; Darhijav, B.; Rentsen, T. Estimation of crop suitability using NDVI in The Kherlen Basin Dornod province Mongolia. Int. J. Sci. Environ. Technol. 2021, 10, 19–21. [Google Scholar]
- Chen, J.; Jönsson, P.; Tamura, M.; Gu, Z.; Matsushita, B.; Eklundh, L. A simple method for reconstructing a high-quality NDVI time-series data set based on the Savitzky–Golay filter. Remote Sens. Environ. 2004, 91, 332–344. [Google Scholar] [CrossRef]
- Japan Crops. Summer and Autumn Hakusai. Available online: https://japancrops.com/en/cultivars/chinese-cabbage/summer-hakusai/municipalities/ (accessed on 20 November 2020).
- Bunruamkaew, K.; Murayam, Y. Site suitability evaluation for ecotourism using GIS & AHP: A case study of Surat Thani province, Thailand. Procedia Soc. Behav. Sci. 2011, 21, 269–278. [Google Scholar]
- Zhang, J.; Su, Y.; Wu, J.; Liang, H. GIS based land suitability assessment for tobacco production using AHP and fuzzy set in Shandong province of China. Comput. Electron. Agric. 2015, 114, 202–211. [Google Scholar] [CrossRef]
- Japan Meteorological Agency. Climate Change Monitoring Report 2017. Available online: https://www.jma.go.jp/jma/en/NMHS/ccmr/ccmr2017_low.pdf (accessed on 18 August 2021).
- Guan, X.; Wei, H.; Lu, S.; Dai, Q.; Su, H. Assessment on the urbanization strategy in China: Achievements, challenges and reflections. Habitat Int. 2018, 71, 97–109. [Google Scholar] [CrossRef]
- Tan, Y.; Xu, H.; Zhang, X. Sustainable urbanization in China: A comprehensive literature review. Cities 2016, 55, 82–93. [Google Scholar] [CrossRef]
- Günal, H.; Kılıç, O.M.; Ersayın, K.; Acir, N. Land suitability assessment for wheat production using analytical hierarchy process in a semi-arid region of Central Anatolia. Geocarto. Int. 2022, 37, 16418–16436. [Google Scholar] [CrossRef]
- Anselin, A.; Meire, P.M.; Anselin, L. Multicriteria techniques in ecological evaluation: An example using the analytical hierarchy process. Biol. Conserv. 1989, 49, 215–229. [Google Scholar] [CrossRef]
- Yin, S.; Li, J.; Liang, J.; Jia, K.; Yang, Z.; Wang, Y. Optimization of the weighted linear combination method for agricultural land suitability evaluation considering current land use and regional differences. Sustainability 2020, 12, 10134. [Google Scholar] [CrossRef]
- Shao, S.; Hu, B.; Fu, Z.; Wang, J.; Lou, G.; Zhou, Y.; Jin, B.; Li, Y.; Shi, Z. Source identification and apportionment of trace elements in soils in the Yangtze River Delta, China. Int. J. Environ. Res. Public Health 2018, 15, 1240. [Google Scholar] [CrossRef] [Green Version]
- Min, X.; Li, D.; Shangguan, Y.; Tian, S.; Shi, Z. Characterizing the accuracy of satellite-based products to detect soil moisture at the global scale. Geoderma 2023, 432, 116388. [Google Scholar] [CrossRef]
Figure 1.
Map of the study area.

Figure 2.
Overflow of this study.
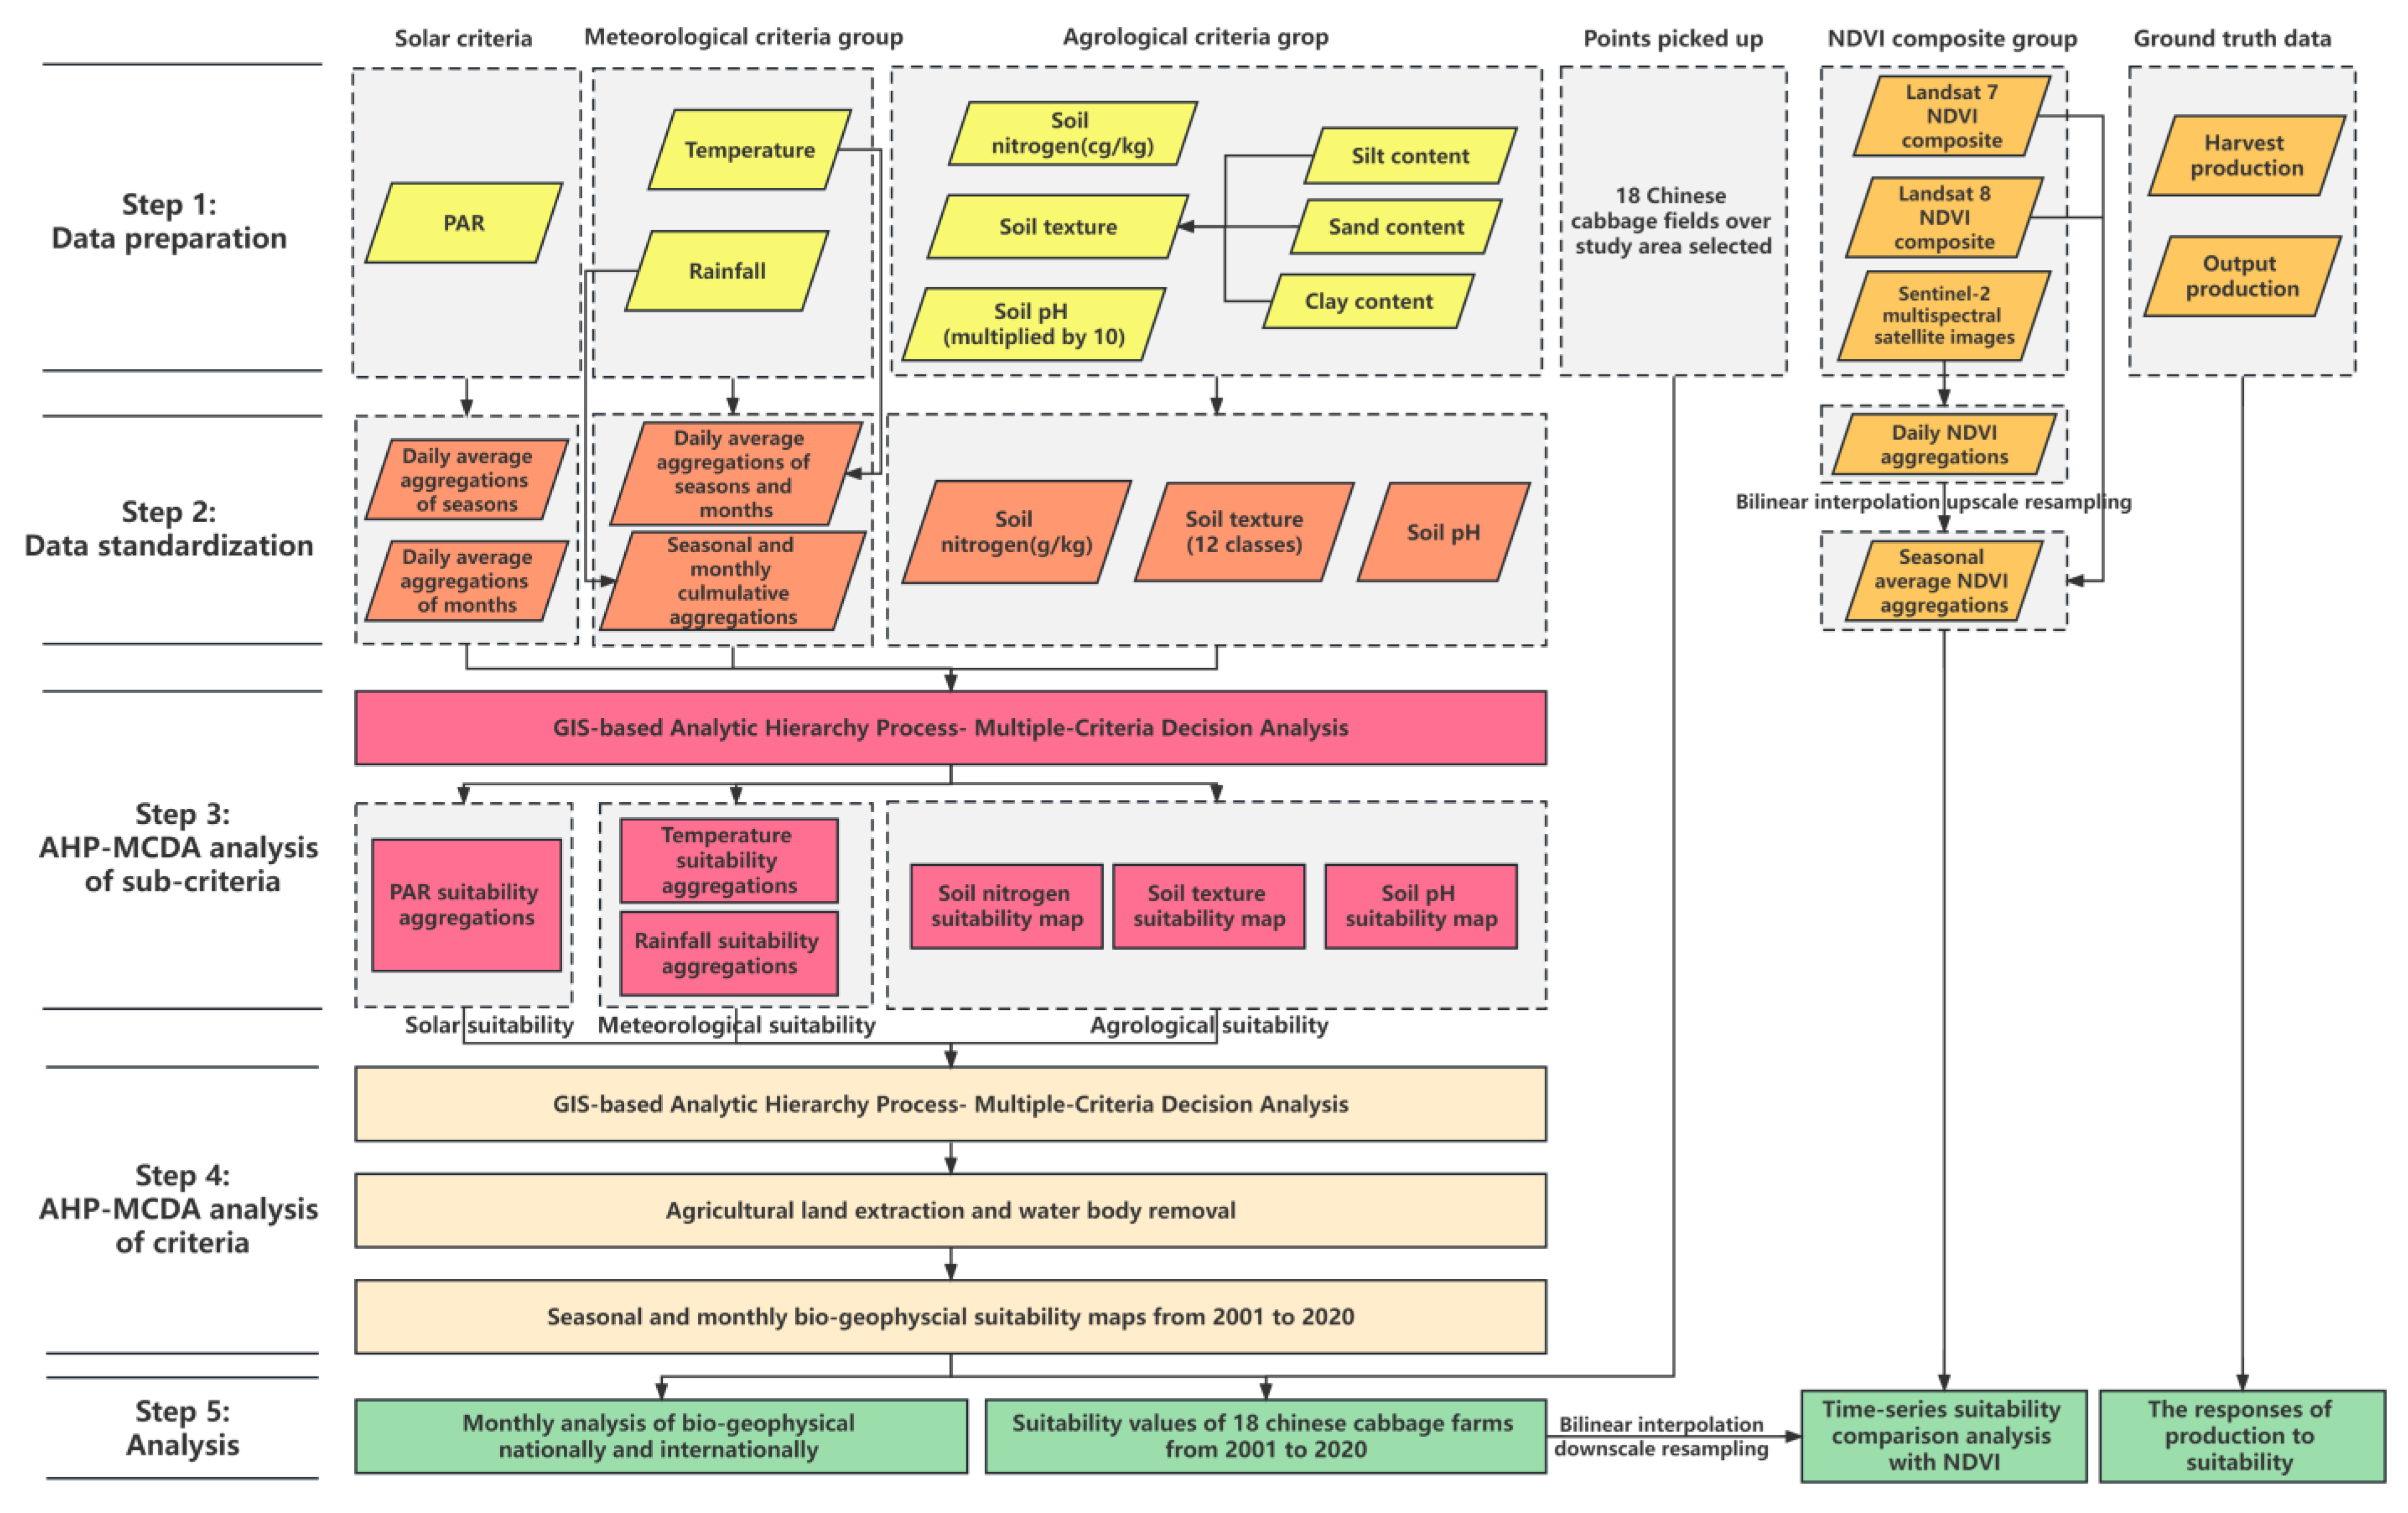
Figure 3.
Bio-geophysical suitability maps of East Asia from 2001 to 2020 in spring.
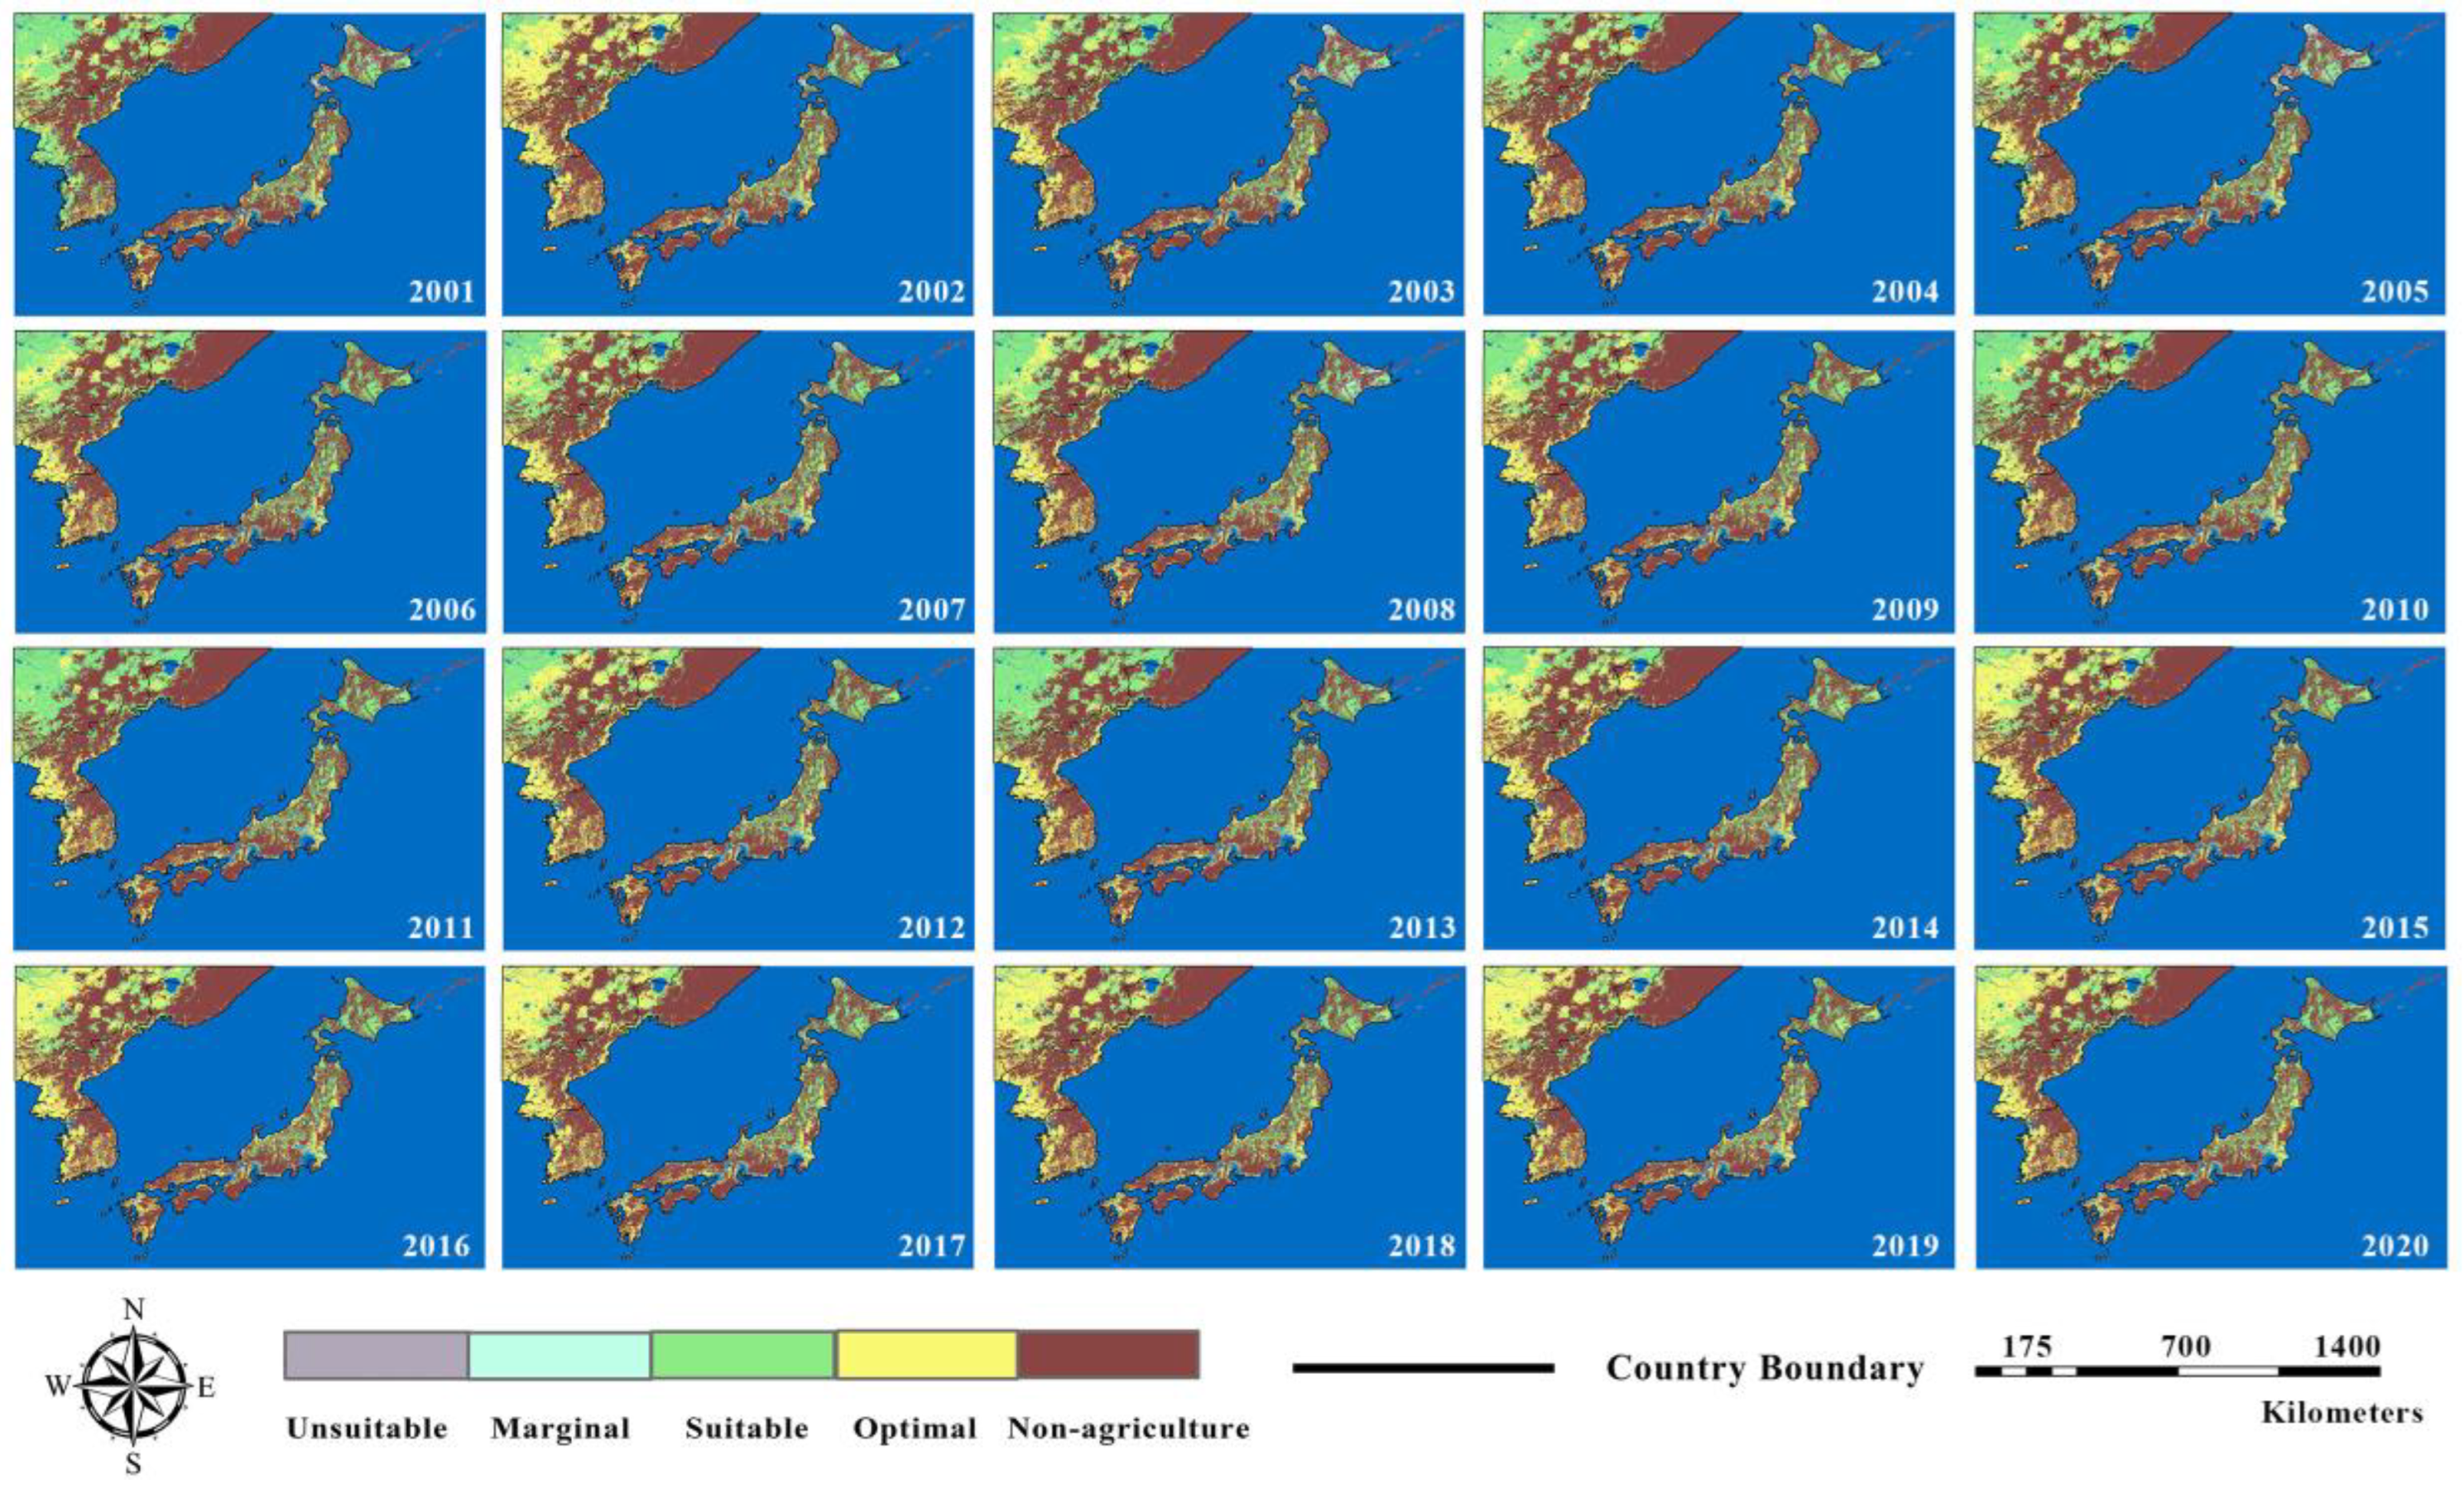
Figure 4.
Bio-geophysical suitability maps of East Asia from 2001 to 2020 in summer.
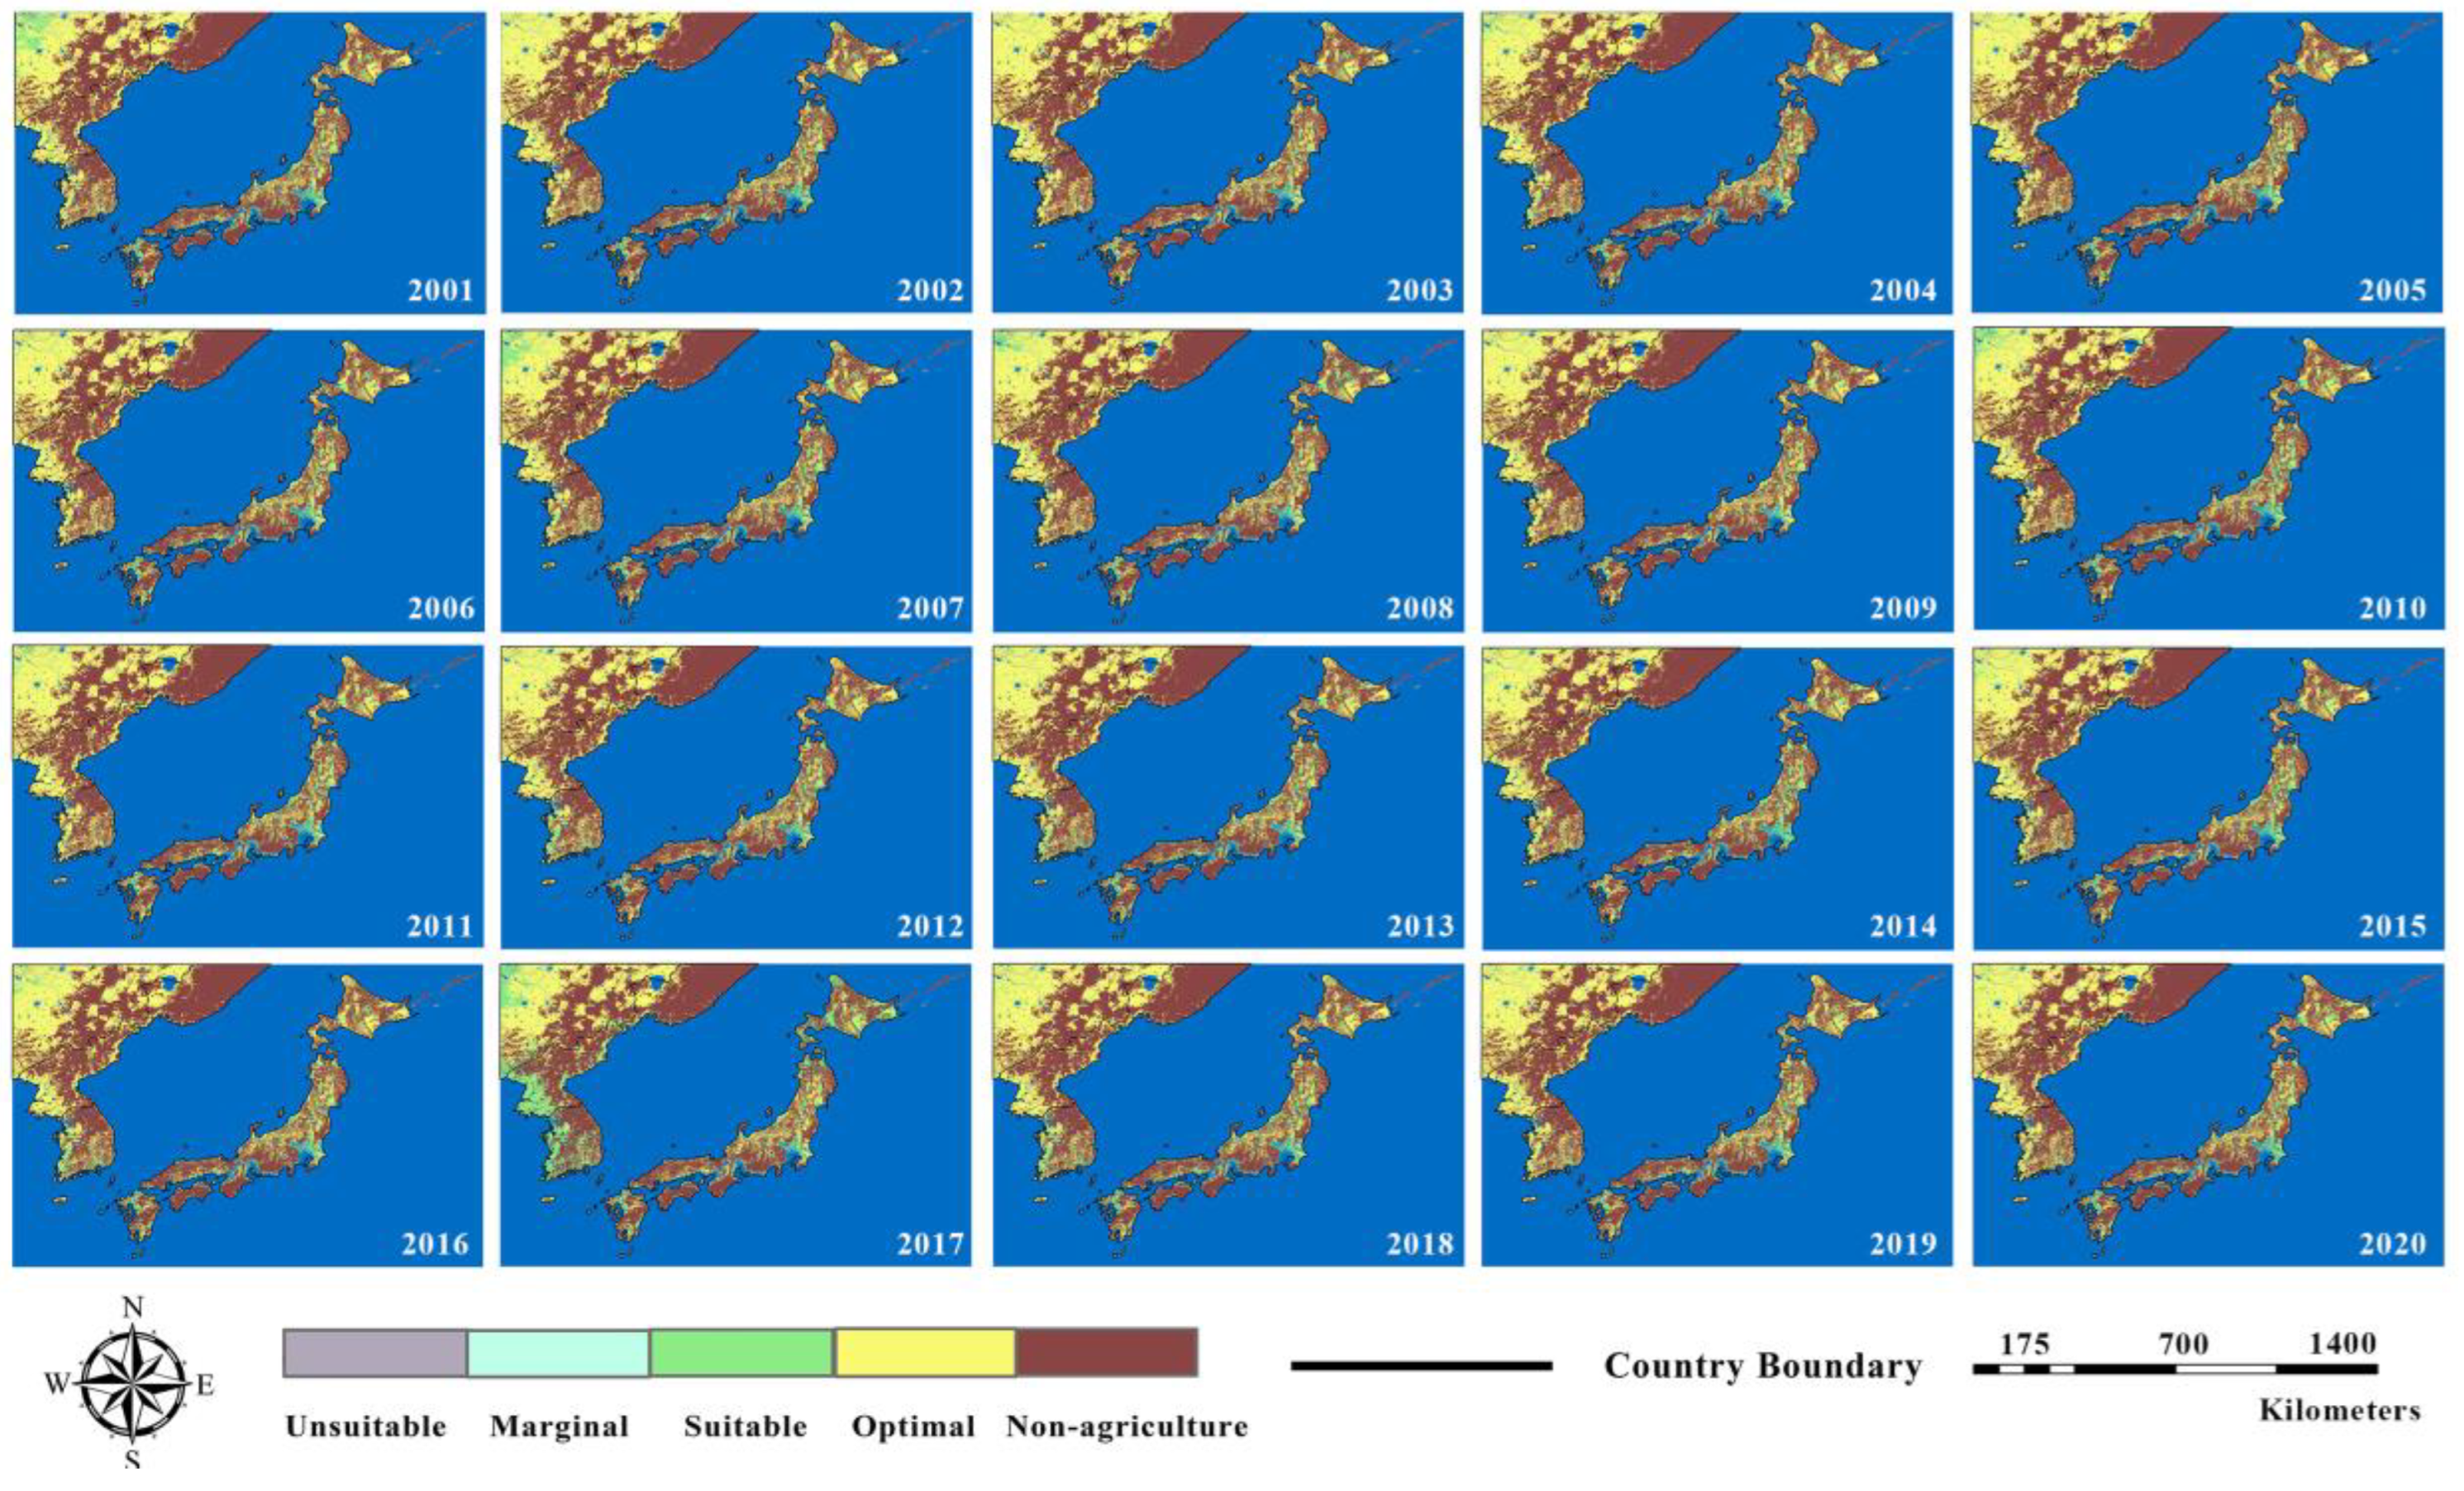
Figure 5.
Bio-geophysical suitability maps of East Asia from 2001 to 2020 in autumn.
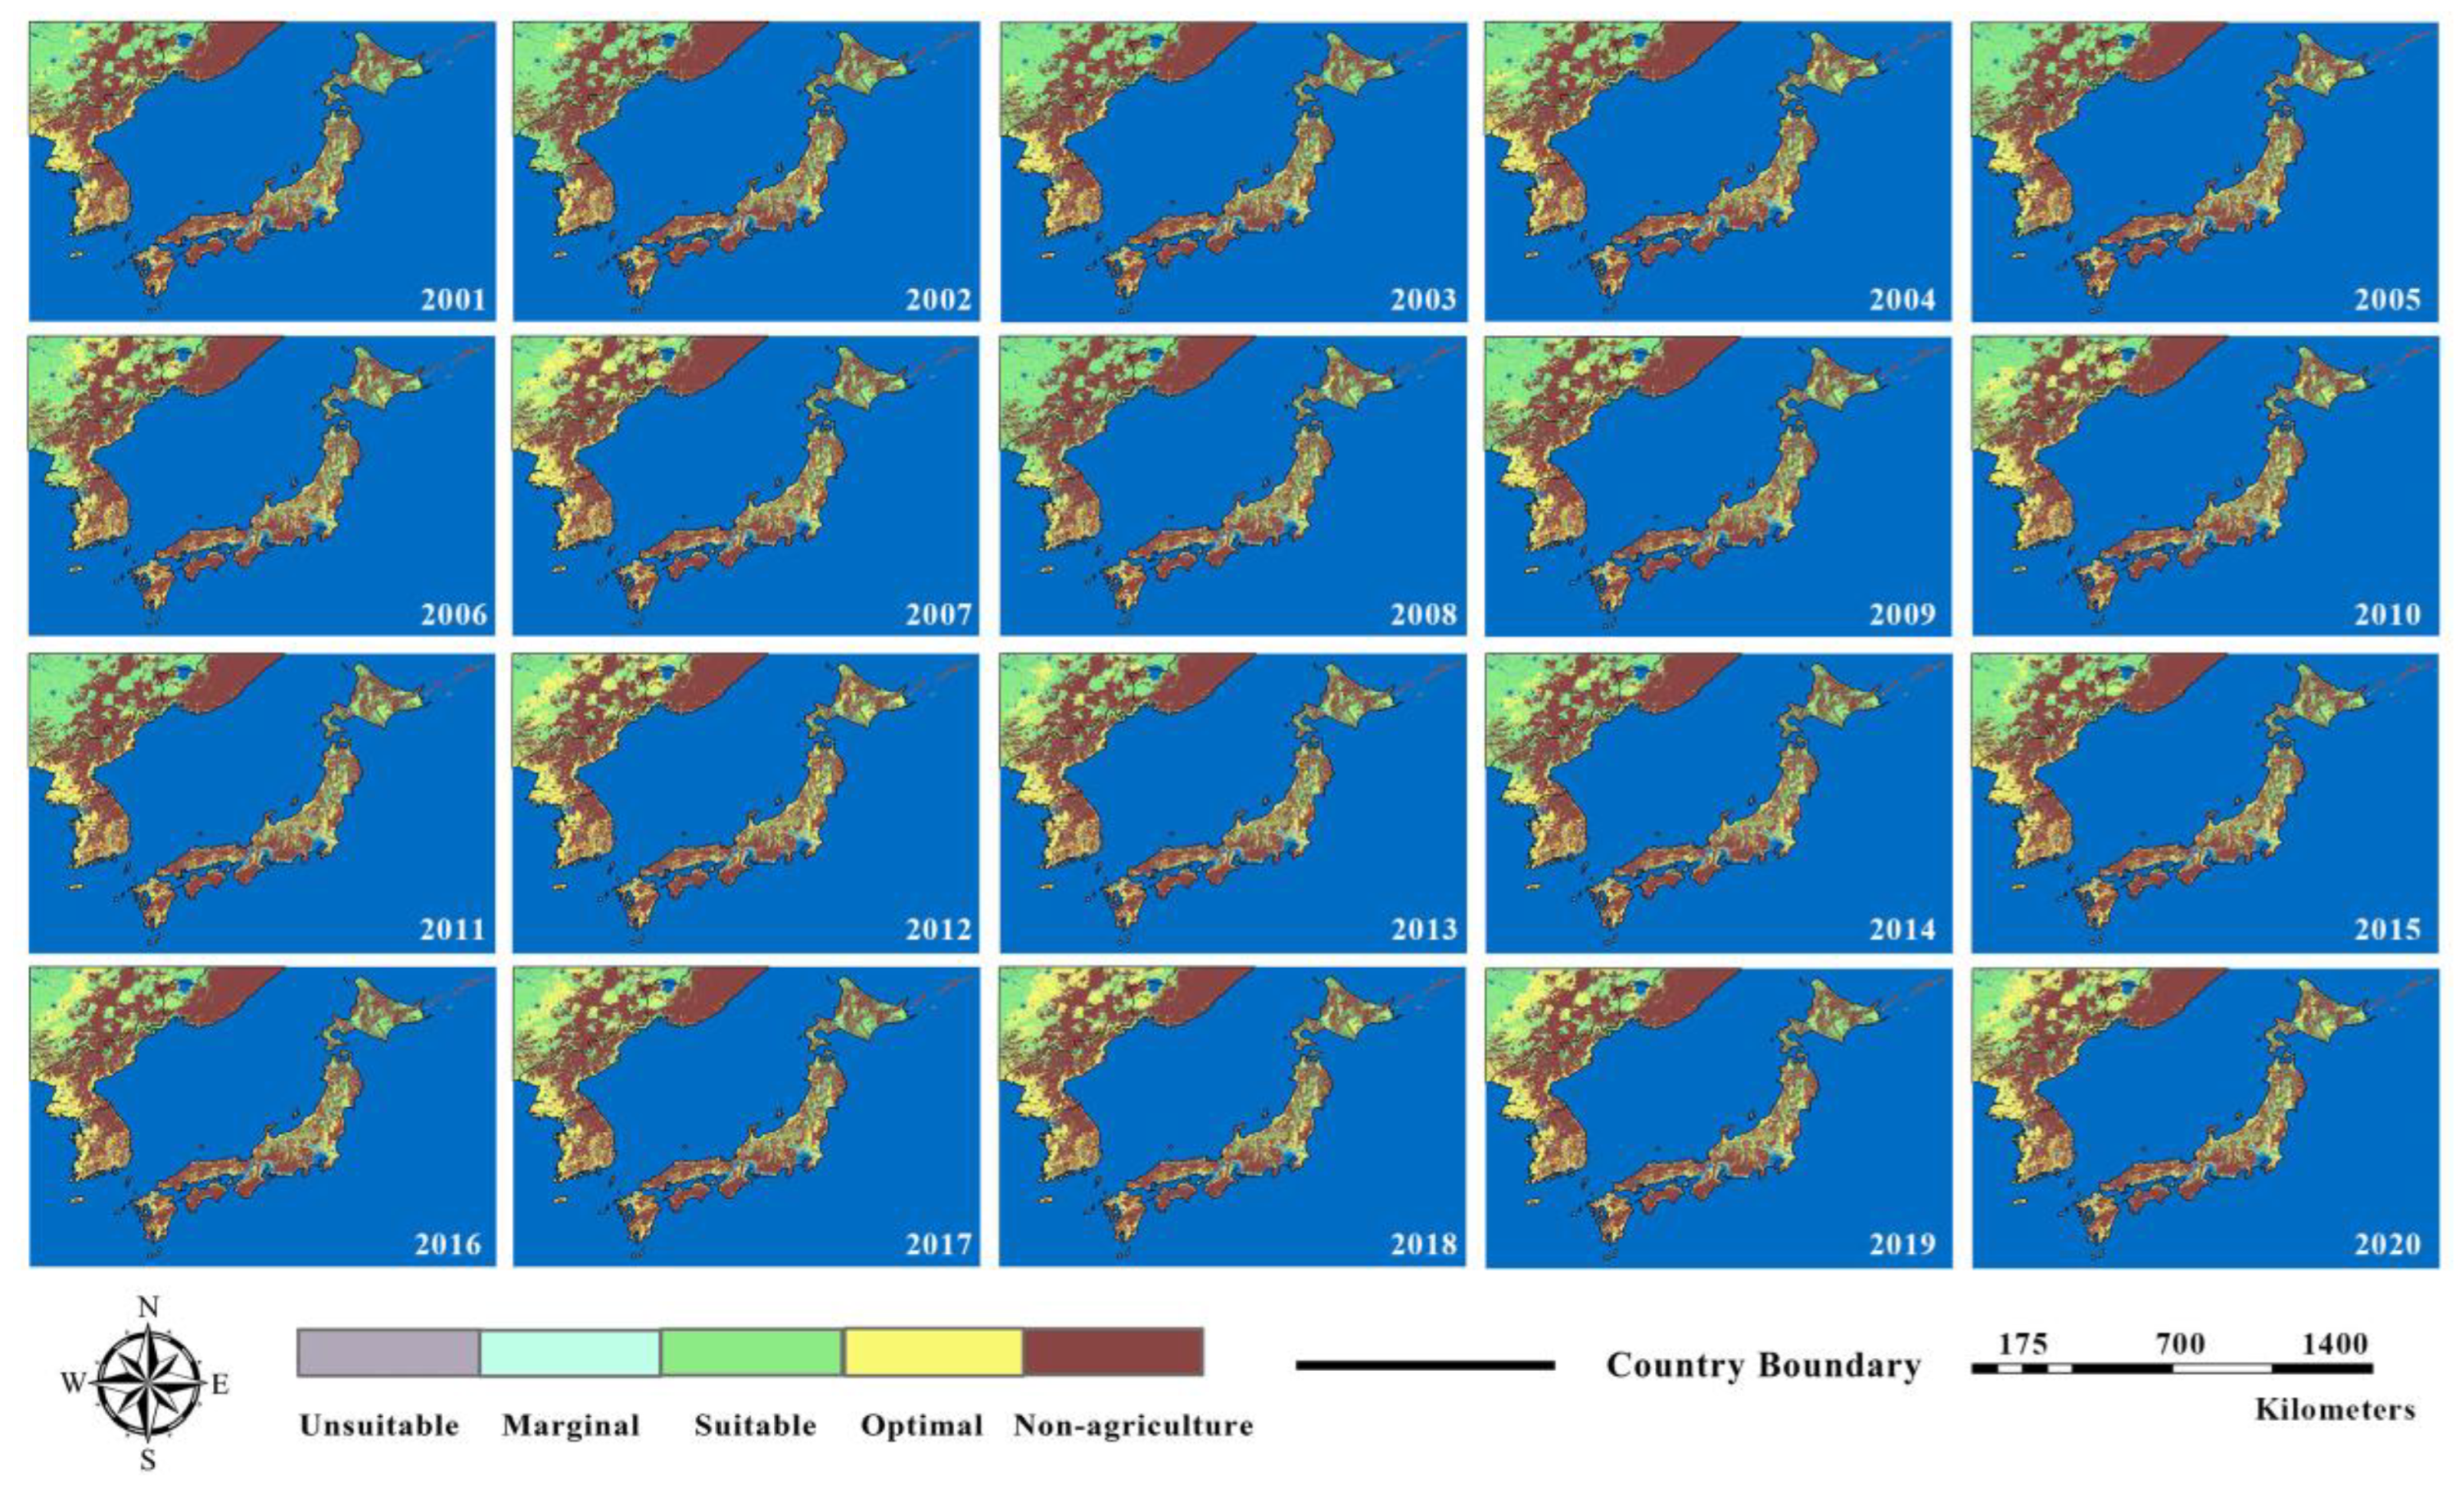
Figure 6.
Bio-geophysical suitability maps of East Asia from 2001 to 2020 in winter.
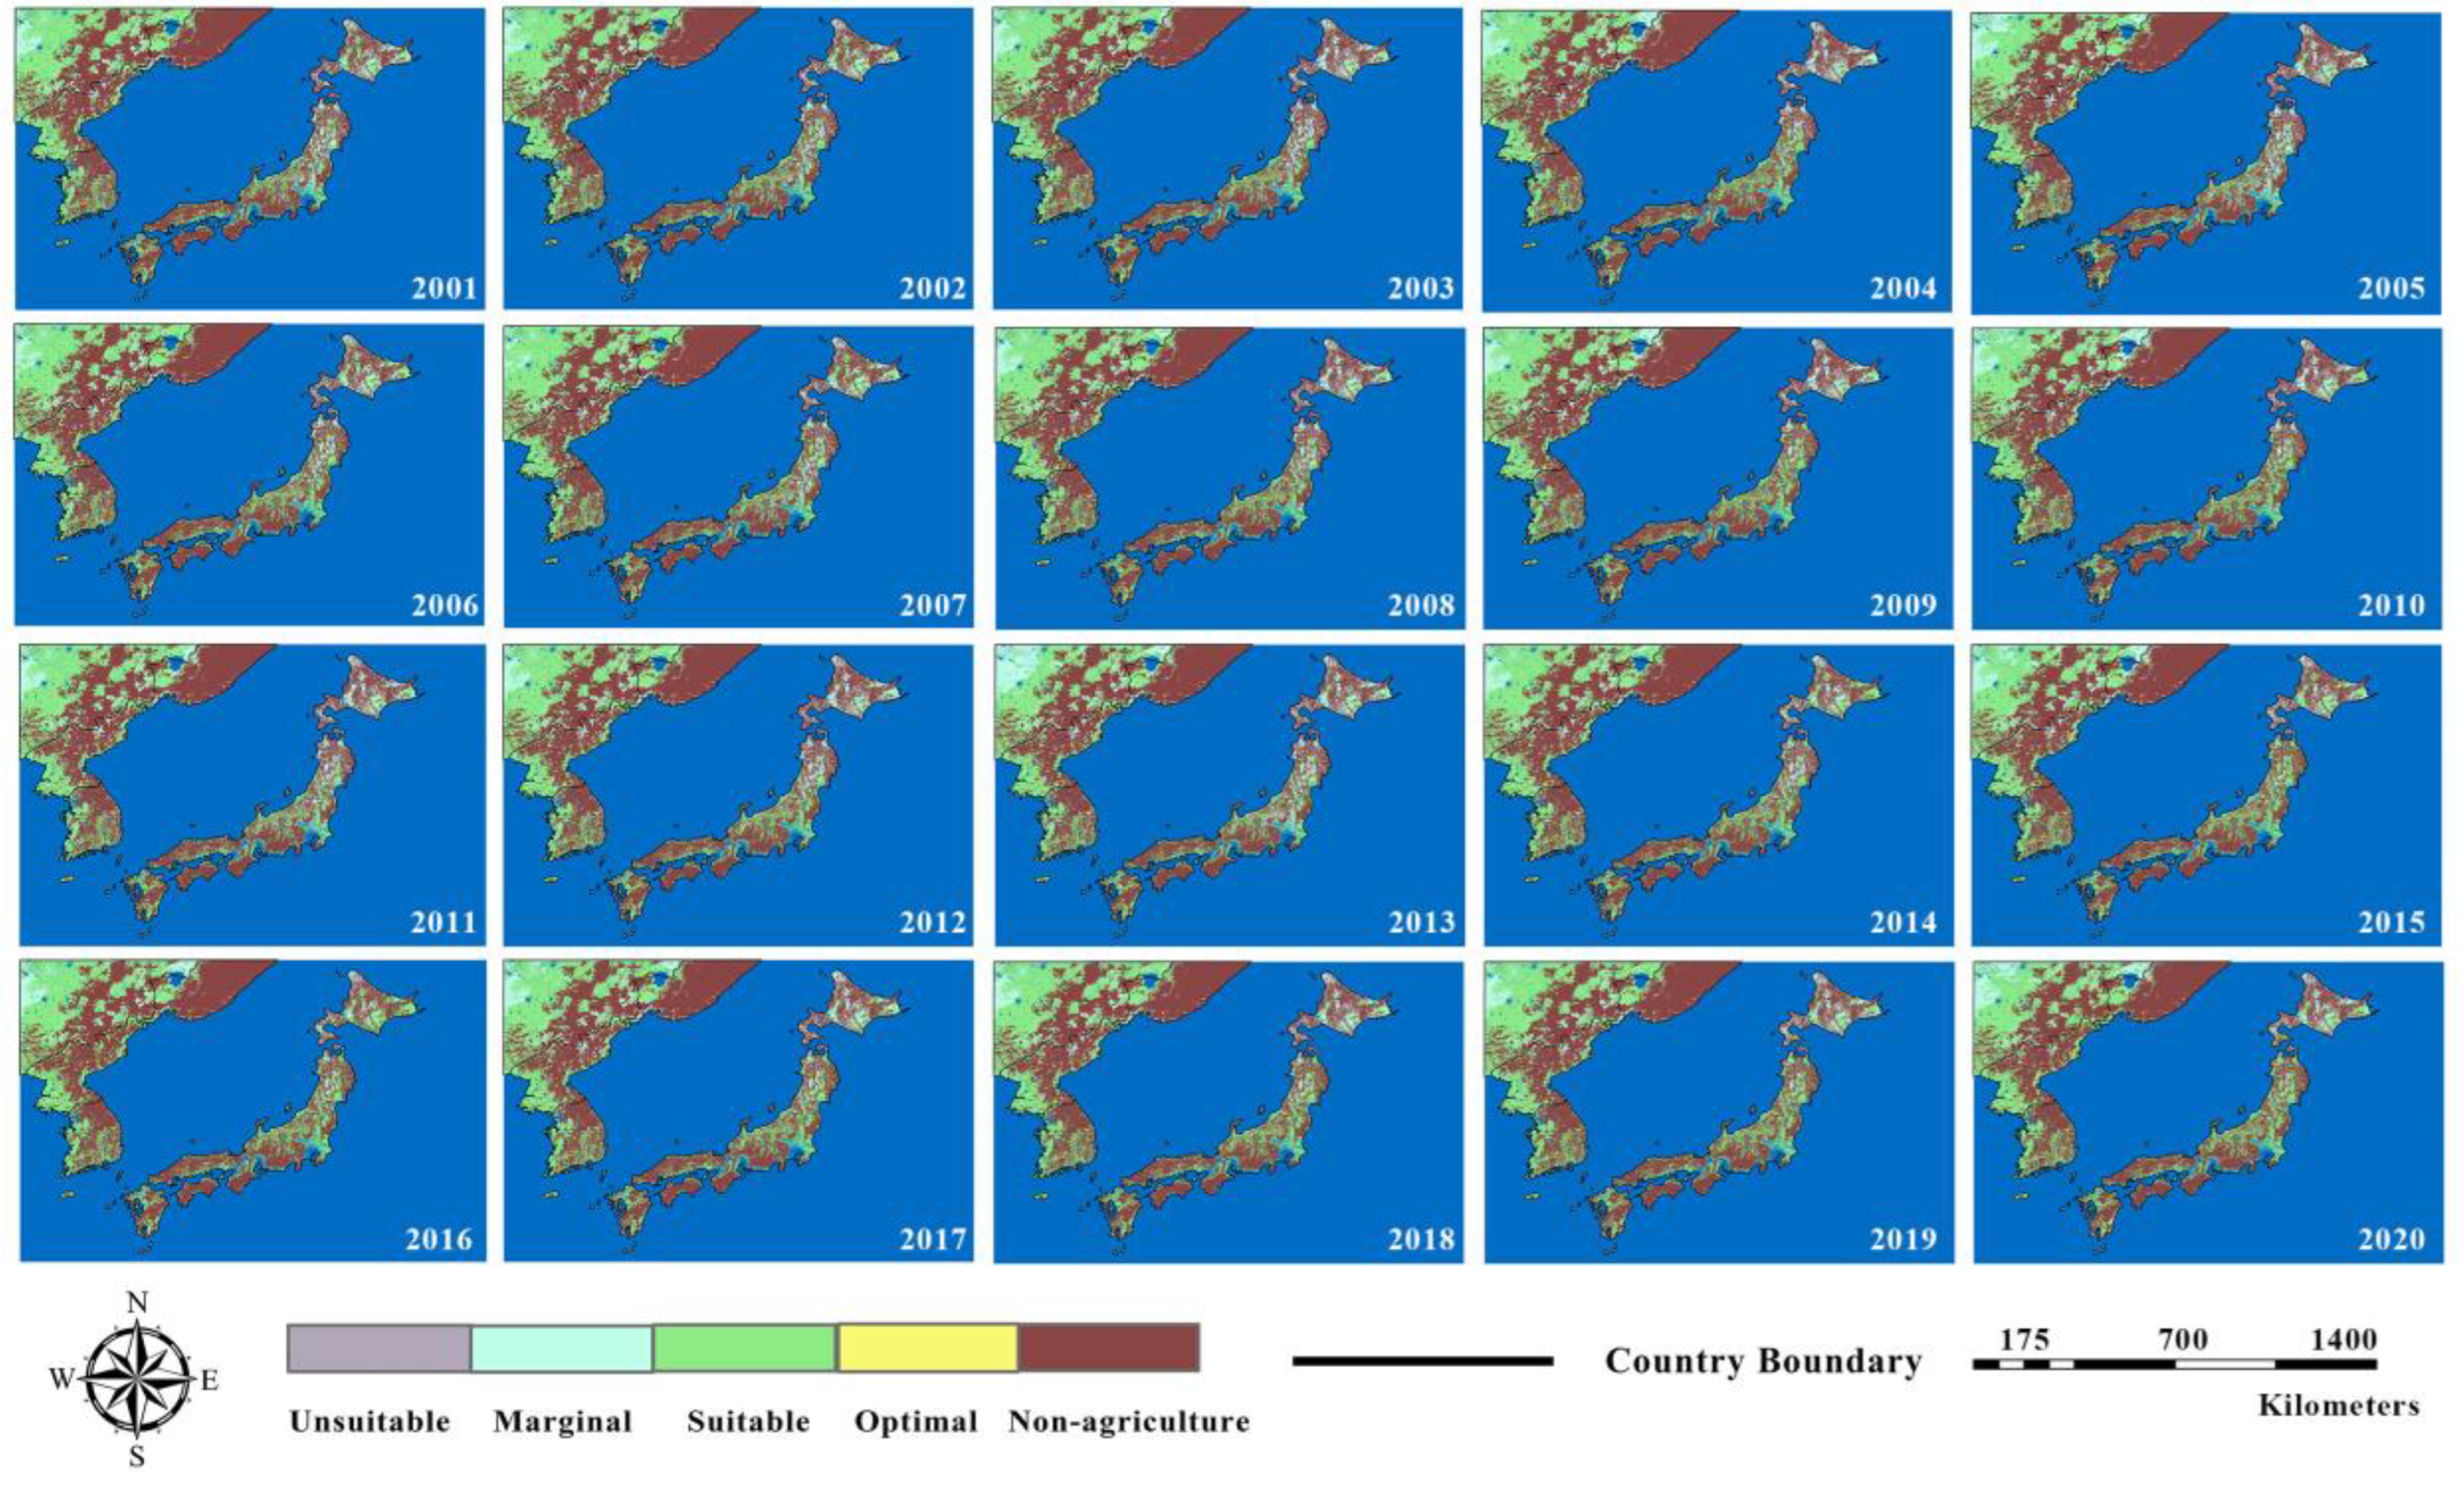
Figure 7.
Land area proportions of different suitability levels of (a) East Asia in spring, (b) East Asia in summer, (c) East Asia in autumn, (d) East Asia in winter, (e) Japan in spring, (f) Japan in summer, (g) Japan in autumn, (h) Japan in winter, (i) Northeast China in spring, (j) Northeast China in summer, (k) Northeast China in autumn, (l) Northeast China in winter, (m) South Korea in spring, (n) South Korea in summer, (o) South Korea in autumn, (p) South Korea in winter, (q) North Korea in spring, (r) North Korea in summer, (s) North Korea in autumn, and (t) North Korea in winter.
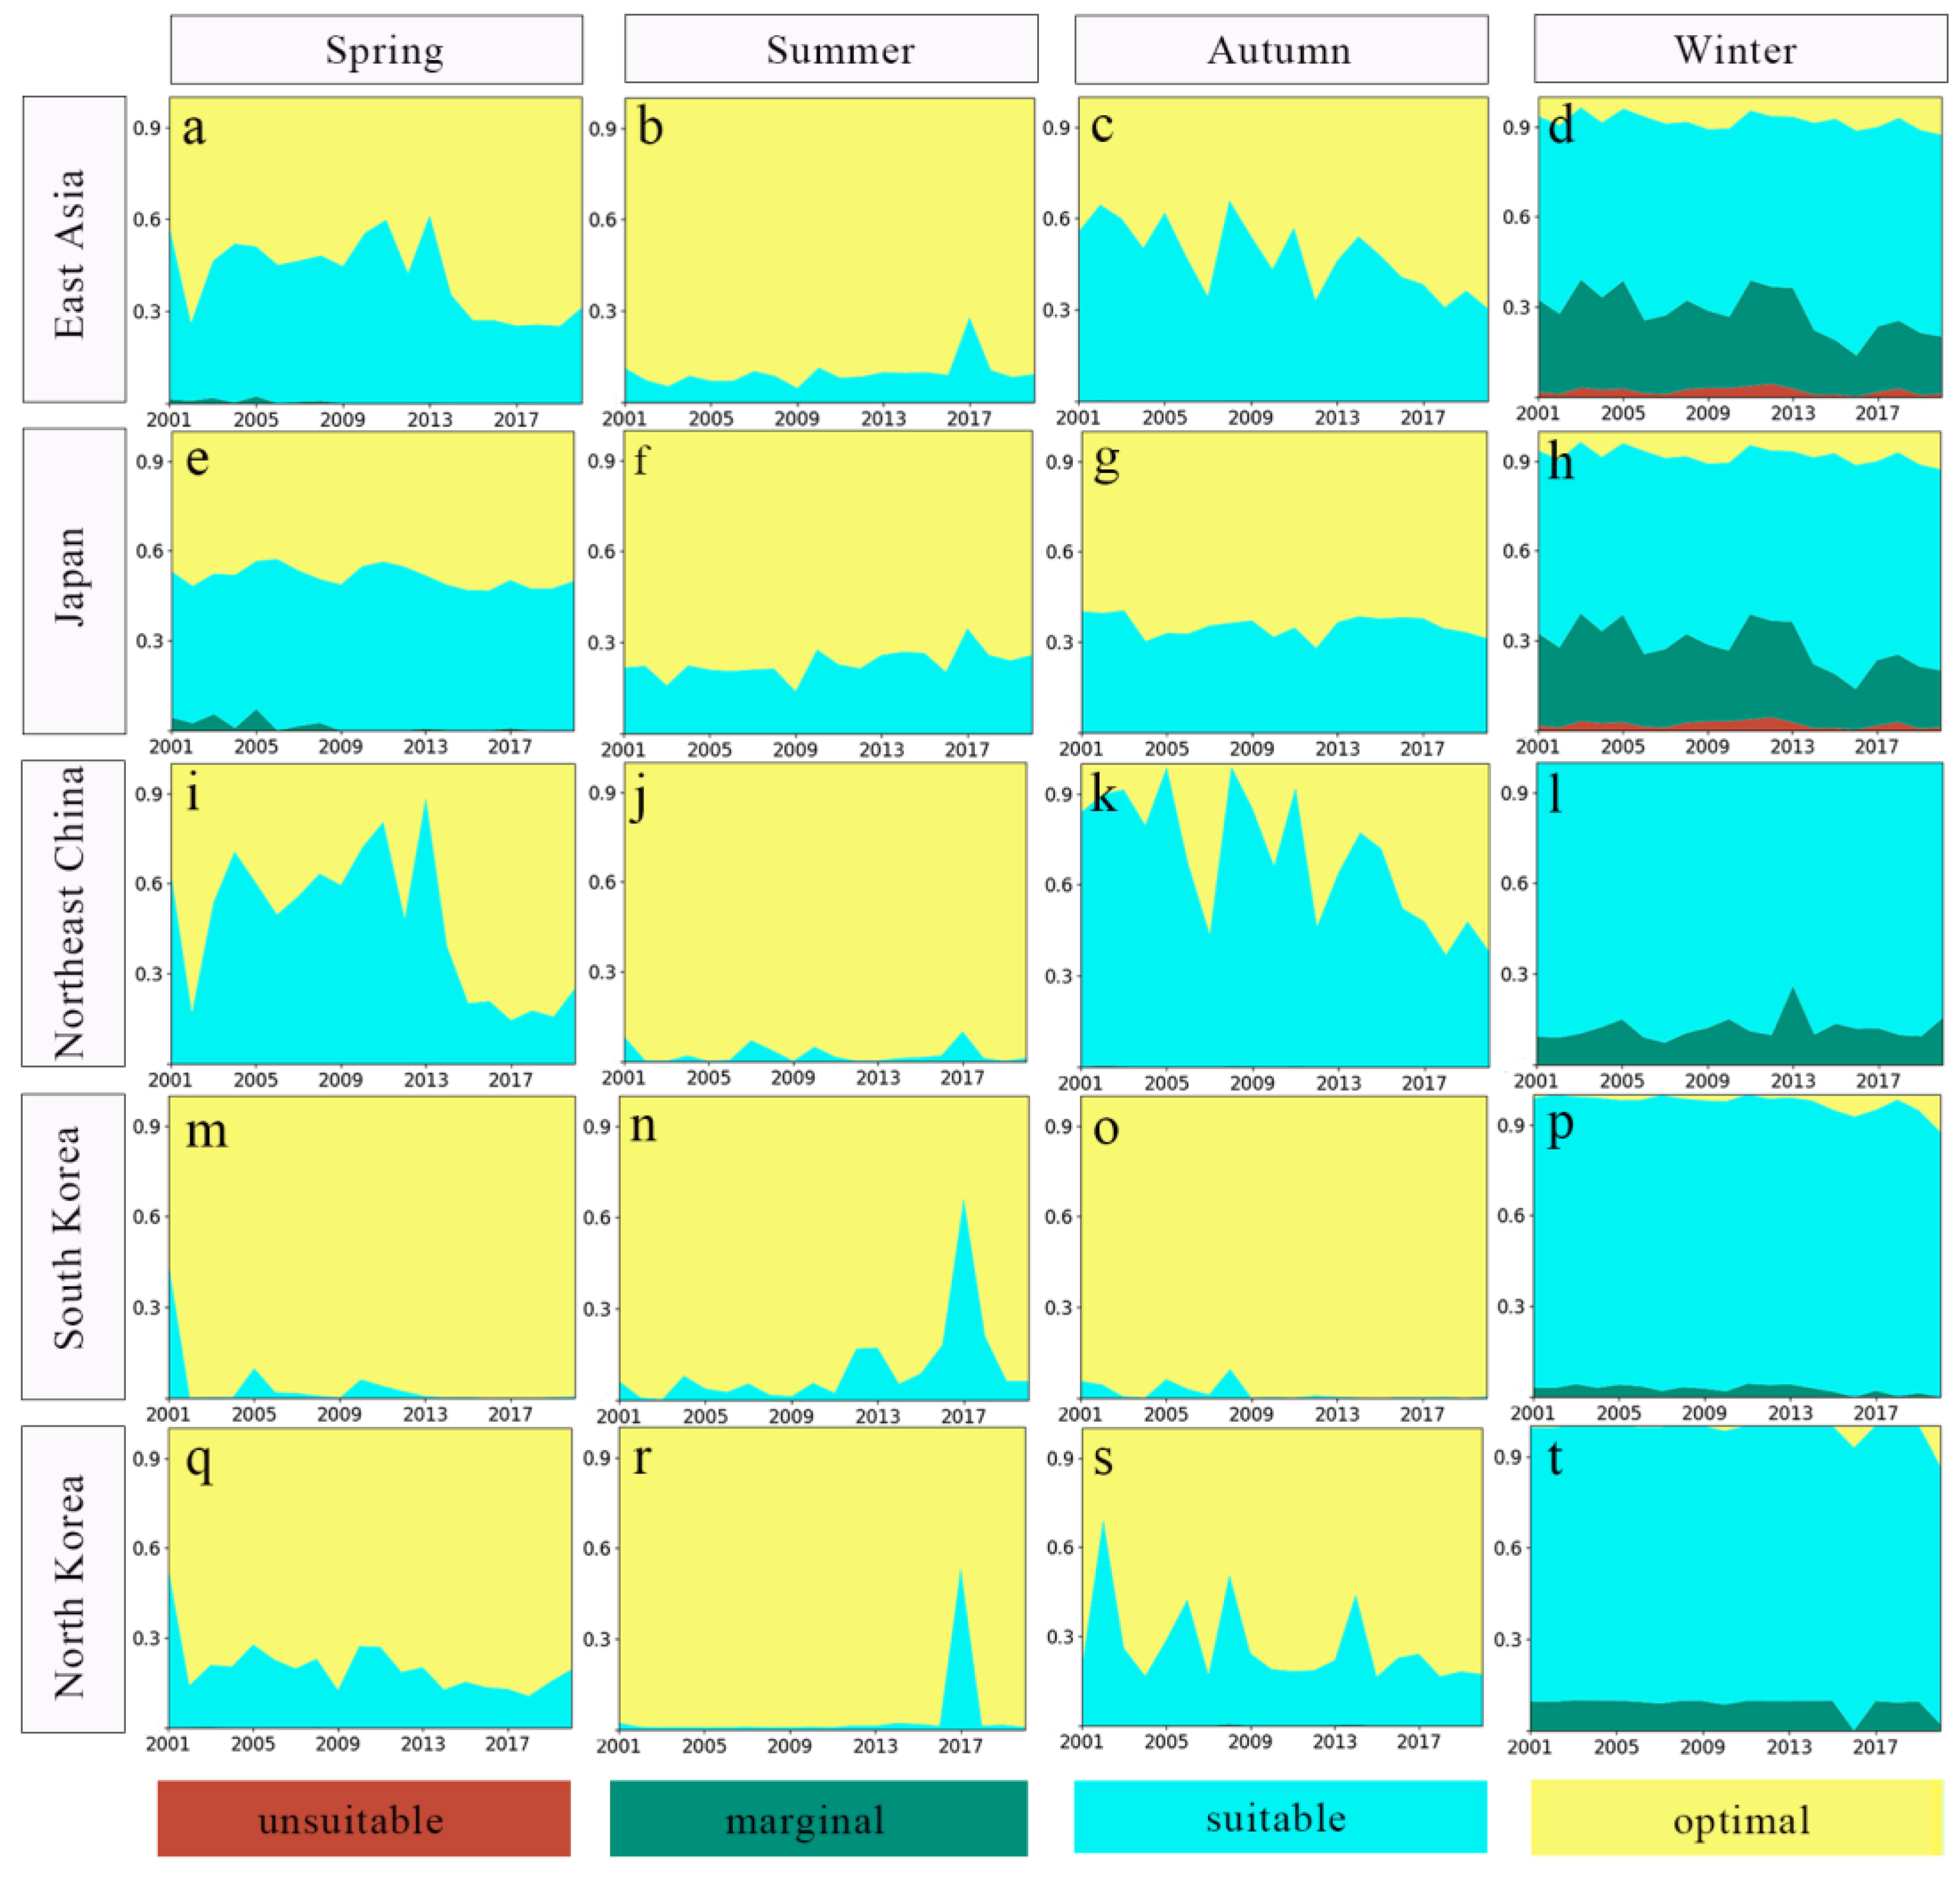
Figure 8.
Time-series suitability comparisons with NDVI of (a) Iwamizawa, (b) Shenyang, (c) Taehongdan.
Figure 8.
Time-series suitability comparisons with NDVI of (a) Iwamizawa, (b) Shenyang, (c) Taehongdan.
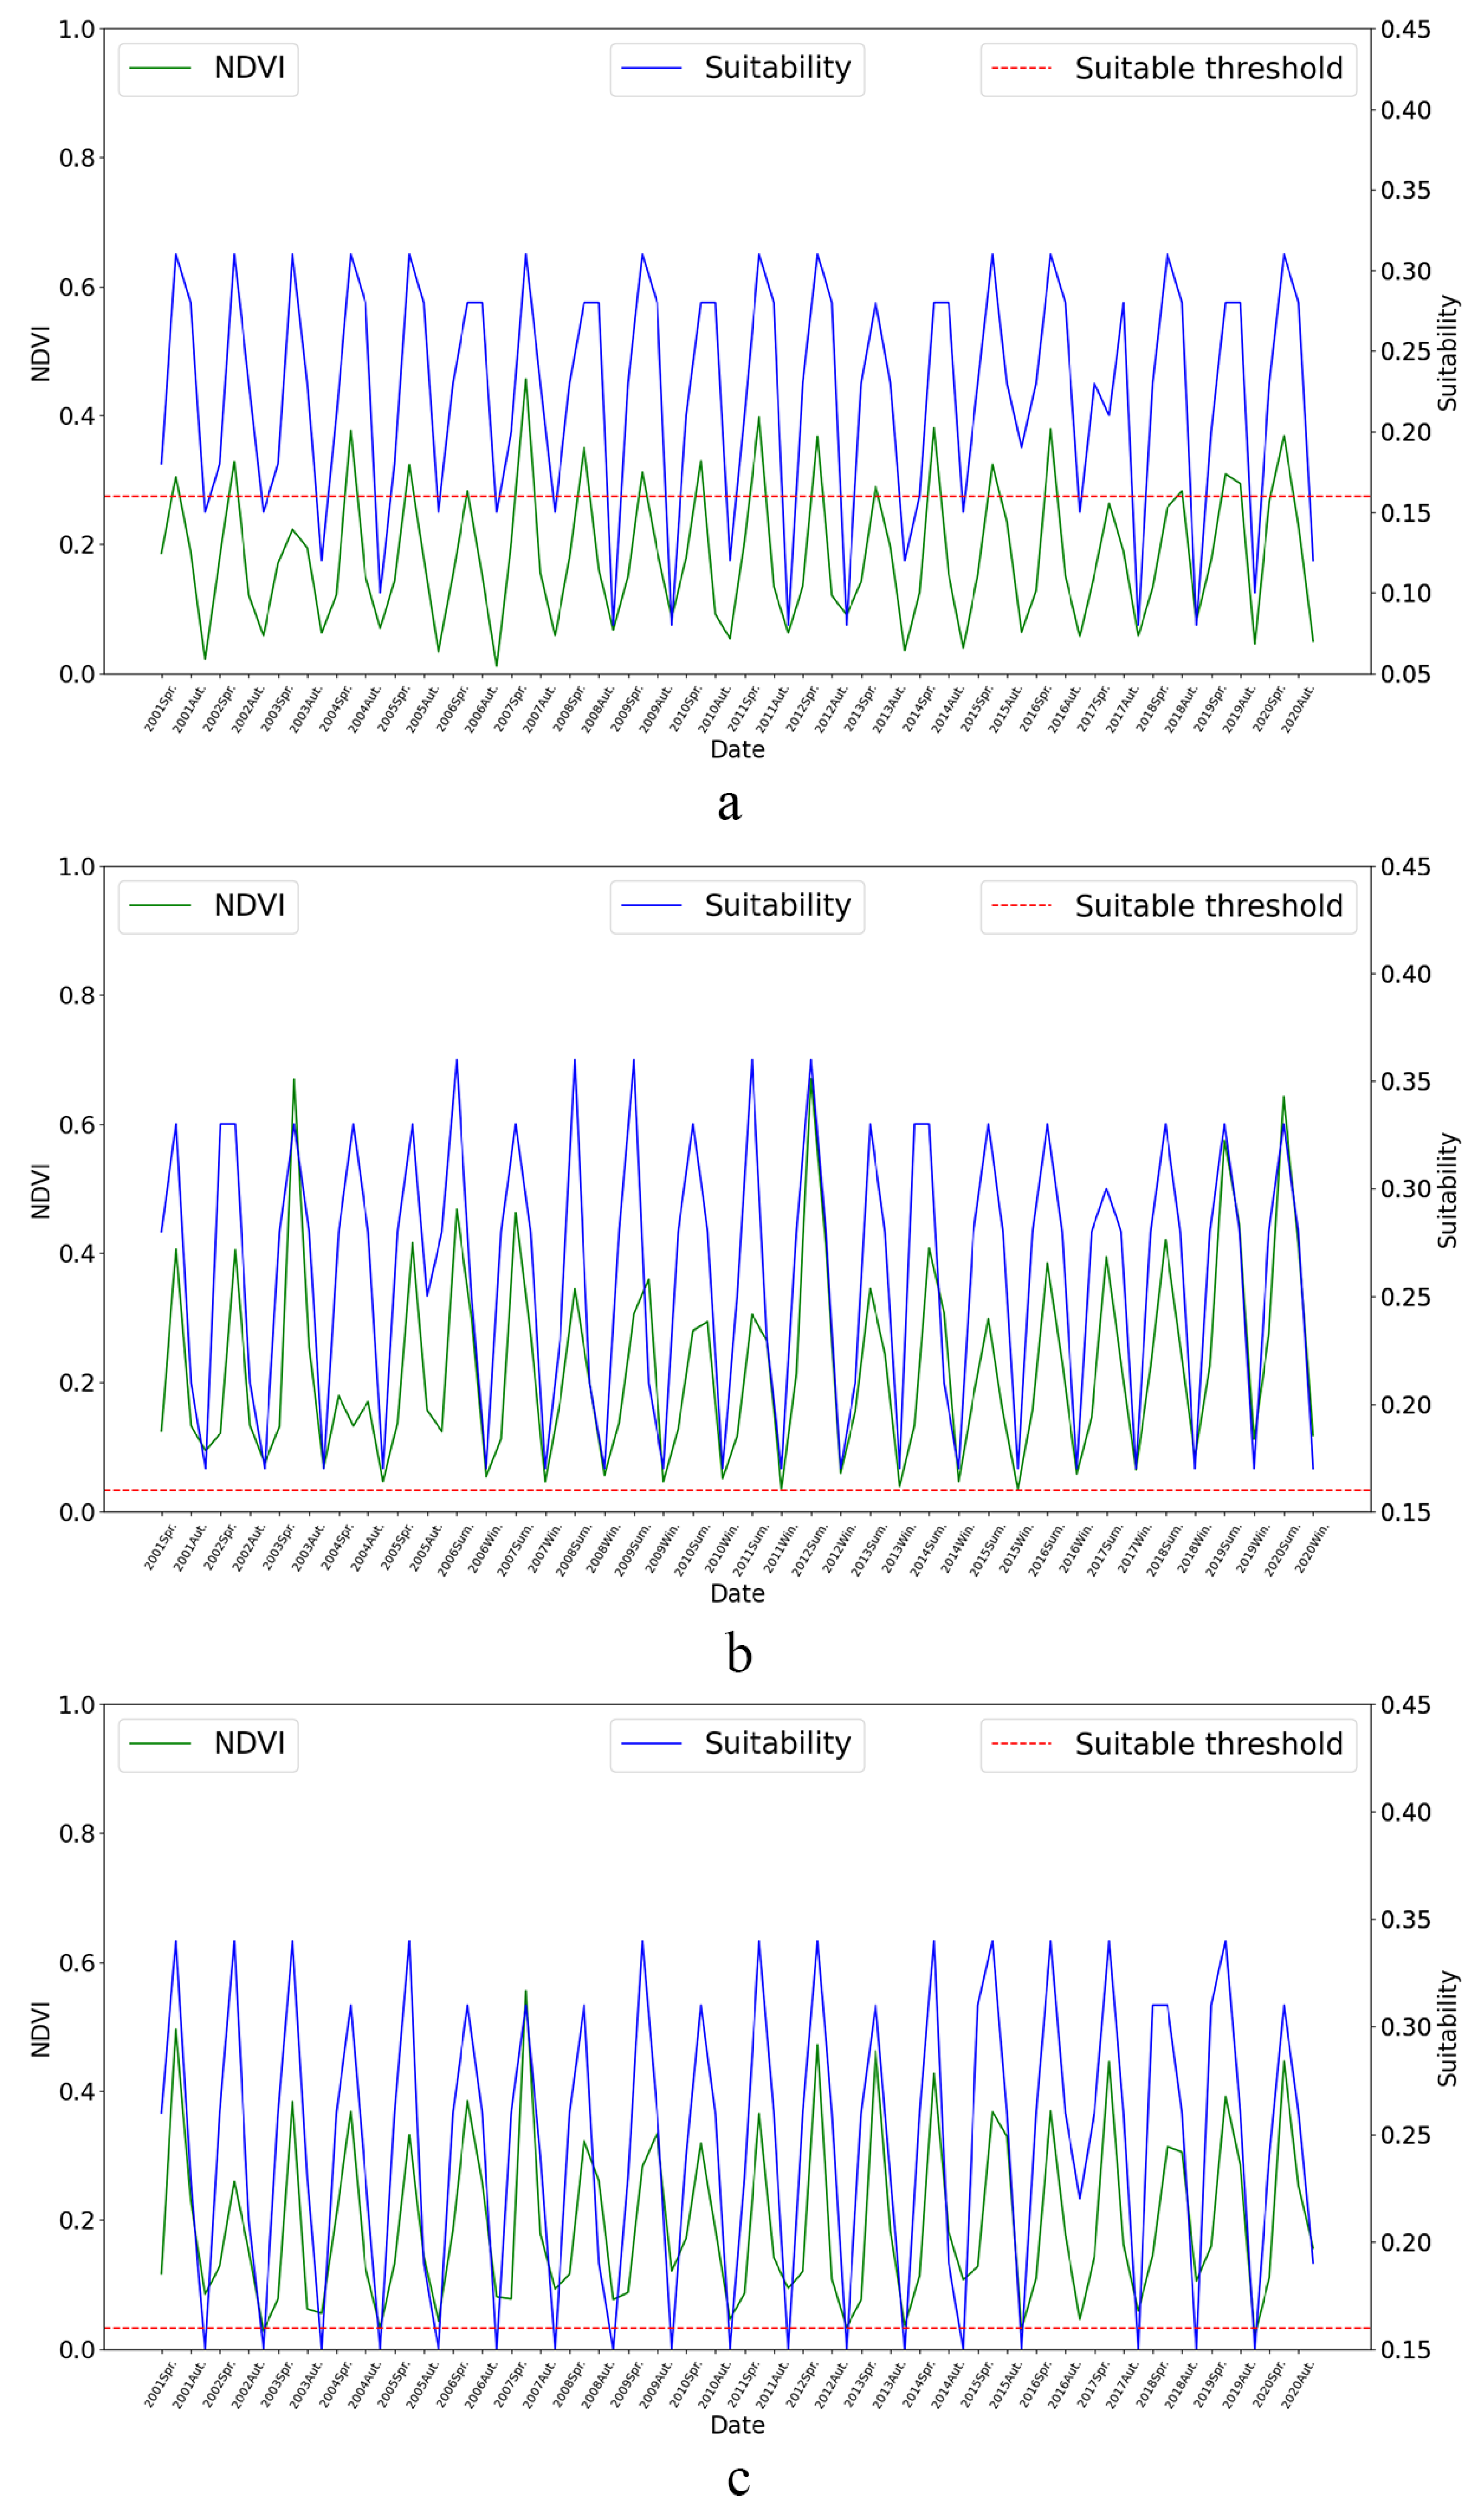
Figure 9.
Time-series suitability comparisons with NDVI of (a) Taketa, (b) Haenam, (c) Harbin.
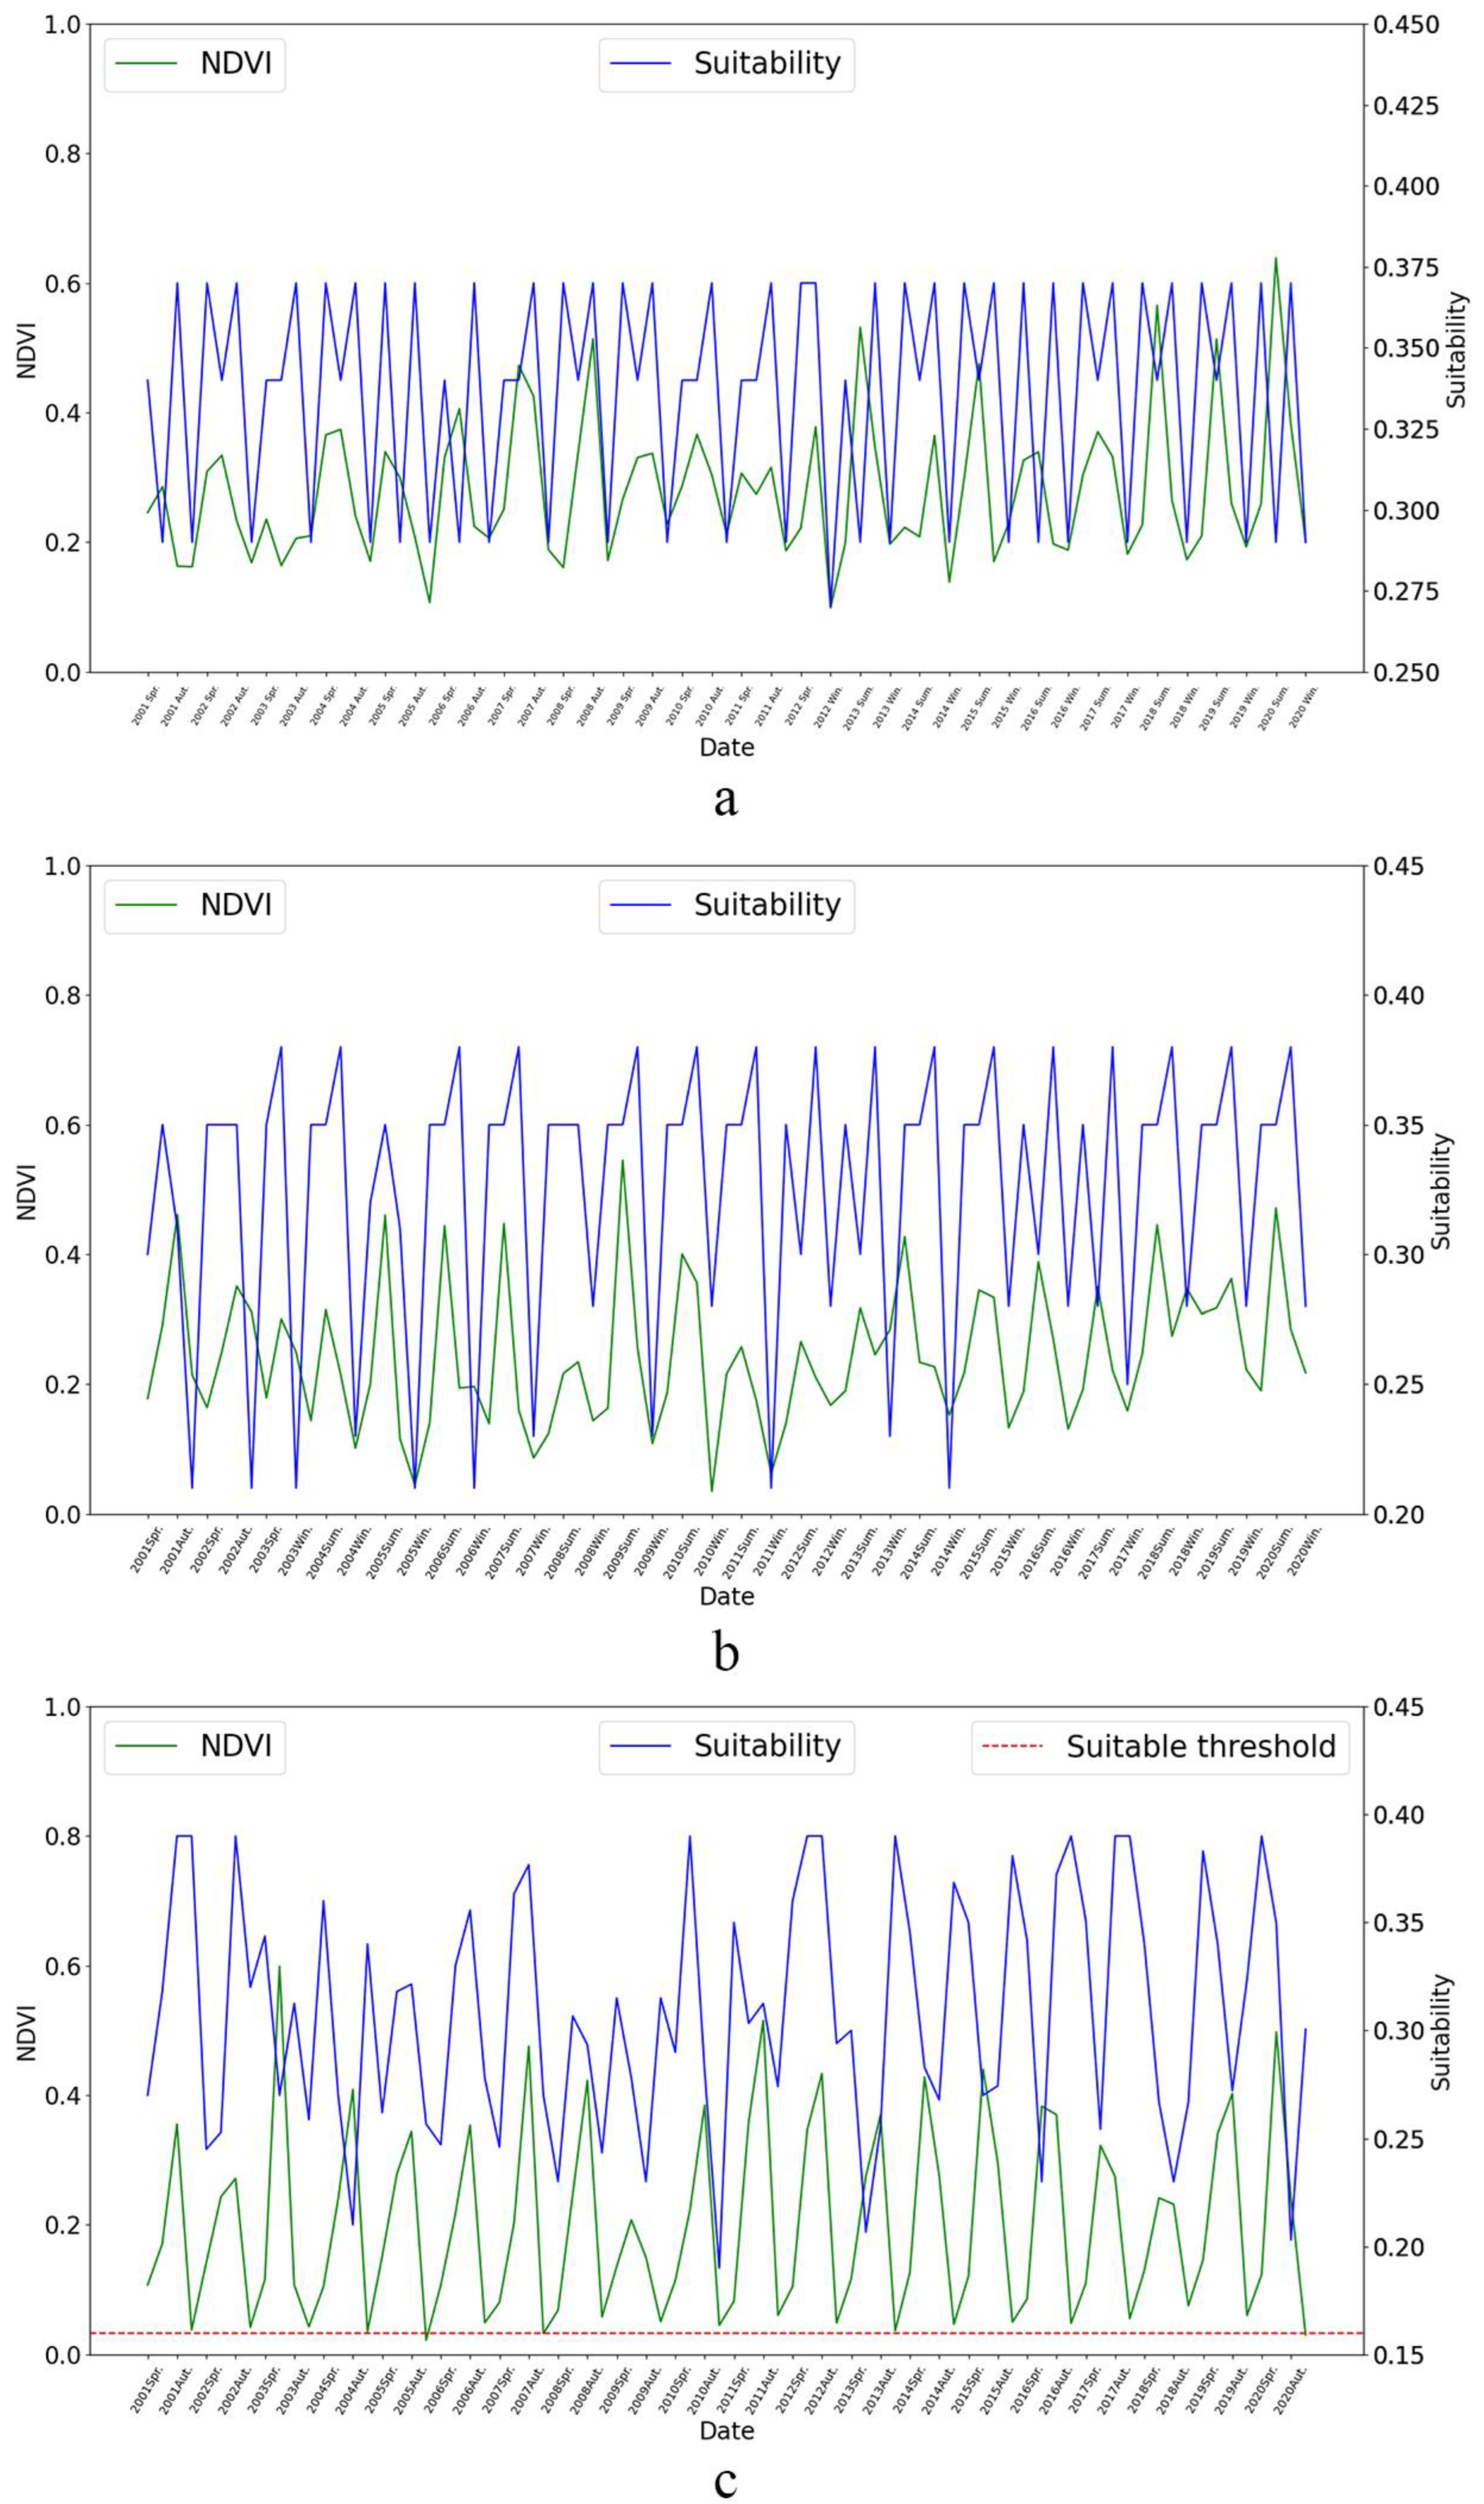
Figure 10.
Validations of suitability with NDVI from (a) Iwamizawa, (b) Shinotsu, (c) Kawakami, (d) Naganohara, (e) Kirishima, (f) Taketa, (g) Harbin, (h) Changchun, (i) Shenyang, (j) Yanbian, (k) Gochang, (l) Goesan, (m) Haenam, (n) Muan, (o) kyongwon, (p) Orang, (q) Pyongyangsong, and (r) Taehongdan.
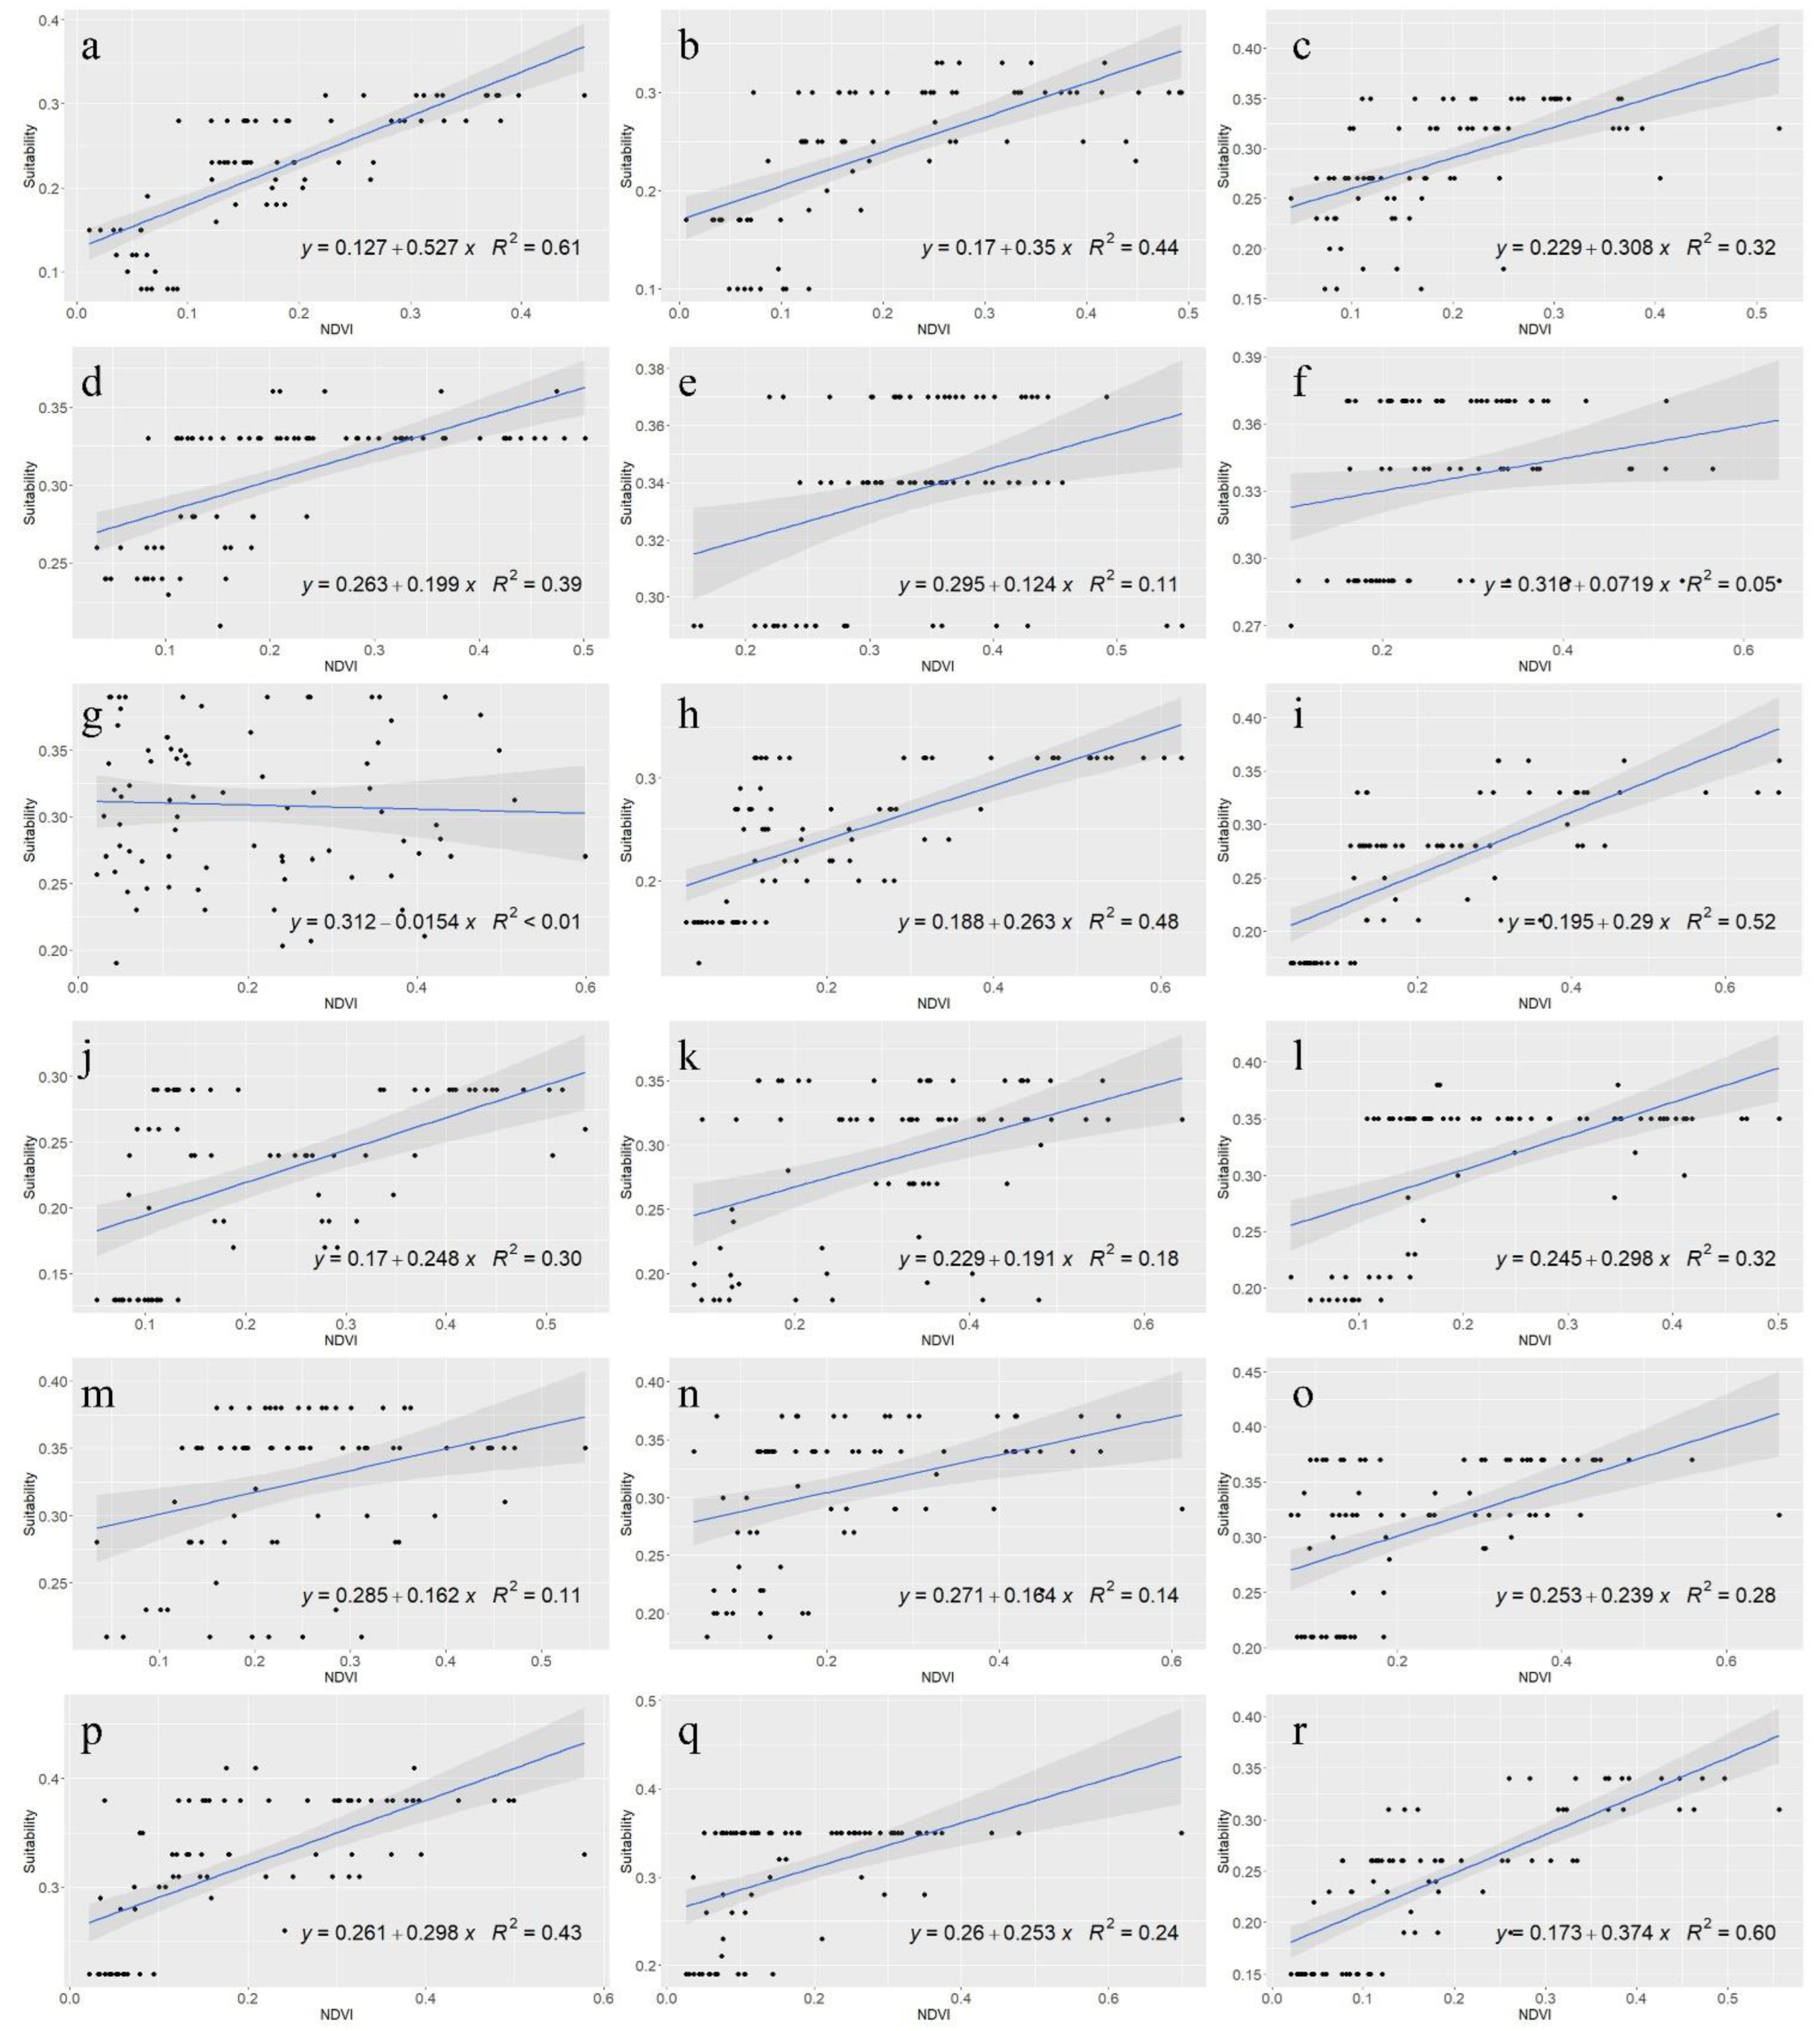
Figure 11.
The responses of production to suitability: (a) Kawakami, (b) Minamimaki (2005–2016).
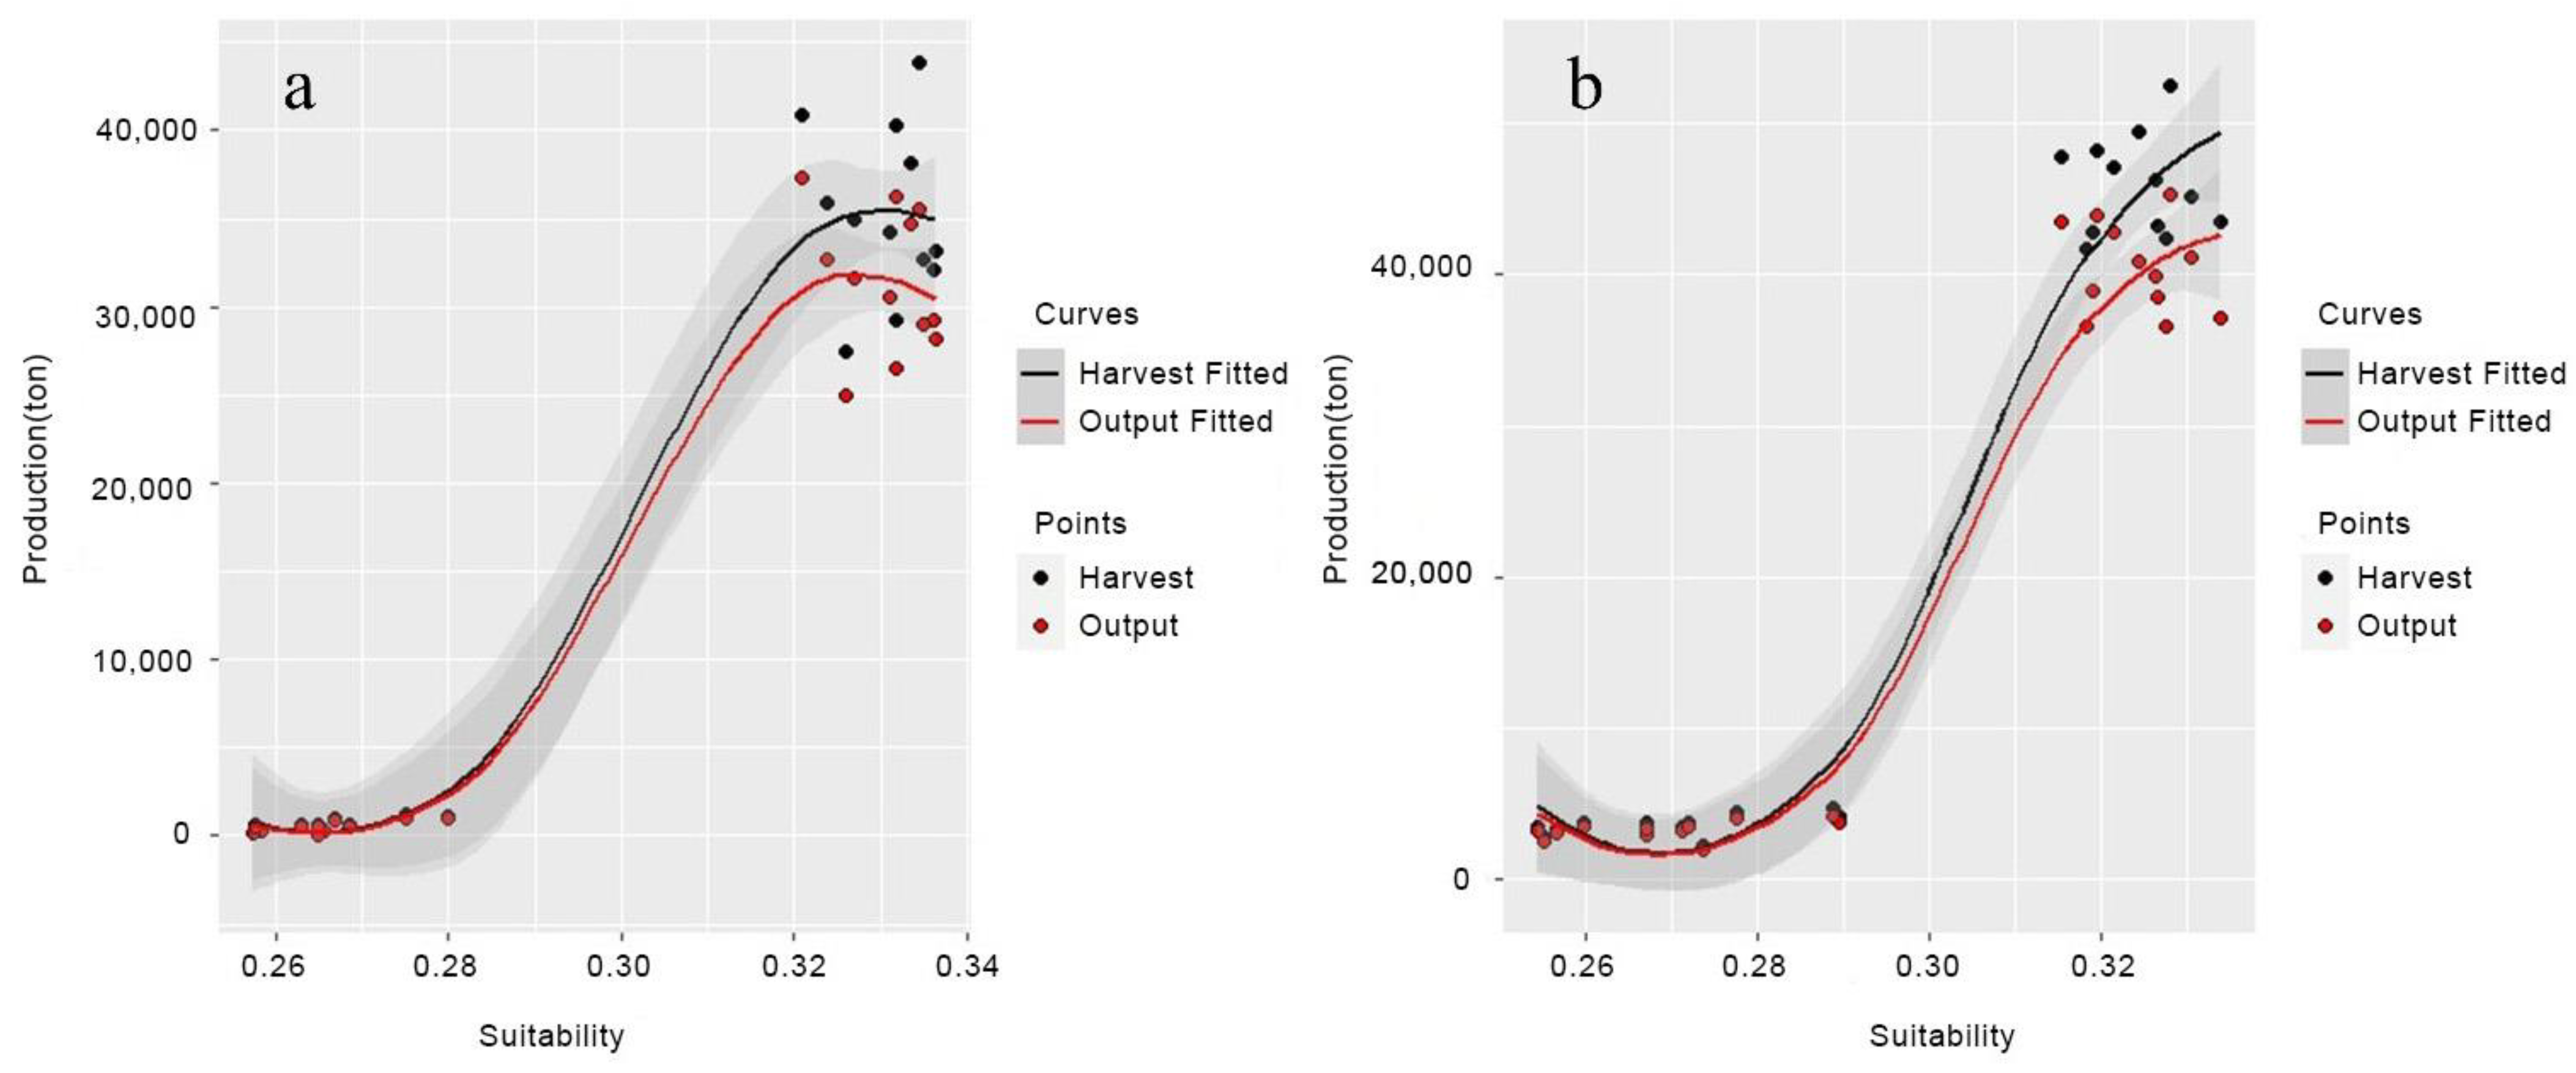
Figure 12.
Monthly suitability comparison analysis (a) within Japan in 2020 and (b) within East Asia in 2020.
Figure 12.
Monthly suitability comparison analysis (a) within Japan in 2020 and (b) within East Asia in 2020.


Table 1.
Details of input datasets.
| Data | Source | Product | Temporal Range | Temporal Resolution | Spatial Resolution |
|---|---|---|---|---|---|
| Temperature | NASA MODIS | MOD11A2 v006 | 18 February 2000 to present | 8 days | 1 km |
| Rainfall | JAXA | Near Real Time | 1 January 2000 to present | 1 h | 0.1 degree |
| PAR | NASA MODIS | MCD18A2 v006 | 18 February 2000 to present | 1 h | 1 km |
| Soil nitrogen | WoSIS | Soil Grids 250 m 2.0 | 2017 to present | 250 m | |
| Soil texture | WoSIS | Soil Grids 250 m 2.0 | 2017 to present | 250 m | |
| Soil pH | WoSIS | Soil Grids 250 m 2.0 | 2017 to present | 250 m | |
| Agricultural land extraction and water body removal | NASA MODIS | MCD12Q1.006 MODIS Land Cover Type Yearly Global 500 m | 1 January 2001 to 1 January 2020 | 8 days | 500 m |
| GFSAD1000 | Cropland Extent 1 km Multi-Study Crop Mask, Global Food-Support Analysis Data | 1 January 2010 | 1 km | ||
| Glob Cover | Global Land Cover Map | 1 January 2009 to 1 January 2010 | 3 days | 300 m | |
| USGS Landsat | Hansen Global Forest Change v1.9 | 1 January 2000 to 1 January 2021 | 8 days | 30.92 m | |
| NDVI composite | USGS | Landsat 7 Collection 1 Tier 1 8-Day NDVI Composite | 1 January 1999 to 27 December 2021 | 8 days | 30 m |
| USGS | Landsat 8 Collection 1 Tier 1 8-Day NDVI Composite | 7 April 2013 to 1 January 2022 | |||
| ESA | Sentinel-2 MSI: Multispectral Instrument, Level-2A | 28 March 2017 to present | 10 days | 10 m |
Table 2.
Results of pairwise comparison matrix over six criteria.
| Criteria | Temperature | Rainfall | PAR | Soil Nitrogen | Soil Texture | Soil pH | Weight | CR |
|---|---|---|---|---|---|---|---|---|
| Temperaure | 1 | 2 | 2 | 3 | 3 | 3 | 0.32 | 0.008 |
| Rainfall | 1/2 | 1 | 1 | 2 | 2 | 2 | 0.19 | |
| PAR | 1/2 | 1 | 1 | 2 | 2 | 2 | 0.19 | |
| Soil nitrogen | 1/3 | 1/2 | 1/2 | 1 | 1 | 1 | 0.1 | |
| Soil texture | 1/3 | 1/2 | 1/2 | 1 | 1 | 1 | 0.1 | |
| Soil pH | 1/3 | 1/2 | 1/2 | 1 | 1 | 1 | 0.1 |
= 6.2539, n = 6. Consistency index (CI) = 0.0508. Random index (RI) = 1.24. Consistency ratio (CR) = 0.041.
Table 3.
Weights of all criteria for agricultural lands in the study area.
| Criteria | Sub-Criteria | Weight | CR | |
|---|---|---|---|---|
| Temperature (°C) | 15–20 | 0.41 | 0.008 | 0.1312 |
| 10–15, 20–25 | 0.31 | 0.0992 | ||
| 5–10, 25–30 | 0.16 | 0.0512 | ||
| 0–5, 30–35 | 0.08 | 0.0256 | ||
| <0 and >35 | 0.04 | 0.0128 | ||
| Rainfall (mm) | >100 (* >50) | 0.41 | 0.029 | 0.0779 |
| 80–100 (* 40–50) | 0.26 | 0.0494 | ||
| 70–80 (* 35–40) | 0.16 | 0.0304 | ||
| 60–70 (* 30–35) | 0.11 | 0.0209 | ||
| <60 (* <30) | 0.06 | 0.0114 | ||
| sPAR (W/) | >197.5 | 0.46 | 0.070 | 0.0874 |
| 118–197.5 | 0.27 | 0.0513 | ||
| 7.9–118 | 0.14 | 0.0266 | ||
| 3.95–7.9 | 0.09 | 0.0171 | ||
| <3.95 | 0.04 | 0.0076 | ||
| Soil nitrogen (g) | 180–260 | 0.41 | 0.076 | 0.041 |
| 140–180, 260–300 | 0.31 | 0.031 | ||
| 100–140, 300–340 | 0.16 | 0.016 | ||
| 60–100, 340–380 | 0.08 | 0.008 | ||
| <60, >380 | 0.04 | 0.004 | ||
| Soil texture | Loam | 0.48 | 0.022 | 0.05 |
| Sandy clay, silty clay, silt | 0.27 | 0.027 | ||
| Sandy clay loam, silty clay loam, clay loam | 0.17 | 0.017 | ||
| Loamy sand, sandy loam, silty loam, sil loam, sand | 0.08 | 0.008 | ||
| Soil pH | 6.5–7.0 | 0.49 | 0.086 | 0.05 |
| 6.0–6.5, 7–7.5 | 0.26 | 0.026 | ||
| 5.5–6.0, 7.5–8.0 | 0.14 | 0.014 | ||
| 5.0–5.5, 8.0–8.5 | 0.07 | 0.007 | ||
| <5.0, >8.5 | 0.04 | 0.004 |
*: indicates the sub-criteria for monthly analysis.
Table 4.
Categorization of bio-geophysical suitability.
| Categorization | Intervals |
|---|---|
| Optimal | 0.29–0.44 |
| Suitable | 0.16–0.29 |
| Marginal | 0.08–0.16 |
| Unsuitable | 0.03–0.08 |
Disclaimer/Publisher’s Note: The statements, opinions and data contained in all publications are solely those of the individual author(s) and contributor(s) and not of MDPI and/or the editor(s). MDPI and/or the editor(s) disclaim responsibility for any injury to people or property resulting from any ideas, methods, instructions or products referred to in the content. |
© 2023 by the authors. Licensee MDPI, Basel, Switzerland. This article is an open access article distributed under the terms and conditions of the Creative Commons Attribution (CC BY) license (https://creativecommons.org/licenses/by/4.0/).
Share and Cite
MDPI and ACS Style
Shao, S.; Takeuchi, W. Bio-Geophysical Suitability Mapping for Chinese Cabbage of East Asia from 2001 to 2020. Remote Sens. 2023, 15, 1427. https://doi.org/10.3390/rs15051427
AMA Style
Shao S, Takeuchi W. Bio-Geophysical Suitability Mapping for Chinese Cabbage of East Asia from 2001 to 2020. Remote Sensing. 2023; 15(5):1427. https://doi.org/10.3390/rs15051427
Chicago/Turabian StyleShao, Shuai, and Wataru Takeuchi. 2023. "Bio-Geophysical Suitability Mapping for Chinese Cabbage of East Asia from 2001 to 2020" Remote Sensing 15, no. 5: 1427. https://doi.org/10.3390/rs15051427
Note that from the first issue of 2016, this journal uses article numbers instead of page numbers. See further details here.