


Temporal Variations in Ice Thickness of the Shirase Glacier Derived from Cryosat-2/SIRAL Data

1
Graduate School of Engineering, Nihon University, Fukushima 963-8642, Japan
2
College of Engineering, Nihon University, Fukushima 963-8642, Japan
*
Author to whom correspondence should be addressed.
Remote Sens. 2023, 15(5), 1205; https://doi.org/10.3390/rs15051205
Submission received: 30 December 2022
/
Revised: 9 February 2023
/
Accepted: 14 February 2023
/
Published: 22 February 2023
(This article belongs to the Special Issue Selected Papers from the “International Symposium on Remote Sensing 2022”)
Abstract
:This study presents the feasibility of estimating the ice thickness of the Shirase Glacier using the synthetic aperture interferometric radar altimeter (SIRAL) on board the CryoSat-2 and the interannual variation of the ice thickness of the Shirase Glacier in 2011–2020. The SIRAL data were converted to ice thickness by assuming hydrostatic equilibrium, and the results showed that the ice thickness decreased from the grounding line to the terminus of the glacier. Furthermore, the ice thickness decreased 30 km downstream from the grounding line of the glacier in 2012 and 2017, and decreased 55 km and 60 km downstream from the grounding line of the glacier at other times, which was attributed to the discharge of landfast ice and the retreat of the glacier terminus. When the flow of glacial ice can be reasonably approximated as an incompressible fluid, and the law of conservation of mass can be applied to the ice stream, the multiple of the velocity and the underlying ice thickness under a constant ice density can be shown to correspond to the equation of continuity. Consequently, this study revealed that the ice thickness decreases with accelerating flow velocity, which is coincident with past outflow events.
1. Introduction
The Antarctic ice sheet accounts for approximately 90% of the ice on Earth. When the ice sheet melts and flows out into the ocean, the sea level will rise by approximately 58 m [1]. The bottom water in the vicinity of Antarctica, which is cold seawater that is highly salinized by sea ice formation, sinks into the deeper layers of the ocean, driving the general circulation of the ocean. This general circulation plays a role in transporting heat to the entire globe. Therefore, quantitatively understanding the ice discharge from the Antarctic ice sheet is important for understanding global changes.
In recent years, glacier flow velocity has increased rapidly in West Antarctica due to basal melting of the ice shelf, and the current ice mass balance, which is the sum of snow accumulation and ice mass discharge, indicates that discharge exceeds accumulation [2]. It has been reported that the ice flow in the Pine Island Glacier in West Antarctica has accelerated, and its ice thickness has decreased [3]. While the ice mass balance in East Antarctica is considered to be almost balanced [4,5], the ice mass balance of the Shirase Drainage Basin, which includes the fastest flowing glacier, the Shirase Glacier, has been estimated to be −1.9 Gt a−1 [6]. As in West Antarctica, it was observed that the basal melting beneath the tongue of the Shirase Glacier caused an inflow of southward-flowing warm water from offshore [7], but the interannual variability of the inflow of warm water needs to be considered. Therefore, it is important to accurately measure the ice thickness of the glacier in order to continuously monitor the trend of the ice mass balance.
The Antarctic region has a severe weather environment, as well as polar nights and crevasses that make field observation hazardous and difficult. Satellite remote sensing techniques are capable of performing continuous spatiotemporal observation of an area and are effective for studying target areas in the cryosphere. The ice flow estimation of the Shirase Glacier using remote sensing techniques began with the use of two aerial photographs of the floating tongue taken at different times [8,9], enabling the assessment of the ice flow. The results obtained using the interferometric synthetic aperture radar (interferometric SAR or InSAR) technique showed that the velocity distribution around the same floating ice tongue ranged from 2.2 to 2.6 km a−1 [10]; furthermore, the flow velocity at the grounding line of the Shirase Glacier, which was 2.3 km a−1, made it one of the fastest flowing glaciers, and extremely fast compared to most other known glaciers, since the mean flow velocity of the 9 glaciers in East Antarctica is 1.0 km a−1 [11]. The application of the offset tracking method to intensity images derived from SAR has been shown to be effective for fast-flowing glaciers such as the Shirase Glacier (e.g., [12]), and the flow velocity at the grounding line has shown no significant changes in the last 24 years [13], while interannual variation in ice thickness remains insufficiently studied.
Although optical sensors are affected by clouds, microwave sensors can be used in polar regions because of their high atmospheric transparency, making observations possible under any weather condition. The estimation of ice thickness in cases where the ice shelves are covered by several thousand kilometers of ice in Antarctica can be accomplished by applying hydrostatic equilibrium to radar altimeter (RA) data obtained from the ERS-1, launched by the European Space Agency (ESA), with results as reported in [14]. Most recently, in 2010, CryoSat-2 was launched by the ESA, and the estimation of sea ice thickness has revealed a decrease in sea ice volume in the Arctic Ocean [15]. In the Antarctic region, CryoSat-2 is capable of greater coverage than conventional satellite altimeters, and it was able to show that mean elevation has decreased across the entire Antarctic ice sheet [16]. Furthermore, ice thicknesses were obtained for ice shelves by applying hydrostatic equilibrium to CryoSat-2 data [17]. As CryoSat-2 has also been used to observe the area around the Shirase Glacier, we were able to obtain the ice thickness of the glacier.
This study presents the possibility of estimating the ice thickness of the Shirase Glacier using microwave radar altimeter data obtained from CryoSat-2, as well as the interannual variation derived from the estimated ice thickness.
2. Materials and Methods
2.1. Estimation of the Area of the Shirase Glacier
The Shirase Glacier is located approximately 150 km south of Syowa Station (Figure 1a). The drainage basin of the Shirase Glacier is located in Dronning Maud Land, and forms part of the Mizuho Plateau [18,19]. The drainage basin of the Shirase Glacier is also the terminus of the ice stream of the Shirase Glacier, which reaches Lützow-Holm Bay in the form of a floating ice tongue (Figure 1a). Given that the floating ice tongue is surrounded by the landfast ice that covers most of Lützow-Holm Bay, the glacier mass has no direct outlet from the bay [20].
Focusing on the interannual variation in ice thickness in the calving area of the Shirase Glacier, the grounding line of the glacier is the boundary between the bedrock under the ice sheet and the ocean; the glacier ice in the region downstream from the grounding line floats into the ocean as an ice tongue. Hence, the ice thickness can be estimated by applying hydrostatic equilibrium to the calving area of the Shirase Glacier. This study used CryoSat-2/SIRAL data, which was obtained by observing the downstream region of the Shirase Glacier from its grounding line. The grounding line was determined on the basis of the detailed detection results obtained using the InSAR technique [21]. To estimate the ice thickness, the central streamline of the glacier had to be determined, and it was derived from the image acquired by the Landsat-8 in 2016 in the middle of the analysis period of this study. Then, the area to be analyzed was set to a width of ±3 km from the central streamline. The true-color composite Landsat-8 image used in this study is shown in Figure 1.
The elevation of the exposed rock area is unaffected by ice sheet fluctuations, since that area is not covered by the ice sheet. Hence, the accuracy of the CryoSat-2/SIRAL data can be validated by examining the long-term change in elevation in the exposed rock area. However, as described in Section 2.2, the measured position was dispersed in the exposed rock area, and then the measured position was nonuniform along the track of the satellite. This made it difficult to obtain the elevation at the desired measurement position, because the surface of the exposed rock was characterized by large undulations, which caused a deviation from the original measurement position of the CryoSat-2.
Consequently, the accuracy of the SIRAL observation performed in this study was examined on the basis of temporal changes in elevation on a pond in the exposed rock area, because it is difficult to validate the accuracy of elevation obtained by examining temporal changes in SIRAL data at the exposed rock itself. Three exposed rock areas, Rundvågshetta, Skallevikshalsen and Skallen, are located approximately 10 km east of the terminus of the Shirase Glacier. In each exposed rock area, there are three ponds, Maruwan O-ike, Dairi Ike and Skallen O-ike (Figure 1b). The ponds are 200–300 m wide and 600–800 m long, and there are more than a dozen data of SIRAL datasets obtained from the ponds during the period analyzed in this study. Skallen O-ike originates from drift melt water, while Dairi Ike originates from glacial melt water [23]. Maruwan O-ike is a depression surrounded by hills and filled with water, which can be observed from the 1:25,000 topographic map published by the GSI. Hence, Maruwan O-ike can be regarded as being similar to Dairi Ike and Skallen O-ike. In addition to these geographical features, the three ponds are always filled with fresh water, and the ponds’ surfaces can be considered to remain at a constant height. Therefore, the accuracy of the SIRAL data in this study was validated by examining long-term changes in the elevations of the three ponds.
2.2. CryoSat-2/SIRAL Data
Cryosat-2 was launched by ESA in 2010. The SAR interferometric radar altimeter (SIRAL) on board is a microwave altimeter operating in the Ku band (13.6 GHz). The SIRAL has three different observation modes, depending on the features of what is being observed: low-resolution mode, SAR mode, and SAR interferometric (SIN) mode. The low-resolution mode is used to perform observations over ice sheet interiors and oceans. The SAR mode is used to perform observations over sea ice and ocean areas, and the SIN mode is used to perform observations around ice sheet margins and mountain glaciers. The specifications of CryoSat-2/SIRAL are shown in Table 1.
The Shirase Glacier was observed using the SIN mode because of its location in the coastal part of the ice sheet, connected to the southern part of Lützow-Holm Bay. Therefore, the SIN mode data used in this study were of level 2, with ice baseline D products. The products covering the Shirase Glacier, in which atmospheric and tidal corrections are applied, are available from 2011 to 2020. The amounts of CryoSat-2/SIRAL data are summarized in Table 2 (details regarding acquisition day are listed in Table A1).
Conventional radar altimeters have a high degree of error in the form of slope-induced error in elevations as a result of its large footprint [24,25]. The radar altimeter measures the closest point within this footprint, which is not the same as the subsatellite location in the case of irregular terrain with slopes. This leads to problems in accurately determining elevation using a radar altimeter, which performs measurements within a footprint that includes large slopes such as the ice sheet margin [26]. To solve this problem, the CryoSat-2/SIRAL employs the SIN mode. Based on the Delay/Doppler RA principle [27], the resolution of the SIN mode is improved to approximately 300 m in the along-track direction as a result of the segmentalized footprint in low-resolution mode. Because the footprint size is improved only in the along-track direction, the resolution in the across-track direction remains approximately 1.6 km, the same as in low-resolution mode [28].
Furthermore, SIN mode uses the phase difference between the reflected waves received by the two antennas on the CryoSat-2/SIRAL equipment in order to determine the arrival angle of the former reflected wave, to improve the accuracy of elevation measurement. In SIN mode, there is an offset in the across-track direction in the ground track projected from the satellite location, because the measurement position in SIN mode does not correspond to the location of the subsatellite in the case of irregular terrain with slopes. Hence, the measurement position when using SIN mode is ambiguous, as shown in Figure 2. Therefore, in this study, gridding was applied to the observation results obtained using SIN mode, as described in Section S3, in order to be able to analyze the data.
Previous research has shown that performing backscatter correction on radar altimeter data can reduce spurious changes in elevation [29,30]. The snowfall on the Shirase Glacier was difficult to observe in situ due to the fast-flowing nature of the glacier; therefore, we were unable to obtain snowfall data. Through personal communication with one of the co-authors of [7], a snow depth on the glacier of 3.1 m at a location approximately 20 km downstream from the grounding line in January 2020, determined via helicopter transfer onto the glacier, was obtained. The microwave penetration depth of the CryoSat-2/SIRAL (Ku-band: 13.575 GHz) for the snow layer was calculated to be 42.6 m, assuming a density and dielectric constant of 0.3 g cm−3 and 1.47–j0.0001 [31], respectively. Since the penetration depth was one order larger than the measured snow depth, we considered the snow on the glacier to make a negligible contribution to the backscatter of CryoSat-2/SIRAL. Therefore, we did not apply backscatter correction to the CryoSat-2/SIRAL data used in this study.
2.3. ALOS World 3D Data
The accuracy of the CryoSat-2/SIRAL data was validated by comparing, for the ponds in the exposed rock area described in Section 2.1, the elevations obtained from the SIRAL data with those obtained using another digital elevation model (DEM) and from ground-based control point data. In this section, the data used for the DEM comparison are described. The results obtained using the ground-based control point data are described in Section 2.4.
The Advanced Land Observing Satellite (ALOS) was launched by the Japan Aerospace Exploration Agency (JAXA) on an H-IIA booster in January 2006. The ALOS has three remote sensing instruments: the Panchromatic Remote-sensing Instrument for Stereo Mapping (PRISM) for digital elevation mapping, the Advanced Visible and Near Infrared Radiometer type 2 (AVNIR-2) for precise land coverage observation, and the Phased Array type L-band Synthetic Aperture Radar (PALSAR) for day-and-night and all-weather land observation. ALOS World 3D (AW3D), a digital surface model (DSM), was compiled from images of approximately 3 million scenes acquired by the ALOS/PRISM in 2006–2011, and a product corresponding to a resolution of 30 m (AW3D30) was released in an open and free data format by the JAXA [32].
Since AW3D30 data were available for the exposed rock area, including the ponds, this study examined the accuracy of the CryoSat-2/SIRAL data by performing a comparison with the AW3D30 height. In addition, AW3D30 data were not only available for the ice shelves, but also for the floating ice tongue of the Shirase Glacier. Hence, this study also used AW3D30 height as the reference height to screen ice thickness estimation results to remove outliers (described in detail in Section S2). A color-coded map derived from AW3D30 height data is shown in Figure 3.
2.4. Control Point Survey Results
The leveling results obtained at the spot height in the exposed rock area used in this study were available via the topographic map provided by the Geospatial Information Authority of Japan (GSI). The 1:25,000 topographic map was compiled from aerial photographs and the results of control point surveys implemented by the Japanese Antarctic Research Expedition.
In this study, the leveling results at the spot height of Dairi Ike (hereafter referred to as the GSI height), corresponding to a height of 50 m, were found to be available for use. Therefore, the height obtained on the basis of CryoSat-2/SIRAL data was compared not only to that obtained using AW3D30 data, but also to the GSI height.
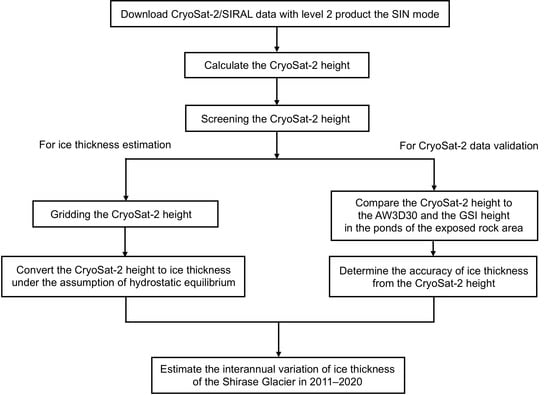
2.5. Conversion of CryoSat-2/SIRAL Data into Ice Thickness
In this study, the acquired CryoSat-2/SIRAL data were converted into the ice thickness of the Shirase Glacier using the following procedure: firstly, the CryoSat-2/SIRAL data were converted into height; then, the CryoSat-2 height results were screened for outlier data; and finally, the CryoSat-2 heights were gridded and converted into ice thickness. These procedures are described in detail in the Supplementary Materials. The percentage of CryoSat-2/SIRAL data that were excluded as outliers when performing the conversion to ice thickness using the above procedures is summarized in Table 3 as quality control data.
3. Results
3.1. Comparison of CryoSat-2 Height with AW3D30 DSM
Table 4 shows the means and standard deviations of the CryoSat-2 height and the AW3D30 height, calculated for each of the ponds in the exposed rock areas, as described in Section 2.1. The standard deviations of the CryoSat-2 height and the AW3D30 height were 1.19 m and 0.63 m, respectively. When the GSI height was used as the true value, the RMSEs of the CryoSat-2 height and the AW3D30 height were 1.6 m and 1.1 m, respectively. This can be attributed to the differences in pixel spacing between the CryoSat-2 height and the AW3D30 height, while the standard deviations are comparable when considering the size of pixel spacing for both heights.
Furthermore, an absolute validation of AW3D has been performed on the basis of 5121 ground-based checkpoints all over the world, resulting in an RMSE of 4.40 m [32]. The RMSE of the CryoSat-2 height was 4.04 m when the AW3D30 height was used as the true value, suggesting that the accuracy of the obtained CryoSat-2 height is similar to the accuracy of the AW3D30 height.
Therefore, the accuracy of ice thickness estimation , determined on the basis of the CryoSat-2 height, can be approximated as using Equation (S5), with a resultant of ±9.5 m, where is substituted by the standard deviation of ±1.2 m. Likewise, the accuracy of the estimation determined on the basis of AW3D30 is ±4.8 m.
3.2. Estimate of Ice Thickness
A color-coded map of the estimated ice thickness distribution for the Shirase Glacier, as derived from the AW3D30 height and the annual CryoSat-2 height, is presented in Figure 4. In addition, Figure 5 shows the profile of the mean ice thickness between 2011 and 2020, extracted at 5 km intervals along the central streamline of the glacier. In this figure, the line indicates the mean ice thickness and the error bar indicates the accuracy of the estimated ice thickness obtained in Section 3.1.
In Figure 5a, the mean ice thickness derived from the CryoSat-2 height was 529.6 ± 9.5 m at the location 10 km downstream from the grounding line and 299.4 ± 9.5 m at the location 60 km downstream from the grounding line. In Figure 5b, the mean ice thickness derived from the AW3D30 height was 629.0 ± 4.8 m at the location 5 km downstream from the grounding line and 302.3 ± 4.8 m at the location 40 km downstream from the grounding line. These results show that the ice thickness decreased between its periphery at the grounding line and the terminus of the Shirase Glacier. In addition, Figure 6 shows the relationship between the ice thickness estimated on the basis of the AW3D30 height and that estimated on the basis of the CryoSat-2 height in the range of 10–40 km downstream from the grounding line. The ice thicknesses estimated on the basis of the AW3D30 height and the CryoSat-2 height were positively correlated and in good agreement, with a correlation coefficient of 0.97.
4. Discussion
4.1. Decline of Ice Thickness with Distance from Grounding Line
It can be seen from Figure 5a that the estimated ice thickness decreased from the grounding line to the terminus of the Shirase Glacier, but that this trend between the grounding line and 30 km downstream differed from that between 35 km downstream from the grounding line and the terminus of the glacier. This decline is expressed as a function of distance from the grounding line, as follows:
An annual in < 35 km of 19.8 m was obtained on the basis of a flow velocity of 2.3 km a−1 [13]. This is comparable to the decline in estimated ice thickness obtained using the ice radar, which was 7–16 m, resulting from basal melting, located approximately 20 km downstream from the grounding line [7]; however, it is possible that there are other factors at play, as discussed in Section 4.2. Meanwhile, an annual of 0.1 m was obtained in ≥ 35 km, suggesting that the contribution of basal melting to the difference in ice thickness was minimal.
4.2. Fluctuation of Ice Thickness with the Breaking Away of Glacier and Landfast Ice
In 1998 [12], 2005 [33] and 2018 [34], events occurred in which ice belonging to the floating ice tongue and the landfast ice surrounding it broke up and flowed out into Lützow-Holm Bay, resulting in an acceleration of the flow velocities of the Shirase Glacier. The volume of ice discharge can be determined as follows:
where is the ice thickness, is the flow velocity and is the flow width. Since there has been no significant change in the ice flow velocity at the grounding line over the past 20 years [13], can be regarded as being constant. Hence, the ice thickness and the flow velocity are the dominant factors influencing the ice discharge from the glacier.
The flow of glacial ice can be reasonably approximated as an incompressible fluid, and the law of conservation of mass can be applied to the ice stream. The multiplication of the velocity by the underlying ice thickness under constant ice density corresponds to the equation of continuity, as shown in the following relation:
where is the decline from and is the acceleration from . This is shown schematically in Figure 7. Rearranging Equation (3) for gives the following:
Equation (4) states that the ice thickness decreases with the acceleration of flow velocity.
To clarify the decreases in ice thickness on the Shirase Glacier that coincided with past outflow events, we investigated the relationship between ice thickness and flow velocity. Changes in the ice thickness of the glacier were recorded with temporal changes such as the occurrence of basal melting and past events. To investigate whether the changes in ice thickness controlled those events, we focused on the significant change in ice thickness at a location 30 km downstream from the grounding line in Figure 5a. To examine the association between changes in ice thickness at the location 30 km downstream from the grounding line and past events, we also examined changes in ice thickness at a location 25 km downstream from the grounding line. This is because the ice thickness profile at 30 km downstream should have experienced the same past changes in ice thickness as those at 25 km downstream. The annual mean values of ice thicknesses at 25 km and 30 km downstream from the grounding line are shown in Figure 8.
Although the ice thickness in 1998 was not determined in this study, the glacier would have advanced approximately 30 km in 14 years when assuming a flow velocity of 2.3 km a−1 at the grounding line of Shirase Glacier [13]. In the profile at 30 km in Figure 8, the ice thickness in 2012 (14 years after 1998) was 330.0 m, while the mean thickness for 2012–2020 was 356.5 m; therefore, the difference from the mean was 26.5 m. Hence, the profile at 30 km downstream in 2012 showed a lesser value than in other years. The change in ice thickness 30 km downstream from the grounding line in 2012 should be compared with that at 25 km downstream from the grounding line in 2010 (as there was less than a 5 km advance between 2010 and 2012); however, the ice thickness in 2010 was obtained in this study due to insufficient stacking for the analysis. Consequently, the ice thickness at 25 km downstream from the grounding line in 2011 was verified, and the profile at 25 km in 2011 presented in Figure 8 was the lesser, at 426.4 m (where the mean for 2012–2020 was 449.3 m). This was attributed to the acceleration in the glacier flow associated with the retreat of the terminus of the Shirase Glacier in 1998 [12]. Similarly, the ice thickness in 2005 was not determined, but the glacier would have advanced approximately 30 km in 12 years, and the profile at 30 km in 2017, presented in Figure 8, can be regarded as indicating the change 12 years after 2005. In this figure, the profile at 30 km in 2017 was 314.3 m, corresponding to a difference from the mean of 42.2 m and showing a lesser value compared to other years. The ice thickness 30 km downstream from the grounding line in 2017 was compared with that 25 km downstream from the grounding line in 2015. The profile 25 km downstream in 2015, presented in Figure 8, was 451.5 m, which was the smallest value between 2013 and 2016. This was attributed to the breaking up and flowing out of the southernmost landfast ice into Lützow-Holm Bay, which surrounds the terminus of the Shirase Glacier, in 2005 [33].
Since the Shirase Glacier has advanced since the retreat of its terminus in 2018 [35], it is expected that the terminus will indicate the change in ice thickness associated with the discharge of the floating ice tongue and its surrounding landfast ice occurring in March–April 2018. With the glacier advancing approximately 5 km in 2 years, the difference in ice thickness between 55 km and the 60 km downstream from the grounding line presented in Figure 5a was 26.0 m. If the same intensity of basal melting [7] is applied near the terminus of the Shirase Glacier, it is not clear whether the difference in ice thickness can be attributed to the event in 2018 or to basal melting. However, there was no significant change in ice thickness between 35 km downstream from the grounding line and the terminus of the glacier, whereby the change in ice thickness was determined to be 0.2 m per 5 km on the basis of a simple linear regression analysis. In other words, there might be no significant effect of the basal melting between 35 km downstream from the grounding line and the terminus of the glacier. Hence, the difference of ice thickness was attributed to the discharge of the floating ice tongue and its surrounding landfast ice in 2018.
Therefore, the decrease in ice thicknesses observed 30 km downstream from the grounding line in 2012 and 2017 and the mean ice thickness in the terminus of the Shirase Glacier during the analysis period were revealed to be a result of the acceleration of the glacier flow occurring as a result of the discharge of landfast ice and the terminus of the glacier.
5. Conclusions
This study demonstrated the estimation of the ice thickness of the Shirase Glacier by applying an assumption of hydrostatic equilibrium in the calving region of the glacier on the basis of CryoSat-2/SIRAL data from 2011 to 2020. To validate the accuracy of the CryoSat-2/SIRAL data, temporal changes in the elevation of ponds in exposed rock areas were investigated via a DSM of the AW3D30 and ground survey by means of GSI. The accuracy of the ice thickness estimation performed on the basis of the CryoSat-2 height was determined to be ±9.5 m, which was applied as a standard deviation.
The mean ice thickness profile along the central streamline of the Shirase Glacier indicates that the ice thickness decreases from the grounding line to the terminus of the glacier. In addition, the trend differed between (1) the range from the grounding line to 30 km downstream and (2) the range from 35 km downstream from the grounding line to the terminus of the glacier. An annual decline in ice thickness of 19.8 m was identified in (1), which is comparable to the estimated decline in ice thickness occurring due to basal melting. Meanwhile, a decline of 0.1 m was identified in (2), which suggests that basal melting makes little contribution to the ice thickness.
When the flow of glacial ice can be reasonably approximated as an incompressible fluid and the law of conservation of mass can be applied to the ice stream, the multiple of the velocity and the underlying ice thickness under a constant ice density corresponds to the equation of continuity. Changes in the ice thickness of the glacier occur as a result of temporal changes, such as basal melting, and past events, such as the breaking up and discharge of floating ice tongues and their surrounding landfast ice in Lützow-Holm Bay. To investigate the changes in ice thickness changes occurring as a result of such events in 1998, 2005 and 2018, we focused on the significant ice thickness change 30 km downstream from the grounding line.
Consequently, this study revealed that ice thickness decreases with increasing flow velocity, coinciding with past outflow events. In summary, the estimation of ice thickness performed using the CryoSat-2 height in this study is expected to contribute to accurate mass balance estimation of the Shirase Drainage Basin, since the results take into account interannual changes and discharge events of the Shirase Glacier and its surrounding landfast ice in Lützow-Holm Bay.
Supplementary Materials
The following supporting information can be downloaded at: https://www.mdpi.com/article/10.3390/rs15051205/s1. These materials describe the pre-processing steps referred to in Section 2.5. References [36,37] are cited in the Supplementary Materials.
Author Contributions
Conceptualization, Y.S. and K.N.; methodology, Y.S. and K.N.; software, Y.S. and K.N.; validation, Y.S. and K.N.; formal analysis, Y.S. and K.N.; investigation, Y.S. and K.N.; resources, Y.S. and K.N.; data curation, Y.S. and K.N.; writing—original draft preparation, Y.S.; writing—review and editing, K.N.; visualization, Y.S.; supervision, K.N.; project administration, K.N.; funding acquisition, K.N. All authors have read and agreed to the published version of the manuscript.
Funding
This work was funded in part by the Japan Society for the Promotion of Science Grant-in-Aid Scientific Research (C), under Grant 21K12214, in part by the Joint Research Program of the Institute of Low Temperature Science, Hokkaido University, under Grant 22G023, and in part by the National Institute of Polar Research through General Collaboration Project (2–25).
Data Availability Statement
The CryoSat-2/SIRAL data are available at https://cs2eo.org/ (accessed on 1 December 2022). The AW3D30 dataset is available at https://www.eorc.jaxa.jp/ALOS/en/dataset/aw3d30/aw3d30_e.htm (accessed on 1 December 2022). The Antarctica geospatial data are available at https://www.gsi.go.jp/antarctic/index-e.html (accessed on 1 December 2022).
Acknowledgments
This work was supported in part by the Japan Society for the Promotion of Science Grant-in-Aid Scientific Research (C), under Grant 21K12214, in part by the Joint Research Program of the Institute of Low Temperature Science, Hokkaido University, under Grant 22G023, and in part by the National Institute of Polar Research through General Collaboration Project (2–25).
Conflicts of Interest
The authors declare no conflict of interest.
Appendix A
Table A1 and Table A2 list the CryoSat-2/SIRAL data that we used to estimate the ice thickness of the Shirase Glacier and to validate the accuracy of the measured height, respectively.

Table A1.
The CryoSat-2/SIRAL data acquisition dates for the estimation of ice thickness.
| Date/Orbit | Date/Orbit | Date/Orbit | Date/Orbit |
|---|---|---|---|
| 06 Jan 2011/Descending | 11 Jan 2011/Ascending | 04 Feb 2011/Descending | 07 Feb 2011/Ascending |
| 02 Mar 2011/Descending | 08 Mar 2011/Ascending | 31 Mar 2011/Descending | 06 Apr 2011/Ascending |
| 29 Apr 2011/Descending | 05 May 2011/Ascending | 26 May 2011/Descending | 24 Jun 2011/Descending |
| 30 Jun 2011/Ascending | 23 Jul 2011/Descending | 29 Jul 2011/Ascending | 19 Aug 2011/Descending |
| 21 Aug 2011/Descending | 25 Aug 2011/Ascending | 15 Sep 2011/Descending | 17 Sep 2011/Descending |
| 23 Sep 2011/Ascending | 16 Oct 2011/Descending | 21 Oct 2011/Ascending | 12 Nov 2011/Descending |
| 14 Nov 2011/Descending | 17 Nov 2011/Ascending | 11 Dec 2011/Descending | 16 Dec 2011/Ascending |
| 09 Jan 2012/Descending | 14 Jan 2012/Ascending | 07 Feb 2012/Descending | 10 Feb 2012/Ascending |
| 05 Mar 2012/Descending | 07 Mar 2012/Descending | 10 Mar 2012/Ascending | 03 Apr 2012/Descending |
| 08 Apr 2012/Ascending | 02 May 2012/Descending | 05 May 2012/Ascending | 07 May 2012/Ascending |
| 29 May 2012/Descending | 31 May 2012/Descending | 03 Jun 2012/Ascending | 26 Jun 2012/Descending |
| 02 Jul 2012/Ascending | 25 Jul 2012/Descending | 31 Jul 2012/Ascending | 21 Aug 2012/Descending |
| 23 Aug 2012/Descending | 27 Aug 2012/Ascending | 19 Sep 2012/Descending | 25 Sep 2012/Ascending |
| 18 Oct 2012/Descending | 24 Oct 2012/Ascending | 14 Nov 2012/Descending | 16 Nov 2012/Descending |
| 20 Nov 2012/Ascending | 22 Nov 2012/Ascending | 13 Dec 2012/Descending | 19 Dec 2012/Ascending |
| 11 Jan 2013/Descending | 17 Jan 2013/Ascending | 07 Feb 2013/Descending | 09 Feb 2013/Descending |
| 13 Feb 2013/Ascending | 08 Mar 2013/Descending | 13 Mar 2013/Ascending | 06 Apr 2013/Descending |
| 11 Apr 2013/Ascending | 05 May 2013/Descending | 08 May 2013/Ascending | 01 Jun 2013/Descending |
| 06 Jun 2013/Descending | 30 Jun 2013/Descending | 05 Jul 2013/Ascending | 29 Jul 2013/Descending |
| 03 Aug 2013/Ascending | 25 Aug 2013/Descending | 27 Aug 2013/Descending | 30 Aug 2013/Ascending |
| 23 Sep 2013/Descending | 28 Sep 2013/Ascending | 02 Oct 2013/Ascending | 21 Oct 2013/Descending |
| 27 Oct 2013/Ascending | 17 Nov 2013/Descending | 19 Nov 2013/Descending | 23 Nov 2013/Ascending |
| 16 Dec 2013/Descending | 22 Dec 2013/Ascending | 14 Jan 2014/Descending | 20 Jan 2014/Ascending |
| 10 Feb 2014/Descending | 12 Feb 2014/Descending | 16 Feb 2014/Ascending | 11 Mar 2014/Descending |
| 15 Mar 2014/Ascending | 17 Mar 2014/Ascending | 09 Apr 2014/Descending | 15 Apr 2014/Ascending |
| 08 May 2014/Descending | 04 Jun 2014/Descending | 06 Jun 2014/Descending | 08 Jun 2014/Ascending |
| 10 Jun 2014/Ascending | 12 Jun 2014/Ascending | 03 Jul 2014/Descending | 08 Jul 2014/Ascending |
| 01 Aug 2014/Descending | 06 Aug 2014/Ascending | 28 Aug 2014/Descending | 30 Aug 2014/Descending |
| 02 Sep 2014/Ascending | 22 Sep 2014/Descending | 26 Sep 2014/Descending | 01 Oct 2014/Ascending |
| 25 Oct 2014/Descending | 30 Oct 2014/Ascending | 21 Nov 2014/Descending | 23 Nov 2014/Descending |
| 26 Nov 2014/Ascending | 20 Dec 2014/Descending | 25 Dec 2014/Ascending | 27 Dec 2014/Ascending |
| 18 Jan 2015/Descending | 20 Jan 2015/Descending | 23 Jan 2015/Ascending | 15 Feb 2015/Descending |
| 19 Feb 2015/Ascending | 14 Mar 2015/Descending | 20 Mar 2015/Ascending | 12 Apr 2015/Descending |
| 18 Apr 2015/Ascending | 11 May 2015/Descending | 17 May 2015/Ascending | 07 Jun 2015/Descending |
| 13 Jun 2015/Ascending | 06 Jul 2015/Descending | 12 Jul 2015/Ascending | 04 Aug 2015/Descending |
| 10 Aug 2015/Ascending | 31 Aug 2015/Descending | 02 Sep 2015/Descending | 06 Sep 2015/Ascending |
| 29 Sep 2015/Descending | 05 Oct 2015/Ascending | 28 Oct 2015/Descending | 02 Nov 2015/Ascending |
| 22 Nov 2015/Descending | 24 Nov 2015/Descending | 26 Nov 2015/Descending | 29 Nov 2015/Ascending |
| 30 Nov 2015/Descending | 23 Dec 2015/Descending | 28 Dec 2015/Ascending | 21 Jan 2016/Descending |
| 26 Jan 2016/Ascending | 19 Feb 2016/Descending | 22 Feb 2016/Ascending | 17 Mar 2016/Descending |
| 19 Mar 2016/Descending | 22 Mar 2016/Ascending | 15 Apr 2016/Descending | 20 Apr 2016/Ascending |
| 14 May 2016/Descending | 19 May 2016/Ascending | 09 Jun 2016/Descending | 11 Jun 2016/Descending |
| 15 Jun 2016/Ascending | 08 Jul 2016/Descending | 14 Jul 2016/Ascending | 06 Aug 2016/Descending |
| 12 Aug 2016/Ascending | 29 Aug 2016/Descending | 02 Sep 2016/Descending | 04 Sep 2016/Descending |
| 08 Sep 2016/Ascending | 01 Oct 2016/Descending | 07 Oct 2016/Ascending | 30 Oct 2016/Descending |
| 05 Nov 2016/Ascending | 26 Nov 2016/Descending | 28 Nov 2016/Descending | 02 Dec 2016/Ascending |
| 25 Dec 2016/Descending | 31 Dec 2016/Ascending | 23 Jan 2017/Descending | 25 Jan 2017/Descending |
| 29 Jan 2017/Ascending | 21 Feb 2017/Descending | 24 Feb 2017/Ascending | 20 Mar 2017/Descending |
| 25 Mar 2017/Ascending | 18 Apr 2017/Descending | 23 Apr 2017/Ascending | 17 May 2017/Descending |
| 20 May 2017/Ascending | 22 May 2017/Ascending | 13 Jun 2017/Descending | 18 Jun 2017/Ascending |
| 12 Jul 2017/Descending | 17 Jul 2017/Ascending | 10 Aug 2017/Descending | 15 Aug 2017/Ascending |
| 06 Sep 2017/Descending | 08 Sep 2017/Descending | 11 Sep 2017/Ascending | 04 Oct 2017/Descending |
| 10 Oct 2017/Ascending | 31 Oct 2017/Descending | 02 Nov 2017/Descending | 08 Nov 2017/Ascending |
| 29 Nov 2017/Descending | 01 Dec 2017/Descending | 03 Dec 2017/Ascending | 05 Dec 2017/Ascending |
| 28 Dec 2017/Descending | 03 Jan 2018/Ascending | 26 Jan 2018/Descending | 01 Feb 2018/Ascending |
| 24 Feb 2018/Descending | 28 Feb 2018/Ascending | 29 Mar 2018/Ascending | 21 Apr 2018/Descending |
| 27 Apr 2018/Ascending | 20 May 2018/Descending | 24 May 2018/Ascending | 16 Jun 2018/Descending |
| 18 Jun 2018/Descending | 21 Jun 2018/Ascending | 15 Jul 2018/Descending | 18 Jul 2018/Ascending |
| 20 Jul 2018/Ascending | 13 Aug 2018/Descending | 18 Aug 2018/Ascending | 09 Sep 2018/Descending |
| 12 Sep 2018/Ascending | 14 Sep 2018/Ascending | 08 Oct 2018/Descending | 11 Oct 2018/Ascending |
| 13 Oct 2018/Ascending | 04 Nov 2018/Descending | 06 Nov 2018/Descending | 11 Nov 2018/Ascending |
| 03 Dec 2018/Descending | 05 Dec 2018/Descending | 08 Dec 2018/Ascending | 01 Jan 2019/Descending |
| 06 Jan 2019/Ascending | 29 Jan 2019/Descending | 04 Feb 2019/Ascending | 27 Feb 2019/Descending |
| 03 Mar 2019/Ascending | 26 Mar 2019/Descending | 01 Apr 2019/Ascending | 05 Apr 2019/Ascending |
| 24 Apr 2019/Descending | 30 Apr 2019/Ascending | 23 May 2019/Descending | 29 May 2019/Ascending |
| 19 Jun 2019/Descending | 25 Jun 2019/Ascending | 18 Jul 2019/Descending | 24 Jul 2019/Ascending |
| 16 Aug 2019/Descending | 22 Aug 2019/Ascending | 12 Sep 2019/Descending | 14 Sep 2019/Descending |
| 18 Sep 2019/Ascending | 20 Sep 2019/Ascending | 09 Oct 2019/Descending | 11 Oct 2019/Descending |
| 14 Oct 2019/Ascending | 16 Oct 2019/Ascending | 09 Nov 2019/Descending | 14 Nov 2019/Ascending |
| 06 Dec 2019/Descending | 08 Dec 2019/Descending | 11 Dec 2019/Ascending | 04 Jan 2020/Descending |
| 09 Jan 2020/Ascending | 02 Feb 2020/Descending | 07 Feb 2020/Ascending | 02 Mar 2020/Descending |
| 05 Mar 2020/Ascending | 27 Mar 2020/Descending | 29 Mar 2020/Descending | 31 Mar 2020/Descending |
| 03 Apr 2020/Ascending | 27 Apr 2020/Descending | 02 May 2020/Ascending | 25 May 2020/Descending |
| 29 May 2020/Descending | 31 May 2020/Ascending | 21 Jun 2020/Descending | 23 Jun 2020/Descending |
| 25 Jun 2020/Ascending | 27 Jun 2020/Ascending | 20 Jul 2020/Descending | 22 Jul 2020/Descending |
| 26 Jul 2020/Ascending | 12 Aug 2020/Descending | 14 Aug 2020/Descending | 18 Aug 2020/Descending |
| 08 Sep 2020/Descending | 12 Sep 2020/Ascending | 14 Sep 2020/Ascending | 03 Oct 2020/Descending |
| 07 Oct 2020/Ascending | 24 Oct 2020/Descending | 26 Oct 2020/Descending | 01 Nov 2020/Ascending |
| 20 Nov 2020/Descending | 26 Nov 2020/Ascending | 15 Dec 2020/Descending |
Table A2.
The CryoSat-2/SIRAL data acquisition dates for the validation of height accuracy.
| Date/Orbit | Date/Orbit | Date/Orbit | Date/Orbit |
|---|---|---|---|
| 31 Mar 2011/Descending | 04 Apr 2011/Ascending | 26 May 2011/Descending | 19 Aug 2011/Descending |
| 12 Nov 2011/Descending | 12 Jan 2012/Ascending | 05 Mar 2012/Descending | 29 May 2012/Descending |
| 30 Jun 2012/Ascending | 23 Sep 2012/Ascending | 09 Apr 2013/Ascending | 01 Jun 2013/Descending |
| 30 Jun 2013/Descending | 25 Aug 2013/Descending | 04 Jun 2014/Descending | 03 Jul 2014/Descending |
| 06 Jul 2014/Ascending | 28 Aug 2014/Descending | 21 Nov 2014/Descending | 12 Apr 2015/Descending |
| 16 Apr 2015/Ascending | 13 Jun 2015/Ascending | 06 Jul 2015/Descending | 10 Jul 2015/Ascending |
| 31 Aug 2015/Descending | 03 Oct 2015/Ascending | 31 Oct 2015/Ascending | 24 Nov 2015/Descending |
| 22 Feb 2016/Ascending | 18 Apr 2016/Ascending | 09 Jun 2016/Descending | 08 Jul 2016/Descending |
| 12 Jul 2016/Ascending | 02 Sep 2016/Descending | 05 Oct 2016/Ascending | 20 Mar 2017/Descending |
| 13 Jun 2017/Descending | 12 Jul 2017/Descending | 06 Sep 2017/Descending | 08 Oct 2017/Ascending |
| 25 Apr 2018/Ascending | 18 Jul 2018/Ascending | 09 Sep 2018/Descending | 03 Dec 2018/Descending |
| 02 Feb 2019/Ascending | 28 Apr 2019/Ascending | 19 Jun 2019/Descending | 18 Jul 2019/Descending |
| 22 Jul 2019/Ascending | 12 Sep 2019/Descending | 11 Dec 2019/Ascending | 05 Feb 2020/Ascending |
| 30 Apr 2020/Ascending | 23 May 2020/Descending | 21 Jun 2020/Descending | 27 Jun 2020/Ascending |
| 24 Jul 2020/Ascending | 26 Oct 2020/Descending | 30 Oct 2020/Ascending |
References
- Fretwell, P.; Pritchard, H.D.; Vaughan, D.G.; Bamber, J.L.; Barrand, N.E.; Bell, R.; Bianchi, C.; Bingham, R.G.; Blankenship, D.D.; Casassa, G.; et al. BEDMAP2: Improved ice bed, surface and thickness datasets for Antarctica. Cryosphere 2013, 7, 375–393. [Google Scholar] [CrossRef] [Green Version]
- Rignot, E.; Jacobs, S.; Mouginot, J.; Scheuchl, B. Ice-shelf melting around Antarctica. Science 2013, 341, 266–270. [Google Scholar] [CrossRef] [Green Version]
- Rignot, E.; Vaughan, D.; Schmeltz, M.; Dupont, T.; Macayeal, D. Acceleration of Pine Island and Thwaites Glaciers, West Antarctica. Ann. Glaciol. 2002, 34, 189–194. [Google Scholar] [CrossRef] [Green Version]
- Shepherd, A.; Ivins, E.R.; Geruo, A.; Barletta, V.R.; Bentley, M.J.; Bettadpur, S.; Briggs, K.H.; Bromwich, D.H.; Forsberg, R.; Galin, N.; et al. A Reconciled Estimate of Ice-Sheet Mass Balance. Science 2012, 338, 1183–1189. [Google Scholar] [CrossRef] [Green Version]
- Rignot, E.; Bamber, J.L.; van den Broeke, M.R.; Davis, C.; Li, Y.; van de Berg, W.J.; van Meijgaard, E. Recent Antarctic ice mass loss from radar interferometry and regional climate modelling. Nat. Geosci. 2008, 1, 106–110. [Google Scholar] [CrossRef] [Green Version]
- Nakamura, K.; Yamanokuchi, T.; Doi, K.; Shibuya, K. Net mass balance calculations for the Shirase Drainage Basin, east Antarctica, using the mass budget method. Polar Sci. 2016, 10, 111–122. [Google Scholar] [CrossRef]
- Hirano, D.; Tamura, T.; Kusahara, K.; Ohshima, K.I.; Nicholls, K.W.; Ueno, S.; Simizu, D.; Ono, K.; Fujii, M.; Nogi, Y.; et al. Strong ice-ocean interaction beneath Shirase Glacier Tongue in East Antarctica. Nat. Commun. 2020, 11, 4221. [Google Scholar] [CrossRef]
- Nakawo, M.; Ageta, Y.; Yoshimura, A. Discharge of ice across Soya Coast. Mem. Nat. Inst. Polar Res. Spec. Issue 1978, 7, 235–244. [Google Scholar]
- Fujii, Y. Aerophotographic interpretation of surface features and estimation of ice discharge at the outlet of the Shirase drainage basin Antarctica. Antarct. Rec. 1981, 72, 1–15. [Google Scholar] [CrossRef]
- Pattyn, F.; Derauw, D. Ice-dynamic conditions of Shirase Glacier, Antarctica, inferred from ERS SAR interferometry. J. Glaciol. 2002, 48, 559–565. [Google Scholar] [CrossRef] [Green Version]
- Rignot, E. Mass balance of East Antarctic glaciers and ice shelves from satellite data. Ann. Glaciol. 2002, 34, 217–227. [Google Scholar] [CrossRef] [Green Version]
- Nakamura, K.; Doi, K.; Shibuya, K. Estimation of seasonal changes in the flow of Shirase Glacier using JERS-1/SAR image correlation. Polar Sci. 2007, 1, 73–83. [Google Scholar] [CrossRef] [Green Version]
- Nakamura, K.; Aoki, S.; Yamanokuchi, T.; Tamura, T.; Doi, K. Validation for Ice Flow Velocity Variations of Shirase Glacier Derived From PALSAR-2 Offset Tracking. IEEE J. Sel. Top. App. Earth Obs. Remote Sens. 2022, 5, 3269–3281. [Google Scholar] [CrossRef]
- Griggs, J.; Bamber, J. Antarctic ice-shelf thickness from satellite radar altimetry. J. Glaciol. 2011, 57, 485–498. [Google Scholar] [CrossRef] [Green Version]
- Laxon, S.W.; Giles, K.A.; Ridout, A.L.; Wingham, D.J.; Willatt, R.; Cullen, R.; Kwok, R.; Schweiger, A.; Zhang, J.; Haas, C.; et al. CryoSat-2 estimates of Arctic sea ice thickness and volume. Geophys. Res. Lett. 2013, 40, 732–737. [Google Scholar] [CrossRef] [Green Version]
- McMillan, M.; Shepherd, A.; Sundal, A.; Briggs, K.; Muir, A.; Ridout, A.; Hogg, A.; Wingham, D. Increased ice losses from Antarctica detected by CryoSat-2. Geophys. Res. Lett. 2014, 41, 3899–3905. [Google Scholar] [CrossRef]
- Chuter, S.J.; Bamber, J.L. Antarctic ice shelf thickness from CryoSat-2 radar altimetry. Geophys. Res. Lett. 2015, 42, 10721–10729. [Google Scholar] [CrossRef] [Green Version]
- Naruse, R. Surface flow and strain of the ice sheet measured by a triangulation chain in Mizuho Plateau. Mem. Nat. Inst. Polar Res. Spec. Issue 1978, 7, 198–226. [Google Scholar]
- Mae, S.; Naruse, R. Possible causes of ice sheet thinning in the Mizuho Plateau. Nature 1978, 273, 291–292. [Google Scholar] [CrossRef]
- Fujii, Y.; Kusunoki, K. The role of sublimation and condensation in the formation of ice sheet surface at Mizuho Plateau. Antarct. J. Geophys. Res. 1982, 78, 4293–4300. [Google Scholar] [CrossRef]
- Yamanokuchi, T.; Doi, K.; Shibuya, K. Validation of grounding line of the East Antarctic ice sheet derived by ERS-1/2 interferometric SAR data. Polar Geosci. 2005, 18, 1–14. [Google Scholar]
- Gerrish, L.; Fretwell, P.; Cooper, P. Medium Resolution Vector Polylines of the Antarctic Coastline (7.5). UK Polar Data Cent. Nat. Environ. Res. Counc. UK Res. Innov. 2022. [Google Scholar] [CrossRef]
- Murayama, H. General Characteristics of the Antarctic Lakes near Syowa Station. Antarct. Rec. 1977, 58, 43–62. [Google Scholar] [CrossRef]
- Brenner, A.C.; Blndschadler, R.A.; Thomas, R.H.; Zwally, H.J. Slope-induced errors in radar altimetry over continental ice sheets. J. Geophys. Res. 1983, 88, 1617–1623. [Google Scholar] [CrossRef]
- Bamber, J.L. Ice sheet altimeter processing scheme. Int. J. Remote Sens. 1994, 15, 925–938. [Google Scholar] [CrossRef]
- Brenner, A.C.; DiMarzio, J.P.; Zwally, H.J. Precision and Accuracy of Satellite Radar and LaserAltimeter Data Over the Continental Ice Sheets. IEEE Trans. Geosci. Remote Sens. 2007, 45, 321–331. [Google Scholar] [CrossRef]
- Raney, R.K. The delay/Doppler radar altimeter. IEEE Trans. Geosci. Remote Sens. 1998, 36, 1578–1588. [Google Scholar] [CrossRef]
- Wingham, D.J.; Francis, C.R.; Baker, S.; Bouzinac, C.; Brockley, D.; Cullen, R.; de Chateau-Thierry, P.; Laxon, S.W.; Mallow, U.; Mavrocordatos, C.; et al. CryoSat: A mission to determine the fluctuations in Earth’s land and marine ice fields. Adv. Space Res. 2006, 37, 841–871. [Google Scholar] [CrossRef]
- Slater, T.; Shepherd, A.; McMillan, M.; Muir, A.; Gilbert, L.; Hogg, A.E.; Konrad, H.; Parrinello, T. A new digital elevation model of Antarctica derived from CryoSat-2 altimetry. Cryosphere 2018, 12, 1551–1562. [Google Scholar] [CrossRef] [Green Version]
- Wingham, D.J.; Ridout, A.J.; Scharroo, R.; Arthern, R.J.; Shum, C.K. Antarctic elevation change from 1992 to 1996. Science 1998, 282, 456–458. [Google Scholar] [CrossRef]
- Ulaby, F.T.; Moore, R.K.; Fung, A.K. Microwave Remote Sensing; Artech House: Norwood, MA, USA, 1986; Volume III. [Google Scholar]
- Tadono, T.; Nagai, H.; Ishida, H.; Oda, F.; Naito, S.; Minakawa, K.; Iwamoto, H. Generation of the 30 m-mesh global digital surface model by ALOS PRISM. Intl. Arch. Photogram. Remote Sens. Spatial Inf. Sci. 2016, XLI-B4, 157–162. [Google Scholar] [CrossRef]
- Ushio, S.; Wakabayashi, H.; Nishio, F. Sea ice variation in Lützow–Holmbukta, Antarctica, during the last fifty years. Seppyo 2006, 68, 299–305. [Google Scholar]
- Nakamura, K.; Shigeru, A.; Tsutomu, Y.; Takeshi, T. Interactive movements of outlet glacier tongue and landfast sea ice in Lützow-Holm Bay, East Antarctica, detected by ALOS-2/PALSAR-2 imagery. Sci. Remote Sens. 2022, 6, 100064. [Google Scholar] [CrossRef]
- Nakamura, K.; Yaginuma, S. Relationship between ice flow velocity of Shirase Glacier and its surrounding landfast ice derived from ALOS-2/PALSAR-2. In Proceedings of the the 73rd (Autumn 2022) Conference of the Remote Sensing Society of Japan, Isshindenkozubeta, Japan, 29–30 November 2022; pp. 269–270. [Google Scholar]
- Pavlis, N.K.; Holmes, S.A.; Kenyon, S.C.; Factor, J.K. The development and evaluation of the Earth Gravitational Model 2008 (EGM2008). J. Geophys. Res. 2012, 117, B04406. [Google Scholar] [CrossRef] [Green Version]
- Watson, D.F.; Philip, G.M. A refinement of inverse distance weighted interpolation. Geo-Process. 1985, 2, 315–327. [Google Scholar]
Figure 1.
(a) Map of Lützow-Holm Bay, East Antarctica; the red line indicates the grounding line of the Shirase Glacier [21] and the green line indicates the grounding line of other glaciers and the coastline [22]. The blue rectangle defines the area of the Shirase Glacier analyzed in the present study. (b) Locations of ponds in exposed rock area for the height validation in this study.

Figure 2.
Schematic diagram of measurement performed using CryoSat-2/SIRAL over irregular terrain with slope.
Figure 2.
Schematic diagram of measurement performed using CryoSat-2/SIRAL over irregular terrain with slope.

Figure 3.
Color-coded map derived from AW3D30 height data; the red line indicates the grounding line of the Shirase Glacier [21] and the green line indicates the grounding line of other glaciers and the coastline [22].

Figure 4.
Color-coded map of the estimated ice thickness distribution for the Shirase Glacier, as derived from (a) the AW3D30 height and the CryoSat-2 height in (b) 2011, (c) 2012, (d) 2013, (e) 2014, (f) 2015, (g) 2016, (h) 2017, (i) 2018, (j) 2019 and (k) 2020. The red line indicates the grounding line of the Shirase Glacier [21] and the black line indicates the grounding line of other glaciers and the coastline [22].


Figure 5.
Mean ice thickness profile from 2011 to 2020, extracted at 5 km intervals along the central streamline of the glacier. Ice thickness derived from (a) the CryoSat-2 height and (b) the AW3D30 height.
Figure 5.
Mean ice thickness profile from 2011 to 2020, extracted at 5 km intervals along the central streamline of the glacier. Ice thickness derived from (a) the CryoSat-2 height and (b) the AW3D30 height.

Figure 6.
The relationship between ice thickness estimated on the basis of the AW3D30 height and that estimated on the basis of the CryoSat-2 height in the range of 10–40 km downstream from the grounding line.
Figure 6.
The relationship between ice thickness estimated on the basis of the AW3D30 height and that estimated on the basis of the CryoSat-2 height in the range of 10–40 km downstream from the grounding line.

Figure 7.
The relationship between the ice thickness and the ice flow velocity assuming an incompressible fluid and the law of conservation of mass. The schematic diagram illustrates (a) that there is no change in the ice thickness, while (b) the ice thickness decrease is associated with the acceleration in flow velocity .

Figure 8.
The annual mean of ice thickness at 25 km and 30 km downstream from the grounding line of the Shirase Glacier.
Figure 8.
The annual mean of ice thickness at 25 km and 30 km downstream from the grounding line of the Shirase Glacier.

Table 1.
The specifications of CryoSat-2/SIRAL.
| Specification | Value |
|---|---|
| Agency | ESA |
| Launch date | 8 April 2010 |
| Satellite altitude | 717 km |
| Repeat cycle (Sub-cycle) | 369 days (30 days) |
| Sensor | SIRAL |
| Frequency | 13.575 GHz (Ku band) |
| Footprint (SIN mode) | 0.25 km (Along track) 1.60 km (Across track) |
Table 2.
The amount of CryoSat-2/SIRAL data used in this study. Data for the Shirase Glacier are indicated without parentheses, and those used for validation are indicated with parentheses.
Table 2.
The amount of CryoSat-2/SIRAL data used in this study. Data for the Shirase Glacier are indicated without parentheses, and those used for validation are indicated with parentheses.
| Year | Amt Data | Year | Amt Data | Year | Amt Data | Year | Amt Data | Year | Amt Data |
|---|---|---|---|---|---|---|---|---|---|
| 2011 | 28 (5) | 2012 | 32 (5) | 2013 | 30 (4) | 2014 | 34 (5) | 2015 | 31 (9) |
| 2016 | 31 (7) | 2017 | 31 (5) | 2018 | 30 (4) | 2019 | 32 (7) | 2020 | 36 (8) |
Table 3.
Quality control (QC) data for CryoSat-2 height.
| Year | Measuring Points | Removed Ratio | Year | Measuring Points | Removed Ratio | ||
|---|---|---|---|---|---|---|---|
| Original | After QC | Original | After QC | ||||
| 2011 | 1032 | 262 | 74.6% | 2012 | 989 | 213 | 78.5% |
| 2013 | 869 | 160 | 81.6% | 2014 | 853 | 207 | 75.7% |
| 2015 | 927 | 175 | 81.1% | 2016 | 969 | 248 | 74.4% |
| 2017 | 841 | 157 | 81.3% | 2018 | 1008 | 272 | 73.0% |
| 2019 | 1018 | 252 | 75.2% | 2020 | 985 | 206 | 79.1% |
Table 4.
The mean and standard deviation of the CryoSat-2 height and the AW3D30 height for each of the ponds in the exposed rock areas, as described in Section 2.1.
Table 4.
The mean and standard deviation of the CryoSat-2 height and the AW3D30 height for each of the ponds in the exposed rock areas, as described in Section 2.1.
| Pond Name | CryoSat-2 (m) | AW3D30 (m) |
|---|---|---|
| Maruwan O-ike | 6.33 ± 1.61 | 10.38 ± 0.52 |
| Dairi Ike | 48.57 ± 0.71 | 50.97 ± 0.44 |
| Skallen O-ike | 7.83 ± 1.26 | 12.87 ± 0.92 |
Disclaimer/Publisher’s Note: The statements, opinions and data contained in all publications are solely those of the individual author(s) and contributor(s) and not of MDPI and/or the editor(s). MDPI and/or the editor(s) disclaim responsibility for any injury to people or property resulting from any ideas, methods, instructions or products referred to in the content. |
© 2023 by the authors. Licensee MDPI, Basel, Switzerland. This article is an open access article distributed under the terms and conditions of the Creative Commons Attribution (CC BY) license (https://creativecommons.org/licenses/by/4.0/).
Share and Cite
MDPI and ACS Style
Satake, Y.; Nakamura, K. Temporal Variations in Ice Thickness of the Shirase Glacier Derived from Cryosat-2/SIRAL Data. Remote Sens. 2023, 15, 1205. https://doi.org/10.3390/rs15051205
AMA Style
Satake Y, Nakamura K. Temporal Variations in Ice Thickness of the Shirase Glacier Derived from Cryosat-2/SIRAL Data. Remote Sensing. 2023; 15(5):1205. https://doi.org/10.3390/rs15051205
Chicago/Turabian StyleSatake, Yurina, and Kazuki Nakamura. 2023. "Temporal Variations in Ice Thickness of the Shirase Glacier Derived from Cryosat-2/SIRAL Data" Remote Sensing 15, no. 5: 1205. https://doi.org/10.3390/rs15051205
Note that from the first issue of 2016, this journal uses article numbers instead of page numbers. See further details here.