
Fusing Social Media, Remote Sensing, and Fire Dynamics to Track Wildland-Urban Interface Fire
1
Faculty of Resources and Environmental Science, Hubei University, Wuhan 430062, China
2
Institute of Urban Systems Engineering, Beijing Academy of Science and Technology, Beijing 100035, China
3
School of Public Administration, China University of Geosciences, Wuhan 430074, China
4
Center for Turkmenistan Studies, China University of Geosciences, Wuhan 430074, China
5
State Key Laboratory of Remote Sensing Science, Aerospace Information Research Institute, Chinese Academy of Sciences, Beijing 100094, China
6
College of Resources and Environment, University of Chinese Academy of Sciences, Beijing 101408, China
*
Author to whom correspondence should be addressed.
Remote Sens. 2023, 15(15), 3842; https://doi.org/10.3390/rs15153842
Submission received: 30 May 2023
/
Revised: 20 July 2023
/
Accepted: 29 July 2023
/
Published: 2 August 2023
(This article belongs to the Special Issue Earth Observation and Citizen Contributed Data for Urban Sustainability)
Abstract
:Wildfire is one of the main hazards affecting large areas and causes great damage all over the world, and the rapid development of the wildland-urban interface (WUI) increases the threat of wildfires that have ecological, social, and economic consequences. As one of the most widely used methods for tracking fire, remote sensing can provide valuable information about fires, but it is not always available, and needs to be supplemented by data from other sources. Social media is an emerging but underutilized data source for emergency management, contains a wealth of disaster information, and reflects the public’s real-time witness and feedback to fires. In this paper, we propose a fusion framework of multi-source data analysis, including social media data and remote sensing data, cellphone signaling data, terrain data, and meteorological data to track WUI fires. Using semantic web technology, the framework has been implemented as a Knowledge Base Service and runs on top of WUIFire ontology. WUIFire ontology represents WUI fire–related knowledge and consists of three modules: system, monitoring, and spread, and tracks wildfires happening in WUIs. It provides a basis for tracking and analyzing a WUI fire by fusing multi-source data. To showcase the utility of our approach in a real-world scenario, we take the fire in the Yaji Mountain Scenic Area, Beijing, China, in 2019 as a case study. With object information identified from remote sensing, fire situation information extracted from Weibo, and fire perimeters constructed through fire spread simulation, a knowledge graph is constructed and an analysis using a semantic query is carried out to realize situational awareness and determine countermeasures. The experimental results demonstrate the benefits of using a semantically improved multi-source data fusion framework for tracking WUI fire.
1. Introduction
In recent years, wildfires around the world have increasingly affected human society and ecosystem services [1,2,3]. As the area where human development meets with wildland fuels, the wildland-urban interface (WUI) is bound to be affected by both structure firebrand and vegetative firebrand, making this coupled spatial expression more susceptible to fire risk [4,5,6]. With urbanization, the urban area is extended to the suburban or forest area, and the fire-infected WUI area will continuously increase [7,8,9]. Due to the intricate composition of the WUI, it poses a greater risk of physical harm or damage compared to other landscapes [10,11]. Therefore, tracking such fires requires more effective and efficient methods.
Since the Internet has been pervasive for some time, and mobile devices and various sensors are interconnected, exploiting large-scale data sources (for example, social networks, IoT sensors) is a practicable method for emergency response [12,13,14,15]. The mission to promote satellite remote sensing abilities is unprecedentedly successful in some countries, such as the USA, China, Japan, India, and others, enabling Earth observation anywhere and anytime. The fusion of those multi-source data is something rather new and will likely draw more attention in the coming years. Such integration should result in developments supporting disaster monitoring and management, in a way that is a major improvement on the analytical capability provided by a single data source [16,17]. However, as this fusion has often been pursued while accompanied by an inference problem involving a limited number of features that have been acquired from a single sensor, researchers have therefore often been unable to fully account for the physical phenomenon at hand, resulting in several challenges in aggregating data from various data sources [18].
The fusion of information from different sensors has long been an interest in data analysis, although data from different, often incompatible sensor modalities, and their complexity make it difficult for researchers to articulate them in a comprehensive form [19,20]. Satellite remote sensing (RS) data are widely used to record information about the Earth’s surface from space. Satellite RS devices can acquire high-resolution surface information, extract a variety of spatial and temporal characteristics of different surface targets, and serve as a reliable data source [21,22,23]. However, the technology is not time-sensitive and not always available, and needs to be supplemented with other sources of data. The linking of social media information with RS or GIS data can make emergency responses more effective [24]. Social networks offer a distinct opportunity to obtain socially aware information relevant to disaster management. Through the extraction and analysis of its content, the emergency management information of an evolving disaster can be mapped in more detail [25,26,27]. For example, wildfires detected by processing social media streams (e.g., by monitoring posts relevant to wildfires) can be validated by analyzing sensor data or additional data collected from the area of interest [28]. In [29], by studying the social networks in metropolitan areas, it was found that real and perceived threats, as well as actual disaster impacts, can be directly observed by examining the composition of social media information flows. Schnebele et al. [30] propose a new method to combine RS and voluntary geographic data to generate risk maps, showing that even small amounts of voluntary ground data can greatly improve risk-assessment results. Cervone et al. [31] have fused RS images with data obtained from social media to assess damage to transport infrastructure in the event of a disaster or emergency. They have demonstrated the value of this technique in situations where the impact of environmental disasters is extreme. But most of the existing data fusion studies on disasters are task-specific and lack integration of monitoring and dynamics [32,33]. And, there is currently a lack of methods for standardizing data from different sources. Such standardization will lead to the extension of analyses and their compatibility with other disasters [34,35]. In WUI fire areas, few studies have been performed on fusing geospatial and RS data [36,37,38], internet posts [39,40,41], and fire spread dynamics [42,43,44,45]. Such a fusion is necessary in order to acquire situational awareness and execute decision analysis more effectively and efficiently.
Semantic technologies can help integrate data from different sources into a unified model [46,47,48,49]. Using ontologies of semantic technologies, data from different sources can be transformed into a unified model, enabling better understanding of susceptibility, vulnerability, the overall situation, and other aspects of disasters, thus better supporting disaster management and response decisions [50,51]. To date, ontology modeling and query and reasoning languages such as the Resource Description Framework (RDF) [52], Web Ontology Language (OWL) [53], and SPARQL [54] have been used as recommended by W3C. In the domain of disaster management, the application of ontologies and the corresponding semantic techniques is becoming common. These ontology-related efforts in the domain of disaster monitoring and assessment use data integration, information sharing and reuse, and query answering. Kyzirakos et al. [55] combined ontologies and geospatial data to capture knowledge using semantic annotations encoded in ontologies. In [56], an ontology-based framework consisting of two existing ontologies was proposed to support the intelligent data analysis of detected data of disasters. Scheuer et al. [57] propose a new OWL ontology for flood risk assessment, describing the core flood risk concepts, tasks and map types. However, there are still some limitations to existing research. Ontology construction is critical to the application of semantic technologies in disaster modeling; the relationships between disasters and their causes, consequences, and mitigation strategies can be complicated and difficult to represent using ontology modeling approaches; ontology construction is a time-consuming and knowledge-intensive task [58]. Another challenge is that the expert knowledge of varied disasters is disparate, not only the distinctive driving logic, but also the operations of emergency response are completely different, and domain and task ontologies for specific disasters are still required to construct according to their business process. There is no semantic modeling specifically for WUI fire, but the semantic information related to forest fire and building fire can be used in semantic modeling [59,60]. Inspired by previous works, this paper proposes an OWL-based WUIFire ontology to fill the gap in the context of tracking WUI fire, where our domain ontology is incorporated into the process of analysis about fire situation and mitigation strategy.
In this paper, we propose a fusion framework by considering multi-source heterogeneous data including social media data and earth observation data that could indicate fire situation and support emergency response. Based on WUI fire knowledge, concepts and properties were extracted to build the WUI fire domain ontology (WUIFire ontology), which captures the relationships among wildfire systems, social media data, and sensor network data, enabling the integration of different data for tracking fire. The data from heterogeneous sources are instantiated to form spatio-temporal knowledge base. The proposed framework is evaluated based on scenarios and evidences from the wildfire in the Yaji Mountain Scenic Area on 30 March 2019 as a case. The experimental results show the applicability of the incident situation analysis mechanism and demonstrate the benefits using semantically improved multi-source data fusion for early warning and situational awareness of WUI fire.
2. Methodology
2.1. Overall Framework
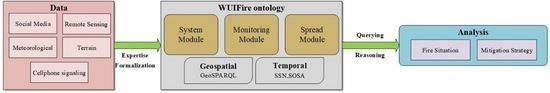
First, we outlined the implementation of the proposed fusion framework. Figure 1 presents the internal architecture.
The architecture consists of four parts: Data Resource, Knowledge Base Service, Knowledge Storage, and Intelligent Analysis. In first part, heterogeneous data is collected from different data sources. Specifically, social media posts are typical of unstructured data, and weather forecast; signaling location data are classified as structured data. Terrain data are extracted from DEM, ground object data are identified from RS images, and both can be transformed into structured data.
The Knowledge Base Service is the core component of the framework, and runs on top of the WUIFire ontology, which developed semantic integration mechanisms taking into account the data from various sources. More specifically, Knowledge Base Service receives data automatically or manually, which allows human–computer interaction and knowledge-base updating. Through mediation by Knowledge Base Service, the data or instructions are semantically integrated into the knowledge base and drive query and reasoning for problem solving. The reasoning mechanism as a set of SPARQL queries is used to search information during a fire event to form a unified reasoning process.
In this paper, we concentrate on WUIFire ontology, which is designed to represent the process of a fire happening in a WUI area including its occurrence, spread, and response, and contains the formal representation of the WUI fire information including types, properties, and interrelationships of different entities (see more in Section 4).
WUIFire is built based on GeoSPARQL, Semantic Sensor Network (SSN), and Sensor, Observation, Sample, and Actuator (SOSA) [61]. The SSN and SOSA ontologies constitute modular and extensive knowledge representations for sensor applications, developed by the World Wide Web Consortium (W3C) and the Open Geospatial Consortium (OGC). Because we consider different data sources as different sensors that integrate the WUIFire ontology, the SOSA and SSN ontologies are used to describe general concepts of sensors and sensor networks. SOSA provides the core relationships between sensors, observations, results, measurement objects, and measurement procedures. More detailed attributes, system descriptions and deployment features are annotated using SSN. Geographical information is represented using OGC GeoSPARQL, which supports the use of RDF to represent and query geographic spatial data in the Semantic Web [62]. It provides a generic definition of a spatial object (as an instance of the class geo:SpatialObject) that has geometry in the real world. The Dimensionally Extended Nine-Intersection Model (DE-9IM) has been used to define the relation tested by the query functions introduced in GeoSPARQL. Each query function is associated with a defining DE-9IM intersection pattern.
Knowledge Storage hosts the WUIFire ontology and also offers instance organization. We chose GraphDB as a graph database in this research as it offers several additional functions, allowing users to do more with time information. Meanwhile, GraphDB’s support for querying with spatial relationships also makes GeoSPARQL more convenient and clear to implement. Based on different modules in the WUIFire ontology, the data are converted into triples for building the instance dataset. The instance data set is stored in the Key–Value databases.
The WUIFire ontology is constructed by Protégé, the built-in predicate of equivalence class can be used to formalize domain knowledge. Ontology is stored in GraphDB. Ontotext GraphDB is a semantic database management system for knowledge discovery, semantic data management, and semantic search which complies with the W3C standard [63]. Then, we used SPARQL for the spatio-temporal semantic query. In this method, the query can perform tracking fire by retrieving all information related to the fire-spread process of the query results.
2.2. WUIFire Ontology
Following the semantic technologies we mentioned above, we propose the WUIFire ontology to represent WUI fire-related knowledge schema, which are used to fuse multi-source data and fire dynamics to track WUI fire. Due to length constraints, we have omitted cardinality restrictions in the following visualization, where classes and properties starting with a colon are defined in WUIFire.
The main purpose of WUIFire ontology is to provide a specific vocabulary, relationships, and axioms for the WUI fire domain. We have adopted a top-down approach to define the WUIFire ontology. We have organized it into three modules for illustration.
2.2.1. WUIFire System Module
To formalize the concepts and relationships of knowledge in a fire system from a structural division perspective, we refer to the Public Safety Triangle framework [64], which consists of three elements: incident, hazard-bearing body, and emergency management, which are interconnected by disastrous factors [65]. Figure 2 shows the Public Safety Triangle framework.
Correspond to Public Safety Triangle, the whole process of WUI fire system consists of three main classes: Incident, Emergency Response and Affected Entity. Their hierarchy is shown in Figure 3. Incident refers to events that cause catastrophic damage, and in WUI fires mainly refer to events that cause fires to occur, including anthropogenic causes and natural causes. Affected Entity refers to the object of the incident, including human, objects, and social systems (socio-economic operation system composed of human and objects together). Emergency Response refers to a variety of human interventions in emergency management that can prevent or reduce the spread of fire. Classes are connected to each other by corresponding object properties. For example, the relations between Incident and Affected Entity are delineated through the hasTrigger property and those of the Incident and Response Department (subclass of Emergency Response) through the hasObligation property.
The above classes and properties, as components of WUIFire System Module, describe the entire process of WUI fire from ignition to extinguishment, forming the conceptual basis of WUIFire ontology and providing abundant knowledge to support the following two modules.
2.2.2. WUIFire Monitoring Module
The WUIFire Monitoring Module is a core part of WUIFire ontology. It imports SSN, SOSA, and GeoSPARQL ontologies to define terms related to detect and monitor WUI fires.
According to the knowledge domain of wildfire monitoring, the classes and properties contained in the sensor and observation perspective of SSN and SOSA ontologies are extended. As illustrated in Figure 4, we perceive the different data sources as different sensors. Social media provides a means to collect disaster evolution data from the crowd, and they also function as a textual sensor, providing rich information about the disaster situation, and we have defined social media as a sensing sensor; cellphone signaling data show the real-time distribution of residents and tourists, which are used to assess the risk of residents and tourists, and are defined as location sensor; weather stations that provide meteorological data are regarded as meteorological sensors; and DEM, which contributes terrain data, is regarded as a terrain sensor; RS image, which is regarded as surface sensor, is used to extract the vegetation, building, water, road and other geographical features.
Based on SSN and SOSA ontologies, the specific classes are defined via the sosa:observation class from the disaster-observation perspective first. For example, as an important part of social media output, each post can be seen as an independent observation. A user who publishes a post is a subclass of the SensingSensor class, i.e., SMUser (social media user), and is distinguished by a unique identifier, which is linked to the Post class via the sosa:madeObservation property. Figure 5 illustrates a partial view of the classes and properties used for the posts to extract information. Except for the Post class, other related properties have been defined as well. The definitions of axioms in the ontology are given in Description Logic (DL) language [66] as follows:
Due to wide range of properties involved in WUI fire, domain-specific classes need to be defined by semantically extending the ssn:ObservableProperty class. By distinguishing the observed properties into stable properties and properties that require continuous observation (i.e., MonitoringProperty). A part of these axioms is listed below.
The place where the fire occurred and the surrounding environment, represented as a grid of cells. Each cell is assigned a fuel type, moisture content, and other attributes that affect the fire’s behavior, most of them being extractable from RS images. Each grid is refined as an instance of class (see explanation below), and each instance is connected to the instance of the ssn:ObservableProperty class. This facilitates follow-up of subsequent queries and analysis.
In the fusion framework, time and space are important for tracking and understanding events and its trends. In order to filter data by time scale, such as filtering out posts for a certain period of time, observations and results will be represented by combining time aspects from SOSA (provide object properties for exporting time) and extensions of GraphDB (provide relation types for filtering time). For example, when searching for social media posts within a time period, a group of functions built in GraphDB to compute the difference between two timestamps was used. ofn is the default prefix for implemented Ontotext GraphDB SPARQL functions. They take two timestamps as input and output integer literals. ofn:hoursBetween returns the duration as hours, and ofn:minutesBetween returns the duration as minutes. It is more efficient than performing an explicit mathematical operation between two literals.
As said in Section 3, GeoSPARQL is based on DE-9IM to describe the spatial relationships between geofeatures. In our study, we utilized the Boolean query functions defined for the Simple Features relation family, along with their associated DE-9IM intersection patterns. For example, when querying for properties within a geospatial area, numerous functions allow for spatial analysis between different geometry; each function accepts two geometries (geom1 and geom2) of the geometry literal (i.e., ogc:geomLiteral for any GeoSPARQL literal that describes a geometry, where ogc is the prefix for the OGC (Open Geospatial Consortium) standard.. The prefix geof stands for GeoSPARQL function. If there is an attribute corresponding to geom2 in geom1, using geof:sfContains(geomLiteral geom1, geomLiteral geom2) or geof:sfOverlaps(geomLiteral geom1, geomLiteral geom2) corresponding to Contains or Overlaps in DE-9IM, the spatial relation between the two geometry can be identified. Each function returns true if the specified relation exists between geom1 and geom2, and false otherwise. With Boolean operations, if a coordinate is given, properties in a specific grid containing the coordinate can be extracted.
2.2.3. WUIFire Spread Module
This module mainly aims at fire-spread simulation for the WUI environment and appends the semantics to the fire-spread models. Its composition is shown in Figure 6.
To describe fire spread, the module consists of three core classes: Input, Process, and Output.
The Input class includes a variety of initial properties needed for the fire-spread model, including terrain properties, meteorological properties, and surface properties, which can be obtained from the Monitoring Module above.
The Process class includes the physical or mathematical models used in the fire-spread process. The most commonly used models in China are the Wang Zhengfei model and Rothermel model. The Wang Zhengfei fire-spread model is a relatively advanced fire-spread model in China at present, which has the widest range of application in China, and its modification form is shown in Equation (1) [67].
where R: rate of speed; R0: initial fire-spread speed; Ks: fuel spatial distribution-adjusted and arrangement-adjusted index; Kr: wind-speed-adjusted factor; and Kf: slope-adjusted factor.
The Rothermel model describes the spread of fire from a macroscopic perspective [68,69]. It has a high degree of abstraction and has a wide range of application. The equation is as shown in Equation (2):
where rate of speed; reaction intensity; propagating flux ratio; wind factor; slope factor; bulk density; effective heating number; and heat of preignition.
The Output class includes output parameters after fire simulation. These parameters are treated as different geographic objects. For example, a fire incident spot belongs to the class geo:Feature and its location belongs to the class geo:Geometry; it represents the location of the fire, as represented below in DL:
By using the geo:asWKT property, each geometry indicates the geographic location of the object in WKT (Well-Known Text) string format; WKT refers to a literal value (rdfs:Literal) specifying coordinates for each geometry, e.g., the coordinate of SpotLocation is represented as follows:
Similarly, using GeoSPARQL spatial relation analysis, an instance of the SpotLocation class has a WKT value, which means that it will fall within the scope of one of the grids, whose properties can be extracted through reasoning.
Likewise, based on the fire-spread system, fire perimeters from different times through simulation are imported as instances of the FirePerimeter class (a subclass of geo:Geometry). Using spatial queries, the properties related to the burned area can be obtained. Therefore, by fusing information from various sources, data from each source can be presented simply by querying.
3. Results
3.1. Use Cases and Correspondent Datasets
This section presents WUI fire-tracking experiments with multi-source fusion through a case study, showing that the proposed framework is effective for multi-source fusion, expertise formalization, and WUI fire-spread prediction.
3.1.1. Study Area
We take Yaji Mountain Scenic as the study area. Its location is shown in Figure 7. The Yaji Mountain Scenic Area is located in Pinggu District and Miyun District, northeast of Beijing. Yaji Mountain Scenic has a cherished history and with a 8404.18 square meters complete ancient building complex, Yaji Mountain Scenic Area is a typical WUI area with 95% forest coverage. The historical buildings are surrounded by forests, and are susceptible to fire; meanwhile, as a famous scenic spot in the east of Beijing, there are several village gathering areas around the Yaji Mountain Scenic Area, with a large number of human activities. In this study, we constructed a fire scenario by simulating the spread of wildfire with reference to the Yaji Mountain Scenic Fire in 2019, and exploit our proposed data fusion framework to track the fire.
3.1.2. Correspondent Datasets
Table 1 provides the source information of the experimental sensor data.
The social media data came from posts on the Weibo platform, using crawlers to crawl Weibo posts about fires. Text-mining technology is used for text classification and entity recognition of crawled fire posts.
Because different targets have different phenological and spectral features, this study selects multi-temporal and multi-source RS image data to improve the classification accuracy, including the following: Google images in summer and winter (resolution is 0.5 m, acquisition time: 16 August 2018 and 7 March 2020), summer and winter Sentinel-2 images (resolution: 10 m, acquisition time: 21 August 2018 and 31 December 2019, respectively), and ultra-high-resolution UAV data (acquisition time: 28 September 2020).
Other data include the following: DEM data that are used to extract slope, aspect and elevation; phone signaling data, which provide hourly statistics on the location of people and crowd structure information (including permanent residents, tourists, students, the elderly, infirm groups, etc.) in 250 m grids, which indicates the distribution and number of residents and tourists; meteorological data, which comes from four meteorological monitoring stations around the Yaji Mountain scenic Area, which are monitored on an hourly scale, including wind speed, wind direction, relative humidity and temperature.
3.1.3. Data Processing
In this study, we use Weibo Advanced Search combined with a crawler and Weibo API to collect posts about Yaji Mountain Scenic Fire and extract significant content from them using deep learning.
To collect as many posts as possible concerning the Yaji Mountain Scenic Fire, we set the keywords (in Chinese) “Yaji Mountain”, (“Miyun District”) and (“forest fire”) in the form of “location” + “disaster type”, set the time period from 0:00 on 30 March 2019 to 23:55 on 31 March 2019.
Since the information generated in social media platforms during fires is highly variable and the quality of posts obtained determines the accuracy and reliability of the disaster information subsequently extracted from it, it is necessary to filter out posts that are completely unrelated to the description of the fire event as well as the posts that are related to the event but are uninformative. Specifically, we grouped posts into three categories: Irrelevant, Informational, Others. Among them, posts in the Irrelevant category have no content related to the event; the posts in the Informational category are related to the event and contain useful information; in the Others category, posts have some relevance to the fire event but no useful information can be extracted. The classification of posts is achieved by fine-tuning the training of the Bert model, which is widely used in natural language processing. For the training data of the categorization model, we manually categorize a set of posts in the Informational category to obtain the corresponding labels through crowdsourcing.
Meanwhile, in order to obtain more useful information about fires from the classified Weibo data above, we train a fire-oriented entity-recognition model based on the Bert pre-training model to automatically extract information from all the crawled Weibo post content. We have conducted a performance analysis of social media categorization and information extraction. For the categorization of posts, we obtained an F1 score of 0.912 on the test set, and for the information extraction of posts, for several categories of disaster in formation that we need to extract, we obtained an F1 score of 0.895 or more. The content of entity recognition includes five categories: fire situation, local weather, response action, fire damage and ignition reason. They are converted into triples as instances of the FireTheme class, then we make artificial discrimination of the converted FireTheme class, checking other reliable sources including trusted news outlet or official report by cross-validation to see if they confirm or refute the contradictory information. So, they are linked with the knowledge of wildfire management as mentioned above.
RS images were used to extract features including vegetation (coniferous forest, broad-leaved forest, and shrub forest), roads, and buildings. Rule-based object-oriented classification and sample-based object-oriented classification are used for target-feature extraction. The Geospatial and RS image target extraction situation in Yaji Mountain Scenic Area is shown in Figure 8.
Spatial analysis and resampling to convert the data to 30-m grid vector data. We created a converter that treated each grid as a geometry class (geo:Geometry), conforming to the GeoSPARQL format specification, and each grid is stored as an instance with unique WKT values, terrain properties, meteorological properties, surface properties, and location properties.
The fire spread simulation is carried out with reference to the fire environment of the Yaji Mountain Scenic Area on 30 March 2019. According to the fire that occurred at about 12:00 on 30 March 2019, the fire spread is simulated based on the meteorological data and feature data of that day, and constructed in the fire scenario. According to the actual situation and the monitoring data of study area, applying the Rothermel model and Huygens diffusion principle, based on the ArcEngine platform, using the C# language, a two-dimensional simulation of the spread of the fire in hourly units is achieved. The two-dimensional simulation of forest fire-spread in hours was implemented, extracting their WKT values through the gdal library and importing them as instances of the FirePerimeter class (subclass of geo:Geometry).
3.2. Analytics
Based on the framework mentioned above, this research obtained 782 Weibo posts related to Yaji Mountain Scenic Area. Figure 9 shows a timeline with the major events related to the Yaji Mountain Scenic Fire and the number of relevant Weibo posts per two hours, with examples of posts (translated by authors) taken at key moments in the event.
Because the fire started in a sparsely populated area, the first post mentioning the fire was published at 15:30, about three hours after the fire started. The lag of posts from the public also seems to have been highlighted by a limited initial response from the platform focused on the event. After this point in time, the social activity was then in line with the situation in the field. And this trend of low comment remained in place for some time until fire situation gradually worsened; this has attracted the attention of some people. The peak in posts around 18:00 on 30 March corresponds with the most critical moment in the event when weather conditions were conducive to the spread of the fire, high temperatures and strong winds. The intensity of this period included a lot of posts using “Break news” to introduce the situation of this fire. Since then, posts became fewer again and only caused another spike in social posts as the fire was put out. Between 0:00 and 8:00, very few posts were published, which is because people were sleeping and the fire in Miyun District was put out at night. In the morning, news about the fire was being widely commented upon by citizens. The posts during this period mainly reported to the public the process of replaying the whole fire incident and did little to help track the fire.
In order to track the state of the fire on a small time scale, we collated the fire simulation perimeters derived from the fire spread simulation system and integrated them into the fusion framework for processing and analysis. In addition, since the fire department took action and the fire was no longer a naturally spreading process, the simulated fire scenario should also reflect the effect of response action, and we have obtained the mitigation information based on the phone signaling data and Weibo data, and adjusted the simulation parameters of the model to exclude unreasonable circumstances, obtaining more realistic simulation results. In this case, the simulated fire perimeters up to 4 p.m. and 7 p.m. are shown in Figure 10.
Although affected by the actual data obtained on the spot, there is a certain deviation between the corrected simulation results and the actual fire scenario. We compared the results to the actual fire investigation report from the government. The report shows that the fire approached Bixia Yuanjun Temple at 6:40 p.m., and the simulation results also showed that the fire spread near the building (as shown in Figure 10). In addition, at 6:30 p.m., a report released by the state media showed that the spread of the fire could be observed at the entrance of the Yaji Mountain Scenic Area (i.e., the observation point in Figure 10), as shown in Figure 11, which also confirms that the fire spread near the scenic building area at that time.
The simulation results including the spread area and direction of fire generated by the corrected model are roughly the same as those of Yaji Mountain fire at a similar time, which shows that the simulation results of fire spread are reasonable and can be used with confidence to simulate and analyze the behavior of fire in the system and construct the fire scene in this study. Nonetheless, as is well known, fire behavior simulation is a challenging and ongoing issue in the academic field, which requires not only modeling research but real-time and accurate data input (e.g., wind, moisture, and fuel). We used the popular Rothermel fire spread model to make a simulation to construct the fire scenario, taking several kinds of variables such as meteorological data, terrain data, and forest data as input parameters. Due to the input data accuracy and acquisition problems, quantitative assessment is very difficult for a post-event analysis.
SPARQL is used to query the social media posts and observing properties around Yaji Mountain Scenic Area. By calculations of the time function, that we mentioned above, we take 4 p.m. on March 30th (4 h after ignition) as an example, where all social posts from the five minutes prior 4 p.m. were extracted. Meanwhile, the simulated fire perimeter is spatially queried with the grid containing the various properties by the functions in GeoSPARQL. The conditions of the posts are depicted in Table 2; through the query, we can obtain all the properties near 4 p.m. contained in the grid that intersect the boundary of the fire perimeter, one of which (red grid in Figure 10) is shown in Table 3.
To follow the progress, social posts provide interesting spatio-temporal information. The origin place and reason of the fire was cited several times in posts. Then, a series of follow-up emergency operations were cited during the evening. As shown in Table 2, one of the posts about the fire situation shows that topics are about “spread to Pinggu”, showing that the fire spread in the Miyun district and moved towards the Pinggu district (the fire was ignited in the Miyun district), this can be demonstrated by the fire investigation report from the government: “At 15:30, a wildfire in Nanshan, Taibaozhuang Village, Miyun, Beijing, was spreading towards Pinggu.” From Figure 7, we learn that the Pinggu district is in the southeast of the Miyun district. “spread to Pinggu”, as well, represents that the fire was spreading toward the southeast. The red grid in Figure 10 is one of the intersections between the fire perimeter and grid instances, providing different categories of properties. From Table 3, the wind-direction value in the red grid is 114.509, indicating that the wind direction at that particular time was southeast. A post about local weather cited “Strong winds”, with the wind speed values at 4 p.m. (7.02996) shown in Table 3, and another post about local weather said that “The temperature is too high.”, which was confirmed by a fire investigation report: “At 15:40, due to the high temperature and increased wind at the fire site, some of the fire lines had formed a crown fire, surface fire three-dimensional burning situation.” Additionally, posts on the theme of fire operation equally lay a solid foundation for cooperation and emergency-response coordination between different government departments and provide support for decision making. As shown in Table 2, a post about response action was “The municipal fire brigade mobilized its forces to carry out fire control.”, as also confirmed by the investigation report: “According to the fire situation, firefighters are difficult to close to fight with wind extinguishers, high-pressure water pumps to open the breakthrough gradually forward.” All examples above prove the consistency between the simulated fire scene and the actual fire and emergency situation. From the above, social media data, although they have a slight delay, can provide meaningful references including on-site fire situation and firefighting conditions that other data sources cannot provide, which is helpful for domain experts and firefighting personnel to track the wildfire situation, and facilitate their fire operation decisions. For example, in the process of emergency response in the Yaji Mountain fire, according to the Weibo information obtained, around 9 p.m. on 31 March, a post said that reburn was found near the town of Liujiadian, 2.5 km away from the western fireline in the Miyun District, while the official report showed that firefighters did not receive the command from the headquarters for the reburn area until 10 p.m. That is, the actual disposal of the fire does not take into account the actual existence of valuable information in social media; if social media and other multi-source data are combined in the actual emergency response, a better mitigation strategy can be obtained.
4. Discussion
Due to the large differences in data from different sources, the fusion of heterogeneous data sources for disasters is a complicated process that involves integrating data from various sources. Heterogeneous data sources vary significantly in terms of their quality, accuracy, and reliability. Semantic technologies have a great potential in disaster modeling.
Starting from the domain knowledge of the WUI and wildfire system, we have presented the WUIFire system module using a corresponding ontology to enrich domain knowledge from the semantic perspective. By organizing different types of fire into different sections, the Public Safety Triangle framework is utilized to carry out knowledge semantics on emergency management of the whole fire. It can improve the search of precious information that is necessary to set priorities for wildfire emergency response. Several advantages can be found by using an ontology-based knowledge-modeling approach in the WUI fire domain. For example, it can effectively represent multi-source expertise in the form of triples, which can facilitate the management of WUI fire scenarios. Also, it enables the refinement and multi-perspective representation of domain-specific information. In addition, the approach enables effective query and intelligent inference of implicit information by taking advantage of semantic queries and inference mechanisms.
It is of interest to regard various data sources as different sensors in a flexible representation. We reviewed suitable ontologies, vocabularies, and data schemes, and suggested an appropriate integration of existing concepts. GeoSPARQL is used to semanticize geospatial information. SSN and SOSA are used to classify data from various data sources, that is, treat data sources as different sensors for fire monitoring. Compared with traditional methods using RS images to detect wildfires, the availability of social media data with real-time information published by the public could support tracking wildfires. Also, social media content also reflect the impact of the public, which supports social sensing for assessment [70]. It can be beneficial to crisis managers and responders to fulfill their data needs by providing them with valuable information on a natural hazard. Social media, as sensors generating in situ data with short text that provide a more diverse and personalized perspective on wildfires, can be further utilized [71]. However, there are still many shortcomings in using social media data for multi-source data fusion. One significant pattern of social media usage during crisis is that only users in affected areas tend to post information on social media; hence, the amount of social media information will be influenced by the population and economic development of the affected area. Another pattern is that different types of disasters have different temporal patterns related to the evolution of social media content and the number of posts [72]. For example, floods, earthquakes, rainstorms, and hurricanes are often easily observed and predicted, which can usually be posted at all stages of the disaster, while fires, which are usually small, only have a few posts that are published about them, with most of the information mainly dependent on news [73].
Such issues have also emerged in our experiment; the potential of our proposed model cannot be fully exploited because the Yaji Mountain Scenic fire only lasted for a day and did not cause any casualties. Furthermore, Yaji Mountain Scenic Area is far away from the metropolitan area, and there are few surrounding developed residential areas and social activities are not active; so, this number of posts is relatively low compared to other events. Asynchronous fluxes may be common and completely independent by the event itself, that is, social media data cannot fully represent the trend of an event. For example, in Figure 9, the decrease in the number of night-time posts is due to either the reduction in actual fire intensity or because people sleep at night and needs to be judged by the supplement of other data sources. Similarly, for data from different sources, the information presented may be contradictory, and it also needs cross-validation to verify whether it is true or false. In our experiment, an official report is regarded as the primary credible source of reference.
Although its effectiveness was limited when validated in the case above, it can still provide considerable information for decision makers to minimize the adverse effects of WUI fire on ecosystems and communities, predict fire behavior based on fire spread model, and use multi-source information to track WUI fire. It is of great significance to prevent and resolve major fire risks by dynamically tracking and managing fire risks according to changing natural and social environment, and adjusting and changing risk response policies, planning and management in time.
5. Conclusions
Sensor fusion is not a novel topic, and using social media data has been a widely employed approach in many different contexts. However, the currently existing work by researchers on the integration of heterogeneous data sources for fire monitoring and management is not sufficient. The goal of this paper is to propose a coherent fusion framework for the integration of many different technologies to track wildfires happening in WUI areas, and how we combine these with multi-source data including instant social media data and earth-observation data to provide more specific and accurate information to track fires.
We use semantic web technologies, constructing an ontology framework on wildfires (i.e., the WUIFire ontology), which formalizes domain expertise, and with the help of ontology-based query and reasoning, a flexible semantic model enables the integration of other knowledge from related domains, and the query and management of sensor data becomes more convenient and intelligent. It provides a basis not only for analyzing the WUI fire track process, but also a basis for investigating the social sensing of WUI fires. Finally, we apply the framework to the 2019 Yaji Mountain Scenic Fire in Beijing, China. Through the object information identified by remote sensing, the information extracted by Weibo and the fire perimeters constructed by fire-spread simulation, the knowledge-base service was constructed and analysis through semantic query was carried out to assist in emergency management better.
However, there are still some limitations. Addressing these limitations may require further research and development of new technologies and methods. First, since the construction of the ontological framework is related to personal understanding and the description of disaster knowledge, it is inevitable that there are mistakes and omissions. In future research, the ontological framework can be enriched by further summarizing WUI fire knowledge through communication with domain experts. Then, the data still need to be processed before they can be imported into the conceptual model, which cannot be updated in real time and has a certain lag, and future improvements are needed to meet the demand for real-time monitoring.
Finally, the application of social media data is still a great challenge; how to use the pictures, videos and other multimedia information in social media to extract the information in fire emergency more comprehensively and systematically will remain a difficult point and trend for future research. In the future, we will examine the use of ontologies as the basis for the knowledge base with practical applications, and writing rule sentences with SWRL (Semantic Web Rule Language) of fire knowledge and fire dynamics to build a comprehensive framework and achieve more complex query and reasoning based on WUI fires.
Author Contributions
Conceptualization, S.Z., X.M. and W.Z.; methodology, S.Z., W.Z., X.M. and F.N.; software, X.M.; validation, W.Z., X.M. and S.Z.; formal analysis, W.Z., X.M., F.N. and S.Z.; investigation, W.Z. and F.N.; resources, X.M., X.F., S.O. and S.Z.; data curation, W.Z., X.M. and S.Z.; writing—original draft preparation, W.Z., S.Z., X.M. and F.N.; writing—review and editing, S.Z., W.Z., X.M., F.N., X.F. and S.O.; visualization, W.Z. and F.N.; supervision, X.M. and S.Z.; project administration, X.M., S.Z. and X.F.; funding acquisition, S.Z. All authors have read and agreed to the published version of the manuscript.
Funding
This research was funded by National Natural Science Foundation of China (Grant no. 72174031) and the Innovation Project of Beijing Academy of Science and Technology (Project no. 23CA001-03, title: key technologies of space-ground synergic sensing for improving fire safety resilience of transmission line forest corridors).
Data Availability Statement
Data sharing not applicable.
Acknowledgments
The authors would like to gratefully acknowledge data providers, and the contribution of Qin Jiang, a graduate at Capital Normal University.
Conflicts of Interest
The authors declare no conflict of interest.
References
- Bowman, D.M.J.S.; Balch, J.K.; Artaxo, P.; Bond, W.J.; Carlson, J.M.; Cochrane, M.A.; D’Antonio, C.M.; DeFries, R.S.; Doyle, J.C.; Harrison, S.P.; et al. Fire in the Earth System. Science 2009, 324, 481–484. [Google Scholar] [CrossRef] [PubMed]
- Ager, A.A.; Vaillant, N.M.; Finney, M.A.; Preisler, H.K. Analyzing Wildfire Exposure and Source–Sink Relationships on a Fire Prone Forest Landscape. For. Ecol. Manag. 2012, 267, 271–283. [Google Scholar] [CrossRef]
- Moritz, M.A.; Batllori, E.; Bradstock, R.A.; Gill, A.M.; Handmer, J.; Hessburg, P.F.; Leonard, J.; McCaffrey, S.; Odion, D.C.; Schoennagel, T.; et al. Learning to Coexist with Wildfire. Nature 2014, 515, 58–66. [Google Scholar] [CrossRef] [PubMed]
- Depietri, Y.; Orenstein, D.E. Managing Fire Risk at the Wildland-Urban Interface Requires Reconciliation of Tradeoffs between Regulating and Cultural Ecosystem Services. Ecosyst. Serv. 2020, 44, 101108. [Google Scholar] [CrossRef]
- Santasusagna Riu, A.; Úbeda Cartañá, X. Urban Interfaces: Combining Social and Ecological Approaches. Sci. Total Environ. 2021, 772, 145625. [Google Scholar] [CrossRef]
- Chas-Amil, M.-L.; Nogueira-Moure, E.; Prestemon, J.P.; Touza, J. Spatial Patterns of Social Vulnerability in Relation to Wildfire Risk and Wildland-Urban Interface Presence. Landsc. Urban Plan. 2022, 228, 104577. [Google Scholar] [CrossRef]
- Calviño-Cancela, M.; Chas-Amil, M.L.; García-Martínez, E.D.; Touza, J. Wildfire Risk Associated with Different Vegetation Types within and Outside Wildland-Urban Interfaces. For. Ecol. Manag. 2016, 372, 1–9. [Google Scholar] [CrossRef] [Green Version]
- Radeloff, V.C.; Helmers, D.P.; Kramer, H.A.; Mockrin, M.H.; Alexandre, P.M.; Bar-Massada, A.; Butsic, V.; Hawbaker, T.J.; Martinuzzi, S.; Syphard, A.D.; et al. Rapid Growth of the US Wildland-Urban Interface Raises Wildfire Risk. Proc. Natl. Acad. Sci. USA 2018, 115, 3314–3319. [Google Scholar] [CrossRef] [Green Version]
- Bento-Gonçalves, A.; Vieira, A. Wildfires in the Wildland-Urban Interface: Key Concepts and Evaluation Methodologies. Sci. Total Environ. 2020, 707, 135592. [Google Scholar] [CrossRef]
- Badia, A.; Pallares-Barbera, M.; Valldeperas, N.; Gisbert, M. Wildfires in the Wildland-Urban Interface in Catalonia: Vulnerability Analysis Based on Land Use and Land Cover Change. Sci. Total Environ. 2019, 673, 184–196. [Google Scholar] [CrossRef]
- Sarricolea, P.; Serrano-Notivoli, R.; Fuentealba, M.; Hernández-Mora, M.; de la Barrera, F.; Smith, P.; Meseguer-Ruiz, Ó. Recent Wildfires in Central Chile: Detecting Links between Burned Areas and Population Exposure in the Wildland Urban Interface. Sci. Total Environ. 2020, 706, 135894. [Google Scholar] [CrossRef]
- Li, J.; Liu, Z.; Lei, X.; Wang, L. Distributed Fusion of Heterogeneous Remote Sensing and Social Media Data: A Review and New Developments. Proc. IEEE 2021, 109, 1350–1363. [Google Scholar] [CrossRef]
- Yin, J.; Lampert, A.; Cameron, M.; Robinson, B.; Power, R. Using Social Media to Enhance Emergency Situation Awareness. IEEE Intell. Syst. 2012, 27, 52–59. [Google Scholar] [CrossRef]
- Riccardi, M.T. The Power of Crowdsourcing in Disaster Response Operations. Int. J. Disaster Risk Reduct. 2016, 20, 123–128. [Google Scholar] [CrossRef]
- Simon, T.; Goldberg, A.; Adini, B. Socializing in Emergencies—A Review of the Use of Social Media in Emergency Situations. Int. J. Inf. Manag. 2015, 35, 609–619. [Google Scholar] [CrossRef]
- Slavkovikj, V.; Verstockt, S.; Van Hoecke, S.; Van de Walle, R. Review of Wildfire Detection Using Social Media. Fire Saf. J. 2014, 68, 109–118. [Google Scholar] [CrossRef]
- Huang, Q.; Cervone, G.; Zhang, G. A Cloud-Enabled Automatic Disaster Analysis System of Multi-Sourced Data Streams: An Example Synthesizing Social Media, Remote Sensing and Wikipedia Data. Comput. Environ. Urban Syst. 2017, 66, 23–37. [Google Scholar] [CrossRef]
- Akbar, A.; Kousiouris, G.; Pervaiz, H.; Sancho, J.; Ta-Shma, P.; Carrez, F.; Moessner, K. Real-Time Probabilistic Data Fusion for Large-Scale IoT Applications. IEEE Access 2018, 6, 10015–10027. [Google Scholar] [CrossRef]
- Ballari, D.; Wachowicz, M.; Bregt, A.K.; Manso-Callejo, M. A Mobility Constraint Model to Infer Sensor Behaviour in Forest Fire Risk Monitoring. Comput. Environ. Urban Syst. 2012, 36, 81–95. [Google Scholar] [CrossRef]
- Wang, H.; Skau, E.; Krim, H.; Cervone, G. Fusing Heterogeneous Data: A Case for Remote Sensing and Social Media. IEEE Trans. Geosci. Remote Sens. 2018, 56, 6956–6968. [Google Scholar] [CrossRef]
- Ying, L.; Shen, Z.; Yang, M.; Piao, S. Wildfire Detection Probability of MODIS Fire Products under the Constraint of Environmental Factors: A Study Based on Confirmed Ground Wildfire Records. Remote Sens. 2019, 11, 3031. [Google Scholar] [CrossRef] [Green Version]
- Marcos, B.; Gonçalves, J.; Alcaraz-Segura, D.; Cunha, M.; Honrado, J.P. Improving the Detection of Wildfire Disturbances in Space and Time Based on Indicators Extracted from MODIS Data: A Case Study in Northern Portugal. Int. J. Appl. Earth Obs. Geoinf. 2019, 78, 77–85. [Google Scholar] [CrossRef]
- Chen, R.; Li, X.; Hu, Y.; Wen, C.; Peng, L. Road Extraction From Remote Sensing Images in Wildland-Urban Interface Areas. IEEE Geosci. Remote Sens. Lett. 2022, 19, 3028468. [Google Scholar] [CrossRef]
- de Albuquerque, J.P.; Herfort, B.; Brenning, A.; Zipf, A. A Geographic Approach for Combining Social Media and Authoritative Data towards Identifying Useful Information for Disaster Management. Int. J. Geogr. Inf. Sci. 2015, 29, 667–689. [Google Scholar] [CrossRef]
- Li, J.; He, Z.; Plaza, J.; Li, S.; Chen, J.; Wu, H.; Wang, Y.; Liu, Y. Social Media: New Perspectives to Improve Remote Sensing for Emergency Response. Proc. IEEE 2017, 105, 1900–1912. [Google Scholar] [CrossRef]
- Tang, J.; Yang, S.; Wang, W. Social Media-Based Disaster Research: Development, Trends, and Obstacles. Int. J. Disaster Risk Reduct. 2021, 55, 102095. [Google Scholar] [CrossRef]
- Imran, M.; Ofli, F.; Caragea, D.; Torralba, A. Using AI and Social Media Multimodal Content for Disaster Response and Management: Opportunities, Challenges, and Future Directions. Inf. Process. Manag. 2020, 57, 102261. [Google Scholar] [CrossRef]
- Phengsuwan, J.; Shah, T.; James, P.; Thakker, D.; Barr, S.; Ranjan, R. Ontology-Based Discovery of Time-Series Data Sources for Landslide Early Warning System. Computing 2020, 102, 745–763. [Google Scholar] [CrossRef] [Green Version]
- Kryvasheyeu, Y.; Chen, H.; Obradovich, N.; Moro, E.; Van Hentenryck, P.; Fowler, J.; Cebrian, M. Rapid Assessment of Disaster Damage Using Social Media Activity. Sci. Adv. 2016, 2, e1500779. [Google Scholar] [CrossRef] [Green Version]
- Schnebele, E.; Cervone, G. Improving Remote Sensing Flood Assessment Using Volunteered Geographical Data. Nat. Hazards Earth Syst. Sci. 2013, 13, 669–677. [Google Scholar] [CrossRef] [Green Version]
- Cervone, G.; Sava, E.; Huang, Q.; Schnebele, E.; Harrison, J.; Waters, N. Using Twitter for Tasking Remote-Sensing Data Collection and Damage Assessment: 2013 Boulder Flood Case Study. Int. J. Remote Sens. 2016, 37, 100–124. [Google Scholar] [CrossRef]
- El Sayed, M.A.; Abo-Sinna, M.A. A Novel Approach for Fully Intuitionistic Fuzzy Multi-Objective Fractional Transportation Problem. Alex. Eng. J. 2021, 60, 1447–1463. [Google Scholar] [CrossRef]
- Ge, X.; Yang, Y.; Peng, L.; Chen, L.; Li, W.; Zhang, W.; Chen, J. Spatio-Temporal Knowledge Graph Based Forest Fire Prediction with Multi Source Heterogeneous Data. Remote Sens. 2022, 14, 3496. [Google Scholar] [CrossRef]
- El Sayed, M.A.; Farahat, F.A.; Elsisy, M.A. A Novel Interactive Approach for Solving Uncertain Bi-Level Multi-Objective Supply Chain Model. Comput. Ind. Eng. 2022, 169, 108225. [Google Scholar] [CrossRef]
- Liu, X.; Liu, Z.; Liu, Y.; Tian, J. Integration of a Geo-Ontology-Based Knowledge Model and Spatial Analysis into Emergency Response for Geologic Hazards. Nat. Hazards 2021, 108, 1489–1514. [Google Scholar] [CrossRef]
- Hysa, A. Indexing the Vegetated Surfaces within WUI by Their Wildfire Ignition and Spreading Capacity, a Comparative Case from Developing Metropolitan Areas. Int. J. Disaster Risk Reduct. 2021, 63, 102434. [Google Scholar] [CrossRef]
- Abo El Ezz, A.; Boucher, J.; Cotton-Gagnon, A.; Godbout, A. Framework for Spatial Incident-Level Wildfire Risk Modelling to Residential Structures at the Wildland Urban Interface. Fire Saf. J. 2022, 131, 103625. [Google Scholar] [CrossRef]
- Storey, M.A.; Bedward, M.; Price, O.F.; Bradstock, R.A.; Sharples, J.J. Derivation of a Bayesian Fire Spread Model Using Large-Scale Wildfire Observations. Environ. Model. Softw. 2021, 144, 105127. [Google Scholar] [CrossRef]
- Olynk Widmar, N.; Rash, K.; Bir, C.; Bir, B.; Jung, J. The Anatomy of Natural Disasters on Online Media: Hurricanes and Wildfires. Nat. Hazards 2022, 110, 961–998. [Google Scholar] [CrossRef]
- Yue, Y.; Dong, K.; Zhao, X.; Ye, X. Assessing Wild Fire Risk in the United States Using Social Media Data. J. Risk Res. 2021, 24, 972–986. [Google Scholar] [CrossRef]
- Tavra, M.; Racetin, I.; Peroš, J. The Role of Crowdsourcing and Social Media in Crisis Mapping: A Case Study of a Wildfire Reaching Croatian City of Split. Geoenviron. Disasters 2021, 8, 10. [Google Scholar] [CrossRef]
- Manzello, S.L.; Suzuki, S. The Importance of Combustion Science to Unravel Complex Processes for Informal Settlement Fires, Urban Fires, and Wildland-Urban Interface (WUI) Fires. Fuel 2022, 314, 122805. [Google Scholar] [CrossRef]
- Gwynne, S.; Ronchi, E.; Bénichou, N.; Kinateder, M.; Kuligowski, E.; Gomaa, I.; Adelzadeh, M. Modeling and Mapping Dynamic Vulnerability to Better Assess WUI Evacuation Performance. Fire Mater. 2019, 43, 644–660. [Google Scholar] [CrossRef]
- Valero, M.M.; Jofre, L.; Torres, R. Multifidelity Prediction in Wildfire Spread Simulation: Modeling, Uncertainty Quantification and Sensitivity Analysis. Environ. Model. Softw. 2021, 141, 105050. [Google Scholar] [CrossRef]
- Liu, N.; Lei, J.; Gao, W.; Chen, H.; Xie, X. Combustion Dynamics of Large-Scale Wildfires. Proc. Combust. Inst. 2021, 38, 157–198. [Google Scholar] [CrossRef]
- Khadir, A.C.; Aliane, H.; Guessoum, A. Ontology Learning: Grand Tour and Challenges. Comput. Sci. Rev. 2021, 39, 100339. [Google Scholar] [CrossRef]
- Pai, F.-P.; Yang, L.-J.; Chung, Y.-C. Multi-Layer Ontology Based Information Fusion for Situation Awareness. Appl. Intell. 2017, 46, 285–307. [Google Scholar] [CrossRef]
- Onorati, T.; Malizia, A.; Diaz, P.; Aedo, I. Modeling an Ontology on Accessible Evacuation Routes for Emergencies. Expert Syst. Appl. 2014, 41, 7124–7134. [Google Scholar] [CrossRef] [Green Version]
- Liu, J.; Dong, Y.; Liu, Z.; Chen, D. Applying Ontology Learning and Multi-Objective Ant Colony Optimization Method for Focused Crawling to Meteorological Disasters Domain Knowledge. Expert Syst. Appl. 2022, 198, 116741. [Google Scholar] [CrossRef]
- Aziz, A.; Ahmed, S.; Khan, F.I. An Ontology-Based Methodology for Hazard Identification and Causation Analysis. Process Saf. Environ. Prot. 2019, 123, 87–98. [Google Scholar] [CrossRef]
- Jung, C.-T.; Sun, C.-H.; Yuan, M. An Ontology-Enabled Framework for a Geospatial Problem-Solving Environment. Comput. Environ. Urban Syst. 2013, 38, 45–57. [Google Scholar] [CrossRef]
- RDF 1.1 XML Syntax. Available online: https://www.w3.org/TR/rdf-syntax-grammar/ (accessed on 19 May 2023).
- OWL 2 Web Ontology Language. Available online: https://www.w3.org/TR/2012/REC-owl2-overview-20121211/ (accessed on 19 May 2023).
- SPARQL 1.1 Query Language. Available online: https://www.w3.org/TR/sparql11-query/ (accessed on 19 May 2023).
- Kyzirakos, K.; Karpathiotakis, M.; Garbis, G.; Nikolaou, C.; Bereta, K.; Papoutsis, I.; Herekakis, T.; Michail, D.; Koubarakis, M.; Kontoes, C. Wildfire Monitoring Using Satellite Images, Ontologies and Linked Geospatial Data. J. Web Semant. 2014, 24, 18–26. [Google Scholar] [CrossRef] [Green Version]
- Roda, F.; Musulin, E. An Ontology-Based Framework to Support Intelligent Data Analysis of Sensor Measurements. Expert Syst. Appl. 2014, 41, 7914–7926. [Google Scholar] [CrossRef]
- Scheuer, S.; Haase, D.; Meyer, V. Towards a Flood Risk Assessment Ontology—Knowledge Integration into a Multi-Criteria Risk Assessment Approach. Comput. Environ. Urban Syst. 2013, 37, 82–94. [Google Scholar] [CrossRef]
- Li, R.; Mo, T.; Yang, J.; Jiang, S.; Li, T.; Liu, Y. Ontologies-Based Domain Knowledge Modeling and Heterogeneous Sensor Data Integration for Bridge Health Monitoring Systems. IEEE Trans. Ind. Inform. 2021, 17, 321–332. [Google Scholar] [CrossRef]
- Masa, P.; Meditskos, G.; Kintzios, S.; Vrochidis, S.; Kompatsiaris, I. Ontology-Based Modelling and Reasoning for Forest Fire Emergencies in Resilient Societies. In Proceedings of the 12th Hellenic Conference on Artificial Intelligence, Corfu, Greece, 7 September 2022; pp. 1–9. [Google Scholar]
- Bitencourt, K.; Araújo Durão, F.; Mendonça, M.; Laique Bomfim De Souza Santana, L. An Ontological Model for Fire Emergency Situations. IEICE Trans. Inf. Syst. 2018, E101.D, 108–115. [Google Scholar] [CrossRef] [Green Version]
- Semantic Sensor Network Ontology. Available online: https://w3c.github.io/sdw/ssn/ (accessed on 21 May 2023).
- Almobydeen, S.B.; Viqueira, J.R.R.; Lama, M. GeoSPARQL Query Support for Scientific Raster Array Data. Comput. Geosci. 2022, 159, 105023. [Google Scholar] [CrossRef]
- Ontotext GraphDB. Available online: https://www.ontotext.com/products/graphdb/ (accessed on 4 May 2023).
- Fan, W.; Liu, Y.; Weng, W. Triangular Framework and ‘4 + 1’ Methodology for Public Security Science and Technology. Sci. Technol. Rev. 2009, 27, 1–3. [Google Scholar]
- Zhong, S.; Fang, Z.; Zhu, M.; Huang, Q. A Geo-Ontology-Based Approach to Decision-Making in Emergency Management of Meteorological Disasters. Nat. Hazards 2017, 89, 531–554. [Google Scholar] [CrossRef]
- Krötzsch, M.; Simancik, F.; Horrocks, I. Description Logics. IEEE Intell. Syst. 2014, 29, 12–19. [Google Scholar] [CrossRef]
- Wang, Z.F. General Forest Fire Weather Ranks System. J. Nat. Disasters 1992, 1, 39–45. [Google Scholar]
- Rothermel, R.C. A Mathematical Model for Predicting Fire Spread in Wildland Fuels; Intermountain Forest & Range Experiment Station, Forest Service: Ogden, UT, USA, 1972; Volume 115.
- Andrews, P.L. The Rothermel Surface Fire Spread Model and Associated Developments: A Comprehensive Explanation; U.S. Department of Agriculture, Forest Service, Rocky Mountain Research Station: Ft. Collins, CO, USA, 2018; p. RMRS-GTR-371.
- Zhang, C.; Fan, C.; Yao, W.; Hu, X.; Mostafavi, A. Social Media for Intelligent Public Information and Warning in Disasters: An Interdisciplinary Review. Int. J. Inf. Manag. 2019, 49, 190–207. [Google Scholar] [CrossRef]
- Mantsis, D.F.; Bakratsas, M.; Andreadis, S.; Karsisto, P.; Moumtzidou, A.; Gialampoukidis, I.; Karppinen, A.; Vrochidis, S.; Kompatsiaris, I. Multimodal Fusion of Sentinel 1 Images and Social Media Data for Snow Depth Estimation. IEEE Geosci. Remote Sens. Lett. 2022, 19, 3031866. [Google Scholar] [CrossRef]
- Fang, J.; Hu, J.; Shi, X.; Zhao, L. Assessing Disaster Impacts and Response Using Social Media Data in China: A Case Study of 2016 Wuhan Rainstorm. Int. J. Disaster Risk Reduct. 2019, 34, 275–282. [Google Scholar] [CrossRef]
- Gao, X.; Yu, W.; Rong, Y.; Zhang, S. Ontology-Based Social Media Analysis for Urban Planning. In Proceedings of the 2017 IEEE 41st Annual Computer Software and Applications Conference (COMPSAC), Turin, Italy, 4–8 July 2017; pp. 888–896. [Google Scholar]
Figure 1.
Architecture of fusion framework.

Figure 2.
Framework of the Public Safety Triangle.

Figure 3.
Core class hierarchy of the System Module with Protégé Editor.

Figure 4.
Hierarchy for the system and sensors based on the SSN and SOSA ontologies.

Figure 5.
Core classes and properties used for the posts.

Figure 6.
Composition of WUIFire spread module.

Figure 7.
The location of the study area.

Figure 8.
Geospatial and RS image target extraction schematic map.

Figure 9.
Chronology of the Yaji Mountain scenic Fire, number of related Weibo posts per 2 h and selected posts contents.
Figure 9.
Chronology of the Yaji Mountain scenic Fire, number of related Weibo posts per 2 h and selected posts contents.

Figure 10.
Fire perimeter obtained from the spread simulation to 4 p.m. and 7 p.m.

Figure 11.
Fire situation at 6:40 p.m. at the entrance of Yaji Mountain Scenic Area from official report. (Signs in various languages on the right side point to the entrance of the Scenic Area) https://news.sina.cn/sh/2019-03-30/detail-ihtxyzsm1871507.d.html (accessed on 28 July 2023).
Figure 11.
Fire situation at 6:40 p.m. at the entrance of Yaji Mountain Scenic Area from official report. (Signs in various languages on the right side point to the entrance of the Scenic Area) https://news.sina.cn/sh/2019-03-30/detail-ihtxyzsm1871507.d.html (accessed on 28 July 2023).


Table 1.
Source information from experimental sensor data.
| Sensor | Data | Sources |
|---|---|---|
| Sensing | Weibo post | |
| Surface | RS Image | Sentinel-2 and UAV Images |
| Meteorological | Weather Data | Meteorological Administration |
| Terrain | DEM | National Geomatics Center of China (NGCC) |
| Location | Phone Signaling Data | China Unicom Big Data |
Table 2.
Set the time for the query result of the post at 4 p.m.
| sosa:resultTime | :hasValue | :FireTheme |
|---|---|---|
| 2019-03-30T15:56:00 | “Strong winds” | :LocalWeather |
| 2019-03-30T15:58:00 | “The municipal fire brigade mobilized its forces to carry out fire control.” | :ResponseAction |
| 2019-03-30T15:58:00 | “The temperature is too high.” | :LocalWeather |
| 2019-03-30T15:59:00 | “Spread to Pinggu” | :FireSituation |
Table 3.
Relevant properties of the marginal area near 4.p.m. (red grid of Figure 10).
Table 3.
Relevant properties of the marginal area near 4.p.m. (red grid of Figure 10).
| Category | Property Name | :hasValue |
|---|---|---|
| Meteorological | :Aspect | 59 |
| :Slope | 13 | |
| :WindScale16 | 4.38419 | |
| :WindSpeed16 | 7.02996 | |
| :WindDirection16 | 114.509 | |
| :RelativeHumidity16 | 11.9688 | |
| Location | :PersonNumber16 | 0 |
| Surface | :Landuse | coniferous forest |
Disclaimer/Publisher’s Note: The statements, opinions and data contained in all publications are solely those of the individual author(s) and contributor(s) and not of MDPI and/or the editor(s). MDPI and/or the editor(s) disclaim responsibility for any injury to people or property resulting from any ideas, methods, instructions or products referred to in the content. |
© 2023 by the authors. Licensee MDPI, Basel, Switzerland. This article is an open access article distributed under the terms and conditions of the Creative Commons Attribution (CC BY) license (https://creativecommons.org/licenses/by/4.0/).
Share and Cite
MDPI and ACS Style
Zhong, W.; Mei, X.; Niu, F.; Fan, X.; Ou, S.; Zhong, S. Fusing Social Media, Remote Sensing, and Fire Dynamics to Track Wildland-Urban Interface Fire. Remote Sens. 2023, 15, 3842. https://doi.org/10.3390/rs15153842
AMA Style
Zhong W, Mei X, Niu F, Fan X, Ou S, Zhong S. Fusing Social Media, Remote Sensing, and Fire Dynamics to Track Wildland-Urban Interface Fire. Remote Sensing. 2023; 15(15):3842. https://doi.org/10.3390/rs15153842
Chicago/Turabian StyleZhong, Weiqi, Xin Mei, Fei Niu, Xin Fan, Shengya Ou, and Shaobo Zhong. 2023. "Fusing Social Media, Remote Sensing, and Fire Dynamics to Track Wildland-Urban Interface Fire" Remote Sensing 15, no. 15: 3842. https://doi.org/10.3390/rs15153842
Note that from the first issue of 2016, this journal uses article numbers instead of page numbers. See further details here.