
Mapping Slums in Mumbai, India, Using Sentinel-2 Imagery: Evaluating Composite Slum Spectral Indices (CSSIs)

1
Key Laboratory for Geographical Process Analysis & Simulation of Hubei Province, Central China Normal University, Wuhan 430079, China
2
College of Urban and Environmental Sciences, Central China Normal University, Wuhan 430079, China
3
State Key Laboratory of Resources and Environmental Information System, Institute of Geographic Sciences and Natural Resources Research, Chinese Academy of Sciences, Beijing 100101, China
4
College of Resources and Environment, University of Chinese Academy of Sciences, Beijing 100049, China
5
School of Resources and Environmental Engineering, Wuhan University of Technology, Wuhan 430070, China
*
Author to whom correspondence should be addressed.
Remote Sens. 2023, 15(19), 4671; https://doi.org/10.3390/rs15194671
Submission received: 27 August 2023
/
Revised: 18 September 2023
/
Accepted: 21 September 2023
/
Published: 23 September 2023
(This article belongs to the Special Issue Earth Observation and Citizen Contributed Data for Urban Sustainability)
Abstract
:Accurate geographic data of slums are important for handling urban poverty issues. Previous slum mapping studies using high-resolution or very-high-resolution (HR/VHR) remotely sensed (RS) images are commonly not suitable for city-wide scale tasks. This study aims to efficiently generate a slum map on a city-wide scale using freely accessed multispectral medium-resolution (MR) Sentinel-2 images. Composite slum spectral indices (CSSIs) were initially proposed based on the shapes of spectral profiles of slums and nonslums and directly represent slum characteristics. Specifically, CSSI-1 denotes the normalized difference between the shortwave infrared bands and the red edge band, while CSSI-2 denotes the normalized difference between the blue band and the green band. Furthermore, two methods were developed to test the effectiveness of CSSIs on slum mapping, i.e., the threshold-based method and the machine learning (ML)-based method. Experimental results show that the threshold-based method and the ML-based method achieve intersection over unions (IoU) of 43.89% and 54.45% in Mumbai, respectively. The accuracies of our methods are comparable to or even higher than the accuracies reported by existing methods using HR/VHR images and transfer learning. The threshold-based method exhibits a promising performance in mapping slums larger than 5 ha, while the ML-based method refines mapping accuracies for slum pockets smaller than 5 ha. The threshold-based method and the ML-based method produced the slum map in Mumbai in 2 and 28 min, respectively. Our methods are suitable for rapid large-area slum mapping owing to the high data availability of Sentinel-2 images and high computational efficiency.
1. Introduction
Rapid growth of the urban population has occurred as global urbanization progress has accelerated. It is reported by the United Nations [1] that the proportion of the urban population to the total population will reach 60% in 2030. In developing countries, the problems of poverty and imbalanced development have increased as a result of management deficiencies and excessive urbanization so that slums, also known as “informal settlements”, appear and expand [2]. Sustainable Development Goals 11.1 (SDG 11.1) aim to ensure access for all humanity to adequate, safe and affordable living conditions and upgrade slums by 2030 [3]. Quite a few organizations, including official government agencies and nongovernmental organizations (NGOs), engage in slum surveys and slum cartography to assist in slum upgrades [4,5,6]. However, traditional survey activities have high labor and time costs. It is inevitable for these methods to cause discrepancies in results owing to the acknowledged gaps among experts and investigators [7].
Remotely sensed (RS) imagery has become a primary data source to obtain geographic information on slums. An increasing number of researchers [4,8,9,10] are working on slum mapping using remotely sensed imagery. Distinct physical characteristics are vital to extract slums from RS imagery [11,12]. For the most part, buildings are low and tightly packed in slum communities with fewer paved roads and green space [13]. Hence, there are fewer building shadows and vegetation pixels from RS imagery inside slum patches that have uniform textures. Slums are built with materials different from those used in other man-made structures, such as formal settlements. These differences are the staple reference information to distinguish slums from backgrounds in RS imagery using spectral and textural features [14,15]. Apparently, RS-based methods cost less and gain more real-time data than traditional field investigations [16].
High-resolution or very-high-resolution (HR/VHR) remotely sensed images have been widely applied for slum mapping in existing studies [17,18,19]. With high spatial resolution and abundant texture details, HR/VHR images have the advantage of retrieving manual objects such as slums. There are many methods to extract slums from HR/VHR imagery, such as visual image interpretation, textural-based analysis [20,21,22,23], object-oriented analysis [24,25,26,27], machine learning [7,28,29] or deep learning [18,30,31,32]. The visual image interpretation approach obtains high-accuracy slums, but consumes much time and labor. Texture-based analysis has a desired effect on mapping slums in consideration of their dense building structures [9]; however, extra information, such as spectral features, should be taken into account to improve accuracy. The object-oriented analysis approach outperforms the pixel-based methods with a higher level of automation. For example, Alrasheedi, K.G. et al. [12] combined object-oriented analysis and expert knowledge to map slums in Riyadh City, Saudi Arabia, and obtained an overall accuracy of 94%. Williams, T.K.-A. et al. [33] used object-oriented analysis and an ML classifier to generate slum maps with an overall accuracy of 93.5% based on VHR imagery. However, the effectiveness of object-oriented analysis is influenced by the manually set scale parameters and the classification rule sets. Deep learning methods have been widely developed and exploited in RS image analysis [34,35] and gain high accuracy universally. However, these deep learning methods face the problems of low operation efficiency and high demand for samples. For instance, Verma et al. [36] used a CNN model to predict slums in Mumbai, and their prediction task took 8 h on the VHR/HR imagery. Existing studies using HR/VHR imagery [8,12,13,23,37] typically extract slums in a small portion of a city. These studies have difficulties in large areas, such as in city-wide-scale, national-scale or even global-scale mapping tasks, owing to the small ground swath and high prices of such images. Subcity-scale studies only work on bits of slum patches [16], which has a limit in assisting slum upgrading programs over a city, whereas a city-wide slum map is more sustainable than piecemeal improvements [38].
Medium-resolution (MR) imagery has obvious priorities in large-area slum mapping and dynamic monitoring due to its high-rate revisit, free access and global coverage [39,40]. Given that MR images have coarser spatial resolutions than HR/VHR images, a few researchers [36,41] used transfer learning to extract slums by conducting predictions on MR images with a deep learning model pretrained on HR/VHR images. For instance, Wrum, M. et al. [41] used a fully convolutional network (FCN) pretrained on QuickBird (0.5 m resolution) to extract slums in Sentinel-2 images (10 m resolution) and TerraSAR-X data (6 m resolution). They found that transfer learning increased the accuracy of slum maps for Sentinel-2 images. In addition, Verma, D. et al. [36] also employed a transfer learning approach to map slums in MR imagery via a pretrained convolutional neural network (CNN) model. Overall, the transfer learning approach obtains a desirable classification accuracy and has the potential to map slums on MR imagery. This kind of method is nonetheless complex and computationally intensive, demanding high computing power of hardware and occupying too much local storage while training models on HR/VHR imagery. Thus, there is still space for research on highly accurate and efficient slum mapping using MR imagery at a city-wide scale.
In addition, the transfer learning and deep learning methods for slum mapping only used visual image features that are embedded in the visible wavelengths instead of taking the MR imagery’s advantages of abundant spectral information to identify slums. Several studies [15,29] have proven that spectral and textural features from multispectral data manifest great effectiveness for slum mapping. Previous studies [29] using spectral and textural features to identify slums usually calculated many spectral indices and textural metrics first. The existing indices, such as the normalized difference vegetation index (NDVI) [42], cannot independently and directly separate slums from other land types. Then, feature selection is typically needed to determine the best feature combination scheme [43], which inevitably causes time loss. Thus, the scope of this study is to design spectral indices directly to highlight slums in multispectral MR imagery.
In this study, two new composite spectral slum indices (CSSIs) were initially proposed based on the results of the spectral curves of various categories. Two slum mapping methods based on the CSSIs and textural features, the threshold-based method and the ML-based method, are then developed. It should be noted that no HR/VHR images are required for our methods and no complex models or algorithms are used. Therefore, our methods are highly efficient, especially the threshold-based method. The validity of our methods provides a reference and experience for follow-up studies of large-area mapping of slums.
2. Study Area and Data
As shown in Figure 1, our study area is Mumbai, the capital city of Maharashtra state, India (Figure 1a,b). Mumbai has a size of 603.4 square kilometers and is one of the most slum-populated cities worldwide [38]. A subarea of Mumbai is selected, as in Wurm’s study [41], as shown in Figure 1d. The subarea contains one of the largest slums in the world, Dharavi. The ground truth of slum data in 2015–2016 was obtained from the website (https://sra.gov.in, accessed on 18 February 2023) of the government’s Slum Rehabilitation Authority (SRA) of Maharashtra, as shown in Figure 1c.
Sentinel-2 surface reflectance data were used with Google Earth Engine (GEE) [44]. The collection named “COPERNICUS/S2_SR_HARMONIZED” in the GEE data catalog was first accessed. The Sentinel-2 imagery has 12 spectral bands ranging from 442.3 nm to 2185.7 nm and spatial resolutions ranging from 10 m to 60 m, as shown in Table 1. In this study, all spectral bands were resampled to 10 m through bilinear interpolation. Mumbai belongs to the tropical savanna climate, characterized by distinct dry and wet seasons. The wet season of June to October is suitable for vegetation growth in Mumbai. Thus, images photographed in the wet season were selected through a temporal filter. To gain pixels covering the study area of good quality, images with less than 20% cloud coverage in the wet season in 2019 and 2020 were selected, and the cloud pixels were masked out using the QA60 band. Finally, a cloud-free composition image was generated by median values from these selected images. The composite Sentinel-2 image, as shown in Figure 1a, was utilized to obtain slums in Mumbai.
Spectral curves for the categories of slums, formal settlements, water areas and vegetation were built, as shown in Figure 2, to help research the spectral characteristics of slums. To generate the spectral curves, 123 seed points were first manually collected with the aid of Google Earth, of which 32 were slums, 32 were formal settlements, 30 were water areas and 29 were vegetation. Then, buffer regions around each seed point with a buffer distance of 50 m were generated. These buffer regions were further converted into regions of interest (ROIs) on the Sentinel-2 image, as shown in Figure 3. Finally, 2429 slum pixels, 2413 formal settlement pixels, 2269 water pixels and 2169 vegetation pixels were collected. Each pixel has 12 features, corresponding to 12 bands of the Sentinel-2 image. The mean values for each class at each band were calculated to construct the spectral curves.
3. Methods
Figure 4a describes the overall workflow of this study. After data preprocessing, as described in Section 2, slums were detected from the composite Sentinel-2 image using spectral and textural features. Specifically, two composite slum spectral indices (CSSIs), CSSI-1 and CSSI-2, were calculated to represent slum characteristics. Textural features were calculated with the gray-level co-occurrence matrix (GLCM) [45]. Two approaches were exploited to test the performance of the proposed CSSIs, i.e., the threshold-based approach (Figure 4b) and the ML-based approach (Figure 4c). Finally, the accuracies of the slum maps generated by these two methods were separately evaluated based on the ground truth data.
3.1. Calculation of CSSIs
CSSI-1 and CSSI-2 were designed to distinguish slums with formal settlements, vegetation and water areas. Specifically, the CSSIs are calculated as follows:
where , ,, and are shortwave infrared band 1 (SWIR1), shortwave infrared band 2 (SWIR2), red edge band 4 (RE4), blue band and green band, respectively. With the spectral curves shown in Figure 2, RE4 values are smaller than SWIR1 and SWIR2 values for slums, whereas for the other categories, RE4 values are larger than SWIR1 and SWIR2 values. Therefore, the slope from RE4 to SWIRs is positive for slums, but negative for formal settlements, water areas and vegetation. In particular, the formal settlements have larger spectral values at RE4 than at other bands, which may strengthen the discernibility of CSSI-1 in differentiating slums and formal settlements. Thus, according to the spectral profiles, slum pixels tend to have CSSI-1 values slightly larger than 0, while the other categories tend to have CSSI-1 values smaller than 0. In addition, the slope from blue to green is almost negative for slums, but positive for the other categories according to the spectral profiles (Figure 2). Thus, according to the spectral profiles, slum pixels tend to have CSSI-2 values slightly larger than 0, while the other categories tend to have CSSI-2 values smaller than 0.
3.2. Calculation of Textural Features
Given that slums have tightly packed house roofs, whereas nonslums, especially in formal settlements, have relatively sparse and regular arrangements of buildings, textural features have been confirmed to be effective in distinguishing slums from nonslums. GLCM [45] was utilized to calculate the textural features in this study. The steps of calculating GLCM include converting the image into a gray-level image and counting the frequency of occurrences of pixel pairs in the base window and the sliding window under the specific window size, the sliding direction and the sliding step. Practically, the window size is typically set at an odd number and the sliding directions are 0°, 45°, 90° and 135°.
Furthermore, textural statistics were calculated based on GLCM to represent textural features. Haralick et al. [45] designed 9 textural statistics, including the mean, variance, homogeneity, etc. The GLCM variance (GLCMvar) was calculated as follows:
where and are the gray-level values of the corresponding pixels in the base window and the sliding window, respectively, is the number of gray levels and is the occurrence frequency of the gray-level pair () under the condition of sliding direction and sliding step .
In this study, the blue, green and red bands were utilized to calculate GLCMvar. The input gray-level image was generated by combining the RGB bands as follows:
3.3. Approach 1: Usage of CSSIs for Threshold-Based Classification
As described in Figure 4, CSSIs and GLCMvar samples of the categories of slums, formal settlements, water areas and vegetation were first obtained. The sample regions are exactly the 9280 sample points described in Figure 3. Then, Otsu’s method [46] was introduced to calculate the segmentation thresholds for CSSIs and GLCMvar automatically.
Otsu’s method was utilized to determine a threshold to maximize the interclass variance between two categories. For a threshold , the interclass variance was calculated as:
where and are the probability of class and class divided by , and are the mean pixel values of class and class , respectively, denotes the number of pixels for which the value is smaller than and denotes the number of pixels for which the value is equal to or larger than . The parameter is the total number of samples.
For each feature map, three thresholds were separately calculated, i.e., the threshold to separate slums from formal settlements, the threshold to separate slums from water areas, and the threshold to separate slums from vegetation. Then, a final threshold was determined by these three thresholds. This process was described as follows:
where , and are the weight parameters and ; . After obtaining the thresholds for every feature map, the thresholds were applied to distinguish slums and nonslums.
3.4. Approach 2: Usage of CSSIs for ML-Based Classification
As described in Figure 4, the random forest algorithm [47,48] was exploited to conduct the ML-based classification. The spectral bands of the Sentinel-2 image listed in Table 1, the GLCMvar and the proposed CSSIs were used as input features. In addition, normalization of the spectral bands and GLCMvar image with the mean values of each feature channel was performed. The input pixels were split into a training set and a test set by the stratified sampling method. After training the random forest model with the training set, slums and nonslums for the test set were predicted. The morphological operation as the postprocess was employed to refine the results. In addition, SHapley Additive exPlanation (SHAP) [49] was utilized to calculate feature importance. The SHAP method is usually utilized to explain how the features influence the model prediction [50,51].
4. Analysis and Results
4.1. Experimental Setting
Metrics including precision (P), recall (R) and intersection over union (IoU) were calculated to evaluate the slum mapping results. The experimental results of our methods were compared with those of Verma’s method [36] and Gram-Hansen’s method [52] in Mumbai and with those of Wurm’s method [41] in the subarea of Mumbai.
The experiments of the threshold-based method were conducted on the GEE platform. The window size of the GLCM was set to . The sliding directions were 0°, 45°, 90° and 135°. The sliding step was 1. The weight parameters mentioned in Equation (9) were 0.6, 0.2 and 0.2 for the CSSI-1 image, 0.6, 0.2 and 0.2 for the CSSI-2 image and 1.0, 0.0 and 0.0 for the GLCMvar image.
The experiments of the ML-based method were performed in a Python environment using the scikit-learn package [53]. The superparameters, including the n_estimator, min_sample_leaf, max_features and random_state, for the random forest classifier were set to 100, 50, 0.8 and 47, respectively. Similar to Wurm’s method [41], a four-fold cross validation was conducted in the experiment. The pixels of the study area were split into four datasets with the stratified method. Three out of the four datasets were utilized to train the classifier and the remaining dataset was used for validation. The training-validation procedure was repeated four times. Then, the classifier with the best validation results was utilized to predict slums over the study area. For the postprocessing, an opening operation with a window size of was employed to refine the classification results.
A patch-based assessment was performed to evaluate the slum mapping results on slum patches with different sizes. Referring to Wurm’s method [41], slum patches were divided into three types according to their sizes: small slums that are smaller than 5 ha, medium slums of sizes ranging from 5 ha to 25 ha and large slums that are larger than 25 ha. The recall, which is also defined as the sensitivity by Wurm’s method, was calculated for slum patches of different sizes.
4.2. Spectral and Textural Feature Maps
Figure 5 shows CSSI maps and the normalized GLCMvar image in Mumbai. Figure 6 shows the spectral and textural features of an example region covering the Dharavi slum. It can be visually found that slum pixels have larger CSSIs but smaller GLCMvar values than nonslum pixels.
Figure 7 presents the probability density of the slum ROIs, formal settlement ROIs, vegetation ROIs and water ROIs for CSSI-1 (Figure 7a), CSSI-2 (Figure 7b) and GLCMvar (Figure 7c). According to Figure 7a, slum ROIs have larger CSSI-1 values than other ROIs. There exists a distinct interval of CSSI-1 to separate slum ROIs from vegetation ROIs and water ROIs. According to Figure 7b, most slum ROIs have larger CSSI-2 values than other ROIs, except for some slum ROIs that have similar CSSI-2 ranges with formal settlement ROIs and water ROIs. According to Figure 7c, slum ROIs have much smaller GLCMvar values than formal settlement ROIs. The distribution of the probability density of each class manifests the potential of CSSIs and GLCMvar to distinguish slums from other categories. For the threshold-based experiment, the CSSI-1 and CSSI-2 threshold values were set as −0.07 and −0.02, respectively, as determined by Otsu’s algorithm, while the GLCMvar threshold value was set as 0.55.
4.3. Slum Mapping Results in Mumbai
Figure 8 shows the slums predicted by our threshold-based method and our ML-based method. The ML-based method generated more complete slums with fewer omissions than the threshold-based method. Furthermore, our threshold-based experiment was conducted on the GEE platform and obtained timely feedback in less than 2 min. Our ML-based experiment, including four-fold training and prediction, took 28 min.
Table 2 documents the slum mapping accuracies of our methods as well as the IoU results originally reported in Verma’s study [36] and Gram-Hansen’s study [52] in Mumbai. Verma et al. [36] used a convolutional neural network (CNN) model, Inception-v3 [54], to map slums with Pleiades imagery and then used the CNN model and transfer learning to map slums with Sentinel-2 imagery. Gram-Hansen et al. [52] used the canonical correlation forest (CCF) to map slums with Sentinel-2 imagery. Both IoU values of our threshold-based method and our ML-based method were higher than these two methods using Sentinel-2 imagery, but lower than Verma’s method using Pleiades imagery. Additionally, the precision and recall accuracies of Verma’s method and Gram-Hansen’s method were not reported in their papers and thus were blank in the corresponding cells of Table 2.
4.4. Slum Mapping Results in the Subarea of Mumbai
Figure 9 shows our slum mapping results in the subarea of Mumbai. Compared with the threshold-based method, the ML-based method also generated more complete slums with fewer omissions in this area. Table 3 presents our results in the subarea of Mumbai as well as the results reported in Wurm’s study in the same study area [41]. Wurm et al. [41] used the FCN model to map slums on Quickbird imagery and then used the pretrained FCN model and transfer learning to map slums on Sentinel-2 imagery. Our threshold-based method outperformed the FCN, a deep learning model, with an increase of 11.39% in the IoU value when using Sentinel-2 imagery. Our threshold-based method performed poorer than that of FCN-TL, which used an FCN model pretrained on a VHR image to predict slums from the Sentinel-2 imagery. Our ML-based method gained an increase of 25.00% IoU compared to FCN and an increase of 9.28% IoU compared to FCN-TL. Our methods achieved high accuracies of slum mapping with no need for VHR images, while Wurm’s methods required VHR images to obtain high accuracies.
4.5. Results of Patch-Based Accuracy Assessment
Table 4 presents the recall accuracies for slum patches of different sizes. Both our threshold-based and ML-based methods obtain higher recall accuracies than FCN and FCN-TL with the Sentinel-2 imagery in the subarea of Mumbai. Specifically, our threshold-based method gains accuracy increases of 30.35%, 35.78% and 30.30% on small slums, medium slums and large slums when compared with FCN using no VHR imagery. Our threshold-based method gains accuracy increases of 22.89%, 20.04% and 19.89% on small slums, medium slums and large slums when compared with FCN-TL, which used deep information transferred from VHR imagery. Our ML-based method obtains the highest accuracies on large and medium slums in the subarea of Mumbai. Our ML-based method with MR Sentinel-2 images performs poorer in small slum patches than Wurm’s method [41] on the VHR Quickbird image. The recall accuracies of Wurm’s method were reported in their study.
Figure 10, Figure 11 and Figure 12 present the comparison between our threshold-based slum mapping results and our ML-based results on the large slum patches, medium slum patches and small slum pockets, respectively. Both the threshold-based approach and the ML-based approach in this study obtain good classification accuracy on large and medium slum patches, whereas the ML-based approach generates much fewer omissions on small slum pockets than the threshold-based approach.
4.6. Importance of Features for Slum Mapping
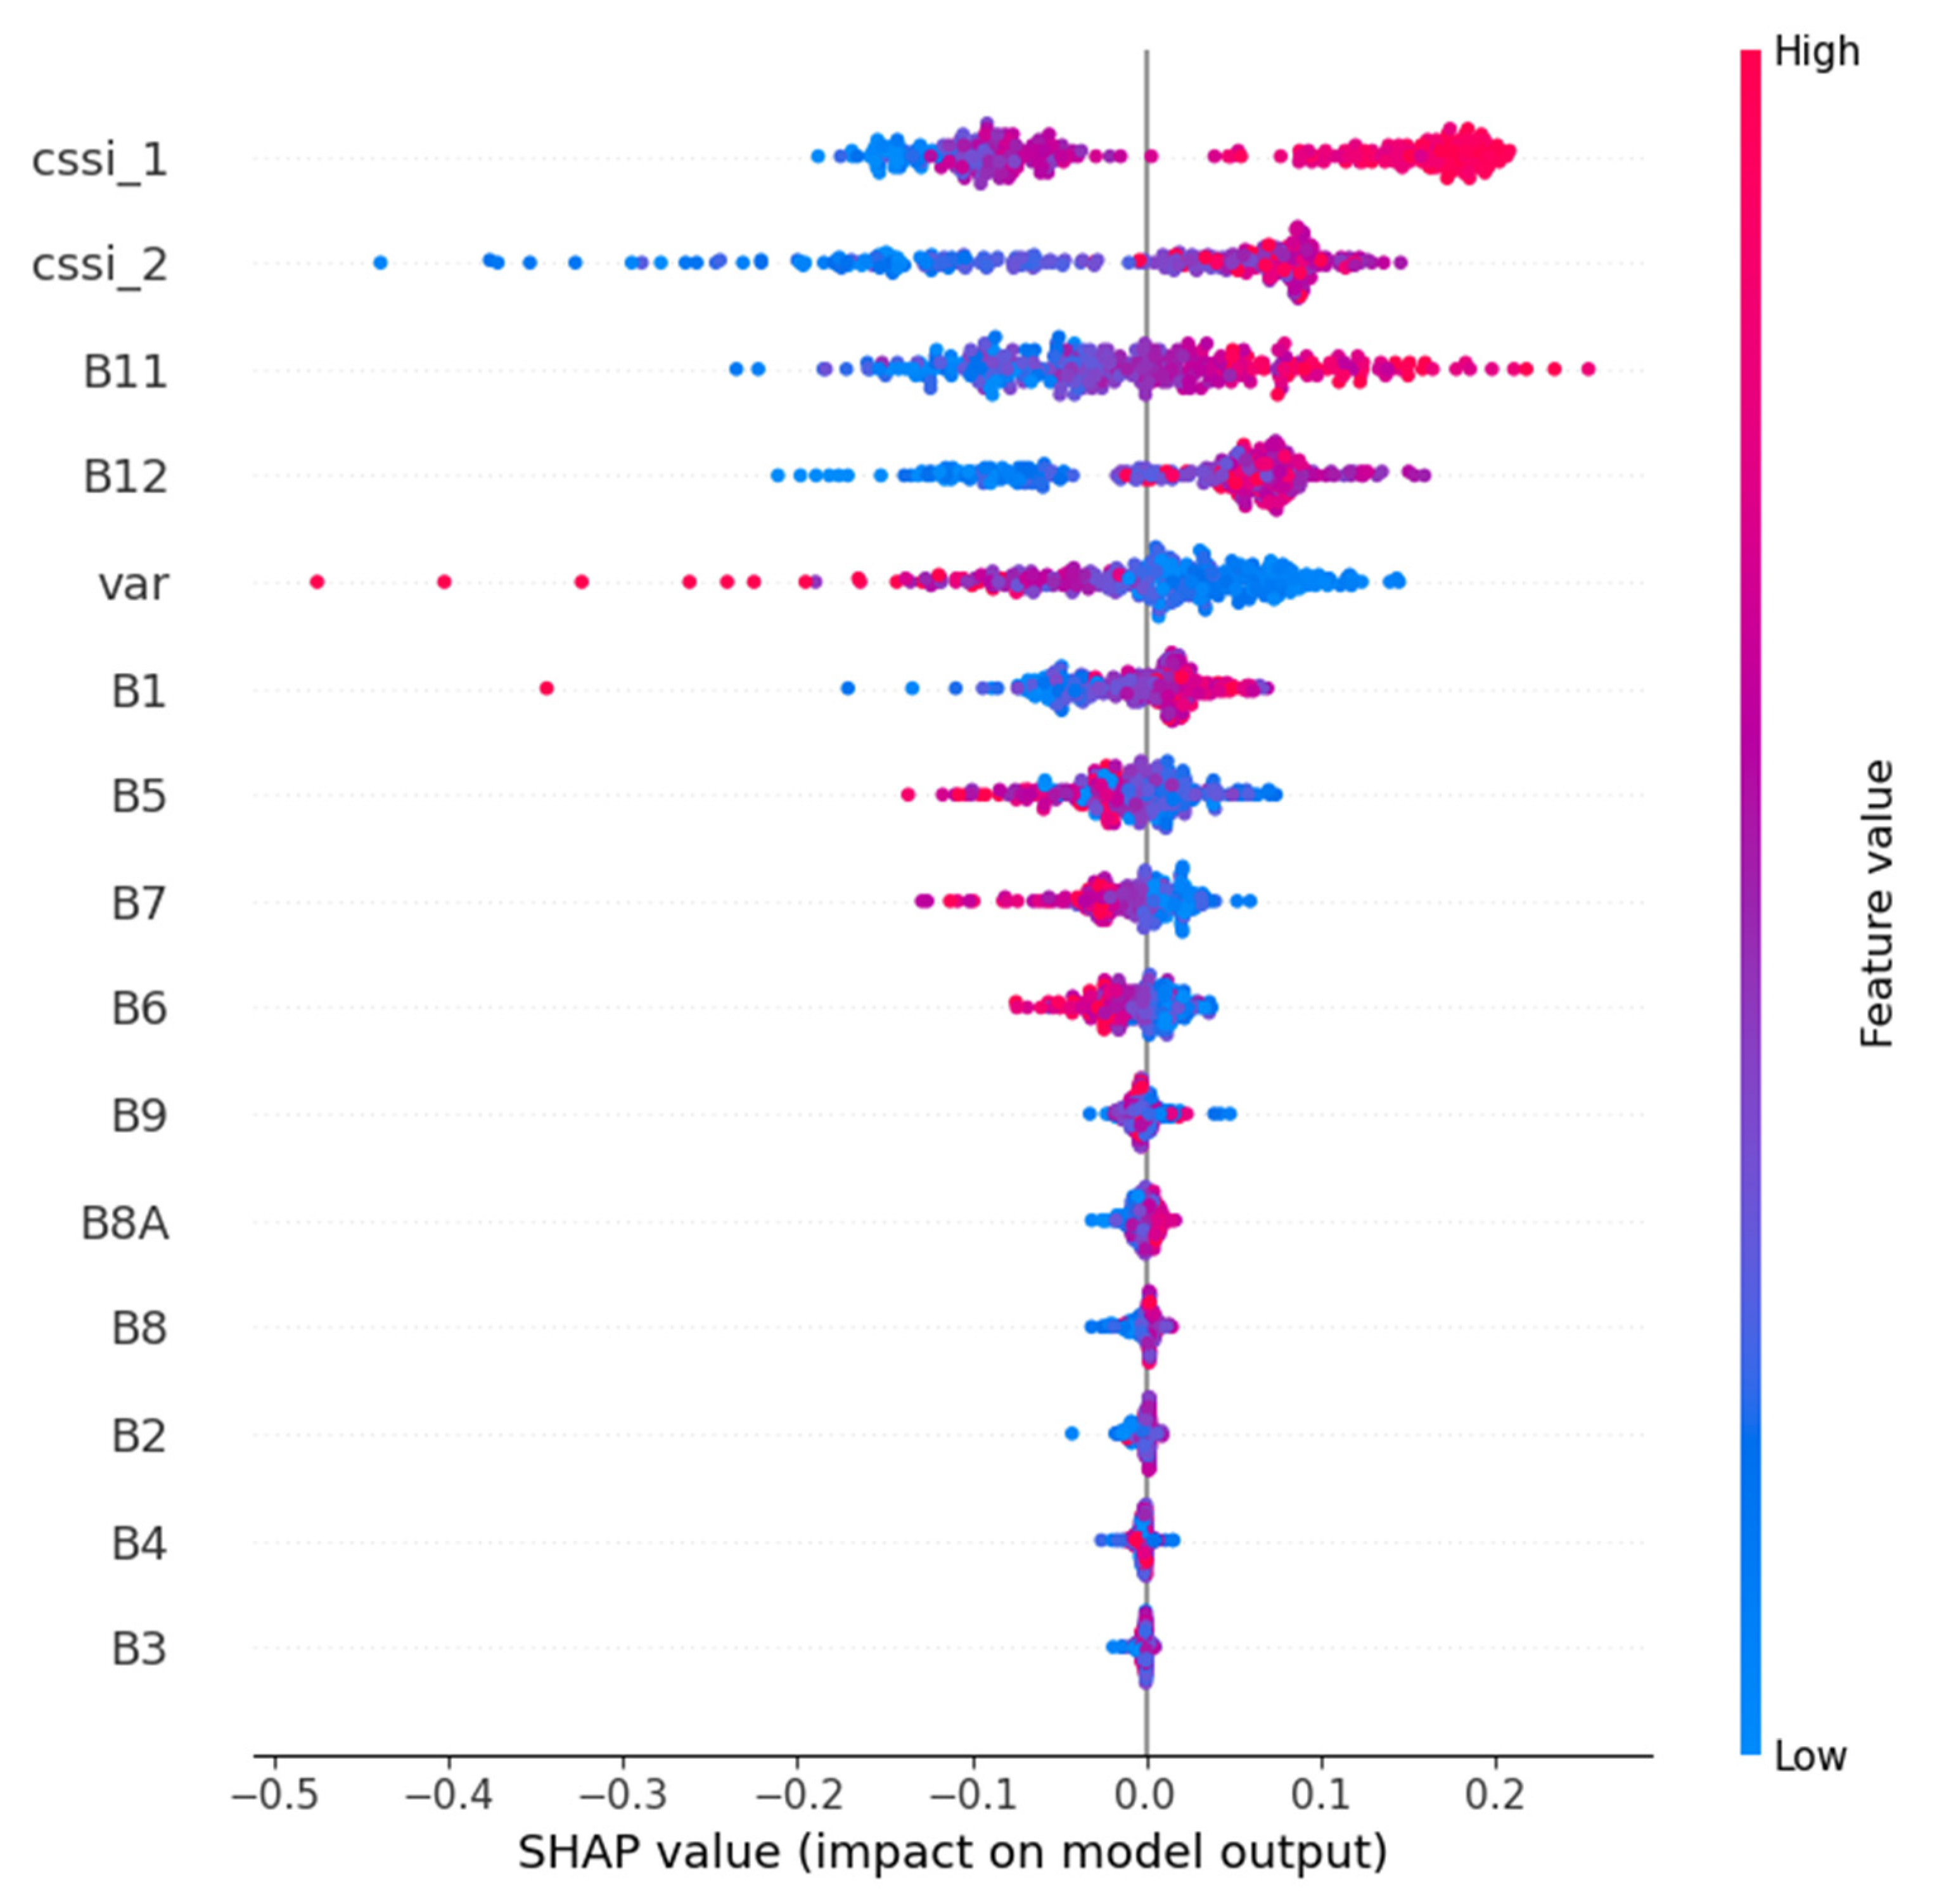
SHAP values were calculated for the random forest classifier to interpret feature importance. As shown in Figure 13, each point in Figure 13 indicates a pixel sample, and the color of the point reflects whether its feature value is high or low. Fifteen features are listed in descending order from top to bottom according to their respective importance. The horizontal axis represents the SHAP value. The SHAP values indicate the marginal contribution of features to the model output. Given that the labels of a slum pixel and a nonslum pixel were set as 1 and 0, respectively, a higher SHAP value means that the feature of the sample point has a larger contribution to predicting the sample as a slum pixel. The five most important features are CSSI-1, CSSI-2, B11, B12 and GLCMvar. Specifically, higher CSSI-1 values indicate higher SHAP values and thus a larger probability of predicting the pixels as slums. This is similar to CSSI-2, B11 and B12. For GLCMvar, its higher values indicate lower SHAP values, which reflects the negative association between GLCMvar and slum probability.
5. Discussion
5.1. Performance of Our Methods with CSSIs on Slum Mapping
In this study, two new composite spectral slum indices (CSSIs) were proposed to achieve high-accuracy slum classification using multispectral MR imagery with no need for HR/VHR images. The CSSIs exploit the differences among various categories on the SWIR bands, Red Edge band, Blue band and Green band to distinguish slums from nonslums. To assess the performance of CSSIs, a threshold-based experiment and an ML-based experiment were conducted to detect slums in Mumbai. The slum classification results demonstrated that our methods obtained comparable and even better accuracies than state-of-the-art studies that used deep learning and transfer learning methods on Sentinel-2 imagery (Table 2 and Table 3). Specifically, our threshold-based method outperformed CNN + TL [36] and CCF [52] in Mumbai and outperformed FCN [41] in the subarea of Mumbai. Among all the methods using Sentinel-2 imagery, our ML-based method obtained the highest IoU value of 54.45% in Mumbai and the highest IoU value of 60.51% in the subarea of Mumbai.
Moreover, our methods with CSSIs are conceptually simple and thus easy to implement for rapid slum mapping in comparison to methods using deep learning. Our threshold-based method was conducted on the GEE platform and obtained timely feedback in less than 2 min in Mumbai, while the ML-based method took 28 min. Verma’s method [36] took 8 h on the VHR/HR imagery and 2 h on the Sentinel-2 imagery to map slums in Mumbai.
Our ML-based method obtains more accurate slum maps than the threshold-based method, while the threshold-based method takes much less time. Specifically, the threshold-based method obtained an IoU accuracy of 43.89% in Mumbai and an IoU of 46.90% in the subarea of Mumbai. Our ML-based method obtained an IoU of 54.45% in Mumbai and an IoU of 60.51% in the subarea of Mumbai. Thus, our threshold-based approach with CSSIs could be exploited in rapid slum mapping at a city-wide scale with good accuracy due to its higher efficiency and fewer demands on samples than the ML-based approach. Our ML-based approach with CSSIs could be applied to refine the slum mapping accuracies.
The SHAP analysis results indicated that the proposed CSSIs contribute most to slum mapping among the spectral bands (B1-B12 of Sentinel-2), textural characteristics and spectral indices. This is due to the promising discernibility of CSSIs in slums and nonslums. The threshold values of CSSI-1 and CSSI-2, to differentiate slums from vegetation, formal settlements and water areas, should be approximately 0, according to the spectral curves in Figure 2. In our experiment with the threshold-based method, the CSSI-1 threshold value was −0.07 and the CSSI-2 threshold value was −0.02, as determined by Otsu’s algorithm. Pixels with CSSI values larger than the thresholds could be regarded as candidate slums. The simplicity and clarity of CSSIs allow our threshold-based method to map slums on a city-wide scale rapidly. The discernibility of CSSIs also helps the ML-based method achieve sufficient mapping performance. The accuracy of slum mapping will be further improved when more features or indices, such as NDVI, are utilized in combination with CSSIs. Additionally, more studies are needed to validate CSSIs in more city-wide tasks.
5.2. Generality and Limitations of Our Methods with CSSIs
Patch-based results indicate that our methods generate high-accuracy slum boundaries for medium and large slum patches, but perform poorer in mapping small slum patches than the methods using VHR imagery. Compared with the results generated by FCN on VHR imagery, our ML-based method obtained 2.06% and 1.2% increases in recall on larger slum patches (≥25 ha) and medium slum patches (5~25 ha), respectively. A recall at least 16.04% lower than FCN on small slum pockets (<5 ha) was achieved. This is because the boundaries of slum pockets (<5 ha) are usually blended with other categories as mixed pixels in MR RS images, while it is inevitable that these mixed pixels have a negative influence on delineating the boundaries of small slums. Pixels in slum patches that are larger than 5 ha are purer and less influenced by other categories because of the compact structure of roofs inside slum patches. Thus, fine mapping results of large slum patches could be obtained via spectral features and textural features. The negative influence mentioned above would be alleviated with HR/VHR imagery, subpixel mapping [55] or spatiotemporal fusion [56,57,58]. In all, MR Sentinel-2 images with 10 m resolution are almost sufficient for detecting good accuracy of large and medium slum patches, while HR/VHR RS images are required for small slum pockets. Thus, our method could be exploited in rapid slum mapping when HR/VHR imagery is not accessed. Our method could be utilized to quickly obtain initial slum mapping results from MR imagery at a city-wide scale before using HR/VHR imagery to obtain fine results in subareas with many small slum pockets. In this way, the accuracy of slum mapping at a city-wide scale would be improved, while the demands of the charge and processing of HR images would not be significantly increased.
Our methods would be very suitable for detecting slums in which building roofs are made of shingles or metal, such as dull aluminum roofs and galvanized roofs. In Mumbai, many building roofs of slums are made of metal [59]. According to reflectance spectra information, metal roofs and shingle roofs share similar high reflectance in SWIR bands and relatively low reflectance in red edge bands [60]. Metal roofs have a lower reflectance in the blue band than in the green band, whereas other materials usually used for nonslum built-up areas, such as roof tiles, brick, cement and asphalt, have a higher reflectance in the blue band than in the green band [60]. The proposed CSSIs exploit the relationships and differences in these spectral bands among various categories to highlight slums and thus perform very well when utilized to detect slums in which building roofs are made of shingles or metal. Furthermore, given that many building roofs of slums are made of thatch, plastic sheets, stones or bricks, our methods would be improved by involving other spectral and textural features that indicate these materials. The detection of slums with various building roof materials deserves more research attention. In addition, multisource data, such as road nets, street view imagery, topographic data, climate data and social and ecological data [11,61,62,63], could also be introduced to further improve the slum mapping accuracy in future work.
6. Conclusions
In this study, two new composite slum spectral indices, CSSIs, were proposed to highlight slums based on their spectral characteristics in MR Sentinel-2 imagery. Two methods with CSSIs, a threshold-based method and an ML-based method, were further conducted to assess the performance and contribution of CSSIs to slum mapping at a city-wide scale. The SHAP analysis has shown that the CSSIs exhibit the most importance to slum mapping among the spectral bands, spectral indices and textural characteristics. The discernibility and conceptual simplicity of CSSIs allow them to be suitably employed in rapid large-scale slum mapping. Our threshold-based method and our ML-based method produced the slum map in Mumbai in 2 and 28 min, respectively. The ML-based method generated accurate slum maps with an IoU of 54.45%, a precision of 61.56% and a recall of 82.50%, outperforming state-of-the-art methods using MR Sentinel-2 images. For the patch-based assessment, our methods accurately detect medium and large slum patches (≥5 ha) from MR multispectral RS images, which is comparable to or even better than methods using deep learning and transfer learning. Small slum pockets (<5 ha) are difficult to completely obtain from the MR Sentinel-2 imagery since their boundaries are usually blended with other categories as mixed pixels. Our method could be applied to quickly obtain initial slum mapping results from MR imagery in large areas before using HR/VHR imagery to obtain fine results in subareas with many small slum pockets. In this way, large-area slum mapping could be achieved with high accuracy and efficiency.
Author Contributions
Conceptualization, F.P.; methodology, W.L.; software, W.L.; validation, F.P. and L.J.; formal analysis, F.P. and W.L.; investigation, F.P. and L.J.; writing—original draft preparation, W.L.; writing—review and editing, F.P. and Y.H.; visualization, W.L.; supervision, F.P.; project administration, F.P.; funding acquisition, F.P. All authors have read and agreed to the published version of the manuscript.
Funding
This work was supported by the National Natural Science Foundation of China under Grants 42071389, 41701511 and 41901315, the Fundamental Research Funds for the Central Universities under Grants CCNU20TS033 and CCNU22QN019, and the Key Project of Innovation LREIS under Grant KPI011. L.J. was supported by the Fundamental Research Funds for the Central Universities (WUT:223108001).
Data Availability Statement
The ground truth data of slums were acquired at the website https://sra.gov.in (accessed on 18 February 2023).
Conflicts of Interest
The authors declare no conflict of interest.
References
- Secretary-General, U.N. Progress towards the Sustainable Development Goals: Report of the Secretary-General. 2017. Available online: https://policycommons.net/artifacts/127525/progress-towards-the-sustainable-development-goals/182695/ (accessed on 18 September 2023).
- UN-Habitat Slum Almanac 2015–2016: Tracking Improvement in the Lives of Slum Dwellers. Participatory Slum Upgrading Programme 2016. Available online: https://unhabitat.org/slum-almanac-2015-2016-0 (accessed on 18 September 2023).
- UN-Habitat The Challenge of Slums: Global Report on Human Settlements 2003. Available online: https://unhabitat.org/the-challenge-of-slums-global-report-on-human-settlements-2003 (accessed on 18 September 2023).
- Tjia, D.; Coetzee, S. Geospatial Information Needs for Informal Settlement Upgrading—A Review. Habitat Int. 2022, 122, 102531. [Google Scholar] [CrossRef]
- Thomson, D.R.; Stevens, F.R.; Chen, R.; Yetman, G.; Sorichetta, A.; Gaughan, A.E. Improving the Accuracy of Gridded Population Estimates in Cities and Slums to Monitor SDG 11: Evidence from a Simulation Study in Namibia. Land Use Policy 2022, 123, 106392. [Google Scholar] [CrossRef]
- Daneshyar, E.; Keynoush, S. Developing Adaptive Curriculum for Slum Upgrade Projects: The Fourth Year Undergraduate Program Experience. Sustainability 2023, 15, 4877. [Google Scholar] [CrossRef]
- Leonita, G.; Kuffer, M.; Sliuzas, R.; Persello, C. Machine Learning-Based Slum Mapping in Support of Slum Upgrading Programs: The Case of Bandung City, Indonesia. Remote Sens. 2018, 10, 1522. [Google Scholar] [CrossRef]
- Rehman, M.F.U.; Aftab, I.; Sultani, W.; Ali, M. Mapping Temporary Slums From Satellite Imagery Using a Semi-Supervised Approach. IEEE Geosci. Remote Sens. Lett. 2022, 19, 1–5. [Google Scholar] [CrossRef]
- Prabhu, R.; Parvathavarthini, B. Morphological Slum Index for Slum Extraction from High-Resolution Remote Sensing Imagery over Urban Areas. Geocarto Int. 2022, 37, 13904–13922. [Google Scholar] [CrossRef]
- Luo, E.; Kuffer, M.; Wang, J. Urban Poverty Maps-From Characterising Deprivation Using Geo-Spatial Data to Capturing Deprivation from Space. Sustain. Cities Soc. 2022, 84, 104033. [Google Scholar] [CrossRef]
- Trento Oliveira, L.; Kuffer, M.; Schwarz, N.; Pedrassoli, J.C. Capturing Deprived Areas Using Unsupervised Machine Learning and Open Data: A Case Study in São Paulo, Brazil. Eur. J. Remote Sens. 2023, 56, 2214690. [Google Scholar] [CrossRef]
- Alrasheedi, K.G.; Dewan, A.; El-Mowafy, A. Using Local Knowledge and Remote Sensing in the Identification of Informal Settlements in Riyadh City, Saudi Arabia. Remote Sens. 2023, 15, 3895. [Google Scholar] [CrossRef]
- Dabra, A.; Kumar, V. Evaluating Green Cover and Open Spaces in Informal Settlements of Mumbai Using Deep Learning. Neural Comput. Appl. 2023, 35, 11773–11788. [Google Scholar] [CrossRef]
- Prabhu, R.; Alagu Raja, R.A. Urban Slum Detection Approaches from High-Resolution Satellite Data Using Statistical and Spectral Based Approaches. J. Indian Soc. Remote Sens. 2018, 46, 2033–2044. [Google Scholar] [CrossRef]
- Owen, K.K.; Wong, D.W. An Approach to Differentiate Informal Settlements Using Spectral, Texture, Geomorphology and Road Accessibility Metrics. Appl. Geogr. 2013, 38, 107–118. [Google Scholar] [CrossRef]
- Kuffer, M.; Thomson, D.R.; Boo, G.; Mahabir, R.; Grippa, T.; Vanhuysse, S.; Engstrom, R.; Ndugwa, R.; Makau, J.; Darin, E. The Role of Earth Observation in an Integrated Deprived Area Mapping “System” for Low-to-Middle Income Countries. Remote Sens. 2020, 12, 982. [Google Scholar] [CrossRef]
- Olivatto, T.F.; Inguaggiato, F.F.; Stanganini, F.N. Urban Mapping and Impacts Assessment in a Brazilian Irregular Settlement Using UAV-Based Imaging. Remote Sens. Appl. Soc. Environ. 2023, 29, 100911. [Google Scholar] [CrossRef]
- Ajami, A.; Kuffer, M.; Persello, C.; Pfeffer, K. Identifying a Slums’ Degree of Deprivation from VHR Images Using Convolutional Neural Networks. Remote Sens. 2019, 11, 1282. [Google Scholar] [CrossRef]
- Chan, C.Y.-C.; Weigand, M.; Alnajar, E.A.; Taubenböck, H. Investigating the Capability of UAV Imagery for AI-Assisted Mapping of Refugee Camps in East Africa. Proc. Acad. Track State Map 2022, 2022, 45–48. [Google Scholar]
- Kit, O.; Lüdeke, M.; Reckien, D. Texture-Based Identification of Urban Slums in Hyderabad, India Using Remote Sensing Data. Appl. Geogr. 2012, 32, 660–667. [Google Scholar] [CrossRef]
- Kit, O.; Lüdeke, M. Automated Detection of Slum Area Change in Hyderabad, India Using Multitemporal Satellite Imagery. ISPRS J. Photogramm. Remote Sens. 2013, 83, 130–137. [Google Scholar] [CrossRef]
- Kohli, D.; Sliuzas, R.; Stein, A. Urban Slum Detection Using Texture and Spatial Metrics Derived from Satellite Imagery. J. Spat. Sci. 2016, 61, 405–426. [Google Scholar] [CrossRef]
- Kuffer, M.; Pfeffer, K.; Sliuzas, R.; Baud, I. Extraction of Slum Areas from VHR Imagery Using GLCM Variance. IEEE J. Sel. Top. Appl. Earth Obs. Remote Sens. 2016, 9, 1830–1840. [Google Scholar] [CrossRef]
- Hofmann, P. Detecting Informal Settlements from IKONOS Image Data Using Methods of Object Oriented Image Analysis-an Example from Cape Town (South Africa). In Remote Sensing of Urban Areas/Fernerkundung in urbanen Räumen; Jürgens, C., Ed.; Institut für Geographie an der Universität Regensburg: Regensburg, Germany, 2001; pp. 41–42. [Google Scholar]
- Rhinane, H.; Hilali, A.; Berrada, A.; Hakdaoui, M. Detecting Slums from SPOT Data in Casablanca Morocco Using an Object Based Approach. J. Geogr. Inf. Syst. 2011, 3, 217. [Google Scholar] [CrossRef]
- Khelifa, D.; Mimoun, M. Object-Based Image Analysis and Data Mining for Building Ontology of Informal Urban Settlements. In Proceedings of the Image and Signal Processing for Remote Sensing XVIII, Edinburgh, UK, 24–27 September 2012; SPIE: Edinburgh, UK, 2012; Volume 8537, pp. 414–426. [Google Scholar]
- Kuffer, M.; Pfeffer, K.; Sliuzas, R.; Baud, I.; Van Maarseveen, M. Capturing the Diversity of Deprived Areas with Image-Based Features: The Case of Mumbai. Remote Sens. 2017, 9, 384. [Google Scholar] [CrossRef]
- Duque, J.C.; Patino, J.E.; Betancourt, A. Exploring the Potential of Machine Learning for Automatic Slum Identification from VHR Imagery. Remote Sens. 2017, 9, 895. [Google Scholar] [CrossRef]
- Matarira, D.; Mutanga, O.; Naidu, M. Google Earth Engine for Informal Settlement Mapping: A Random Forest Classification Using Spectral and Textural Information. Remote Sens. 2022, 14, 5130. [Google Scholar] [CrossRef]
- Li, Y.; Huang, X.; Liu, H. Unsupervised Deep Feature Learning for Urban Village Detection from High-Resolution Remote Sensing Images. Photogramm. Eng. Remote Sens. 2017, 83, 567–579. [Google Scholar] [CrossRef]
- Prabhu, R.; Parvathavarthini, B.; Alaguraja, A.R. Integration of Deep Convolutional Neural Networks and Mathematical Morphology-Based Postclassification Framework for Urban Slum Mapping. J. Appl. Remote Sens. 2021, 15, 014515. [Google Scholar] [CrossRef]
- Li, Z.; Xie, Y.; Jia, X.; Stuart, K.; Delaire, C.; Skakun, S. Point-to-Region Co-Learning for Poverty Mapping at High Resolution Using Satellite Imagery. In Proceedings of the AAAI Conference on Artificial Intelligence, Washington, DC, USA, 8–10 August 2023; Volume 37, pp. 14321–14328. [Google Scholar]
- Williams, T.K.-A.; Wei, T.; Zhu, X. Mapping Urban Slum Settlements Using Very High-Resolution Imagery and Land Boundary Data. IEEE J. Sel. Top. Appl. Earth Obs. Remote Sens. 2019, 13, 166–177. [Google Scholar] [CrossRef]
- Huang, Y.; Wang, Y.; Li, Z.; Li, Z.; Yang, G. Simultaneous Update of High-Resolution Land-Cover Mapping Attempt: Wuhan and the Surrounding Satellite Cities Cartography Using L2HNet. IEEE J. Sel. Top. Appl. Earth Obs. Remote Sens. 2023, 16, 2492–2503. [Google Scholar] [CrossRef]
- Wang, P.; Wang, L.; Leung, H.; Zhang, G. Super-Resolution Mapping Based on Spatial–Spectral Correlation for Spectral Imagery. IEEE Trans. Geosci. Remote Sens. 2020, 59, 2256–2268. [Google Scholar] [CrossRef]
- Verma, D.; Jana, A.; Ramamritham, K. Transfer Learning Approach to Map Urban Slums Using High and Medium Resolution Satellite Imagery. Habitat Int. 2019, 88, 101981. [Google Scholar] [CrossRef]
- Dufitimana, E.; Niyonzima, T. Leveraging the Potential of Convolutional Neural Network and Satellite Images to Map Informal Settlements in Urban Settings of the City of Kigali, Rwanda. Rwanda J. Eng. Sci. Technol. Environ. 2023, 5, 1–22. [Google Scholar] [CrossRef]
- United Nations. The World’s Cities in 2018. Department of Economic and Social Affairs, Population Division, World Urbanization Prospects. 2018, pp. 1–34. Available online: https://www.un.org/en/development/desa/population/publications/pdf/urbanization/the_worlds_cities_in_2018_data_booklet.pdf (accessed on 18 September 2023).
- Fisher, T.; Gibson, H.; Liu, Y.; Abdar, M.; Posa, M.; Salimi-Khorshidi, G.; Hassaine, A.; Cai, Y.; Rahimi, K.; Mamouei, M. Uncertainty-Aware Interpretable Deep Learning for Slum Mapping and Monitoring. Remote Sens. 2022, 14, 3072. [Google Scholar] [CrossRef]
- Owusu, M.; Kuffer, M.; Belgiu, M.; Grippa, T.; Lennert, M.; Georganos, S.; Vanhuysse, S. Towards User-Driven Earth Observation-Based Slum Mapping. Comput. Environ. Urban Syst. 2021, 89, 101681. [Google Scholar] [CrossRef]
- Wurm, M.; Stark, T.; Zhu, X.X.; Weigand, M.; Taubenböck, H. Semantic Segmentation of Slums in Satellite Images Using Transfer Learning on Fully Convolutional Neural Networks. ISPRS J. Photogramm. Remote Sens. 2019, 150, 59–69. [Google Scholar] [CrossRef]
- Elmore, A.J.; Mustard, J.F.; Manning, S.J.; Lobell, D.B. Quantifying Vegetation Change in Semiarid Environments: Precision and Accuracy of Spectral Mixture Analysis and the Normalized Difference Vegetation Index. Remote Sens. Environ. 2000, 73, 87–102. [Google Scholar] [CrossRef]
- Jitt-Aer, K.; Miyazaki, H. Urban Classification Based on Sentinel-2 Satellite Data for Slum Identification. In Proceeding of the 7th TICC International Conference, Tainan, Taiwan, 28–30 June 2023; pp. 95–104. [Google Scholar]
- Gorelick, N.; Hancher, M.; Dixon, M.; Ilyushchenko, S.; Thau, D.; Moore, R. Google Earth Engine: Planetary-Scale Geospatial Analysis for Everyone. Remote Sens. Environ. 2017, 202, 18–27. [Google Scholar] [CrossRef]
- Haralick, R.M.; Shanmugam, K.; Dinstein, I.H. Textural Features for Image Classification. IEEE Trans. Syst. Man Cybern. 1973, 6, 610–621. [Google Scholar] [CrossRef]
- Otsu, N. A Threshold Selection Method from Gray-Level Histograms. IEEE Trans. Syst. Man Cybern. 1979, 9, 62–66. [Google Scholar] [CrossRef]
- Breiman, L. Random Forests. Mach. Learn. 2001, 45, 5–32. [Google Scholar] [CrossRef]
- Belgiu, M.; Drăguţ, L. Random Forest in Remote Sensing: A Review of Applications and Future Directions. ISPRS J. Photogramm. Remote Sens. 2016, 114, 24–31. [Google Scholar] [CrossRef]
- Nohara, Y.; Matsumoto, K.; Soejima, H.; Nakashima, N. Explanation of Machine Learning Models Using Improved Shapley Additive Explanation. In Proceedings of the 10th ACM International Conference on Bioinformatics, Computational Biology and Health Informatics, Niagara Falls, NY, USA, 7–10 September 2019; p. 546. [Google Scholar]
- Descals, A.; Verger, A.; Yin, G.; Filella, I.; Peñuelas, J. Local Interpretation of Machine Learning Models in Remote Sensing with SHAP: The Case of Global Climate Constraints on Photosynthesis Phenology. Int. J. Remote Sens. 2023, 44, 3160–3173. [Google Scholar] [CrossRef]
- Brenning, A. Interpreting Machine-Learning Models in Transformed Feature Space with an Application to Remote-Sensing Classification. Mach. Learn. 2023, 112, 3455–3471. [Google Scholar] [CrossRef]
- Gram-Hansen, B.J.; Helber, P.; Varatharajan, I.; Azam, F.; Coca-Castro, A.; Kopackova, V.; Bilinski, P. Mapping Informal Settlements in Developing Countries Using Machine Learning and Low Resolution Multi-Spectral Data. In Proceedings of the 2019 AAAI/ACM Conference on AI, Ethics, and Society, Honolulu, HI, USA, 27–28 January 2019; pp. 361–368. [Google Scholar]
- Pedregosa, F.; Varoquaux, G.; Gramfort, A.; Michel, V.; Thirion, B.; Grisel, O.; Blondel, M.; Prettenhofer, P.; Weiss, R.; Dubourg, V. Scikit-Learn: Machine Learning in Python. J. Mach. Learn. Res. 2011, 12, 2825–2830. [Google Scholar]
- Szegedy, C.; Vanhoucke, V.; Ioffe, S.; Shlens, J.; Wojna, Z. Rethinking the Inception Architecture for Computer Vision. In Proceedings of the IEEE Conference on Computer Vision and Pattern Recognition, Las Vegas, NV, USA, 1–26 July 2016; pp. 2818–2826. [Google Scholar]
- Rossi, C.; Gholizadeh, H. Uncovering the Hidden: Leveraging Sub-Pixel Spectral Diversity to Estimate Plant Diversity from Space. Remote Sens. Environ. 2023, 296, 113734. [Google Scholar] [CrossRef]
- Li, W.; Cao, D.; Peng, Y.; Yang, C. MSNet: A Multi-Stream Fusion Network for Remote Sensing Spatiotemporal Fusion Based on Transformer and Convolution. Remote Sens. 2021, 13, 3724. [Google Scholar] [CrossRef]
- Liu, S.; Zhou, J.; Qiu, Y.; Chen, J.; Zhu, X.; Chen, H. The FIRST Model: Spatiotemporal Fusion Incorrporting Spectral Autocorrelation. Remote Sens. Environ. 2022, 279, 113111. [Google Scholar] [CrossRef]
- Chen, S.; Wang, J.; Gong, P. ROBOT: A Spatiotemporal Fusion Model toward Seamless Data Cube for Global Remote Sensing Applications. Remote Sens. Environ. 2023, 294, 113616. [Google Scholar] [CrossRef]
- Helber, P.; Gram-Hansen, B.; Varatharajan, I.; Azam, F.; Coca-Castro, A.; Kopackova, V.; Bilinski, P. Generating Material Maps to Map Informal Settlements. arXiv 2018, arXiv:1812.00786. [Google Scholar]
- Kotthaus, S.; Smith, T.E.; Wooster, M.J.; Grimmond, C.S.B. Derivation of an Urban Materials Spectral Library through Emittance and Reflectance Spectroscopy. ISPRS J. Photogramm. Remote Sens. 2014, 94, 194–212. [Google Scholar] [CrossRef]
- Najmi, A.; Gevaert, C.M.; Kohli, D.; Kuffer, M.; Pratomo, J. Integrating Remote Sensing and Street View Imagery for Mapping Slums. ISPRS Int. J. Geo-Inf. 2022, 11, 631. [Google Scholar] [CrossRef]
- MacTavish, R.; Bixby, H.; Cavanaugh, A.; Agyei-Mensah, S.; Bawah, A.; Owusu, G.; Ezzati, M.; Arku, R.; Robinson, B.; Schmidt, A.M. Identifying Deprived “Slum” Neighbourhoods in the Greater Accra Metropolitan Area of Ghana Using Census and Remote Sensing Data. World Dev. 2023, 167, 106253. [Google Scholar] [CrossRef]
- Li, C.; Yu, L.; Hong, J. Monitoring Slum and Urban Deprived Area in Sub-Saharan Africa Using Geospatial and Socio-Economic Data; Copernicus Meetings. 2023. Available online: https://meetingorganizer.copernicus.org/EGU23/EGU23-10872.html (accessed on 18 September 2023).
Figure 1.
The location of the study area and ground truth of slums used in this study. (a) the location of Mumbai; (b) Sentinel-2 image used in this study; (c) ground truth of slums; (d) the selected subarea of Mumbai.
Figure 1.
The location of the study area and ground truth of slums used in this study. (a) the location of Mumbai; (b) Sentinel-2 image used in this study; (c) ground truth of slums; (d) the selected subarea of Mumbai.
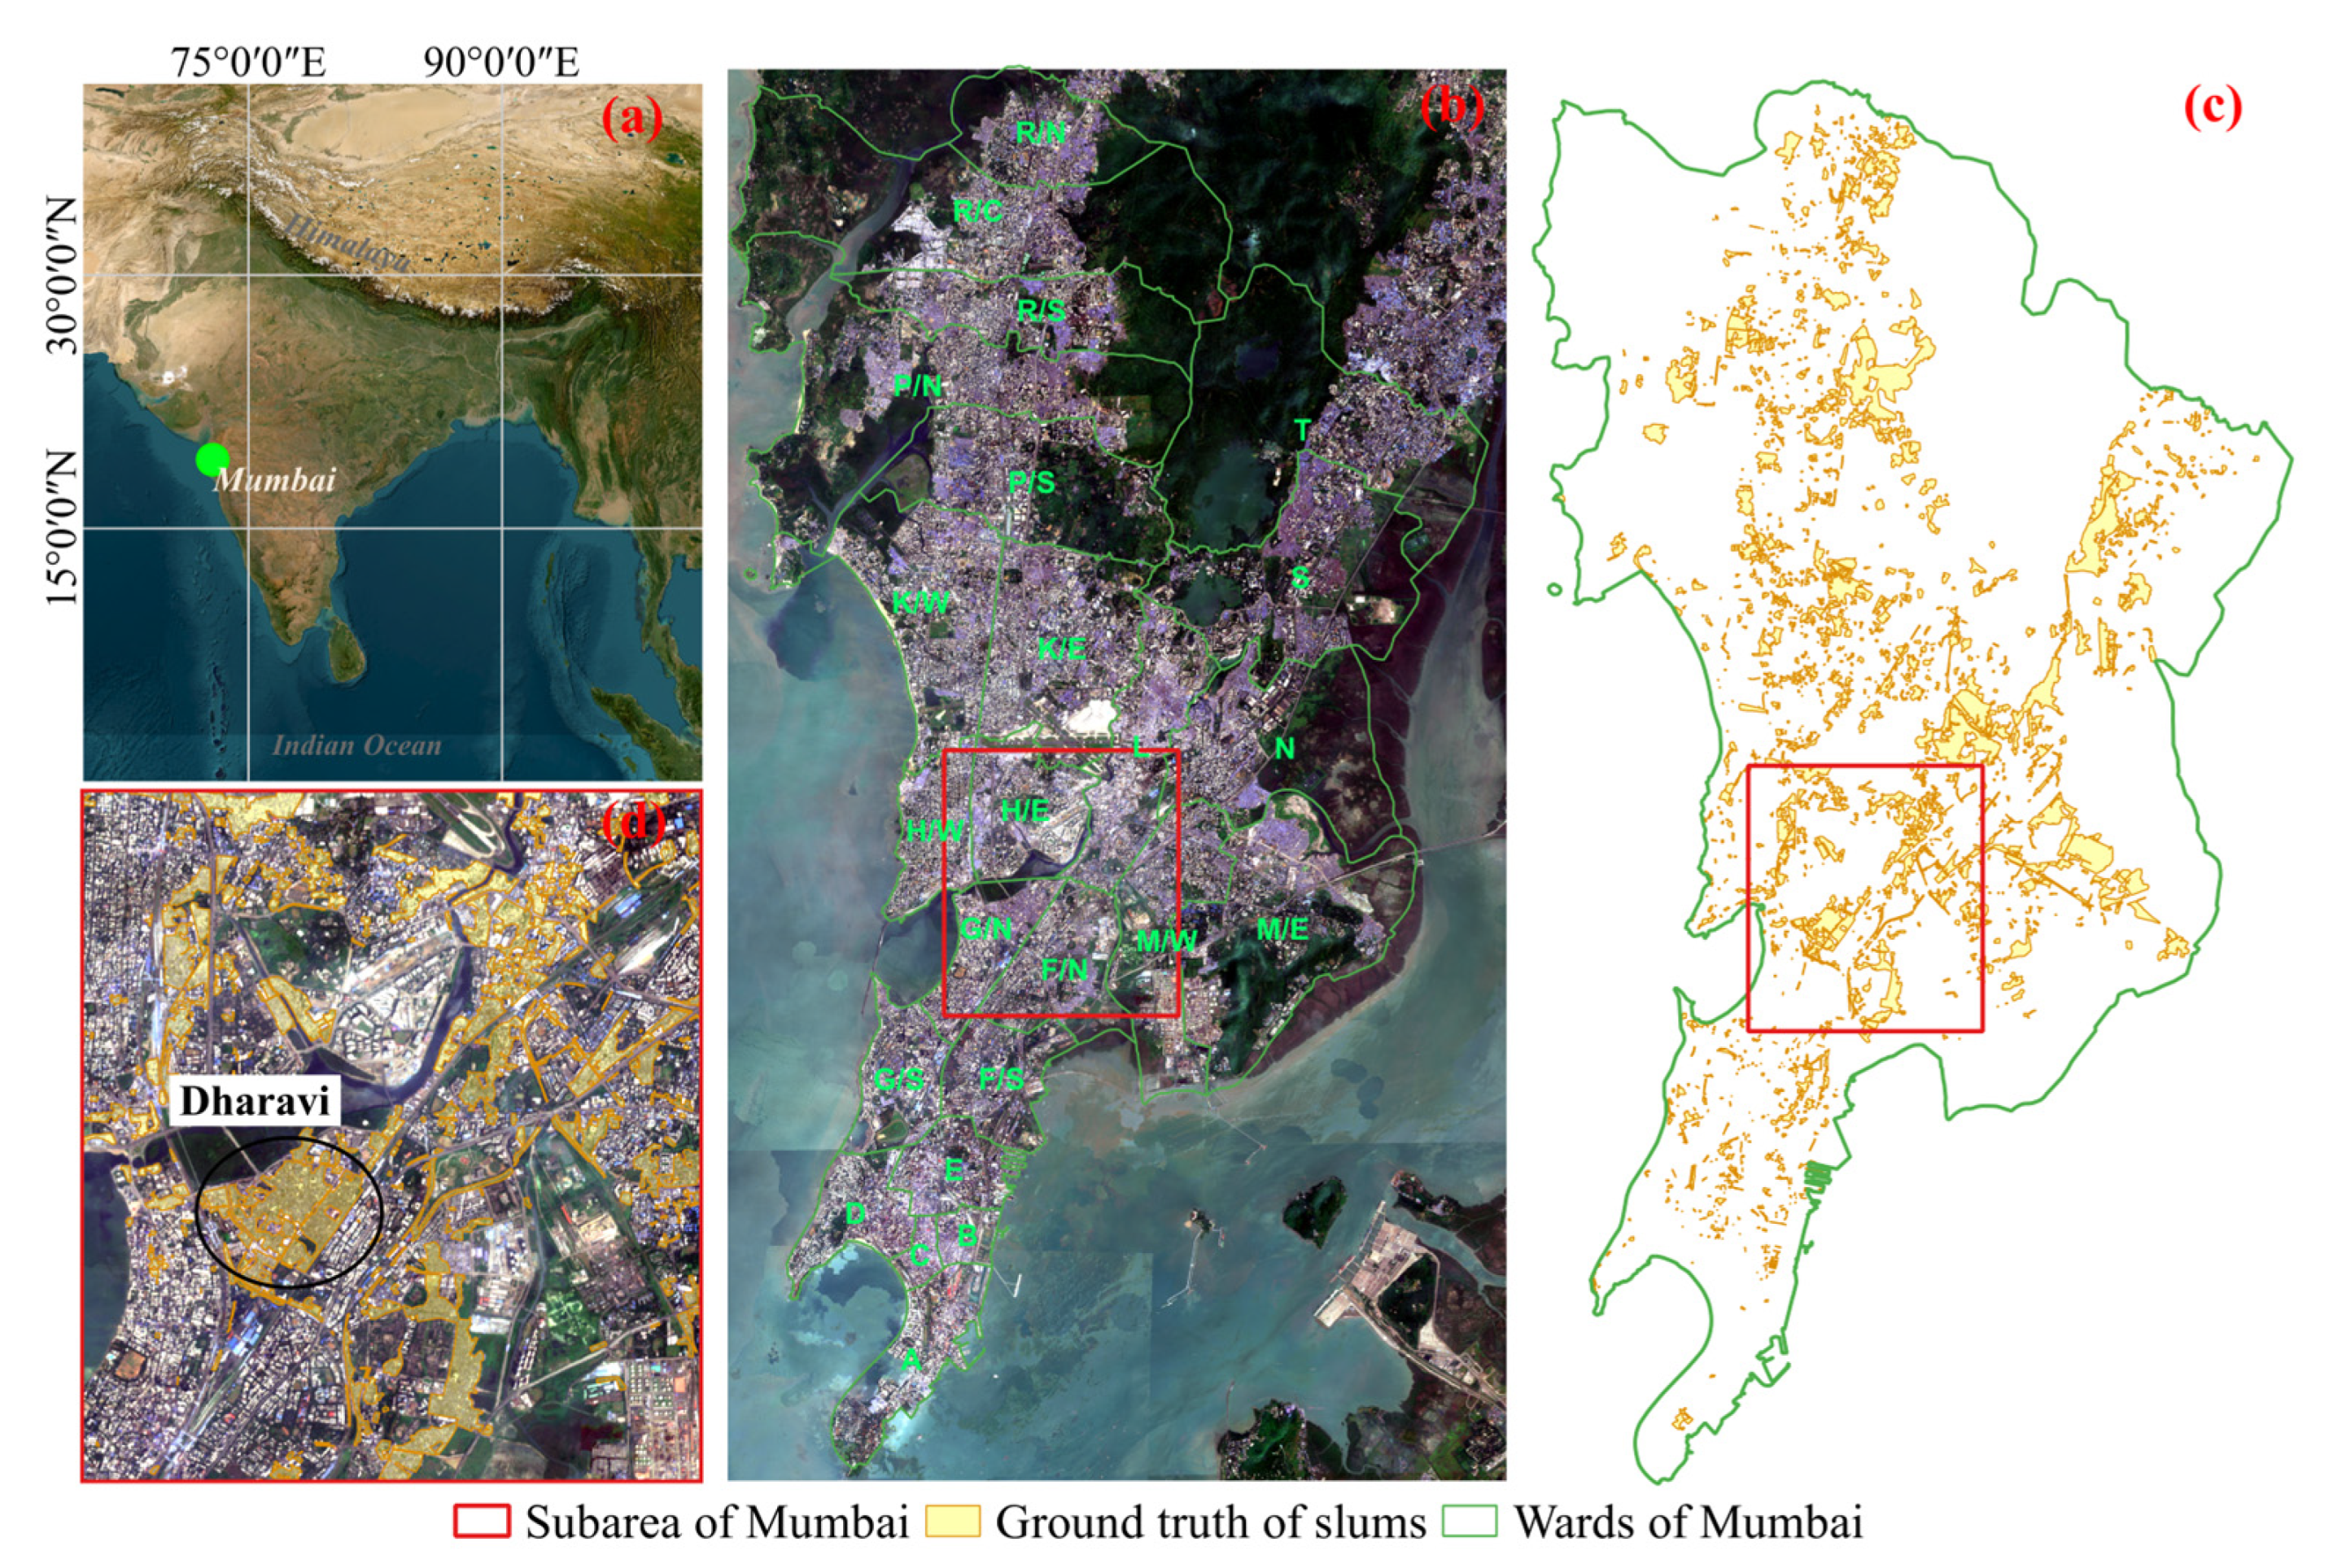
Figure 2.
Spectral profiles of samples of four categories.
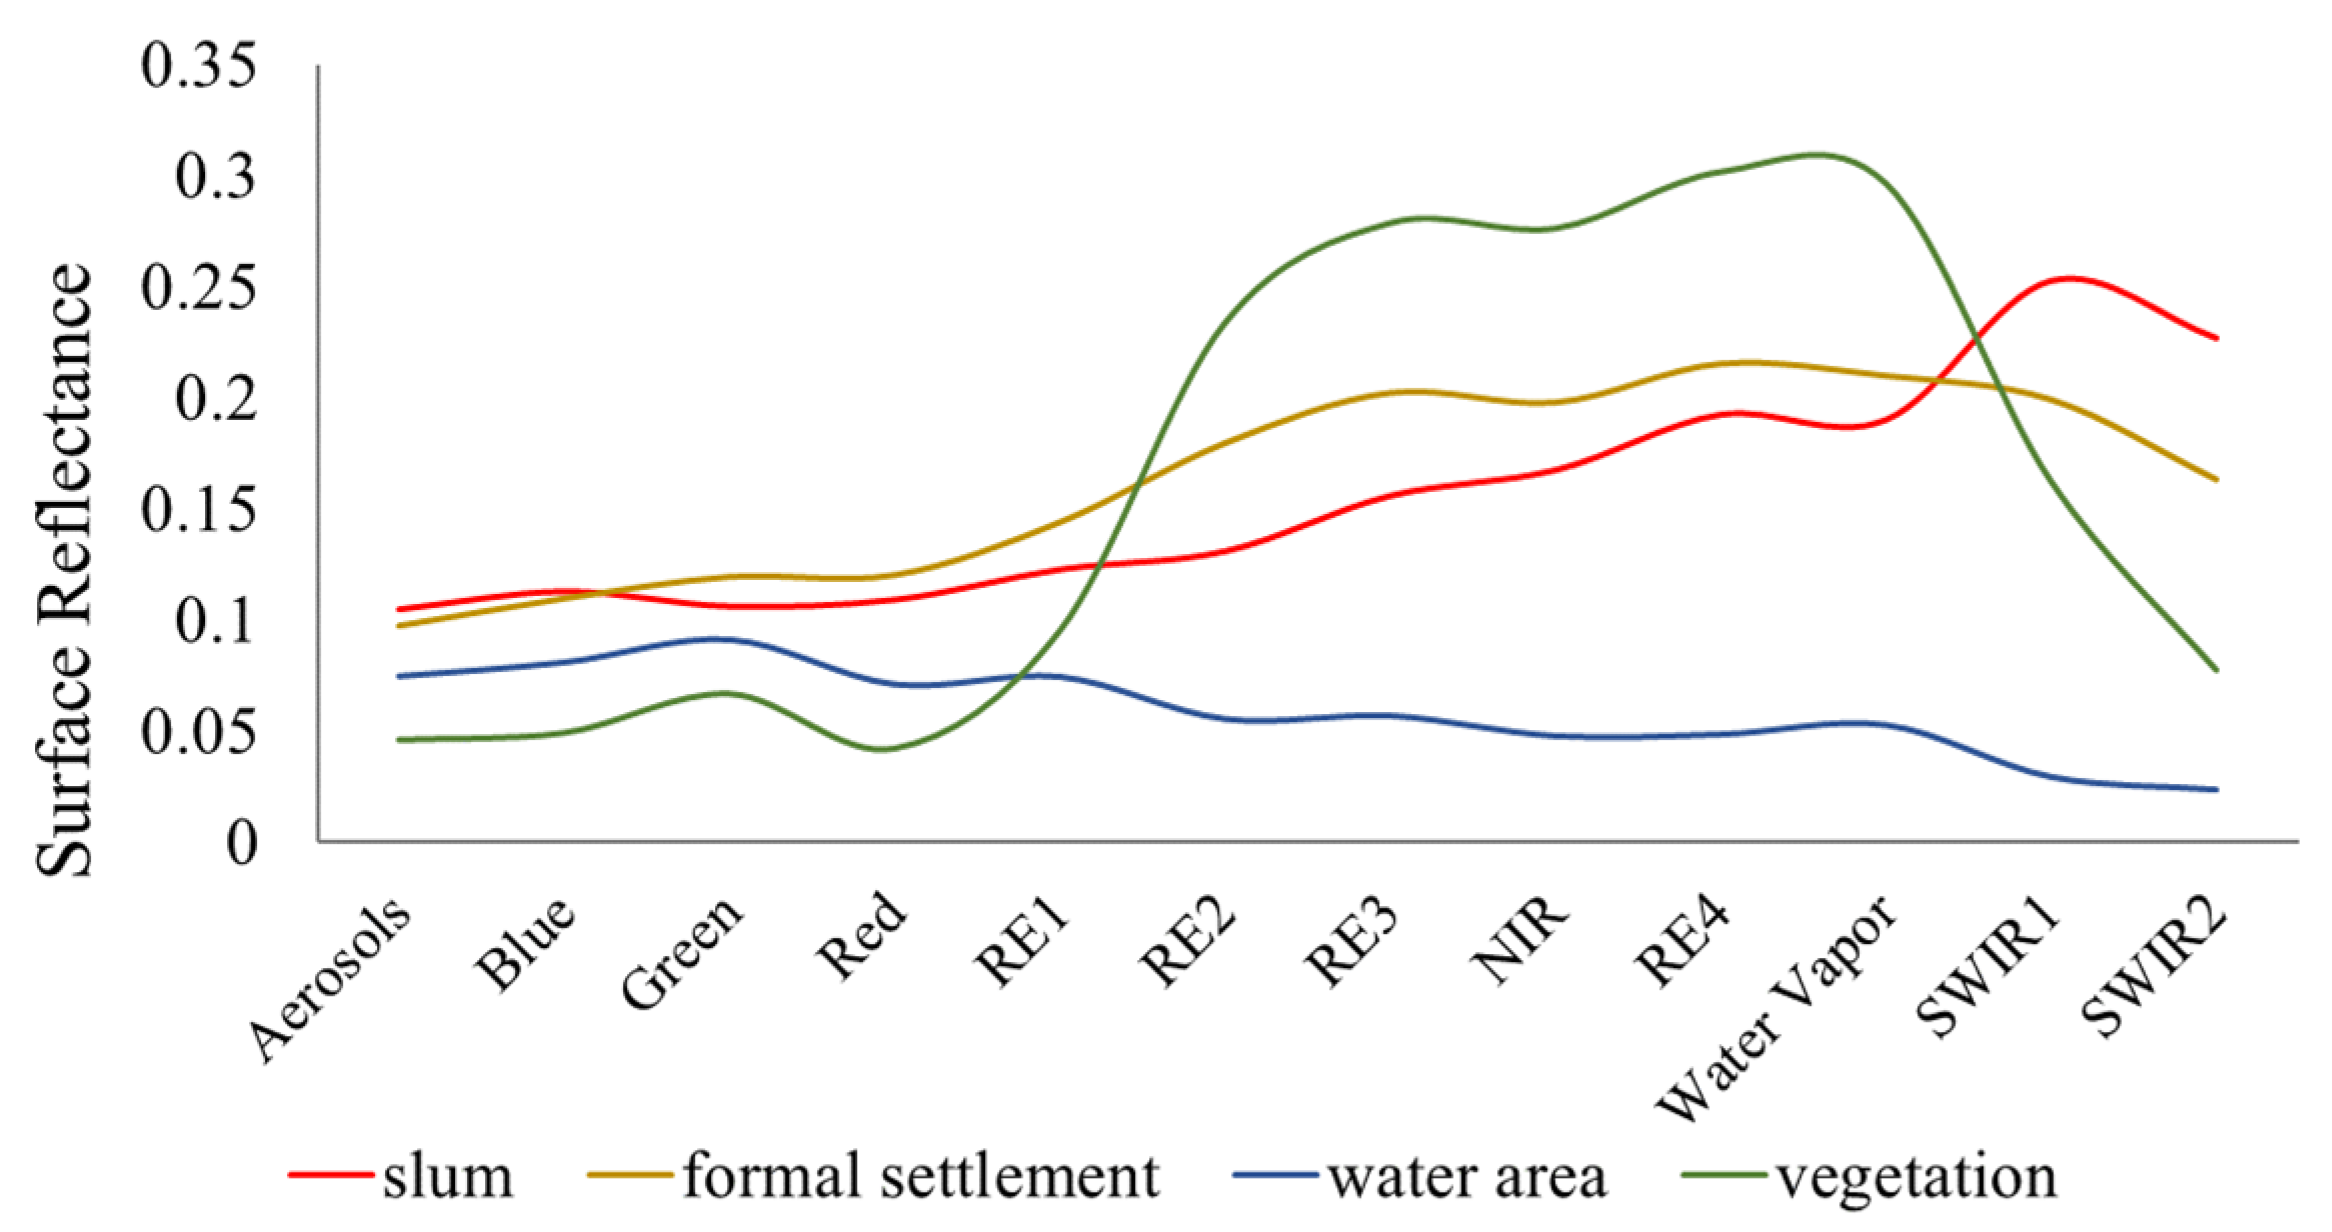
Figure 3.
The distribution of ROIs collected for the categories of slums, formal settlements, water areas and vegetation.
Figure 3.
The distribution of ROIs collected for the categories of slums, formal settlements, water areas and vegetation.
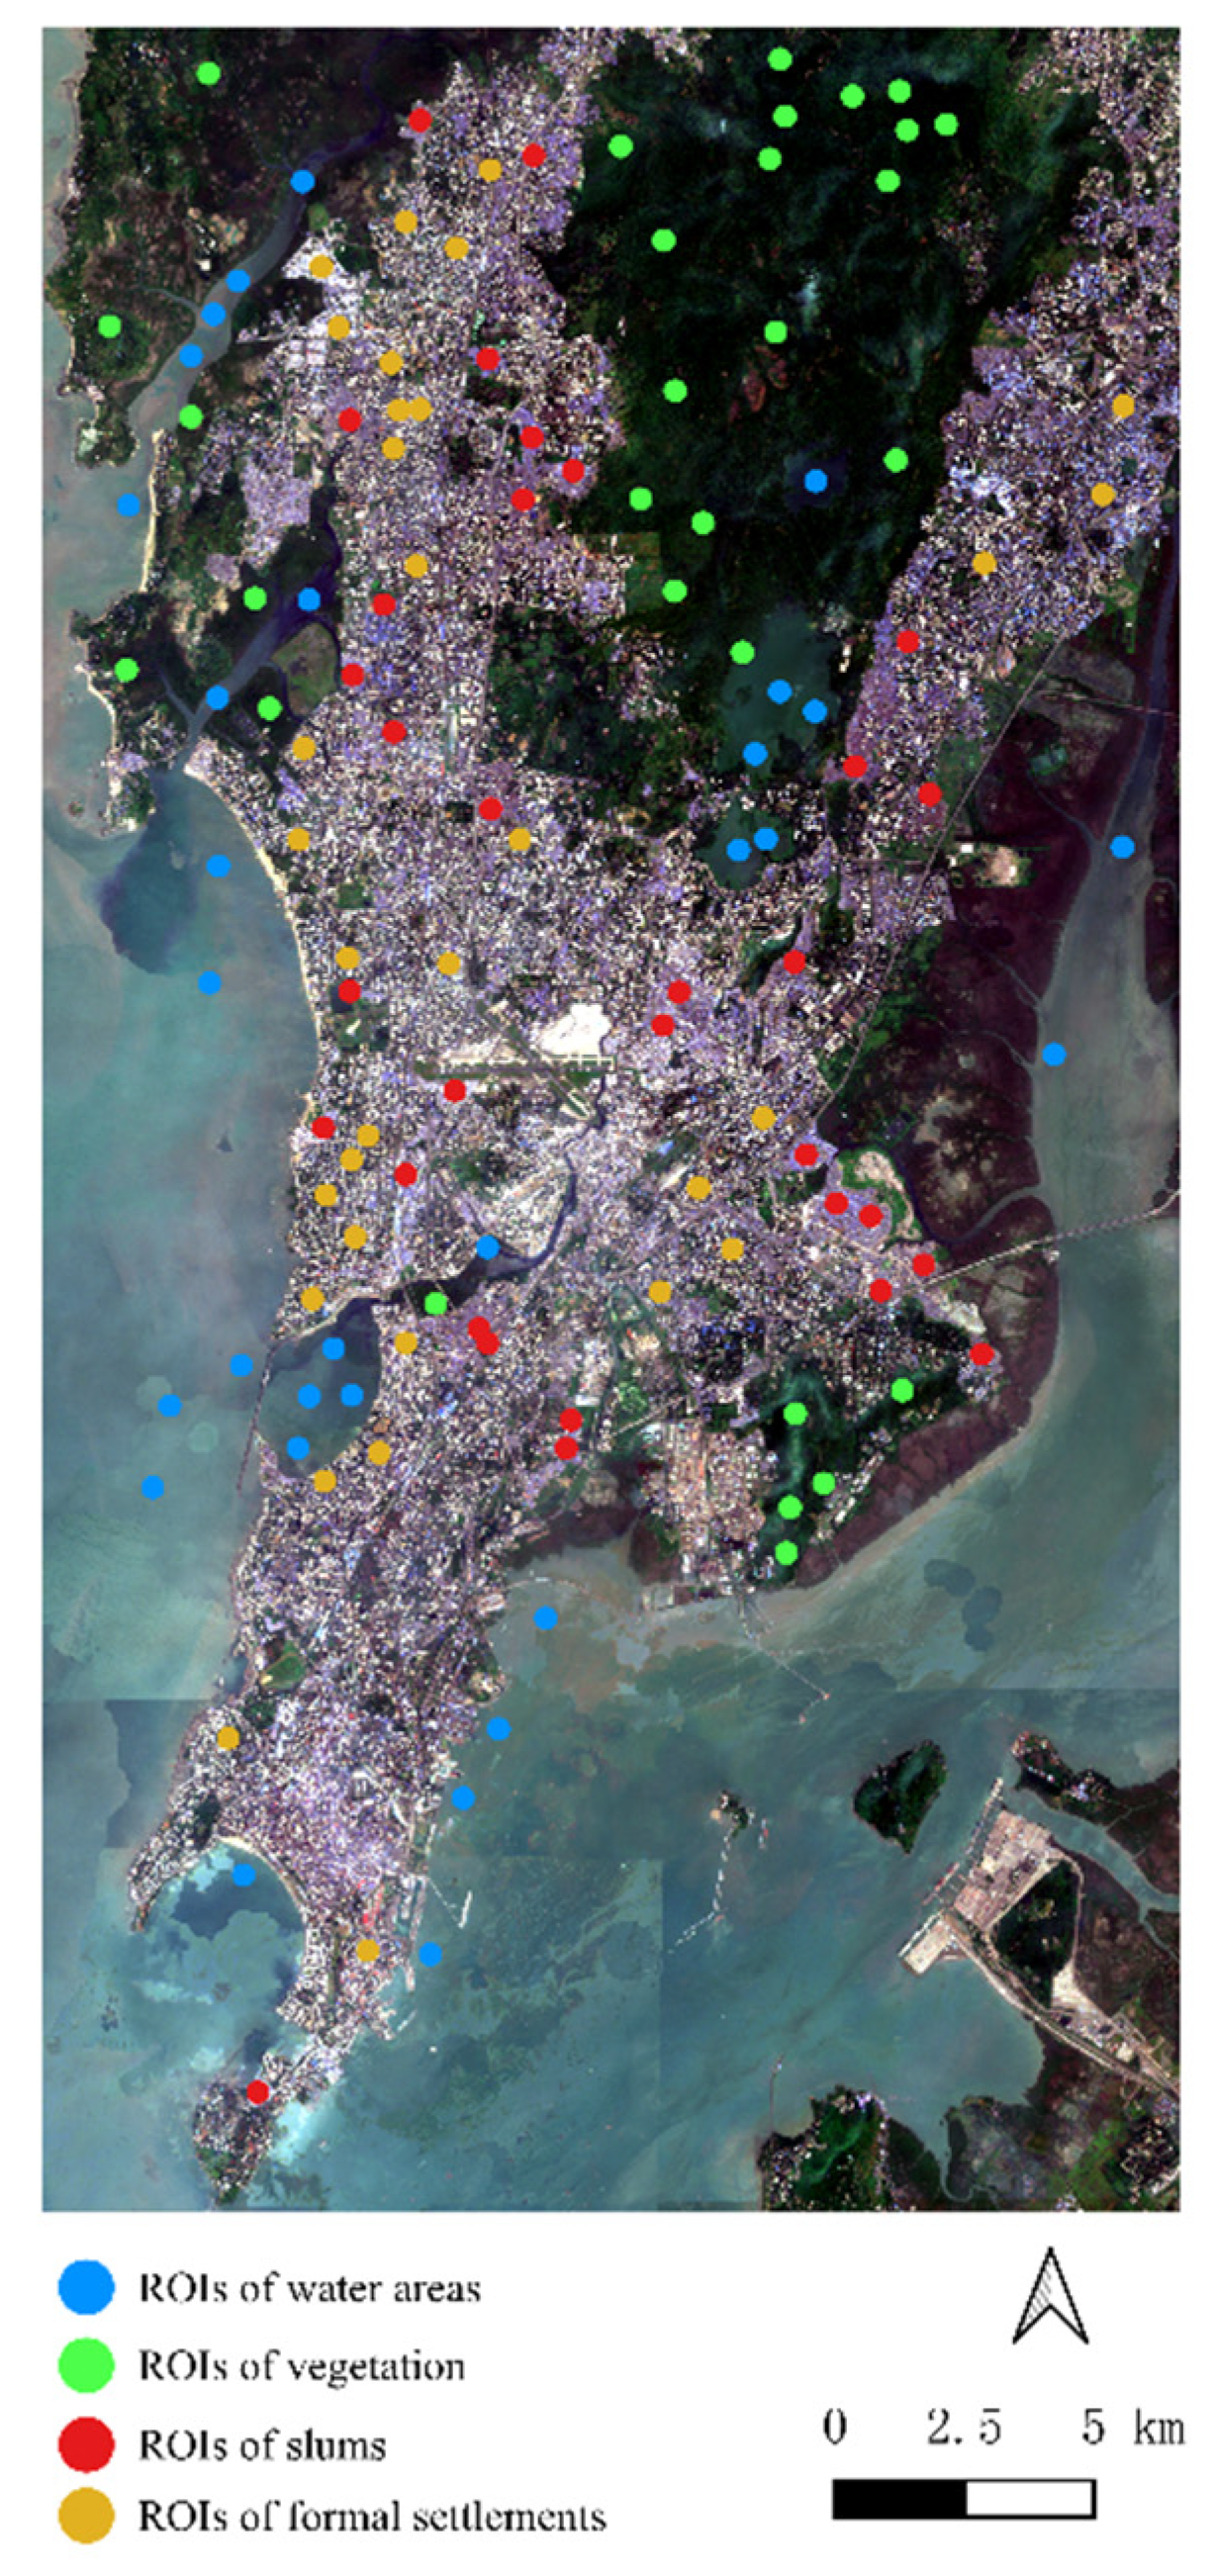
Figure 4.
Illustration of our method. (a) Overall flowchart; (b) flowchart of the threshold-based classification; (c) flowchart of the ML-based classification.
Figure 4.
Illustration of our method. (a) Overall flowchart; (b) flowchart of the threshold-based classification; (c) flowchart of the ML-based classification.

Figure 5.
CSSI maps and normalized GLCMvar image in Mumbai. (a) CSSI-1 map; (b) CSSI-2 map; (c) normalized GLCMvar image.
Figure 5.
CSSI maps and normalized GLCMvar image in Mumbai. (a) CSSI-1 map; (b) CSSI-2 map; (c) normalized GLCMvar image.

Figure 6.
CSSI maps and normalized GLCMvar image in an example region of Mumbai. (a) Sentinel-2 RGB composite; (b) CSSI-1; (c) CSSI-2; (d) normalized GLCMvar image.
Figure 6.
CSSI maps and normalized GLCMvar image in an example region of Mumbai. (a) Sentinel-2 RGB composite; (b) CSSI-1; (c) CSSI-2; (d) normalized GLCMvar image.
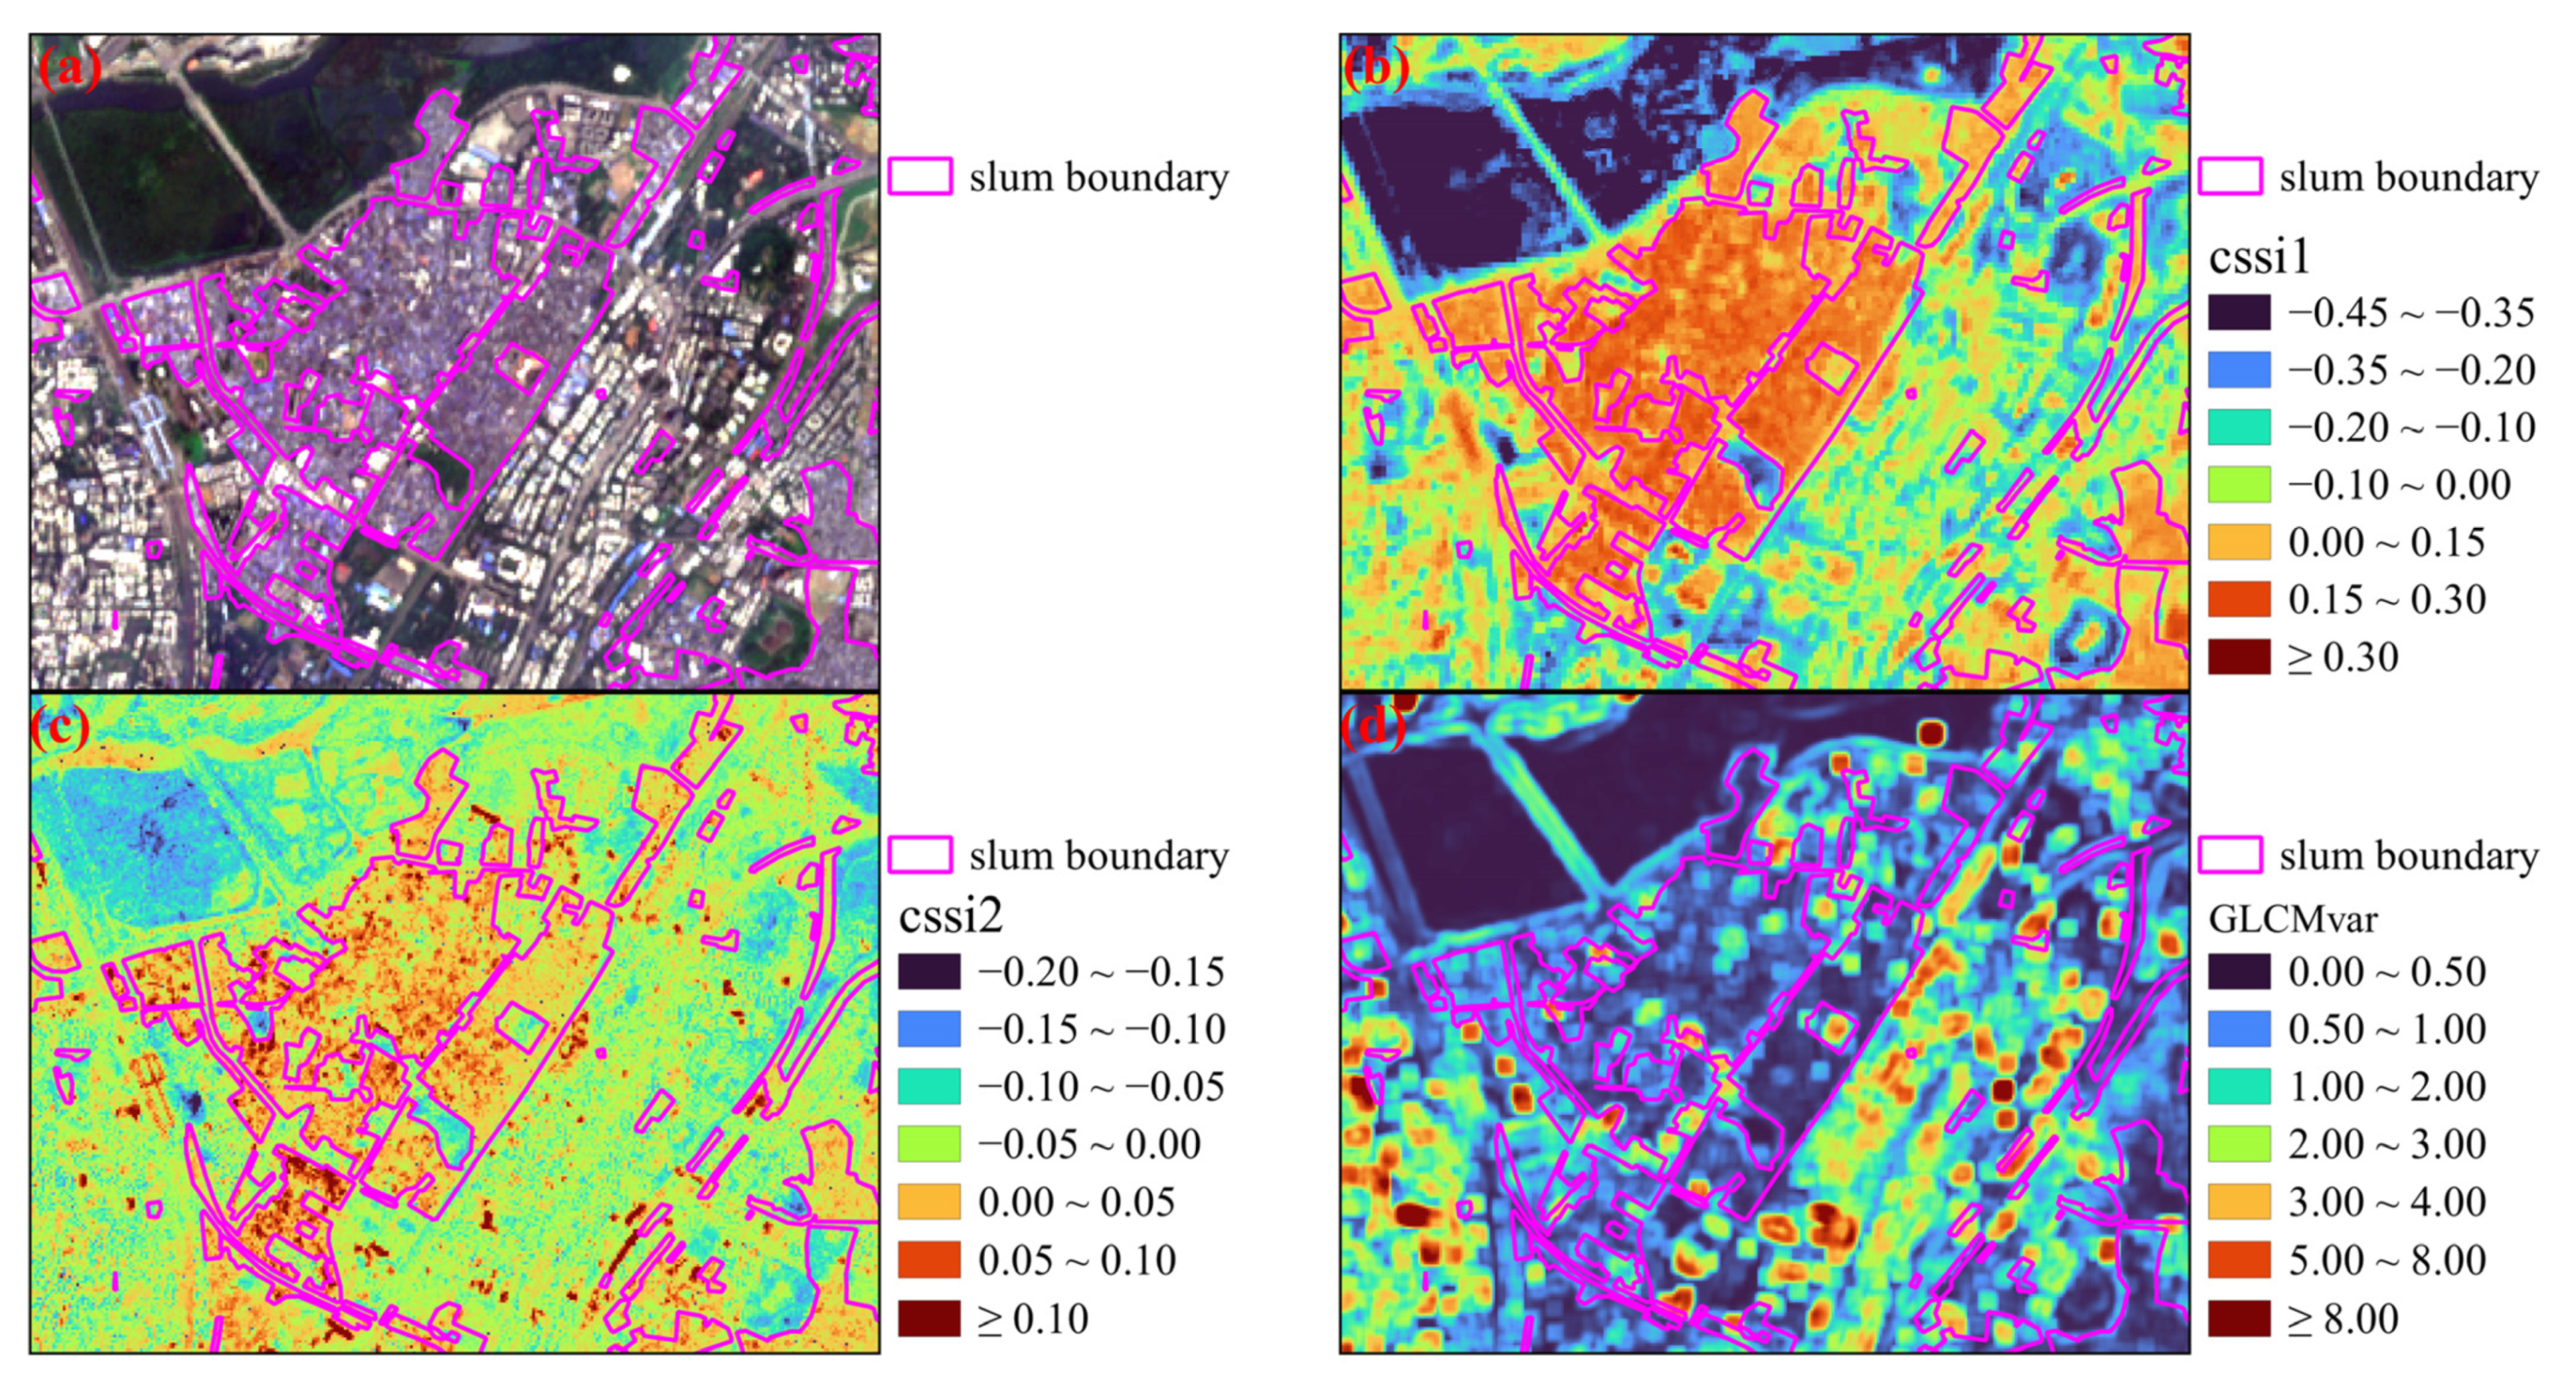
Figure 7.
Probability density of ROIs of CSSI-1, CSSI-2 and GLCMvar. KDE: Kenel Density Estimate. (a) Probability density of CSSI-1. (b) Probability density of CSSI-2. (c) Probability density of normalized GLCMvar.
Figure 7.
Probability density of ROIs of CSSI-1, CSSI-2 and GLCMvar. KDE: Kenel Density Estimate. (a) Probability density of CSSI-1. (b) Probability density of CSSI-2. (c) Probability density of normalized GLCMvar.
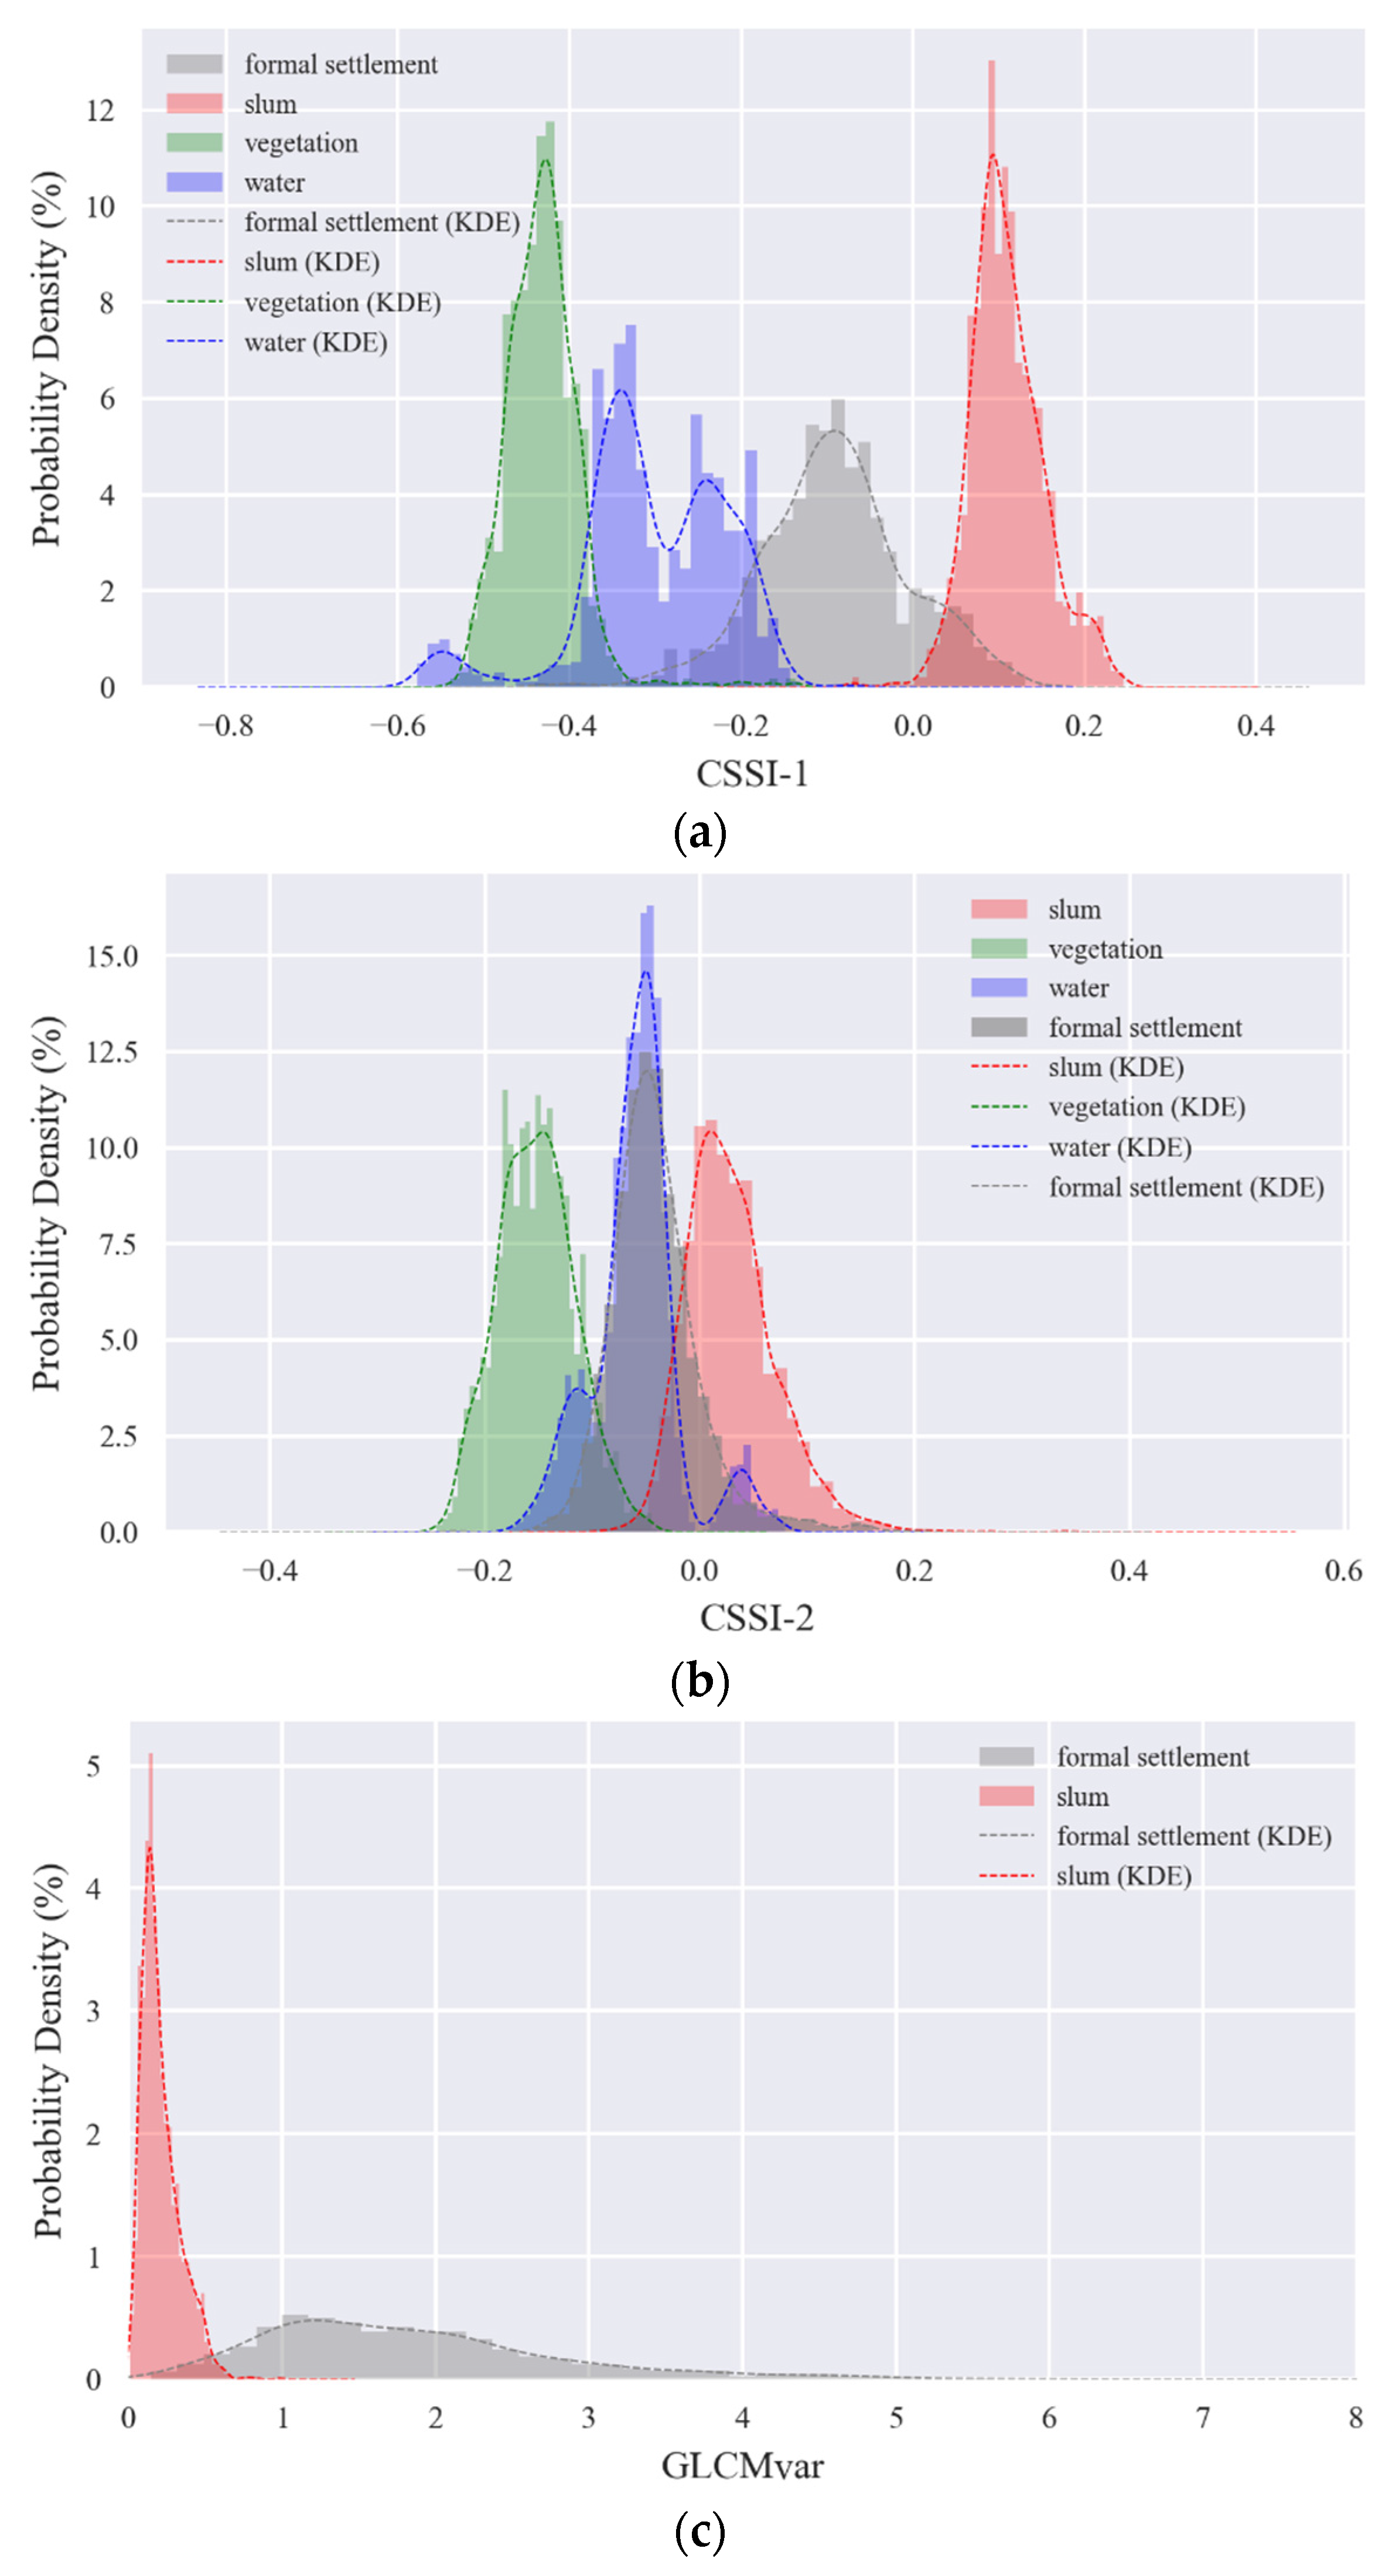
Figure 8.
Our slum mapping results in Mumbai. (a) Threshold-based method; (b) ML-based method.

Figure 9.
Our slum mapping results in the subarea of Mumbai. (a) Threshold-based method; (b) ML-based method.
Figure 9.
Our slum mapping results in the subarea of Mumbai. (a) Threshold-based method; (b) ML-based method.

Figure 10.
Comparisons of mapping large-sized slum patches between threshold-based results and ML-based results.
Figure 10.
Comparisons of mapping large-sized slum patches between threshold-based results and ML-based results.
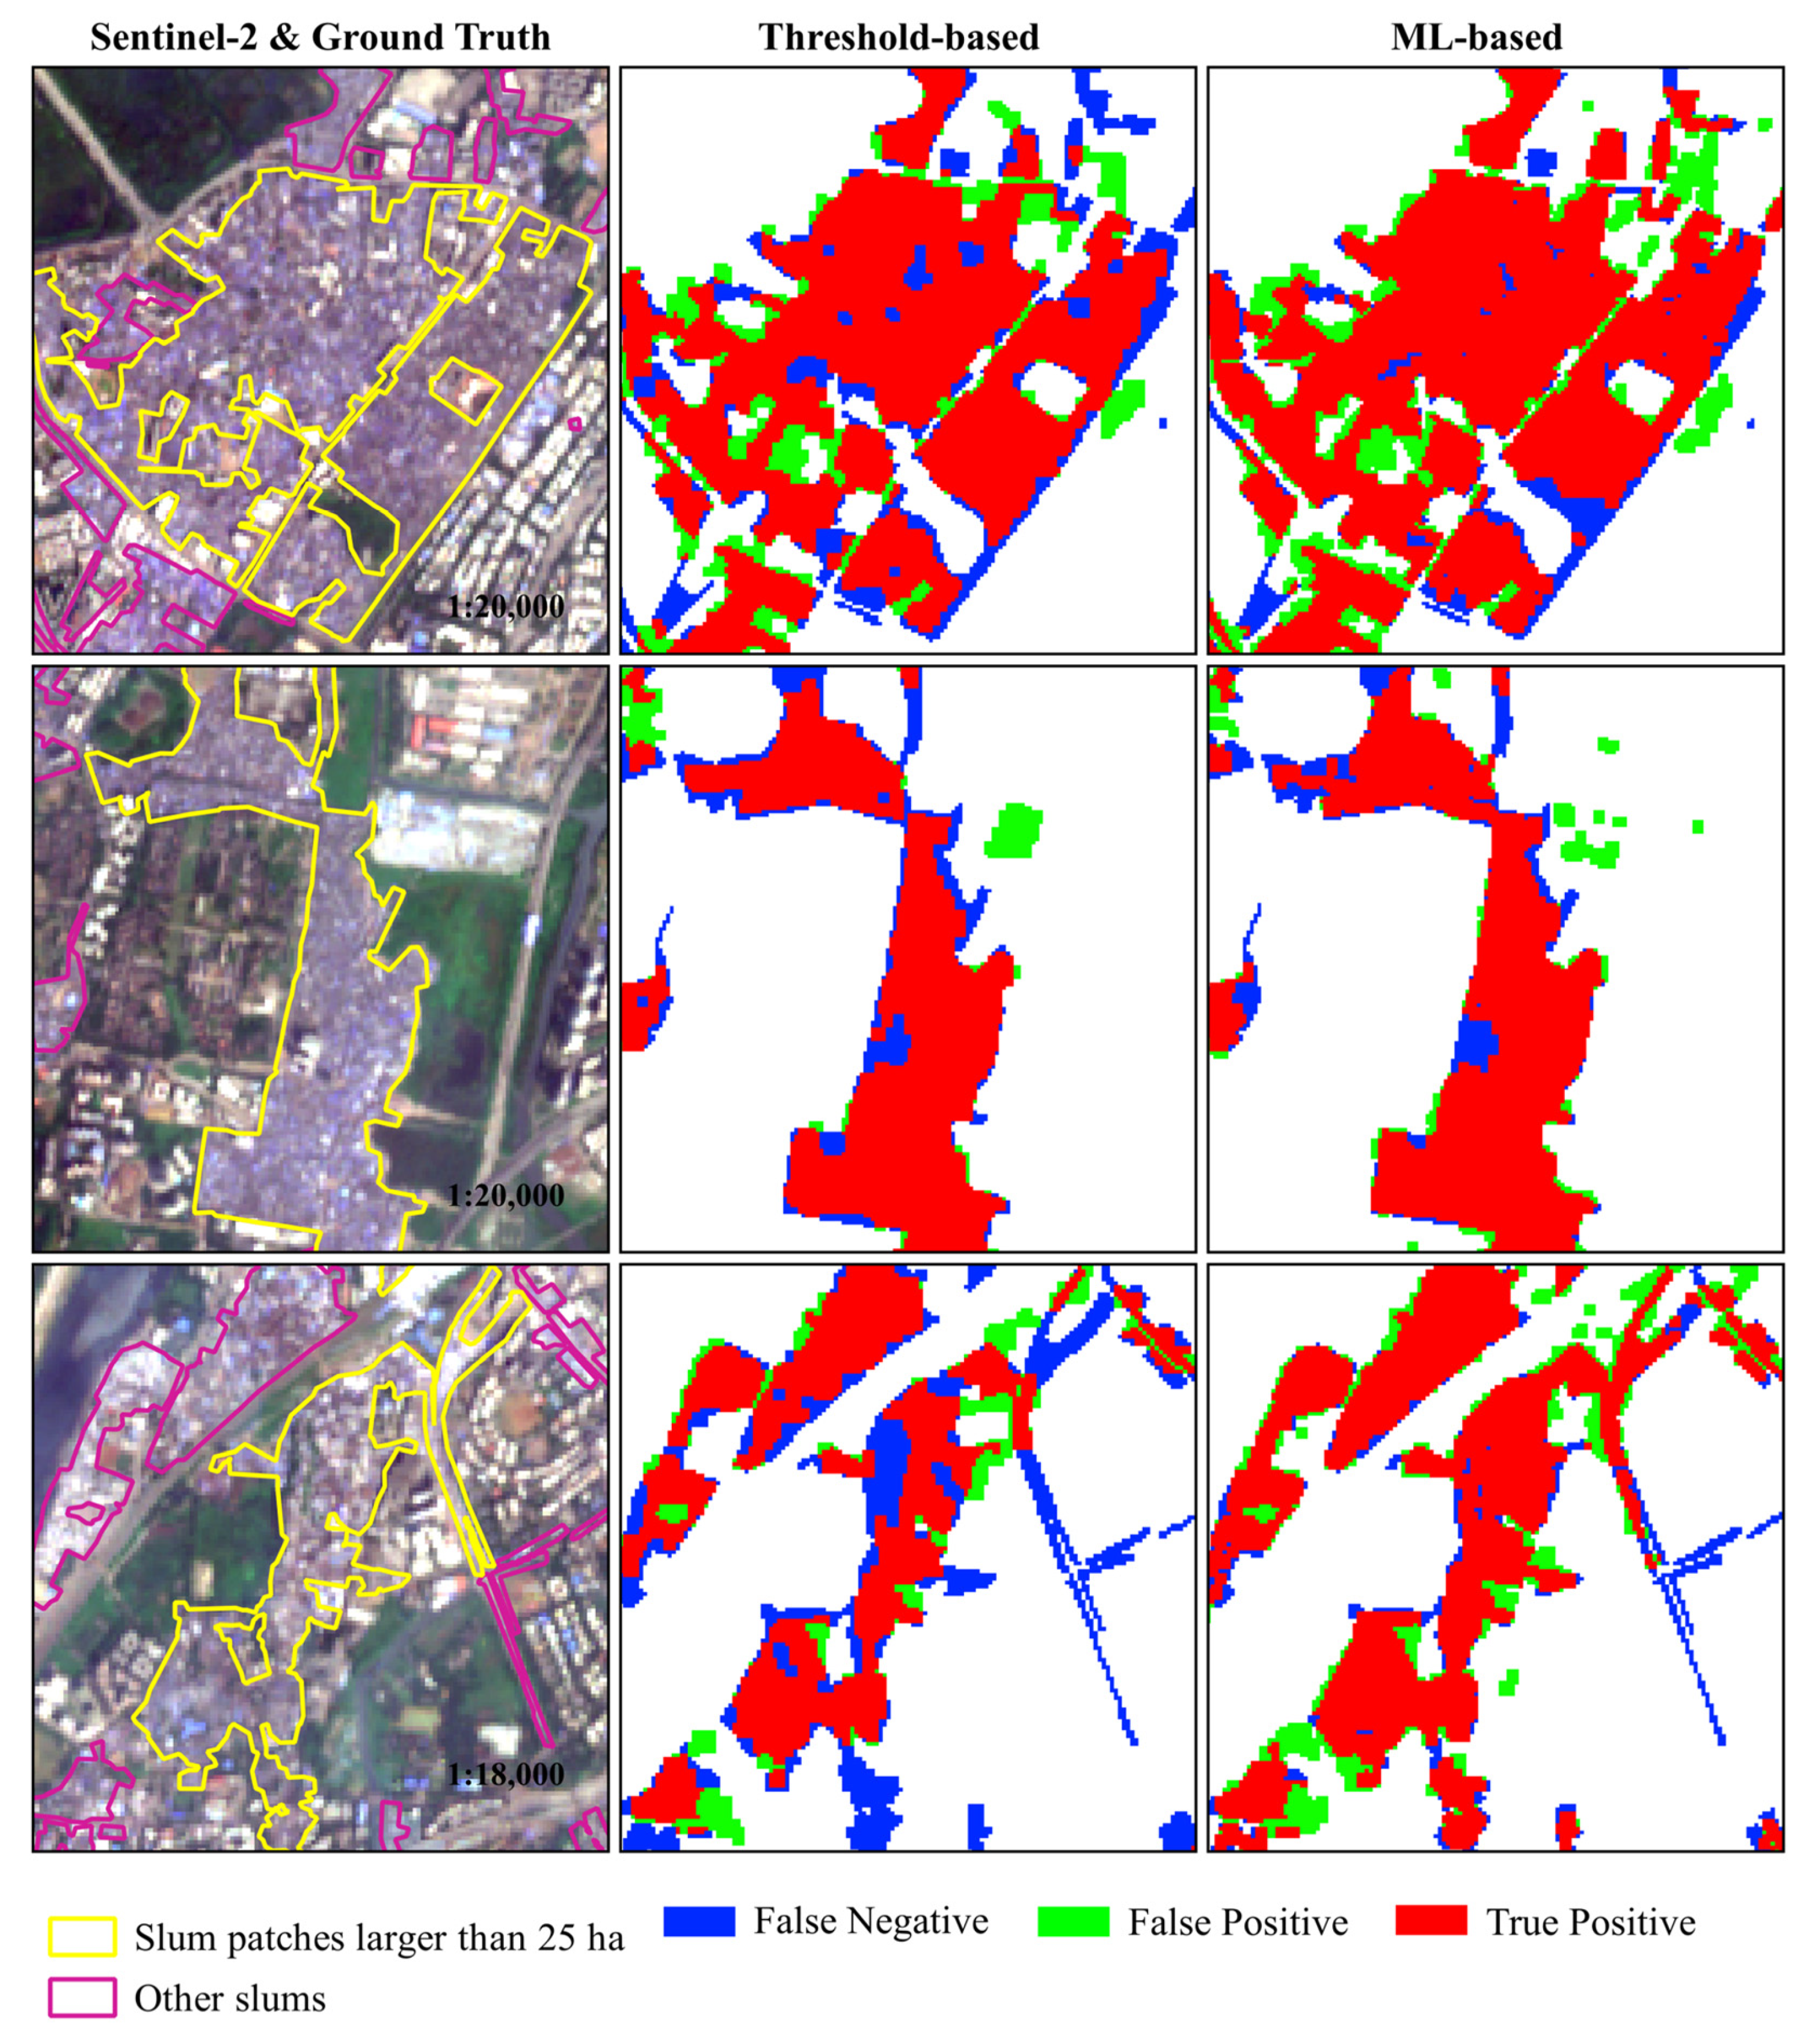
Figure 11.
Comparisons of mapping medium-sized slum patches between threshold-based results and ML-based results.
Figure 11.
Comparisons of mapping medium-sized slum patches between threshold-based results and ML-based results.
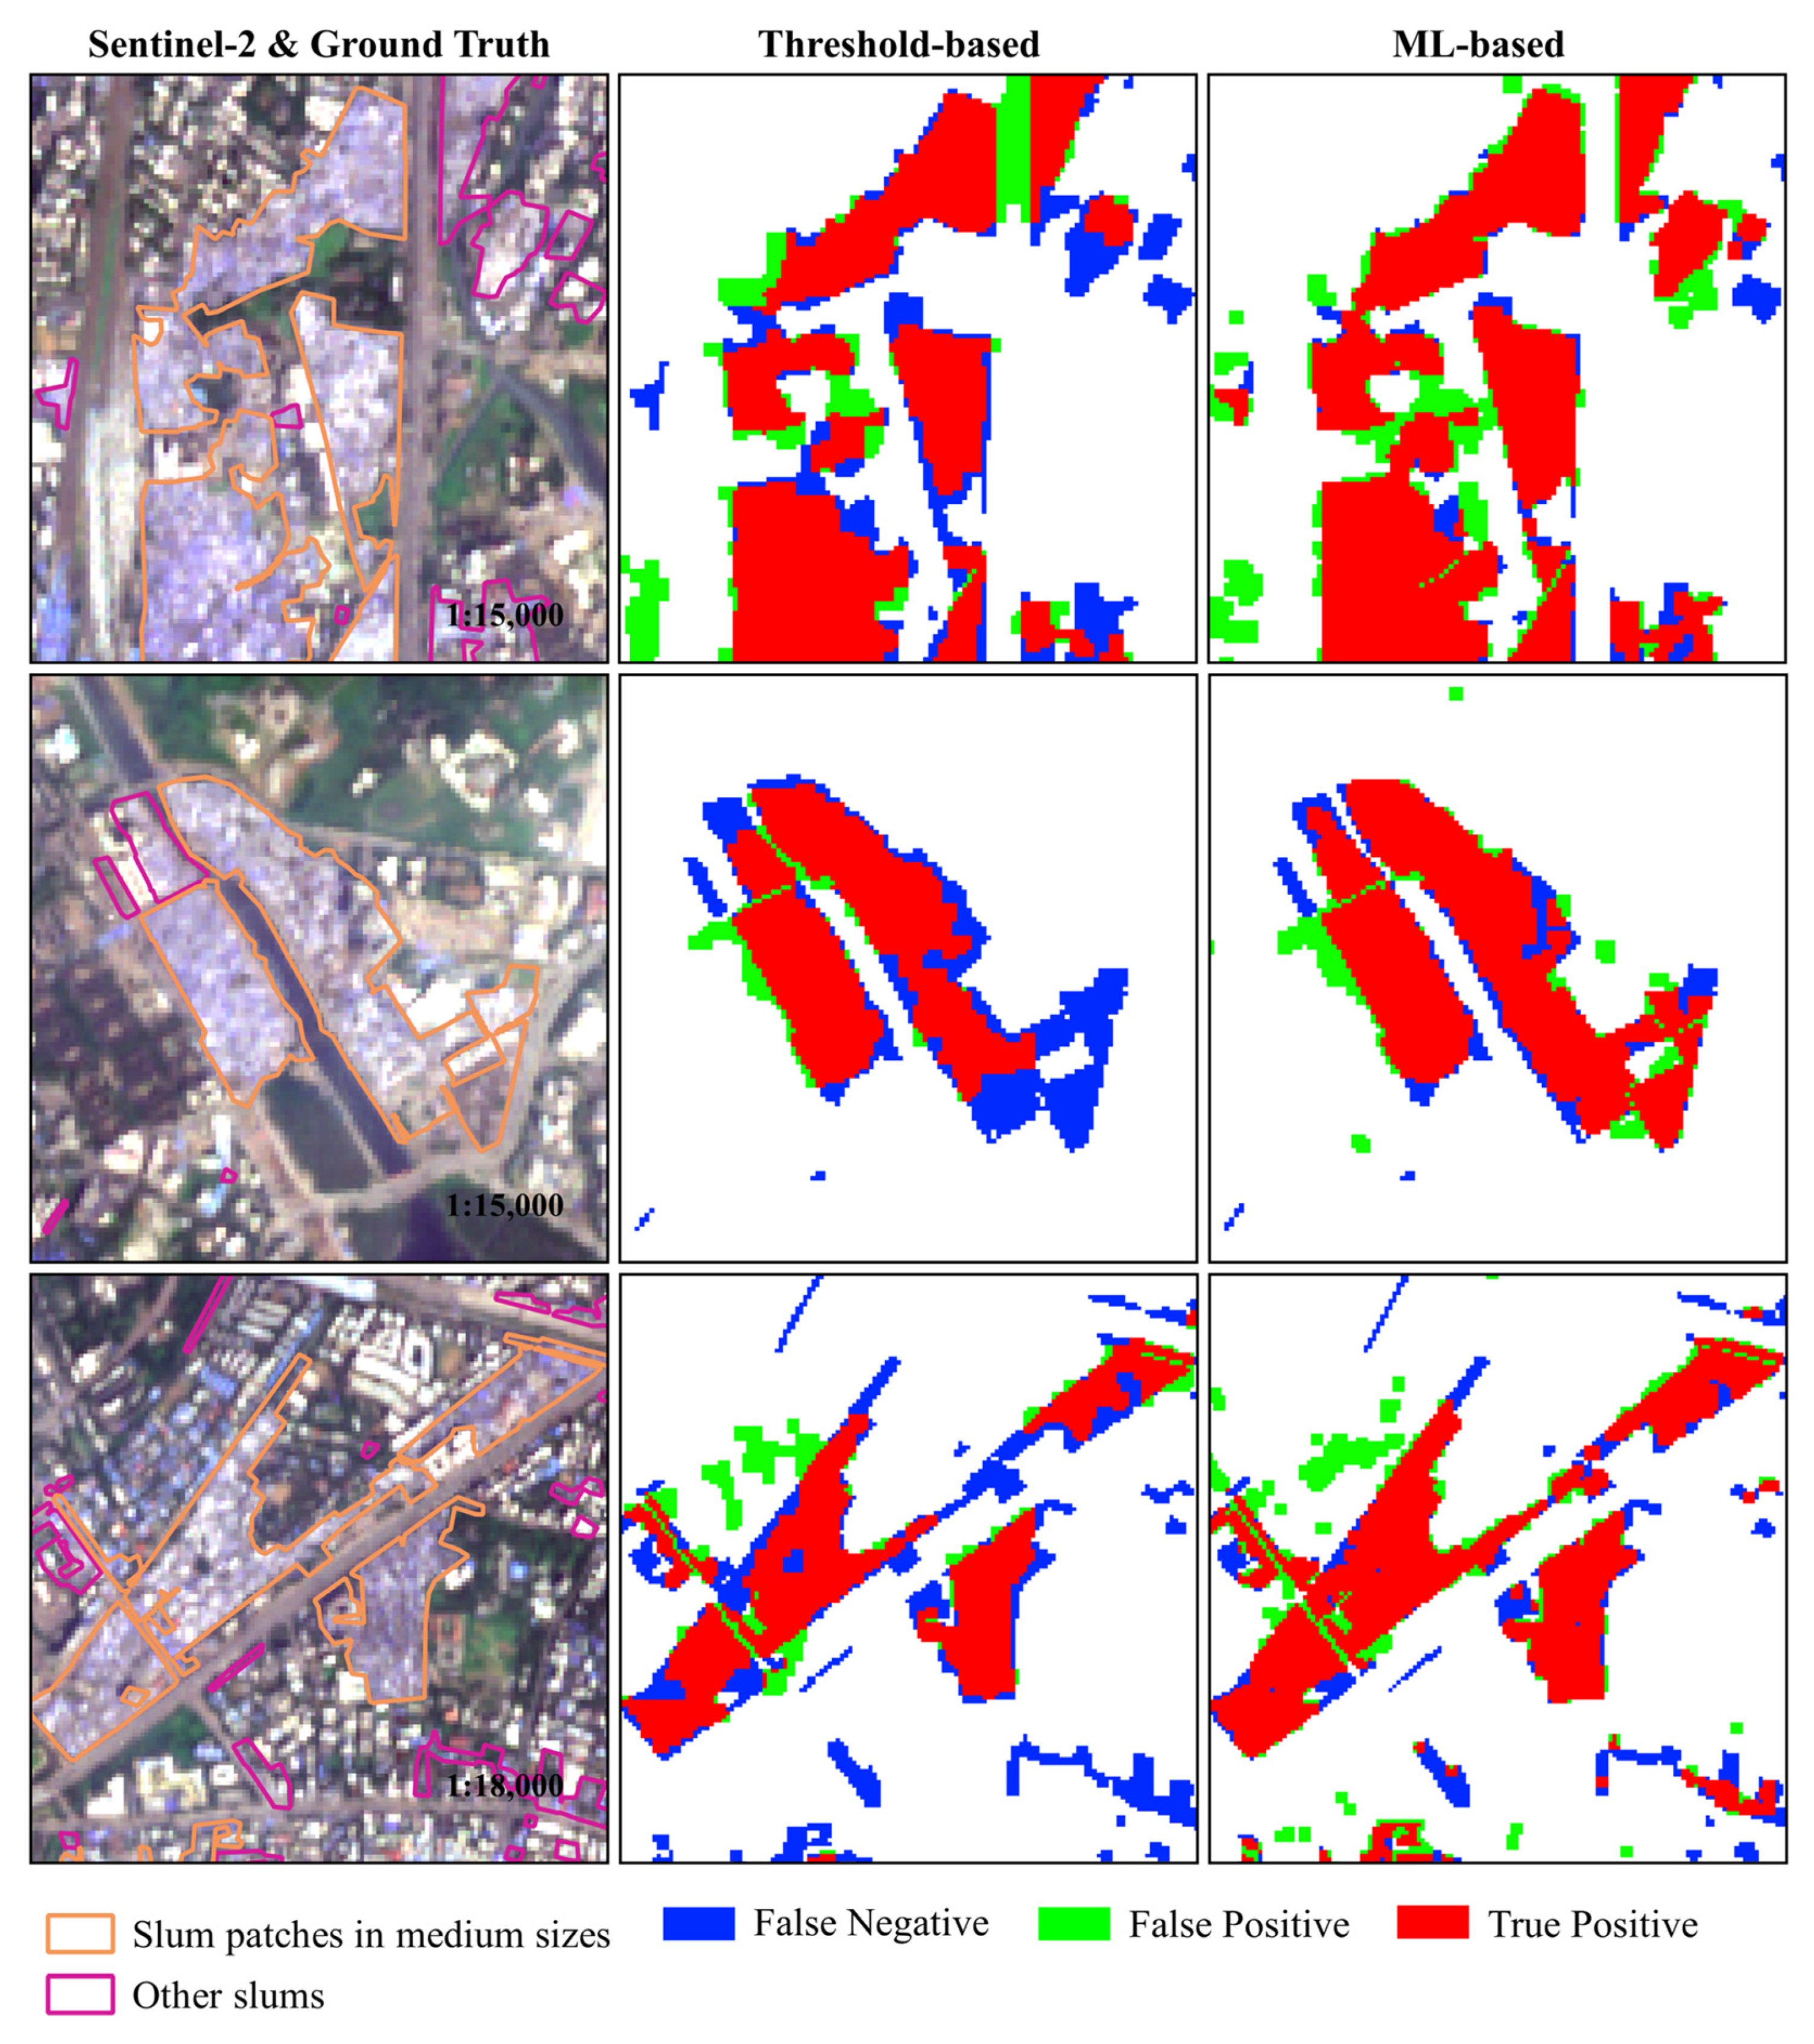
Figure 12.
Comparisons of mapping small-sized slum pockets between threshold-based results and ML-based results.
Figure 12.
Comparisons of mapping small-sized slum pockets between threshold-based results and ML-based results.
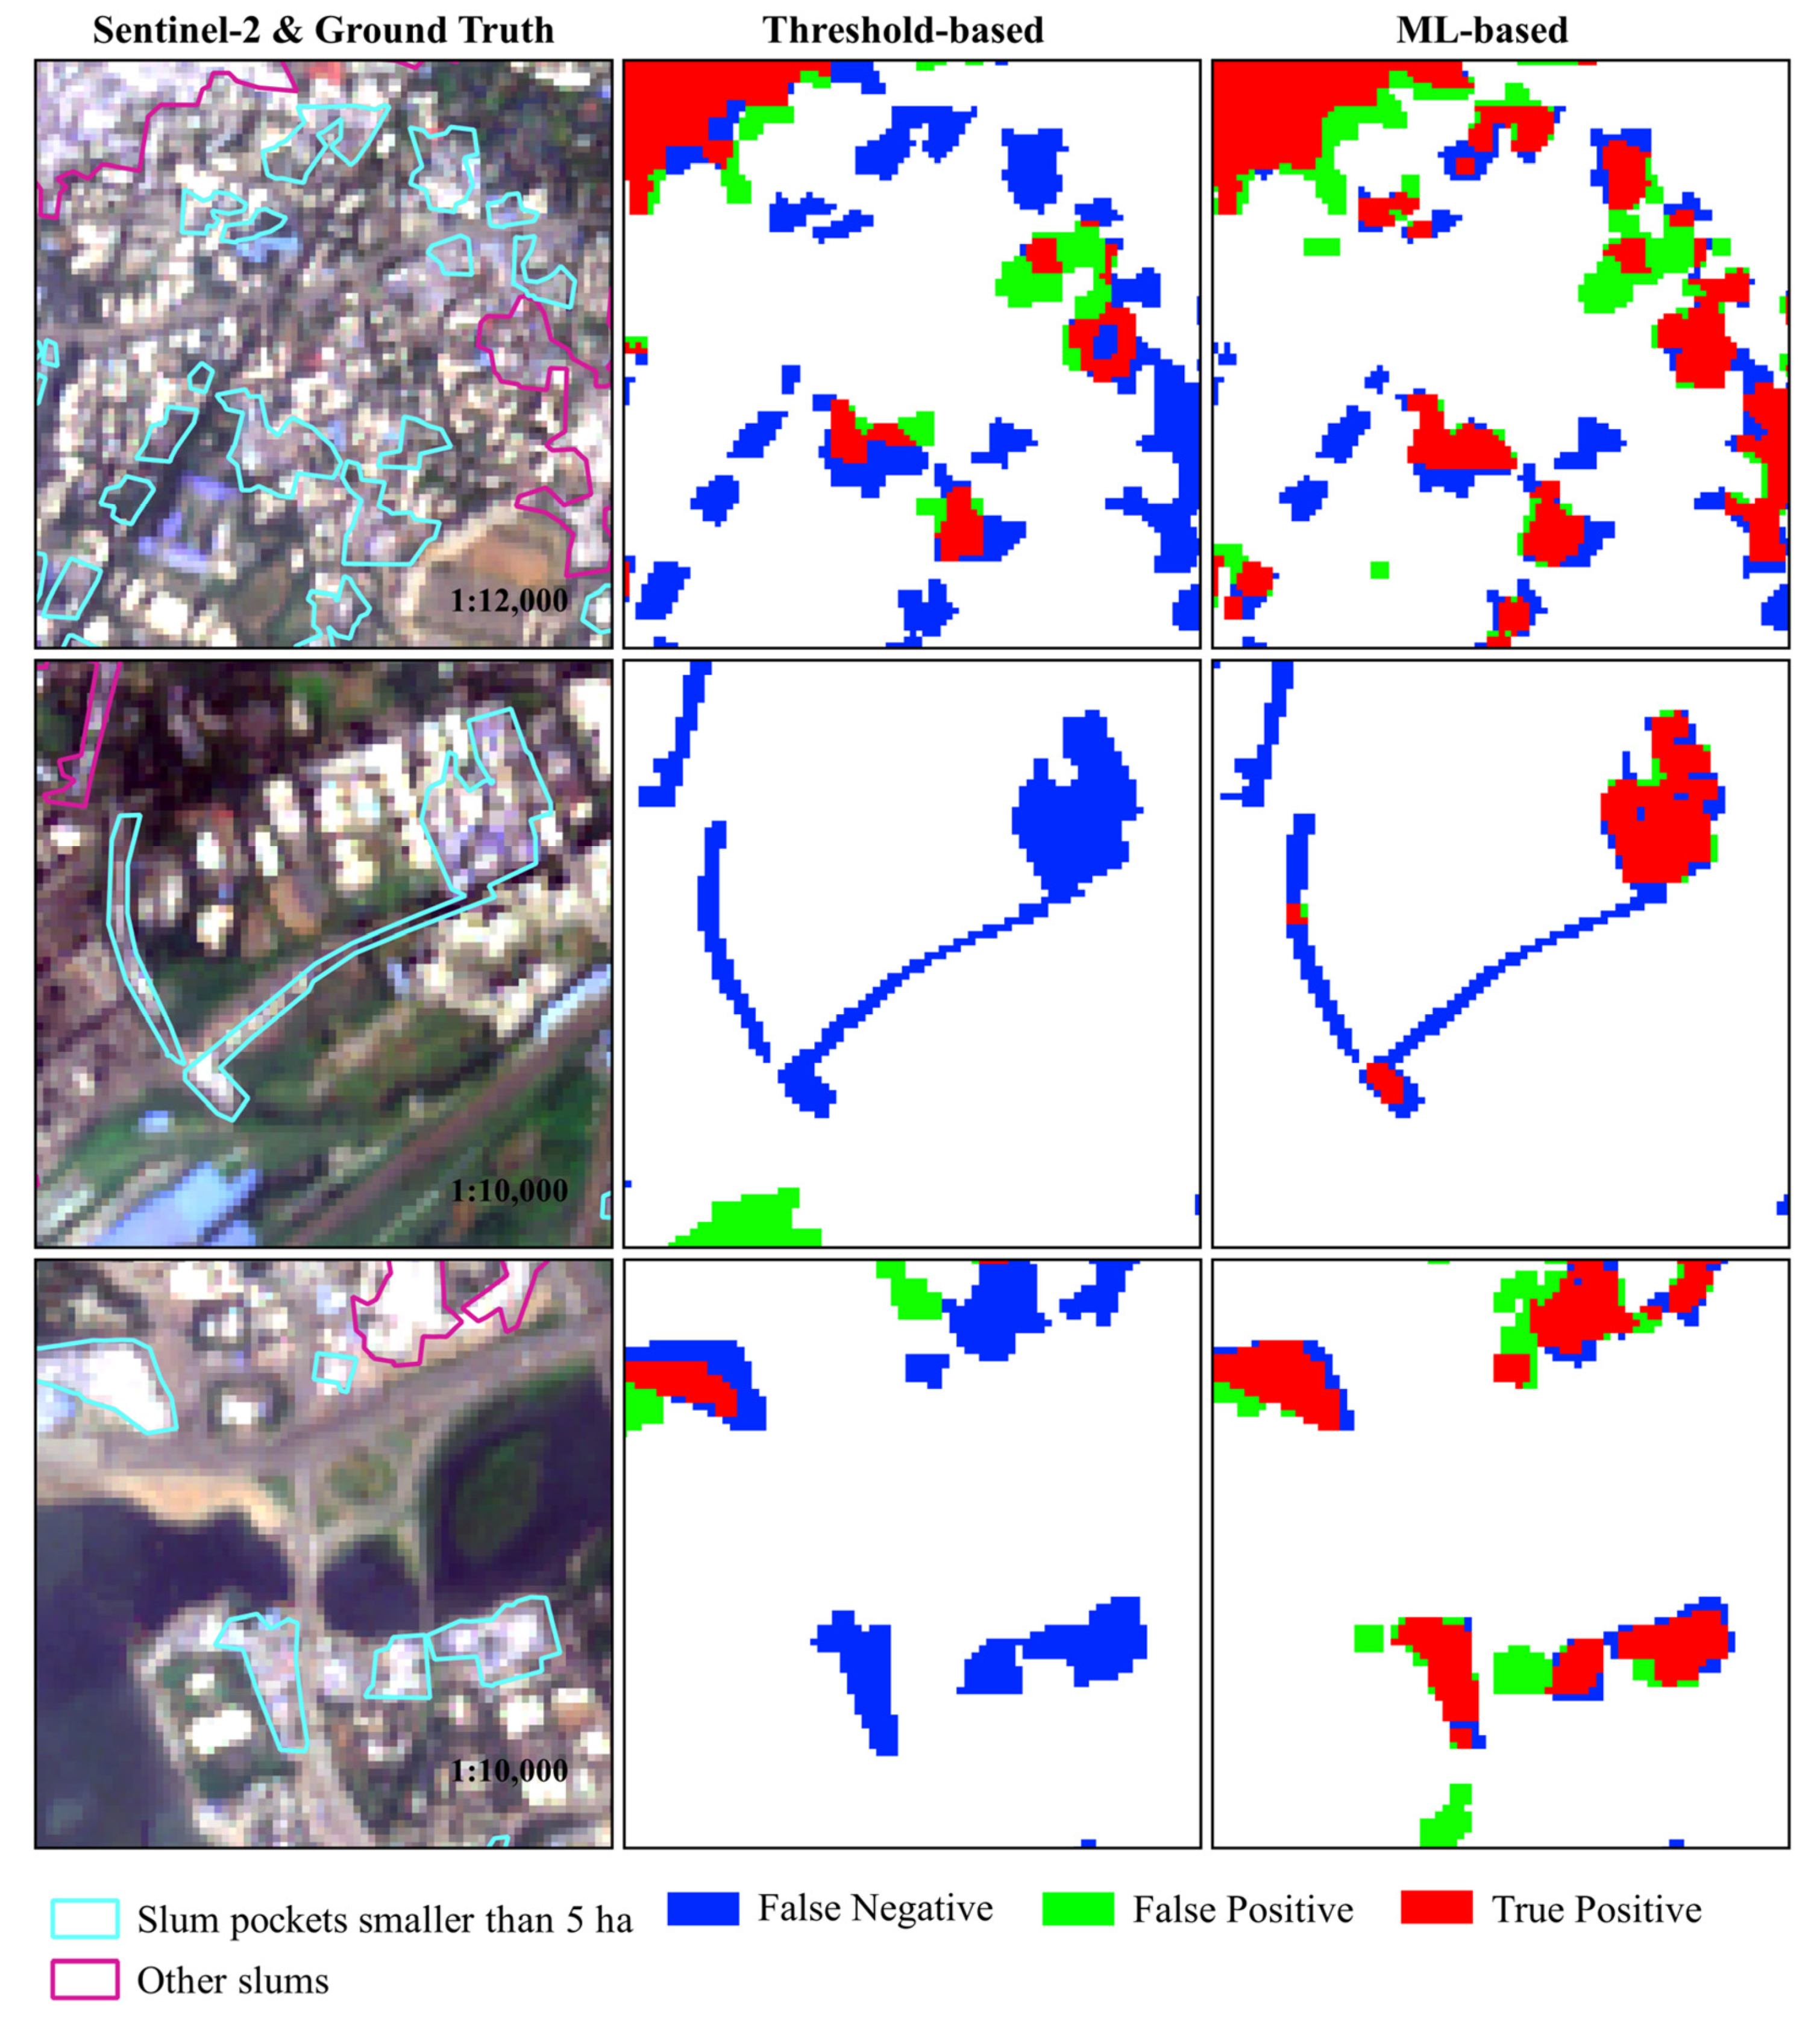
Figure 13.
Bee swarm chart of SHAP values.

Table 1.
Wavelength range of the Sentinel-2 imagery.
| Band Name | Wavelength (nm) | Spatial Resolution (m) |
|---|---|---|
| Aerosols | 442.3 | 60 |
| Blue | 492.1 | 10 |
| Green | 559 | 10 |
| Red | 665 | 10 |
| Red Edge1 | 703.8 | 20 |
| Red Edge2 | 739.1 | 20 |
| Red Edge3 | 779.7 | 20 |
| NIR | 833 | 10 |
| Red Edge4 | 864 | 20 |
| Water vapor | 943.2 | 60 |
| SWIR1 | 1610.4 | 20 |
| SWIR2 | 2185.7 | 20 |
Table 2.
Comparison of results in Mumbai among our methods and state-of-the-art studies. CNN = Convolutional Neural Network, TL = Transfer Learning, CCF = Canonical Correlation Forest.
Table 2.
Comparison of results in Mumbai among our methods and state-of-the-art studies. CNN = Convolutional Neural Network, TL = Transfer Learning, CCF = Canonical Correlation Forest.
| Imagery | Methods | IoU (%) | P (%) | R (%) |
|---|---|---|---|---|
| Sentinel-2 (10 m) | Ours (Threshold-based) | 43.89 | 63.86 | 58.38 |
| Ours (ML-based) | 54.45 | 61.56 | 82.50 | |
| CNN + TL (Verma’s [36]) | 43.20 | - | - | |
| CCF (Gram-Hansen’s [52]) | 40.30 | - | - | |
| Pleiades (0.5 m) | CNN (Verma’s [36]) | 58.30 | - | - |
Table 3.
Comparison of results in the subarea of Mumbai among our methods and state-of-the-art studies.. FCN = fully convolutional network; TL = transfer learning.
Table 3.
Comparison of results in the subarea of Mumbai among our methods and state-of-the-art studies.. FCN = fully convolutional network; TL = transfer learning.
| Imagery | Methods | IoU (%) | P (%) | R (%) |
|---|---|---|---|---|
| Sentinel-2 (10 m) | Ours (Threshold-based) | 46.90 | 70.05 | 58.66 |
| Ours (ML-based) | 60.51 | 71.18 | 80.13 | |
| FCN (Wurm’s [41]) | 35.51 | 78.82 | 38.21 | |
| FCN-TL (Wurm’s [41]) | 51.23 | 85.25 | 55.47 | |
| Quickbird (0.5 m) | FCN (Wurm’s [41]) | 77.02 | 88.39 | 85.07 |
Table 4.
Recall values of slums of different sizes in the subarea of Mumbai. FCN = Fully Convolutional Network, TL = Transfer Learning.
Table 4.
Recall values of slums of different sizes in the subarea of Mumbai. FCN = Fully Convolutional Network, TL = Transfer Learning.
| Imagery | Method | Small Slums (<5 ha) | Medium Slums (5~25 ha) | Large Slums (≥25 ha) |
|---|---|---|---|---|
| Sentinel-2 (10 m) | Ours (Threshold-based) | 39.67 | 63.97 | 77.21 |
| Ours (ML-based) | 62.53 | 84.83 | 90.45 | |
| FCN (Wurm’s [41]) | 9.32 | 28.19 | 47.18 | |
| FCN-TL (Wurm’s [41]) | 24.67 | 50.64 | 62.46 | |
| Quickbird (0.5 m) | FCN (Wurm’s [41]) | 78.57 | 83.63 | 88.39 |
Disclaimer/Publisher’s Note: The statements, opinions and data contained in all publications are solely those of the individual author(s) and contributor(s) and not of MDPI and/or the editor(s). MDPI and/or the editor(s) disclaim responsibility for any injury to people or property resulting from any ideas, methods, instructions or products referred to in the content. |
© 2023 by the authors. Licensee MDPI, Basel, Switzerland. This article is an open access article distributed under the terms and conditions of the Creative Commons Attribution (CC BY) license (https://creativecommons.org/licenses/by/4.0/).
Share and Cite
MDPI and ACS Style
Peng, F.; Lu, W.; Hu, Y.; Jiang, L. Mapping Slums in Mumbai, India, Using Sentinel-2 Imagery: Evaluating Composite Slum Spectral Indices (CSSIs). Remote Sens. 2023, 15, 4671. https://doi.org/10.3390/rs15194671
AMA Style
Peng F, Lu W, Hu Y, Jiang L. Mapping Slums in Mumbai, India, Using Sentinel-2 Imagery: Evaluating Composite Slum Spectral Indices (CSSIs). Remote Sensing. 2023; 15(19):4671. https://doi.org/10.3390/rs15194671
Chicago/Turabian StylePeng, Feifei, Wei Lu, Yunfeng Hu, and Liangcun Jiang. 2023. "Mapping Slums in Mumbai, India, Using Sentinel-2 Imagery: Evaluating Composite Slum Spectral Indices (CSSIs)" Remote Sensing 15, no. 19: 4671. https://doi.org/10.3390/rs15194671
Note that from the first issue of 2016, this journal uses article numbers instead of page numbers. See further details here.