

A Transformer-Based Framework for Parameter Learning of a Land Surface Hydrological Process Model

School of Computer Science and Engineering, Sun Yat-sen University, Guangzhou 510006, China
*
Author to whom correspondence should be addressed.
Remote Sens. 2023, 15(14), 3536; https://doi.org/10.3390/rs15143536
Submission received: 12 June 2023
/
Revised: 8 July 2023
/
Accepted: 11 July 2023
/
Published: 13 July 2023
(This article belongs to the Special Issue Artificial Intelligence Applications in Remotely Sensed Hydrologic and Water Systems)
Abstract
:The effective representation of land surface hydrological models strongly relies on spatially varying parameters that require calibration. Well-calibrated physical models can effectively propagate observed information to unobserved variables, but traditional calibration methods often result in nonunique solutions. In this paper, we propose a hydrological parameter calibration training framework consisting of a transformer-based parameter learning model (ParaFormer) and a surrogate model based on LSTM. On the one hand, ParaFormer utilizes self-attention mechanisms to learn a global mapping from observed data to the parameters to be calibrated, which captures spatial correlations. On the other hand, the surrogate model takes the calibrated parameters as inputs and simulates the observable variables, such as soil moisture, overcoming the challenges of directly combining complex hydrological models with a deep learning (DL) platform in a hybrid training scheme. Using the variable infiltration capacity model as the reference, we test the performance of ParaFormer on datasets of different resolutions. The results demonstrate that, in predicting soil moisture and transferring calibrated parameters in the task of evapotranspiration prediction, ParaFormer learns more effective and robust parameter mapping patterns compared to traditional and state-of-the-art DL-based parameter calibration methods.
1. Introduction
Parameter calibration is a necessary step in the simulation process of Earth scientific models, including non-dynamical system models, such as radiative transfer models [1], as well as dynamical system models, such as land surface hydrological models, that simulate soil moisture, evapotranspiration, runoff, and groundwater recharge [2,3]. A central issue with process-based geoscience models is that their behavior and performance are significantly influenced by unobservable and underdetermined parameters. The uncertainties of these parameters, such as the infiltration curve indices closely related to flow production in land surface hydrologic process-based models, severely impact the simulation results, such as simulated soil moisture.
In the last decades, parameter calibration techniques have been continuously developed and applied to hydrological process-based models (PBM) in the geosciences. Calibration algorithms aim to adjust the values of the unobserved parameters () at each location (grid point or site) so that the simulated results are as close as possible to the measured data [4]. A model contains a unique set of parameters for the parameterization of a particular process, which are difficult to measure directly. For instance, almost all rainfall-runoff processes involve unobservable parameters that need to be calibrated. There are two types of hydrological model parameter calibration methods: manual calibration (trial-and-error method) and automatic calibration, with the latter having become the mainstream approach in hydrological parameter optimization. Global parameter optimization methods represented by the evolutionary algorithm (EA) have been applied to hydrological parameter calibration [5,6,7], such as the shuffling complex evolutionary (SCE-UA) method [8,9]. SCE-UA integrates a genetic algorithm and the ideas of the downhill simplex algorithm for global optimization of model parameters, which has been used in traditional hydrological model parameter calibration.
However, complex physical distributed hydrological models often have a large number of tunable parameters. The traditional optimization algorithms usually require tens of thousands of physical model runs to find the global optimum solution [10]. Moreover, since the calibration parameters are very sensitive to changes in spatiotemporal scales, other model parameters, model structure, and input data, these optimization algorithms constantly require re-optimization of the parameters. As a result, the optimization requires a very large number of repeated physical model simulations. In recent years, researchers have proposed the use of mathematical models to replace the original physical models for automatic calibration, i.e., applying simplified mathematical models with similar functionalities to the original models, making the parameter calibration of the complex PBM highly efficient [11,12]. Currently, many surrogate models based on deep learning have been applied in the field of hydrology [11,13,14]. For example, long short-term memory (LSTM) neural networks have successfully predicted soil moisture [15,16], runoff [17,18,19], and evapotranspiration [20]. By leveraging the capabilities of deep learning models, the surrogate models that integrate hydrological calibration parameters provide an alternative approach to calibrating hydrological parameters. They are capable of learning complex relationships between inputs and outputs, capturing non-linear patterns, and handling high-dimensional parameter spaces.
In land surface hydrological processes, the parameters to be calibrated share commonalities in similar spatial areas [21,22]. However, traditional calibration procedures are usually applied separately to each site, which tends to produce different and spatially discontinuous parameters for adjacent and geographically similar areas [3]; in other words, they do not utilize the common knowledge learned at one location and share it with other locations. On the other hand, most studies assume that the parameters are independent of each other and ignore the correlations among them. As a result, it is difficult to find the optimal parameters as different parameter sets produce similar simulation results. A potential solution is to apply data-driven modeling methods to learn a complex mapping with global constraints that covers all locations, which may also capture the spatial correlation characteristics of the parameters. While deep learning has been used for traditional parameter calibration, its typical superficial role is that of an efficient agent model that emulates PBM to reduce the computation time during calibration. In this paradigm, parameter calibration is still treated independently for each site, transitioning from “EA + PBM” to “EA + DL-based surrogates”. Tsai [23] utilized feed-forward fully connected neural networks (FFN) and LSTM to replace the EA algorithm and then fed the resulting optimal calibration parameters into the surrogate model. However, the limitations of FFN and LSTM in capturing long-range dependencies in the data may restrict their ability to effectively model complex relationships and patterns in hydrological data.
The purpose of this paper is to design a deep learning model that can effectively calibrate hydrological parameters, replacing traditional optimization algorithms. However, deep learning allows us to predict variables with sufficient observed data for supervised learning. For unobserved variables, such as evaporation and groundwater recharge, we still rely on PBMs that have been calibrated. Since the calibrated hydrological parameters are unobservable targets, supervised learning cannot be carried out directly. Therefore, it is also necessary to design a solution to integrate a deep learning framework and hydrological model to achieve an end-to-end parameter calibration architecture.
In this work, we employ the variable infiltration capacity (VIC) model [24,25,26] as the PBM simulation model, which is a large-scale distributed land surface hydrological model. We built a transformer-based deep learning architecture (ParaFormer) to generate the hydrological parameters, which are fed into an LSTM-based surrogate model of a VIC model to output the observable target variables. The hybrid architecture uses the surrogate model to backpropagate information from observed to unobserved hydrological parameters. The weights of the surrogate model are frozen because they have been pretrained in advance and are not updated in ParaFormer training, but only pass the gradient information. To adapt to various situations, we designed ParaFormer and ParaFormer to generate the hydrological parameters, respectively. ParaFormer consists of an encoder for the transformer, which takes static attributes (), such as soil, vegetation, and topography, as input data and is suitable for locations with missing or incomplete spatio-temporally driven data. ParaFormer learns a global mapping from meteorological forcing (), target observations (), and static attributes data for parameters (), incorporating dynamic features of historical time-series data (response pairs ()) using a cross-attention mechanism.
ParaFormer extracts data features using a multi-head self-attention mechanism, defining loss functions over the entire training dataset to obtain a global constrained model, which differs from traditional algorithms where the parameters at each location are derived only from features at that location. We also incorporate empirical knowledge to the loss function by adding the range boundary loss of the generated parameters. In summary, the main contributions of this paper are listed as follows:
- This paper proposes an end-to-end, transformer-based deep learning architecture for hydrological model parameter calibration, named ParaFormer, for two different cases to efficiently generate optimal hydrological parameter combinations.
- We deploy an LSTM-based surrogate model that incorporates PBM parameters as training input to process the calibration parameters generated by ParaFormer. A transformer model with a multi-head self-attention mechanism is also deployed to learn the global spatiotemporal mapping of hydrological observation data to unobserved parameters.
- We conduct two experiments to evaluate our approach; the results demonstrate that the calibrated parameters by ParaFormer improve the performance of the hydrological models and reduce the uncertainty in land surface hydrological predictions compared to other methods.
2. Problem Statement
The primary objective of this paper is to utilize deep learning to generate parameter values in a hydrological model using observed data in order to achieve an approximate match between the simulated values of the model hydrological variables and the observed values of the real hydrological system. To accomplish this, we consider a hydrological region R with n measurement locations (e.g., grid points, stations, or basins), represented by the set . For each location , we use its input time feature series , which comprises meteorological forcing data at time t, such as precipitation and temperature. The input data also include k observable attributes , a vector specific to position i. Additionally, there are p unobserved parameters for which we need to estimate their optimal values. These parameters may be unobservable, too expensive, or difficult to observe with the desired accuracy, resolution, or coverage. The output is represented by the time series . At a forecast time T, the process-based hydrological model () at a particular location i can generally be described as
Suppose, given the observation , with , where H is the observation operator and the prediction error . Our task is to train a deep neural network model for the region R, implementing a mapping from historical forcing inputs , attributes and historical observations to a suitable set of parameters such that or its surrogate model() output the best fit with the observations for all stations in the region. Assuming that the training time is and the training sites are , our proposed model is represented as
where is the weight parameters of our transformer-based model, which will be obtained through deep learning training.
Therefore, the goal of our training optimization is
3. Method
3.1. Framework Description for Parameter Calibration
The general process of hydrological PBM parameter calibration is shown in Figure 1a. First, the preset parameters, the number of iterations, the convergence criteria, and the likelihood function of the evolutionary algorithm (EA) are established. Next, according to the characteristics of the study location and the measured data, the method of moments is used to estimate the PBM parameters during the calibrated period. The calibrated parameters are fed into the PBM for forecasting and then the loss is calculated by likelihood function to adjust the generated parameters by EA. These steps are repeated iteratively until the convergence criteria of the optimization algorithm are met or the maximum number of iterations is reached as preset.
We replace traditional optimization algorithms with transformer-based deep learning for hydrological PBM parameter calibration, as shown in Figure 1b. In this work, we employ the VIC land surface hydrological model as the simulation model. Due to the complexity of the VIC hydrological model, it is difficult to implement on a deep learning platform for training. Here, we pretrained one LSTM-based model to reproduce the behavior of VIC as closely as possible while also allowing for gradient tracking. Similar to the VIC simulation, the input of this surrogate model also includes the calibration parameters. During the training process of updating weights by backpropagation of ParaFormer, the weights of LSTM are frozen while only the gradient is propagated without updating its weights. As for the testing stage, the optimal parameters that are generated by ParaFormer will be fed to the VIC model to realize an approximate match between the hydrological variables simulation and their observation.
3.2. ParaFormer Network
As shown in Figure 2, we designed a transformer-based neural network for calibrating the parameters of land surface hydrological models. We present two ParaFormer models that can adapt to different input data: Paraformar and Paraformar. At the core of ParaFormer lies a transformer encoder, which is described in the original transformer work by Vaswani et al. [27]. However, we did not use the decoder part of the architecture, using multi-layer perceptual networks instead. ParaFormer receives the static attribute data () of the location as its input. By contrast, the input of ParaFormer includes temporal data: meteorological forcing data and observed values (ground-truth) of the hydrological prediction variables, which make up the encoder part of the forcing-response pair (X, Z) that is fed into the transformer. The input for the decoder part of Paraformar is the same as for ParaFormer with observable attributes alone.
ParaFormer is well-suited for locations where dynamic observation data is either missing or incomplete, allowing us to train a mapping from raw data to the parameter () at selected locations. where may include, but is not limited to, attributes in the used in PBM (or VIC). ParaFormer is designed for locations with available observational data, enabling us to add the observed values of certain hydrological variables as an extra input.
ParaFormer Model. As shown in Figure 2a, ParaFormer has essentially the same encoder structure as transformer, consisting of a stack of N identical layers. Each layer includes two main components: the multi-head self-attention layer and the feed-forward network, both of which adopt residual connection and normalization. ParaFormer takes the data as input and passes it through the embedding layer to obtain , as shown in Equation (4), . The multi-head self-attention sub-layer transforms the input into m distinct query, key, and value matrices through linear projection, as shown in Equation (5), where and are learnable parameters, and is a non-zero natural number. Each head then performs a sequence of score computations called scaled dot-product attention, resulting in a set of scores ; the output of the m-th head is shown in Equation (6).
The output of the multi-head attention layer is the linear projection of the concatenation of the m metric , as shown in Equation (7), where . The feed-forward layer consists of two linear projections with a ReLU activation function. i.e., , where and are learnable weights and , are biases. The entire architecture employs layer normalization technology, which is a key part of ParaFormer stable training and faster convergence. Therefore, our task representation for the calibration of the hydrological parameters is as follows:
ParaFormer Model. The architecture of the ParaFormer is designed to capture the characteristics of dynamic time-series observation data, which goes beyond the capabilities of ParaFormer. The advantage of ParaFormer is that the incorporation of dynamic features may improve the generalization of the generated parameters for calibration and reduce their uncertainty. As shown in Figure 2b, ParaFormer receives the time-series input and processes it through the embedding layer to produce , as shown in Equation (9); is the sequential position encoding that is implemented by sine and cosine functions of the different frequencies [27]. The encoder stage of ParaFormer involves extracting features from the input time-series data (X, Z), which outputs the key () and value () matrices. These matrices, and , are then combined with the query matrix , which is produced by multi-head self-attention like ParaFormer, using multi-head cross-attention for feature fusion, as shown in Equation (11).
where .
Therefore, our task representation for the calibration of the hydrological parameters by is as follows:
4. Experiments
4.1. Data Description
SMAP data (https://nsidc.org/data/spl3smp_e/versions/5, accessed on 11 July 2023). The target soil moisture observations for VIC are obtained from the SMAP-enhanced level-3 (L3) 9 km resolution surface soil moisture product generated by the Soil Moisture Active-Passive (SMAP) remote sensing satellite from NASA. Since 2015, the SMAP Level 3 data have provided irregular and discontinuous time-series data at 2–3 day intervals, which require filling in missing data. To accomplish this, we employ a deep-learning scheme of data assimilation based on LSTM networks [16,28], which can fill the time gaps between SMAP observations and provide seamless time-series data. For the internal difference between the VIC simulated soil moisture and SMAP, we use the data assimilation method to scale the VIC simulated soil moisture through a linear function for comparison with SMAP [23,29].
NLDAS data (https://disc.gsfc.nasa.gov/datasets/NLDAS_FORA0125_H_002/summary, accessed on 11 July 2023). This data includes the main meteorological forcing data of the North American Land Data Assimilation System (NLDAS-2).
MODIS data (https://ladsweb.modaps.eosdis.nasa.gov/missions-and-measurements/products/MOD16A2, accessed on 11 July 2023). The data are an 8-day synthetic evapotranspiration product based on the Penman–Monteith equation at 500 m resolution. We did not use the ET from the MODIS data as a target to train our model. Since they are completely independent of the SMAP observations, these data are only used here to validate whether our method for parameter calibration can better describe the dynamics of the land surface hydrological model, i.e., the generalization of calibrated hydrological parameters in ET prediction tasks.
4.2. Experimental Setup
We applied the ParaFormer network to the widely used VIC land surface hydrological model. Firstly, ParaFormer generates parameters that allow VIC to best fit the surface soil moisture (SM) observations from SMAP. VIC is usually used to simulate evapotranspiration (ET) and SM, and its inputs from NLDAS data include daily meteorological forecasts, non-meteorological data, and the parameters to be determined. The meteorological forcing data include the time-series of precipitation, air temperature, wind speed, atmospheric pressure, vapor pressure, and long-wave and short-wave radiation. We compared the performance of different models using training data at two sampling densities from the SMAP and NLDAS data for selected regions: density sampling (sampling one gridcell from each block) and density sampling, which we call DAS-S4 and DAS-S8. After data processing, we obtained 4783 grid points for DAS-S4 and 1206 grid points for DAS-S8. Secondly, we sampled neighboring grid points outside of DAS-S8 to obtain the new dataset called DAS-S8NG, which we used to test the performance of the model trained on DAS-S8 at untrained locations. Finally, we also evaluated the uncalibrated variable ET from MODIS data with the aim of assessing the performance of the VIC parameters generated by the model in the SM task when applied to the ET simulation.
Baseline Approaches. We compared the performance of ParaFormer with the SCE-UA algorithm [8,9], FFN and LSTM models [23]. The SCE-UA is the mainstream method for optimization of the land surface hydrological parameters [8,30], which has been widely applied in the VIC model. To compare the performance of various deep learning models for the parameter calibration task of the VIC model, we evaluated a fully connected feed-forward neural network, denoted as FFN, that generates the calibrated parameter by taking A as inputs (). We also compared this approach to an LSTM-based model called , which accepts time-series data as input and can be written as the mapping ().
Implementation Details. We performed the experiments on a server with PyTorch 1.2 on Tesla V100 16 GB GPU under a Linux environment. The deep learning models were optimized using the AdaDelta optimizer, with a scaling coefficient of 0.5 applied to delta; a coefficient of 0.95 was used to compute a running average of squared gradients, with a weight decay of 0.00001. The maximum number of epochs was set to 3000.
For all models, we used two years of data (1 April 2015 to 31 March 2017) as the training set, and one year of data (1 April 2017 to 31 March 2018) as the test set. We trained models on the sub-datasets DAS-S4 and DAS-S8 separately, and tuned the hidden size and batch size, respectively. For the FFN and LSTM models, we used a hidden size of 1280 for training on DAS-S4, and 256 for DAS-S8. We set the batch size to 300, and, in the LSTM model, the length of the training instance was 240 days. The program randomly selects gridcells and time periods from the training dataset with a duration of 240 days to create a mini-batch for training. The initial learning rate was set to 0.001 and the dropout was set to 0.5. We found that all the parameters used in the above model were superior choices compared to other parameter settings. We normalized the inputs and outputs through their Conterminous United States (CONUS)-wide standard deviation.
For ParaFormer, the final hidden size was 128, the number of multi-head attention was 4, and the number of encoders . As for the model ParaFormer, the training instances had a time-series length of 240 days, a hidden size of 256, 8 multi-head attention, and . The training batch sizes for training the ParaFormer model on DAS-S4 and DAS-S8 were 3600 and 2000, respectively.
Loss Function for Training. An objective function is required for training the network. In this study, the overall architecture (Figure 1b) is used to perform regression tasks targeting SM and ET, typically using root mean square error (RMSE) to calculate the loss between the predicted and ground-truth. However, our task for hydrological parameter calibration is to generate the optimal hydrological model parameters at the i-th site, which are unobservable (lacking true values). To further constrain the generated parameters within an appropriate range, we incorporate expert knowledge and the range of parameter values obtained from calibration experience to calculate the range boundary loss (RBL), as shown in Equation (13). Our loss function is jointly determined by RBL and RMSE to constrain the calibrated parameters within the specified range during training. The loss function is as follows:
where and are the upper and lower range boundary matrices of the p parameters to be calibrated, respectively, as shown in Table 1. is the linear rectification function, and is the Boolean function whose value is in . The constant factors are set as here, and is a constant term to the denominator (). Specifically, when the calibration parameters are all within the range boundary, .
Evaluation Metrics. To test the performance of various algorithms, we used the root mean squared error (RMSE), the Pearson correlation coefficient (PCC), and the Nash–Sutcliffe model efficiency coefficient (NSE) as evaluation metrics [15,23]. Three criteria were calculated as follows:
where is the observed variables of the i-th time steps, is the predicted variables of the i-th time steps obtained by the models, is the average observed value of all pixels, and n is the sample size. The range of RMSE is (the smaller the better), and assesses if a model captures the seasonality of the observation as well; the higher the absolute value of PCC, the better the performance. considers the bias and 1 indicates a perfect score but can be negative for no skill models.
5. Results
5.1. Optimization Performance
We compared our model with traditional and deep-learning-based (DL-based) parameter calibration methods, including SCE-UA, FFN, and LSTM. For a calibration study of SM prediction using SMAP as the training target, our results (Table 2, Figure 3 and Figure 4) show that ParaFormer provides better performance metrics than the evolutionary algorithm SCE-UA across the entire CONUS. Table 2 shows the results of the RMSE, PCC and NSE evaluations of the five parameter calibration methods on different datasets, which are averaged over four replicate experiments (random seeds).
First, ParaFormer outperforms other comparison models on almost all performance metrics. For ParaFormer, in both DAS-S4 and DAS-S8, its RMSE values of 0.035 and 0.043, respectively, are smaller than LSTM’s 0.044 and 0.046, despite LSTM incorporating the (X, Z) response input while ParaFormer does not. In DAS-S8, ParaFormer achieves higher PCC and NSE scores of 0.648 and 0.216, respectively, compared to LSTM’s values of 0.600 and 0.161. When compared to FFN, ParaFormer exhibits better performance, even though they receive the same input. Thus, the transformer-based model may serve better as the transfer function from input A to .
Second, DL-based models incorporating the (X, Z) response pair as input, such as ParaFormer (or LSTM), outperform ParaFormer (or FFN) that solely relies on input A. This indicates that incorporating dynamic temporal features can enhance overall calibration performance. Although the NSE metric for LSTM is slightly lower than FFN in the DAS-S8 dataset, LSTM achieves an NSE of 0.211 in DAS-S4, whereas FFN achieves an NSE of 0.192. This difference may be attributed to the fact that DAS-S4 contains approximately four times the number of grid cells compared to DAS-S8, suggesting that the smaller dataset may have affected the performance of LSTM.
Third, for the DAS-S8NG dataset, ParaFormer achieves an NSE value of 0.276, outperforming the other three comparison models with NSE values of 0.158, −0.014, and −1.665, respectively, and ParaFormer performs better than FFN and SCE-UA. In other words, when the VIC hydrological model parameters calibrated in DAS-S8 are applied to their neighboring uncalibrated grid cells, ParaFormer demonstrates better SM prediction performance. Therefore, the transformer-based model incorporating the (X, Z) response pair as input exhibits better spatial generalization in parameter calibration, indicating that ParaFormer has learned a more robust parameter mapping.
According to Table 2, ParaFormer achieves better performance metrics results in DAS-S4, with RMSE, PCC, and NSE values of 0.033, 0.668, and 0.263, respectively, while the corresponding values for DAS-S8 are 0.038, 0.653, and 0.258. This indicates that a larger training dataset improves the parameter calibration performance of ParaFormer, as shown in Figure 3a–e. In the DAS-S8NG dataset, DL-based models show significantly higher NSE scores compared to SCE-UA (Figure 3c), and ParaFormer outperforms LSTM in predicting SM. It is noteworthy that the NSE distribution curves for ParaFormer and FFN show that, within the NSE < 0 range, FFN performs better than ParaFormer. However, within the NSE > 0 range, ParaFormer performs better and even approaches LSTM. This may result from potential overfitting during the transformer training, resulting in poorer generalization performance within the NSE < 0 range (more challenging to predict grid cells).
Figure 4a,e,f,j show scatterplots of SM predictions on the DAS-S8 and DAS-S8NG datasets, respectively, with SMAP as the observed truth, where each point represents the average value over a year. SM, also referred to as soil water content, is generally a non-negative quantity. We can see that SCE-UA and FFN have 4 and 1 SM prediction values less than 0, respectively. The SM predictions of LSTM and ParaFormer seem to be roughly comparable, but those of ParaFormer are slightly better. SCE-UA demonstrates notably poor performance (site-by-site calibration), while ParaFormer performs the best. Although ParaFormer performs worse overall than LSTM, all its prediction values lie in the positive range and are better than those of FFN.
5.2. Spatial Patterns of Calibrated Parameters
Figure 5 illustrates the spatial distribution of the VIC parameters from the DAS-S8 dataset, with NLDAS-2 parameters often used as the benchmark for evaluation due to their extensive usage in previous studies. We calibrated a total of five VIC parameters simultaneously, as shown in Table 1. We present the spatial distribution of parameter from each calibrated parameter method. The parameter controls the shape of the variable infiltration curve in the VIC model, effectively indicating the partitioning of rainfall into infiltration and surface runoff, and has a significant influence on SM variations. A smaller results in an increase in the infiltration capacity; humid regions typically have a higher , while arid regions have a lower .
Compared with SCE-UA (Figure 5b), DL-based parameter calibration methods (Figure 5c,d) provide better spatial generalization, showing continuity and stronger constraints in the calibrated parameters. For instance, in the vicinity of Michigan, similar terrain, climate, and soil characteristics suggest that the parameters will not vary significantly, and both LSTM and ParaFormer show good spatial consistency. However, on the one hand, across the entire CONUS, the parameters range calibrated by LSTM is approximately [0, 0.105], while those calibrated by NLDAS-2 and SCE-UA are [0, 0.3] and [0, 0.41], respectively. The parameters range of ParaFormer is [0, 0.35], which is evidently closer to the reference range than LSTM. On the other hand, precipitation decreases from east to west until it reaches the Rocky Mountains. The high humidity in the Midwest Plains, Great Lakes region, and the central and northern parts of the United States results in a higher value of parameter , while the dry climate and higher temperature in the southern and southwestern regions of the United States lead to a lower value of parameter . The parameters calibrated by ParaFormer better conform to these climatic characteristics. Finally, in comparison with the regions where the parameter values are higher and lower in NLDAS-2, the ParaFormer calibrated parameters are more consistent, such as in the vicinity of the Great Lakes region in the United States, where ParaFormer may performs better than LSTM.
To facilitate further comparison, in contrast to the distribution shown in Figure 5, Figure 6 employs a unified colorbar to represent the parameter distributions generated by different methods. Here, we present the parameter distributions calibrated by SCE-UA and ParaFormer. Remarkably, the ranges of parameters outputted by these two methods are highly similar, indicating that our deep transformer-based spatial calibration approach may possess the strengths of the traditional point-wise calibration method, SCE-UA. Moreover, ParaFormer, incorporating self-attention learning on spatiotemporal data, exhibits the capability of parameter regionalization, manifested by the smooth distribution of the calibrated parameters (Figure 6b). Furthermore, Figure 7 illustrates the residual distributions of LSTM and ParaFormer with respect to the parameter distribution of NLDAS-2 (Figure 5a), focusing solely on the sites with residuals greater than or equal to zero. Notably, particular attention should be given to the distinct color-emphasized regions in Figure 5a, which correspond to the solid red circles in Figure 7b. It is evident that LSTM and ParaFormer demonstrate consistent learned parameter spatial patterns (positive or negative) in these relevant regions. This observation implies that, compared to NLDAS-2, ParaFormer achieves similar spatial patterns in calibrated parameter distributions within specific regions.
Undoubtedly, comparing only the distribution of the calibrated parameters is insufficient, as the parameters are uncertain and unobservable. In contrast, SCE-UA exhibits discontinuous parameters, indicating the influence of randomness and parameter non-uniqueness, which explains its poorer performance in spatial generalization testing. Nonetheless, the parameters discovered by ParaFormer seem to align better with the known physical relationships.
We evaluated SM predictions for three randomly selected sites, as indicated in Figure 8a (or Figure 8b), which are located in different climatic conditions. Figure 8c–e present the calibrated SM predictions of SCE-UA, LSTM, and ParaFormer compared to SMAP observations over a one-year testing period. Furthermore, for each site, we compared the calibrated predictions during a period of heavy rainfall to assess the models’ performance in intense precipitation events. The results demonstrate that ParaFormer exhibits superior overall performance in calibrated SM prediction compared to SCE-UA and LSTM, with smaller prediction errors during rainfall events.
5.3. Uncalibrated Variables
We further evaluated the performance of different parameter calibration methods by applying the parameters obtained from the SM calibration to the uncalibrated variable, ET. It can be argued that if the calibrated parameters can improve the behavior of both the calibrated and uncalibrated variables prediction, they can better describe the underlying physical processes. Table 3 presents the evaluation results for predicting ET on DAS-S4 and DAS-S8, where VIC is simulated using the NLDAS-2 parameters. The NSE scores of SCE-UA are lower than those of VIC, indicating that the parameters produced by calibrating the SM with the SCE-UA method failed to improve the simulation of ET. The reason is that SCE-UA does not place the grid points being calibrated in the context of regional patterns, and may be able to pursue the optimum for that site at the expense of physical properties. ParaFormer (or LSTM) performs better than ParaFormer (or FFN), which suggests that incorporating the (X, Z) responses pair as inputs to the DL-based models can generate calibration parameters that better align with the underlying physical processes. For ParaFormer, its inputs are (X, Z) and A, which are spatially consistent (autocorrelated), and, leveraging the self-attention mechanism, the trained model implicitly captures the mapping of parameter regionalization. As a result, the generated parameter set is also spatially consistent. Figure 9 shows a scatterplot of the predicted ET on DAS-S8, which also demonstrates that ParaFormer performs best compared to the comparison model.
6. Discussion
This study presents a transformer-based framework for hydrological parameter calibration, consisting of two components: land surface variable prediction, such as SM, and parameter generation.
Currently, DL-based surrogate models provide a universal, adaptive, and efficient solution for a wide range of models in Earth science and other fields. Their greatest advantage lies in their differentiability, similar to process-based physical models, which enables seamless integration with other tasks for iterative optimization. In traditional parameter calibration methods, for complex models like VIC, the cost of repetitive runs for parameter calibration is prohibitive. Surrogate models can serve as a bridge between these models and deep learning. However, several challenges need to be addressed. Firstly, the performance of surrogate models significantly affects the effectiveness of parameter calibration. A well-performing surrogate model is the first step in the calibration process, requiring iterative training and evaluation. Secondly, surrogate models need to be customized for different tasks. In the case of hydrological parameter calibration in this study, a trained surrogate model with VIC parameter inputs cannot be directly applied to other hydrological models. Lastly, the target variables that surrogate models can predict are also a consideration. This study focuses on single-objective parameter calibration, but for multi-objective calibration, such as simultaneously calibrating SM and ET, the surrogate model needs to predict both variables.
The transformer-based parameter calibration model aims to find the optimal combination of hydrological parameters. For spatiotemporal hydrological data, we compare FFN and LSTM models, as few deep learning models have been applied to parameter calibration in this direction. The transformer model, based on the multi-head self-attention mechanism, acquires mapping for ParaFormer by learning self-attention among the static attributes of each site. It also fuses dynamic and static data for each site by learning temporal multi-head self-attention from historical observations, resulting in cross self-attention and a robust parameter mapping for ParaFormer. Compared to the existing FFN and LSTM models, the transformer model’s parallel data processing offers higher computational efficiency, and the interpretability improvement from the self-attention mechanism is noteworthy.
In summary, applying deep learning techniques to land surface hydrological parameter calibration offers significant advantages. With the increasing availability of remote sensing satellite data, combined with the current trend in large-scale model research, it is possible to extend deep-learning-based parameter calibration to general Earth models for predicting a wide range of land surface variables.
7. Conclusions
In this paper, we propose the ParaFormer for land surface hydrological parameter calibration. To achieve a more efficient transformer-based parameter calibration approach, we construct a training framework that propagates gradients through a surrogate model, avoiding direct supervised training of unobservable calibration parameters and the need for embedding complex land surface hydrological models in the training process. To further overcome the uncertainties in parameter calibration, we introduce transformer-based deep learning models for parameter calibration, leveraging their self-attention mechanism. We design two models, ParaFormer and ParaFormer, suitable for different data scenarios. To the best of our knowledge, we are the first to introduce transformer-based deep learning models into the field of parameter calibration. We conducted extensive experiments to validate the effectiveness of the proposed ParaFormer. The results demonstrate its superiority over traditional and state-of-the-art DL-based parameter calibration methods in predicting soil moisture.
Author Contributions
Conceptualization, K.L.; funding acquisition, Y.L.; methodology, K.L.; supervision, Y.L.; writing—original draft, K.L.; writing—review and editing, K.L. All authors have read and agreed to the published version of the manuscript.
Funding
This research was funded by the Natural Science Foundation of China under Grant No. U1811464, No. U1811463.
Data Availability Statement
SMAP L3 data can be downloaded at https://doi.org/10.5067/T90W6VRLCBHI, accessed on 11 July 2023. NLDAS-2 forcing data can be downloaded at https://doi.org/10.5067/6J5LHHOHZHN4, accessed on 11 July 2023.
Acknowledgments
The authors would like to express gratitude for the open-source implementations of the Hydro-DL (https://github.com/mhpi/hydroDL, accessed on 11 July 2023). We also thank the professors who provided important guidance.
Conflicts of Interest
The authors declare no conflict of interest.
References
- Karthikeyan, L.; Pan, M.; Wanders, N.; Kumar, D.N.; Wood, E.F. Four decades of microwave satellite soil moisture observations: Part 2. Product validation and inter-satellite comparisons. Adv. Water Resour. 2017, 109, 236–252. [Google Scholar] [CrossRef]
- Ajami, N.K.; Gupta, H.; Wagener, T.; Sorooshian, S. Calibration of a semi-distributed hydrologic model for streamflow estimation along a river system. J. Hydrol. 2004, 298, 112–135. [Google Scholar] [CrossRef] [Green Version]
- Yang, Y.; Pan, M.; Beck, H.E.; Fisher, C.K.; Beighley, R.E.; Kao, S.C.; Hong, Y.; Wood, E.F. In quest of calibration density and consistency in hydrologic modeling: Distributed parameter calibration against streamflow characteristics. Water Resour. Res. 2019, 55, 7784–7803. [Google Scholar] [CrossRef] [Green Version]
- Gupta, H.V.; Bastidas, L.; Sorooshian, S.; Shuttleworth, W.J.; Yang, Z. Parameter estimation of a land surface scheme using multicriteria methods. J. Geophys. Res. Atmos. 1999, 104, 19491–19503. [Google Scholar] [CrossRef] [Green Version]
- Price, K.; Storn, R.M.; Lampinen, J.A. Differential Evolution: A Practical Approach to Global Optimization; Springer Science & Business Media: Berlin/Heidelberg, Germany, 2006. [Google Scholar]
- Wu, S.J.; Lien, H.C.; Chang, C.H. Calibration of a conceptual rainfall–runoff model using a genetic algorithm integrated with runoff estimation sensitivity to parameters. J. Hydroinform. 2012, 14, 497–511. [Google Scholar] [CrossRef]
- Maier, H.R.; Kapelan, Z.; Kasprzyk, J.; Kollat, J.; Matott, L.S.; Cunha, M.C.; Dandy, G.C.; Gibbs, M.S.; Keedwell, E.; Marchi, A.; et al. Evolutionary algorithms and other metaheuristics in water resources: Current status, research challenges and future directions. Environ. Model. Softw. 2014, 62, 271–299. [Google Scholar] [CrossRef] [Green Version]
- Duan, Q.; Sorooshian, S.; Gupta, V. Effective and efficient global optimization for conceptual rainfall-runoff models. Water Resour. Res. 1992, 28, 1015–1031. [Google Scholar] [CrossRef]
- Li, D.; Zhang, S.; Duan, Y.; Cui, J. Calibration of parameters in soil moisture equation with shuffled complex evolution algorithm. Chin. J. Atmos. Sci. 2013, 37, 971–982. (In Chinese) [Google Scholar]
- Duan, Q.; Di, Z.; Quan, J.; Wang, C.; Gong, W.; Gan, Y.; Ye, A.; Miao, C.; Miao, S.; Liang, X.; et al. Automatic model calibration: A new way to improve numerical weather forecasting. Bull. Am. Meteorol. Soc. 2017, 98, 959–970. [Google Scholar]
- Gu, H.; Xu, Y.P.; Ma, D.; Xie, J.; Liu, L.; Bai, Z. A surrogate model for the Variable Infiltration Capacity model using deep learning artificial neural network. J. Hydrol. 2020, 588, 125019. [Google Scholar] [CrossRef]
- Wang, C.; Duan, Q.; Gong, W.; Ye, A.; Di, Z.; Miao, C. An evaluation of adaptive surrogate modeling based optimization with two benchmark problems. Environ. Model. Softw. 2014, 60, 167–179. [Google Scholar] [CrossRef] [Green Version]
- Wang, Y.; Lu, W.; Bian, J.; An, Y. Surrogate model of numerical simulation model of groundwater based on wavelet neural network. China Environ. Sci. 2015, 35, 139–146. [Google Scholar]
- Kim, T.; Yang, T.; Gao, S.; Zhang, L.; Ding, Z.; Wen, X.; Gourley, J.J.; Hong, Y. Can artificial intelligence and data-driven machine learning models match or even replace process-driven hydrologic models for streamflow simulation?: A case study of four watersheds with different hydro-climatic regions across the CONUS. J. Hydrol. 2021, 598, 126423. [Google Scholar] [CrossRef]
- Li, Q.; Zhu, Y.; Shangguan, W.; Wang, X.; Li, L.; Yu, F. An attention-aware LSTM model for soil moisture and soil temperature prediction. Geoderma 2022, 409, 115651. [Google Scholar] [CrossRef]
- Fang, K.; Shen, C. Near-Real-Time Forecast of Satellite-Based Soil Moisture Using Long Short-Term Memory with an Adaptive Data Integration Kernel. J. Hydrol. 2020, 21, 399–413. [Google Scholar] [CrossRef]
- Fang, K.; Pan, M.; Shen, C. The value of SMAP for long-term soil moisture estimation with the help of deep learning. IEEE Trans. Geosci. Remote Sens. 2018, 57, 2221–2233. [Google Scholar] [CrossRef]
- Kratzert, F.; Klotz, D.; Herrnegger, M.; Sampson, A.K.; Hochreiter, S.; Nearing, G.S. Toward Improved Predictions in Ungauged Basins: Exploiting the Power of Machine Learning. Water Resour. Res. 2019, 55, 11344–11354. [Google Scholar] [CrossRef] [Green Version]
- Feng, D.; Fang, K.; Shen, C. Enhancing streamflow forecast and extracting insights using long-short term memory networks with data integration at continental scales. Water Resour. Res. 2020, 56, e2019WR026793. [Google Scholar] [CrossRef]
- Physics-Constrained Machine Learning of Evapotranspiration. Geophys. Res. Lett. 2019, 46, 14496–14507. [CrossRef]
- Pokhrel, P.; Gupta, H.V.; Wagener, T. A spatial regularization approach to parameter estimation for a distributed watershed model. Water Resour. Res. 2008, 44, 292–307. [Google Scholar] [CrossRef]
- Mizukami, N.; Clark, M.P.; Newman, A.J.; Wood, A.W.; Gutmann, E.D.; Nijssen, B.; Rakovec, O.; Samaniego, L. Towards seamless large-domain parameter estimation for hydrologic models. Water Resour. Res. 2017, 53, 8020–8040. [Google Scholar] [CrossRef]
- Tsai, W.P.; Feng, D.; Pan, M.; Beck, H.; Lawson, K.; Yang, Y.; Liu, J.; Shen, C. From calibration to parameter learning: Harnessing the scaling effects of big data in geoscientific modeling. Nat. Commun. 2021, 12, 5988. [Google Scholar] [CrossRef] [PubMed]
- Liang, X.; Lettenmaier, D.P.; Wood, E.F.; Burges, S.J. A simple hydrologically based model of land surface water and energy fluxes for general circulation models. J. Geophys. Res. Atmos. 1994, 99, 14415–14428. [Google Scholar] [CrossRef]
- Liang, X.; Wood, E.F.; Lettenmaier, D.P. Surface soil moisture parameterization of the VIC-2L model: Evaluation and modification. Glob. Planet. Chang. 1996, 13, 195–206. [Google Scholar] [CrossRef]
- Hamman, J.J.; Nijssen, B.; Bohn, T.J.; Gergel, D.R.; Mao, Y. The Variable Infiltration Capacity model version 5 (VIC-5): Infrastructure improvements for new applications and reproducibility. Geosci. Model Dev. 2018, 11, 3481–3496. [Google Scholar] [CrossRef] [Green Version]
- Vaswani, A.; Shazeer, N.; Parmar, N.; Uszkoreit, J.; Jones, L.; Gomez, A.N.; Kaiser, Ł.; Polosukhin, I. Attention is all you need. Adv. Neural Inf. Process. Syst. 2017, 30, 6000–6010. [Google Scholar]
- Fang, K.; Shen, C.; Kifer, D.; Yang, X. Prolongation of SMAP to spatiotemporally seamless coverage of continental US using a deep learning neural network. Geophys. Res. Lett. 2017, 44, 11030–11039. [Google Scholar] [CrossRef] [Green Version]
- Reichle, R.H.; Koster, R.D.; Dong, J.; Berg, A.A. Global Soil Moisture from Satellite Observations, Land Surface Models, and Ground Data: Implications for Data Assimilation. J. Hydrometeorol. 2004, 5, 430–442. [Google Scholar] [CrossRef]
- Naeini, M.R.; Analui, B.; Gupta, H.V.; Duan, Q.; Sorooshian, S. Three decades of the Shuffled Complex Evolution (SCE-UA) optimization algorithm: Review and applications. Sci. Iran. 2019, 26, 2015–2031. [Google Scholar]
Figure 1.
Overview of the framework for parameter calibration. (a) are traditional evolutionary methods, and (b) is the architecture of transformer-based parameter learning for parameter calibration.
Figure 1.
Overview of the framework for parameter calibration. (a) are traditional evolutionary methods, and (b) is the architecture of transformer-based parameter learning for parameter calibration.

Figure 2.
The architecture of ParaFormer. (a) ParaFormer, (b) ParaFormer.

Figure 3.
The NSE and PCC cumulative density functions (CDF) of five models for SM prediction on three datasets. CDF describes the distribution of NSE or PCC for all the grid cells in one dataset; the performance of the CDF curve below is better than that above it in one metric. (a) DAS-S4 NSE, (b) DAS-S8 NSE, (c) DAS-S8NG NSE, (d) DAS-S4 PCC, (e) DAS-S8 PCC, (f) DAS-S8NG PCC.

Figure 4.
Scatter distribution for SM prediction on DAS-S8 (a–e) and DAS-S8NG (f–j). The abscissa is the predicted value output under the calibrated parameters, and SMAP is the observed value of SM.
Figure 4.
Scatter distribution for SM prediction on DAS-S8 (a–e) and DAS-S8NG (f–j). The abscissa is the predicted value output under the calibrated parameters, and SMAP is the observed value of SM.

Figure 5.
Distribution of the calibrated parameter . It is noteworthy that the parameters inferred by ParaFormer have continuous and spatially consistent patterns, especially compared to the discontinuous and random occurrence of parameters inferred by SCE-UA with site-by-site calibration. Both were trained on the DAS-S8 dataset. (a) NLDAS-2, (b) SCE-UA, (c) LSTM, (d) ParaFormer.
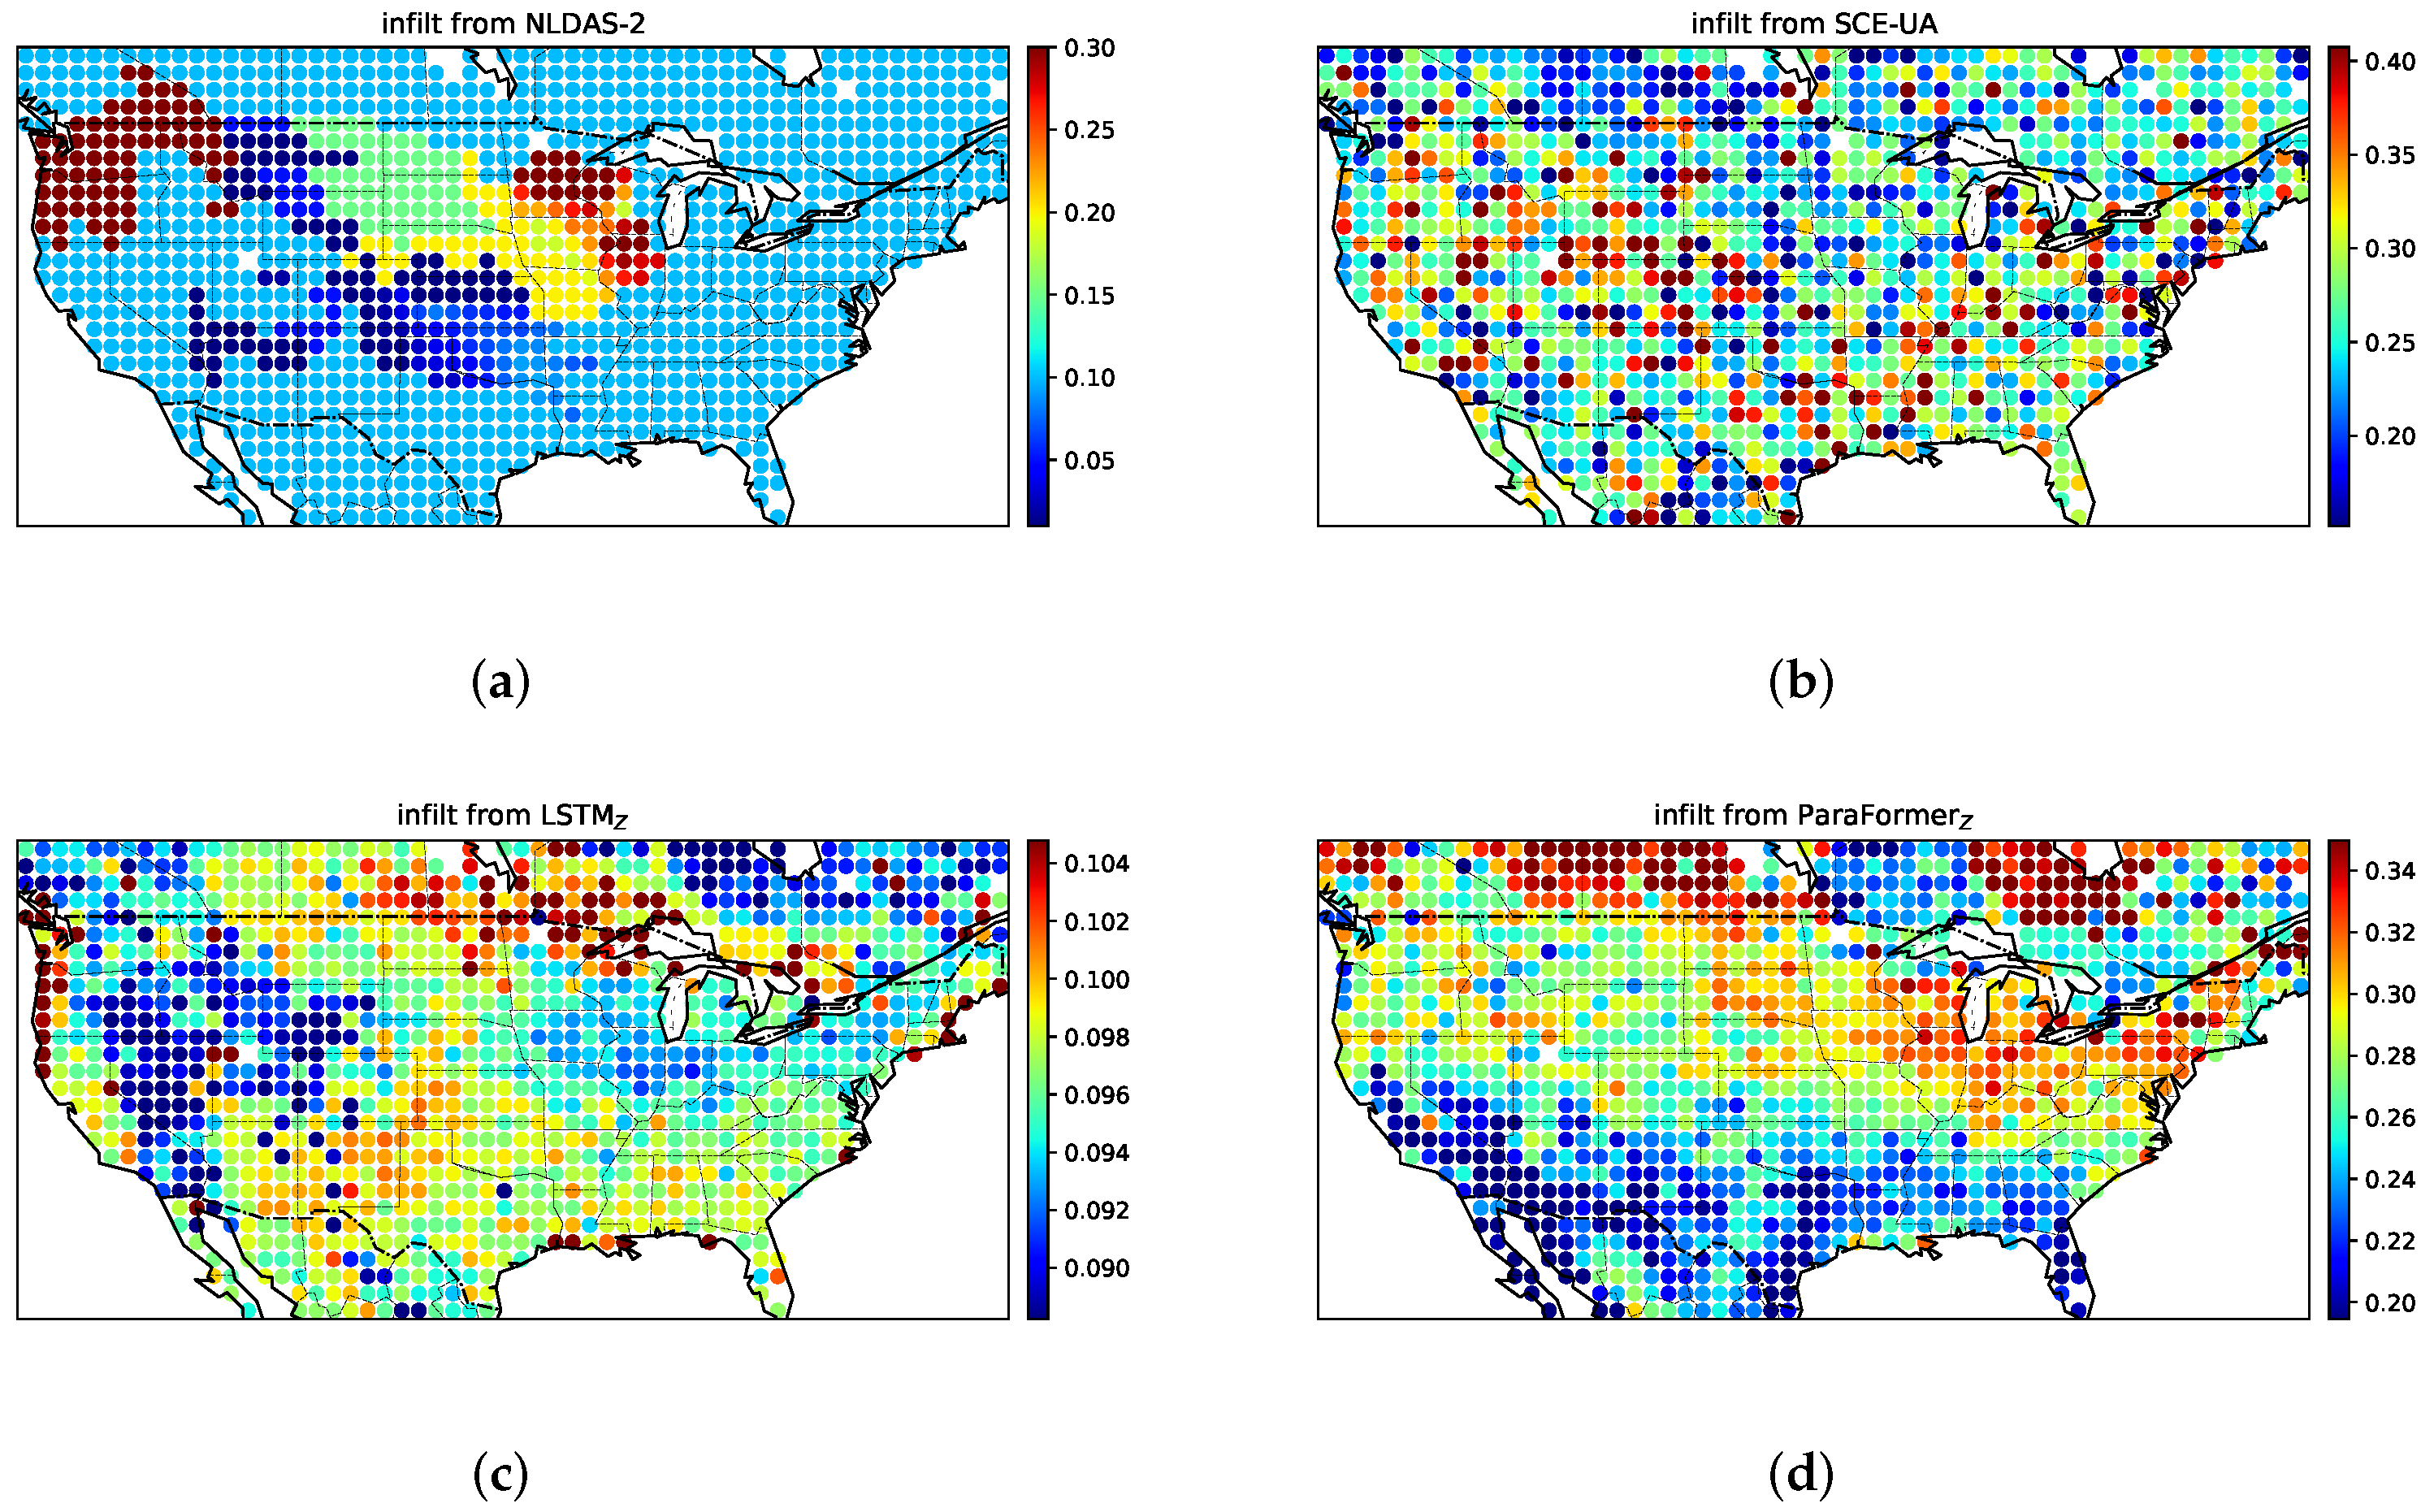
Figure 6.
Comparison of calibration parameters generated by SCE-UA and ParaFormer using the same colorbar. (a) SCE-UA, (b) ParaFormer.
Figure 6.
Comparison of calibration parameters generated by SCE-UA and ParaFormer using the same colorbar. (a) SCE-UA, (b) ParaFormer.

Figure 7.
The residual distributions of parameter (only showing sites greater than or equal to 0). (a) LSTM - NLDAS, (b) ParaFormer - NLDAS.
Figure 7.
The residual distributions of parameter (only showing sites greater than or equal to 0). (a) LSTM - NLDAS, (b) ParaFormer - NLDAS.
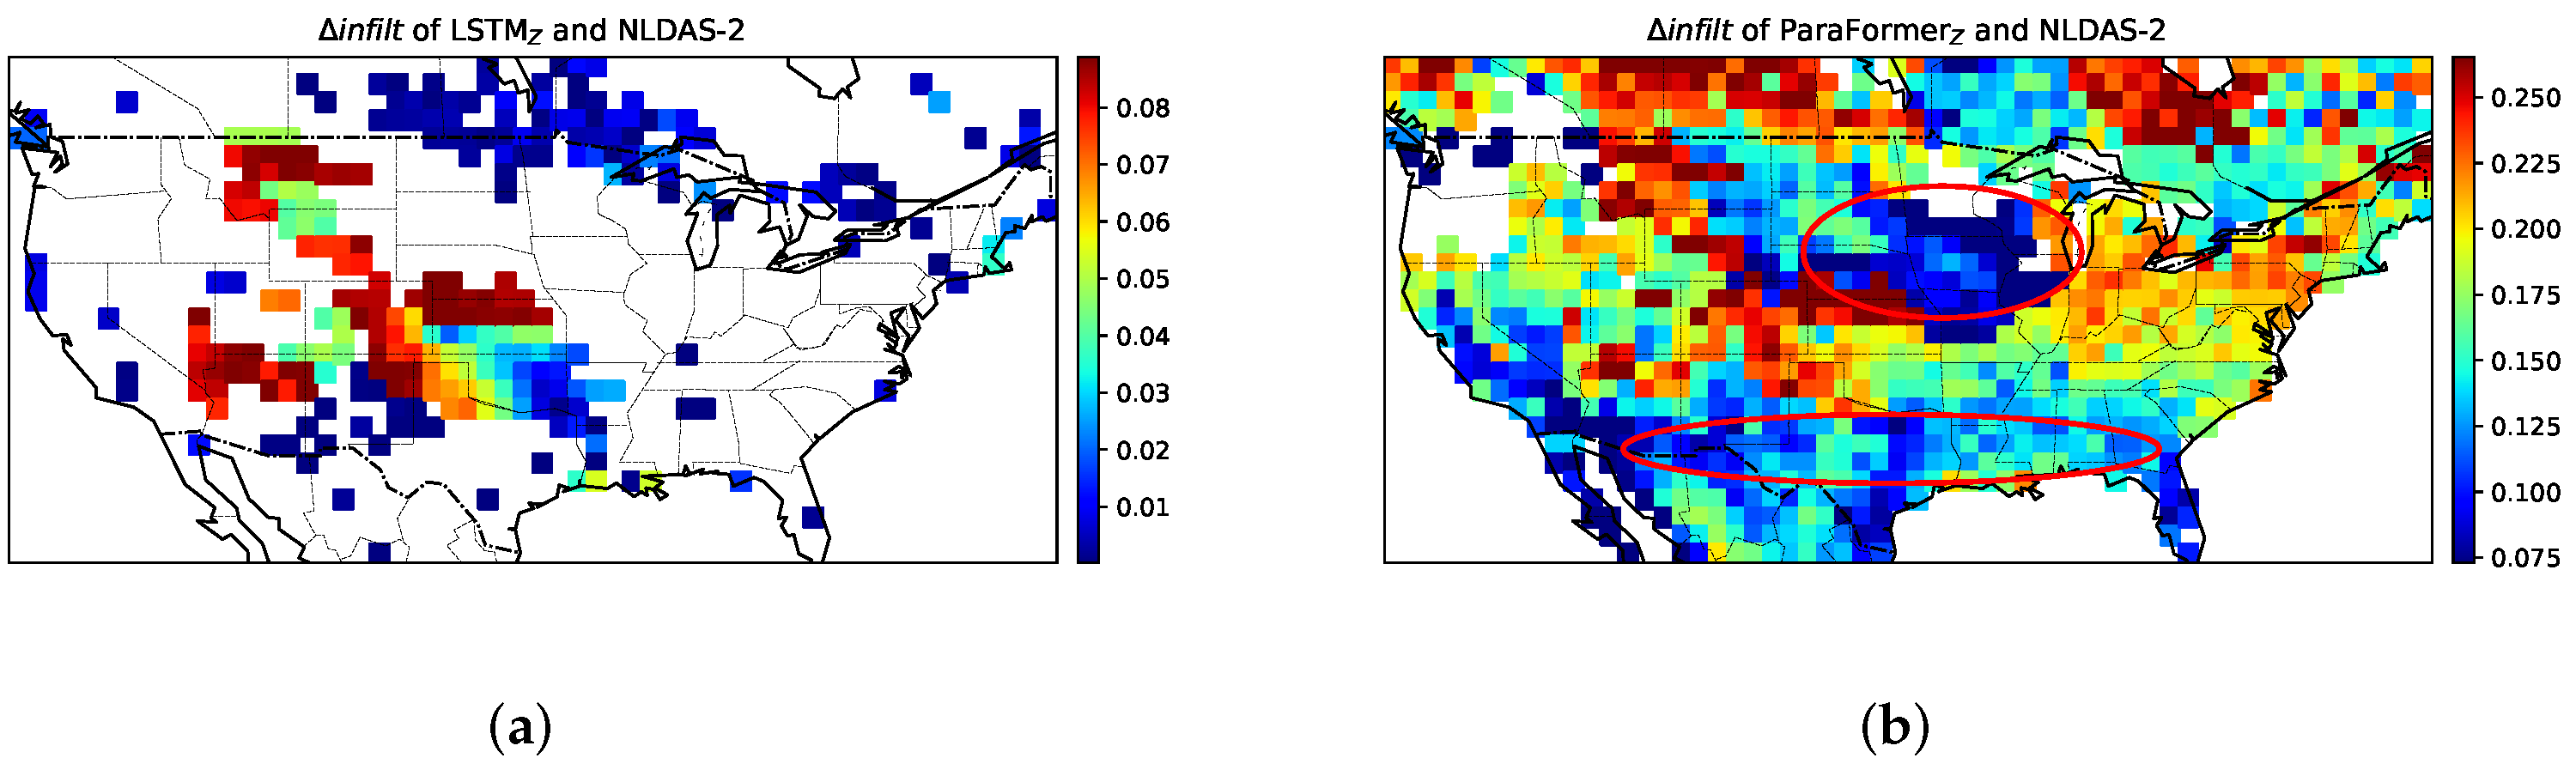
Figure 8.
Comparison of soil moisture prediction from three randomly selected sites during the period from 1 April 2017 to 31 March 2018 on the DAS-S8 dataset. (a,b) are the mean precipitation and mean air temperature, respectively, and the red triangle marks indicate the locations of the three sites. (c) Site 47, lat 37.9375, lon −121.9375, (d) Site 810, lat 34.9375, lon −90.9375, (e) Site 1010, lat 50.9375, lon −80.9375.


Figure 9.
Uncalibrated variable (ET) metrics from models trained on the DAS-S8 dataset. Scatterplots of temporal-mean ET (mm/year) comparing the MODIS product with ET produced by (a) VIC(NLDAS-2), (b) SCE-UA, (c) FFN, (d) LSTM, (e) ParaFormer, and (f) ParaFormer. Green color indicates higher density of points.


Table 1.
VIC parameters to be calibrated in this paper.
| Parameters | Details | Range |
|---|---|---|
| ds | Fraction of maximum base flow velocity where non-linear base flow begins. | [0, 7.6] |
| dsmax | Maximum base flow velocity. | [0, 10.8] |
| expt1 | variation of saturated hydraulic conductivity with soil moisture. | [0, 4.6] |
| infilt | The variable infiltration curve index. | [0, 1] |
| ws | fraction of maximum soil moisture content above which non-linear baseflow occurs. | [0, 1] |
Table 2.
Results of soil moisture (SM) prediction under calibrated parameters of five models on three datasets. The DAS-S8NG is only used for testing, with input from the parameters generated by the model trained on DAS-S8.
Table 2.
Results of soil moisture (SM) prediction under calibrated parameters of five models on three datasets. The DAS-S8NG is only used for testing, with input from the parameters generated by the model trained on DAS-S8.
| DAS-S4 | DAS-S8 | DAS-S8NG | |||||||
|---|---|---|---|---|---|---|---|---|---|
| RMSE | PCC | NSE | RMSE | PCC | NSE | RMSE | PCC | NSE | |
| SCE-UA | 0.048 | 0.523 | 0.150 | 0.047 | 0.559 | 0.104 | 0.089 | 0.589 | −1.665 |
| FFN | 0.046 | 0.574 | 0.192 | 0.046 | 0.591 | 0.172 | 0.055 | 0.591 | −0.014 |
| LSTM | 0.044 | 0.618 | 0.211 | 0.046 | 0.600 | 0.169 | 0.049 | 0.600 | 0.158 |
| ParaFomer | 0.035 | 0.616 | 0.203 | 0.043 | 0.648 | 0.216 | 0.055 | 0.640 | −0.003 |
| ParaFormer | 0.033 | 0.668 | 0.263 | 0.038 | 0.653 | 0.258 | 0.048 | 0.649 | 0.276 |
Table 3.
Results of ET prediction under calibrated parameters from SM calibration.
| DAS-S4 | DAS-S8 | |||||
|---|---|---|---|---|---|---|
| RMSE | PCC | NSE | RMSE | PCC | NSE | |
| VIC | 169.665 | 0.621 | 0.395 | 152.989 | 0.741 | 0.440 |
| SCE-UA | 167.263 | 0.695 | 0.371 | 164.055 | 0.687 | 0.360 |
| FFN | 161.859 | 0.641 | 0.336 | 146.572 | 0.732 | 0.501 |
| LSTM | 151.178 | 0.721 | 0.486 | 138.997 | 0.754 | 0.551 |
| ParaFomer | 152.536 | 0.682 | 0.391 | 140.965 | 0.734 | 0.548 |
| ParaFormer | 147.589 | 0.797 | 0.510 | 127.020 | 0.793 | 0.615 |
Disclaimer/Publisher’s Note: The statements, opinions and data contained in all publications are solely those of the individual author(s) and contributor(s) and not of MDPI and/or the editor(s). MDPI and/or the editor(s) disclaim responsibility for any injury to people or property resulting from any ideas, methods, instructions or products referred to in the content. |
© 2023 by the authors. Licensee MDPI, Basel, Switzerland. This article is an open access article distributed under the terms and conditions of the Creative Commons Attribution (CC BY) license (https://creativecommons.org/licenses/by/4.0/).
Share and Cite
MDPI and ACS Style
Li, K.; Lu, Y. A Transformer-Based Framework for Parameter Learning of a Land Surface Hydrological Process Model. Remote Sens. 2023, 15, 3536. https://doi.org/10.3390/rs15143536
AMA Style
Li K, Lu Y. A Transformer-Based Framework for Parameter Learning of a Land Surface Hydrological Process Model. Remote Sensing. 2023; 15(14):3536. https://doi.org/10.3390/rs15143536
Chicago/Turabian StyleLi, Klin, and Yutong Lu. 2023. "A Transformer-Based Framework for Parameter Learning of a Land Surface Hydrological Process Model" Remote Sensing 15, no. 14: 3536. https://doi.org/10.3390/rs15143536
Note that from the first issue of 2016, this journal uses article numbers instead of page numbers. See further details here.